Battery Surface and Edge Defect Inspection Based on Sub-Regional Gaussian and Moving Average Filter


Abstract
:1. Introduction
2. System Composition
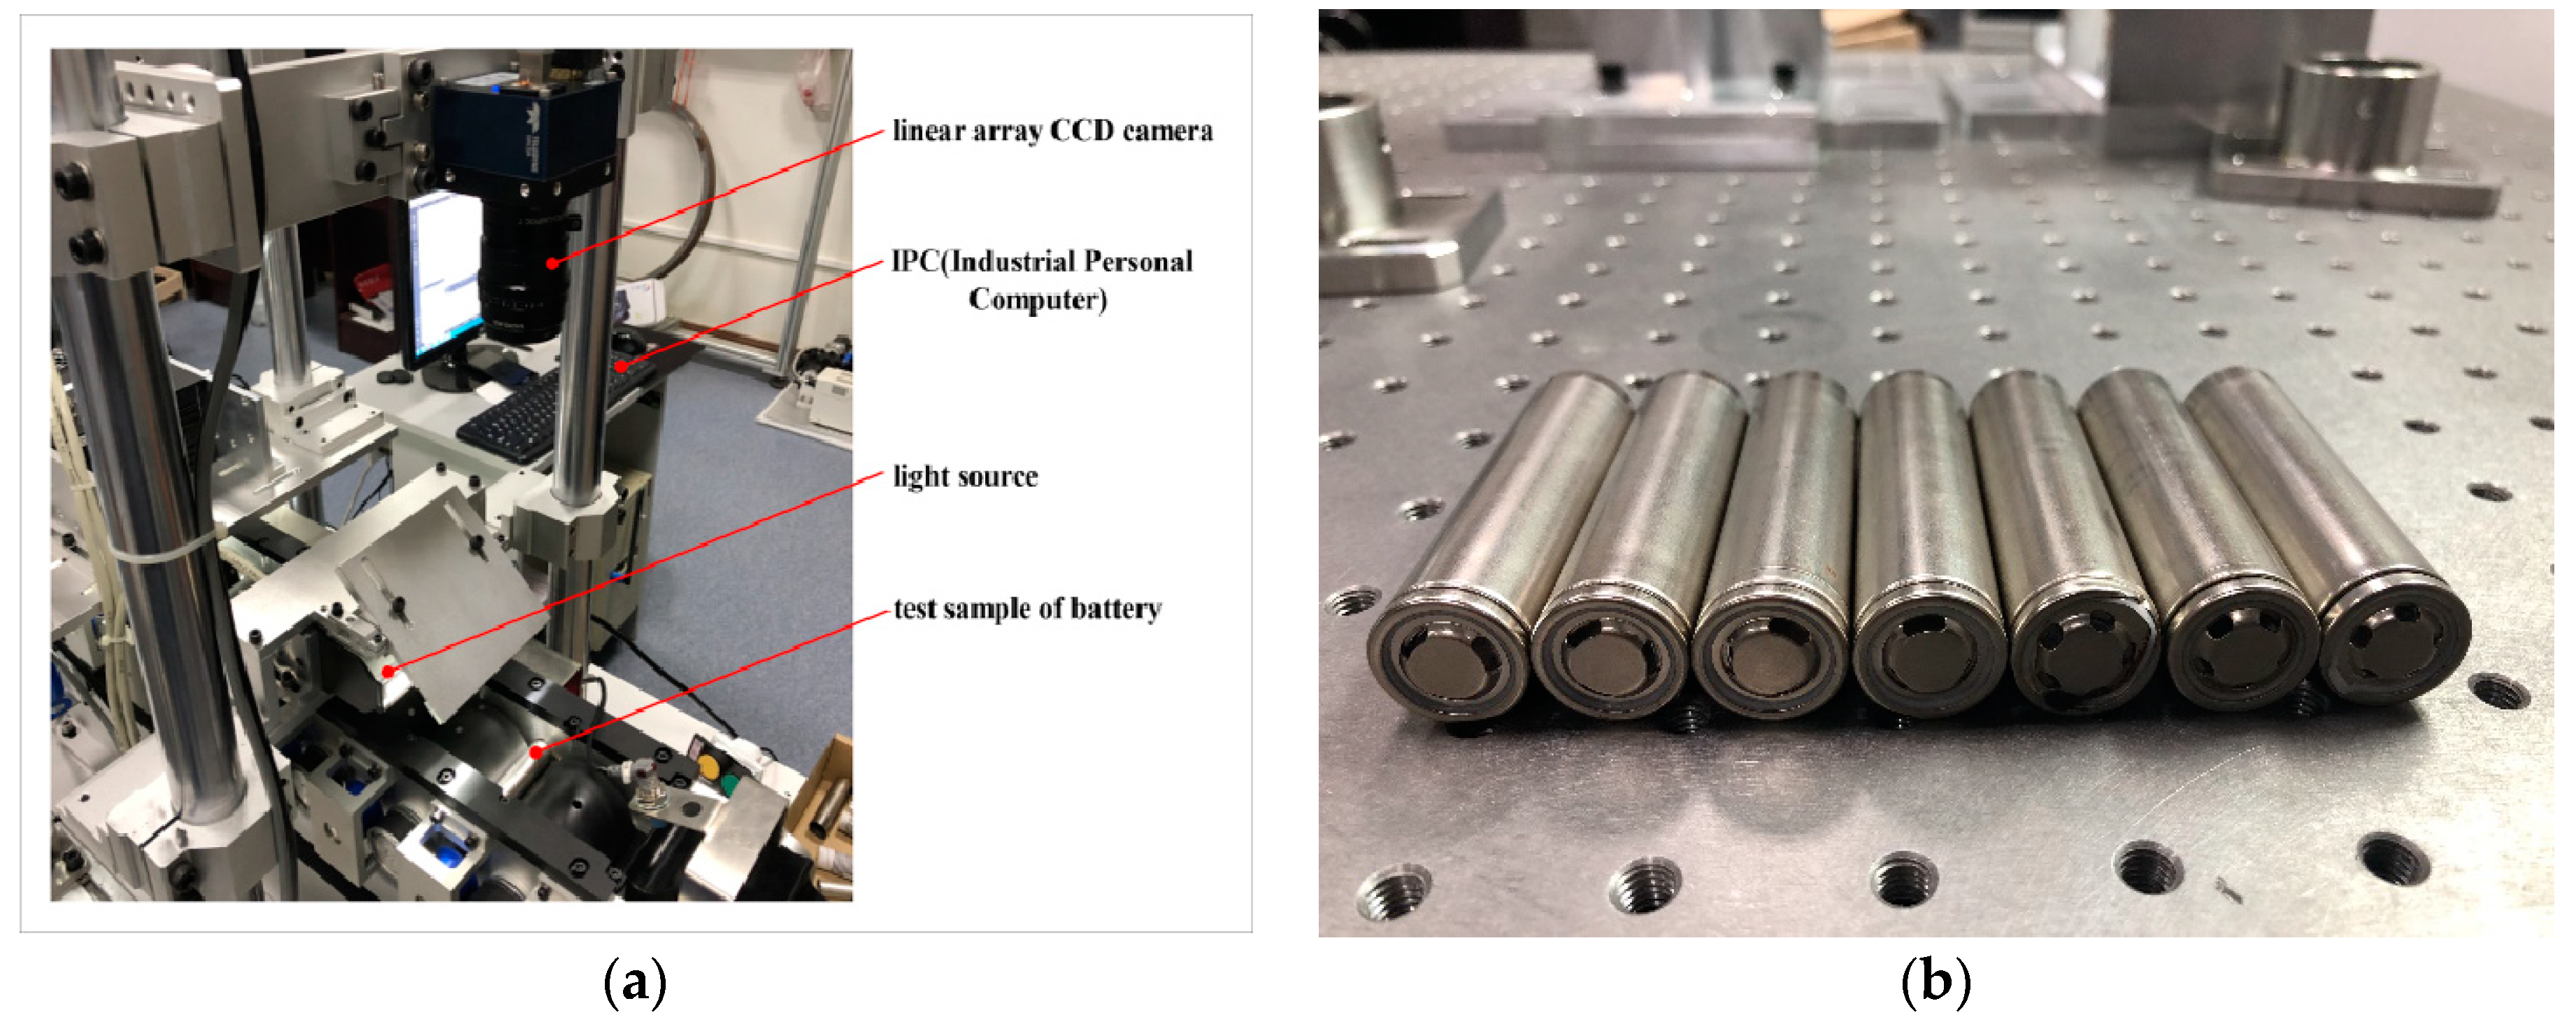
2.1. System Structure
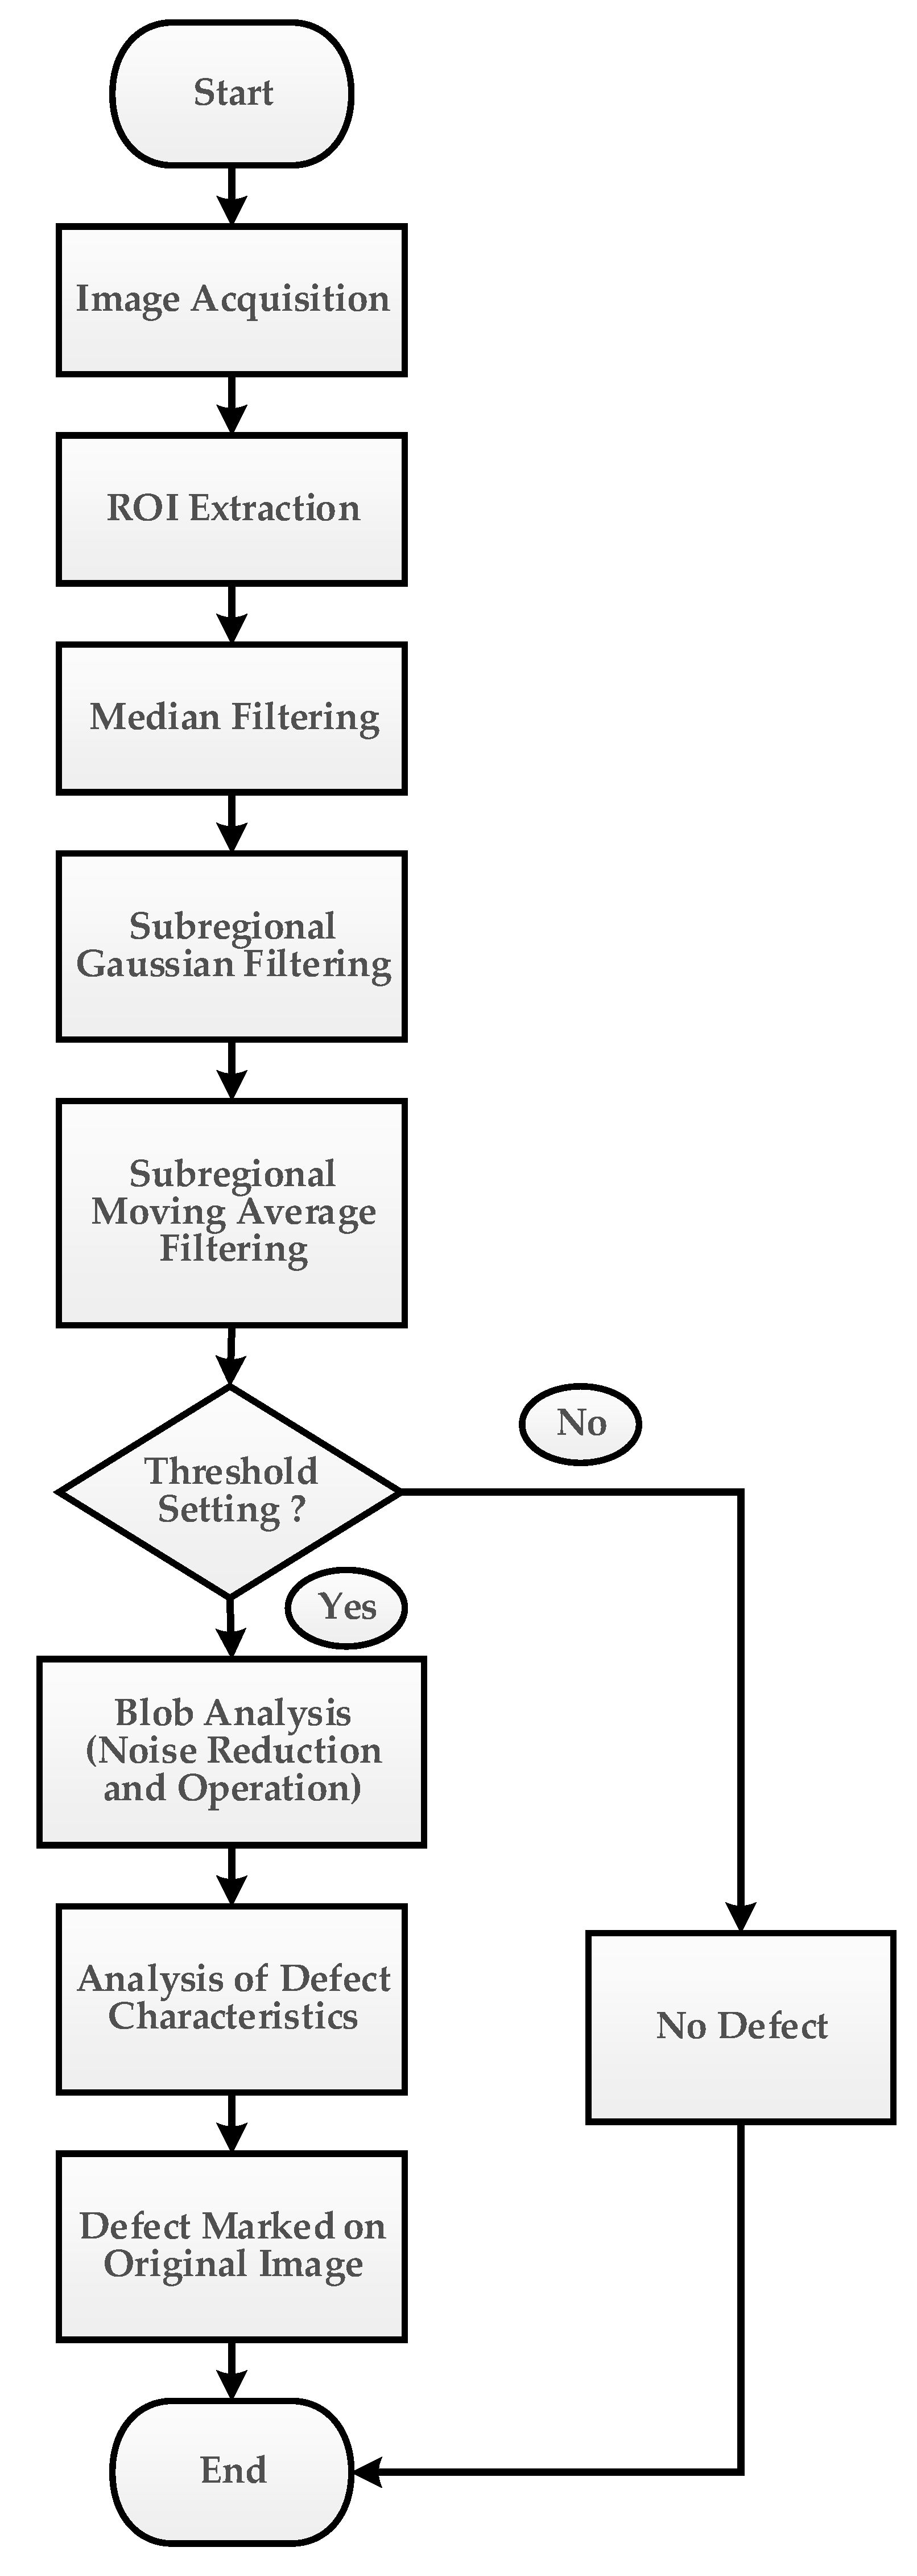
2.2. Software Structure
3. Principle of Defect Inspection Algorithm
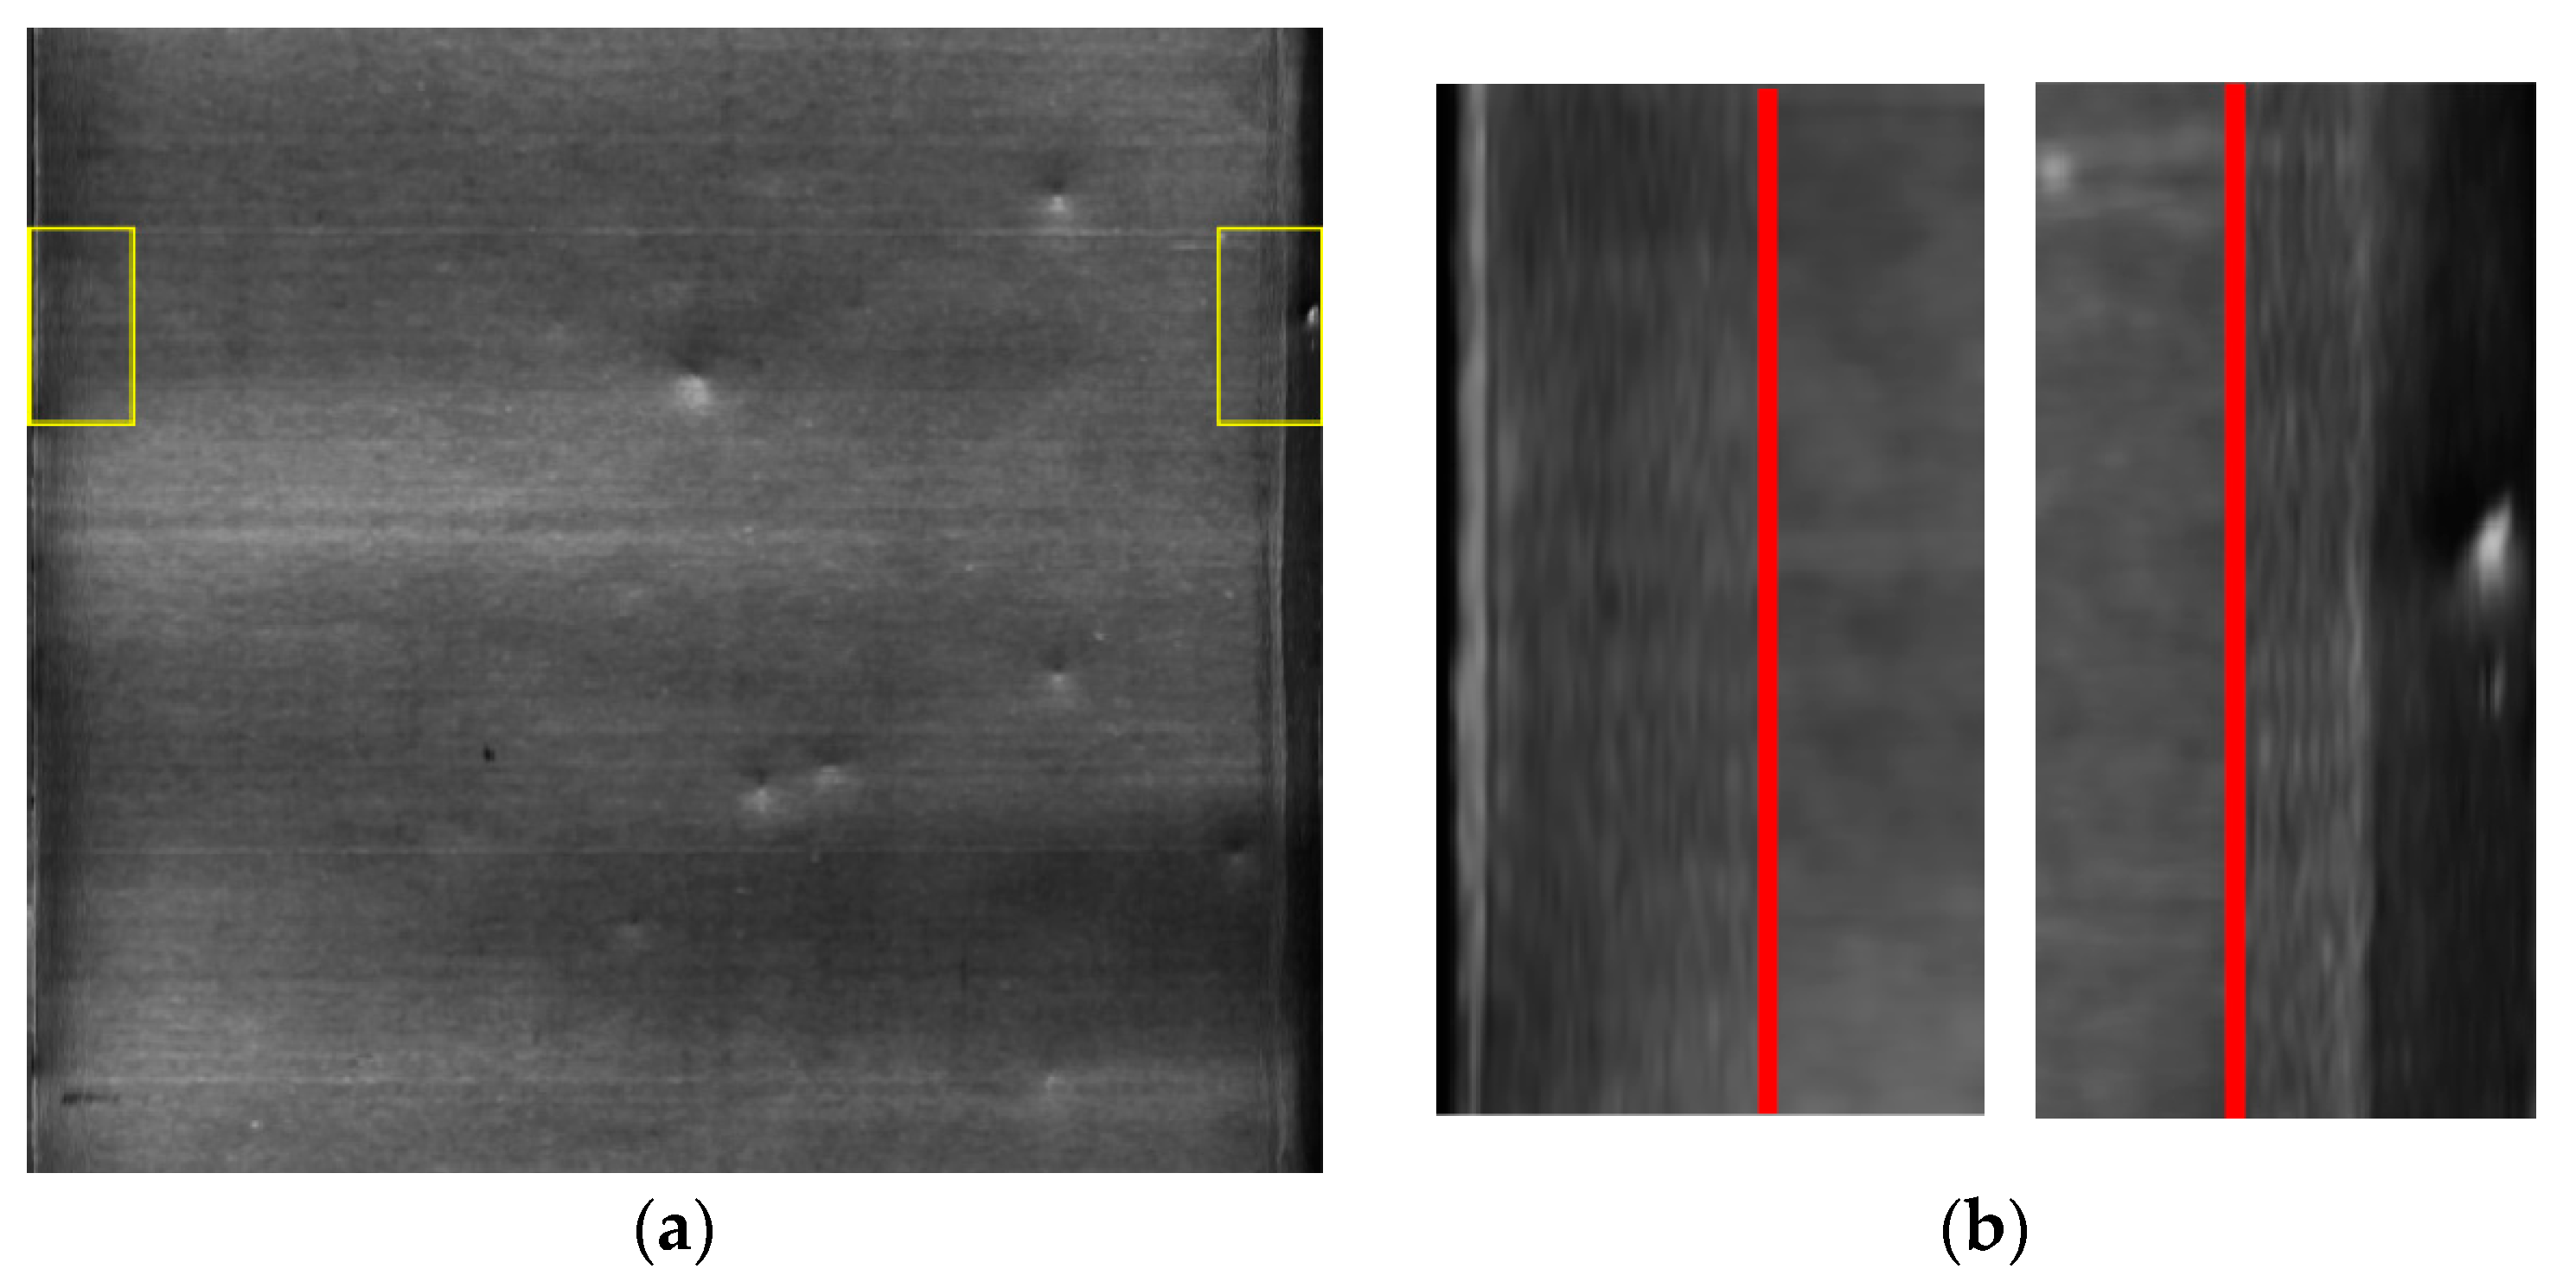
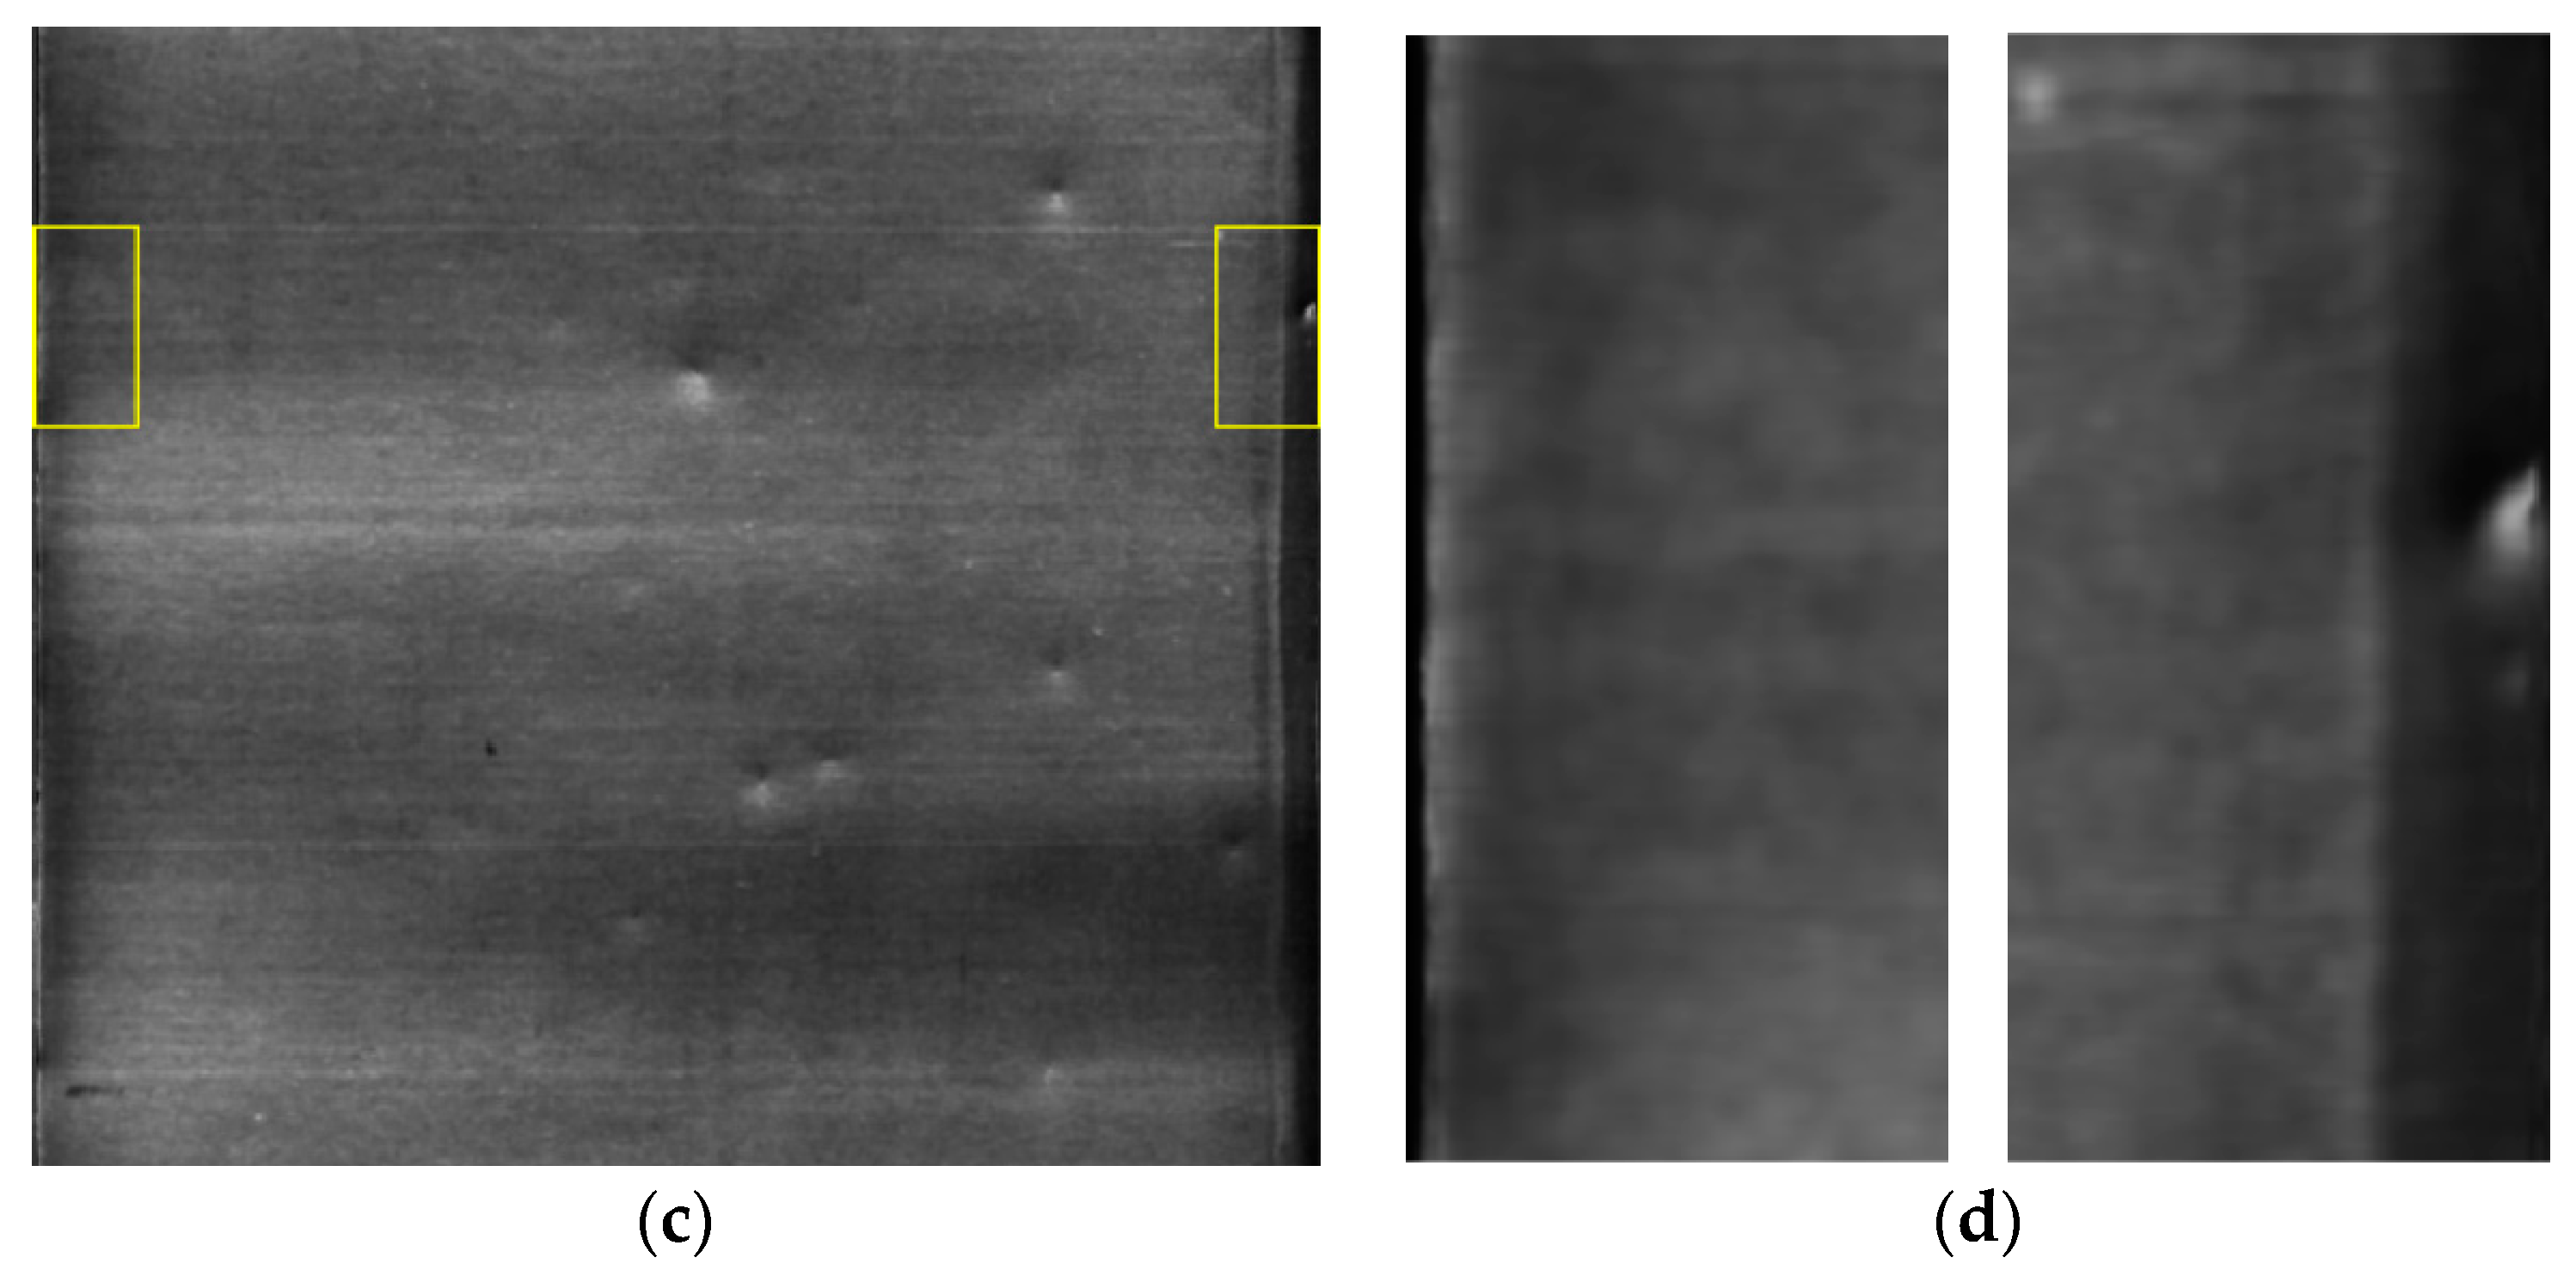
3.1. ROI Extraction
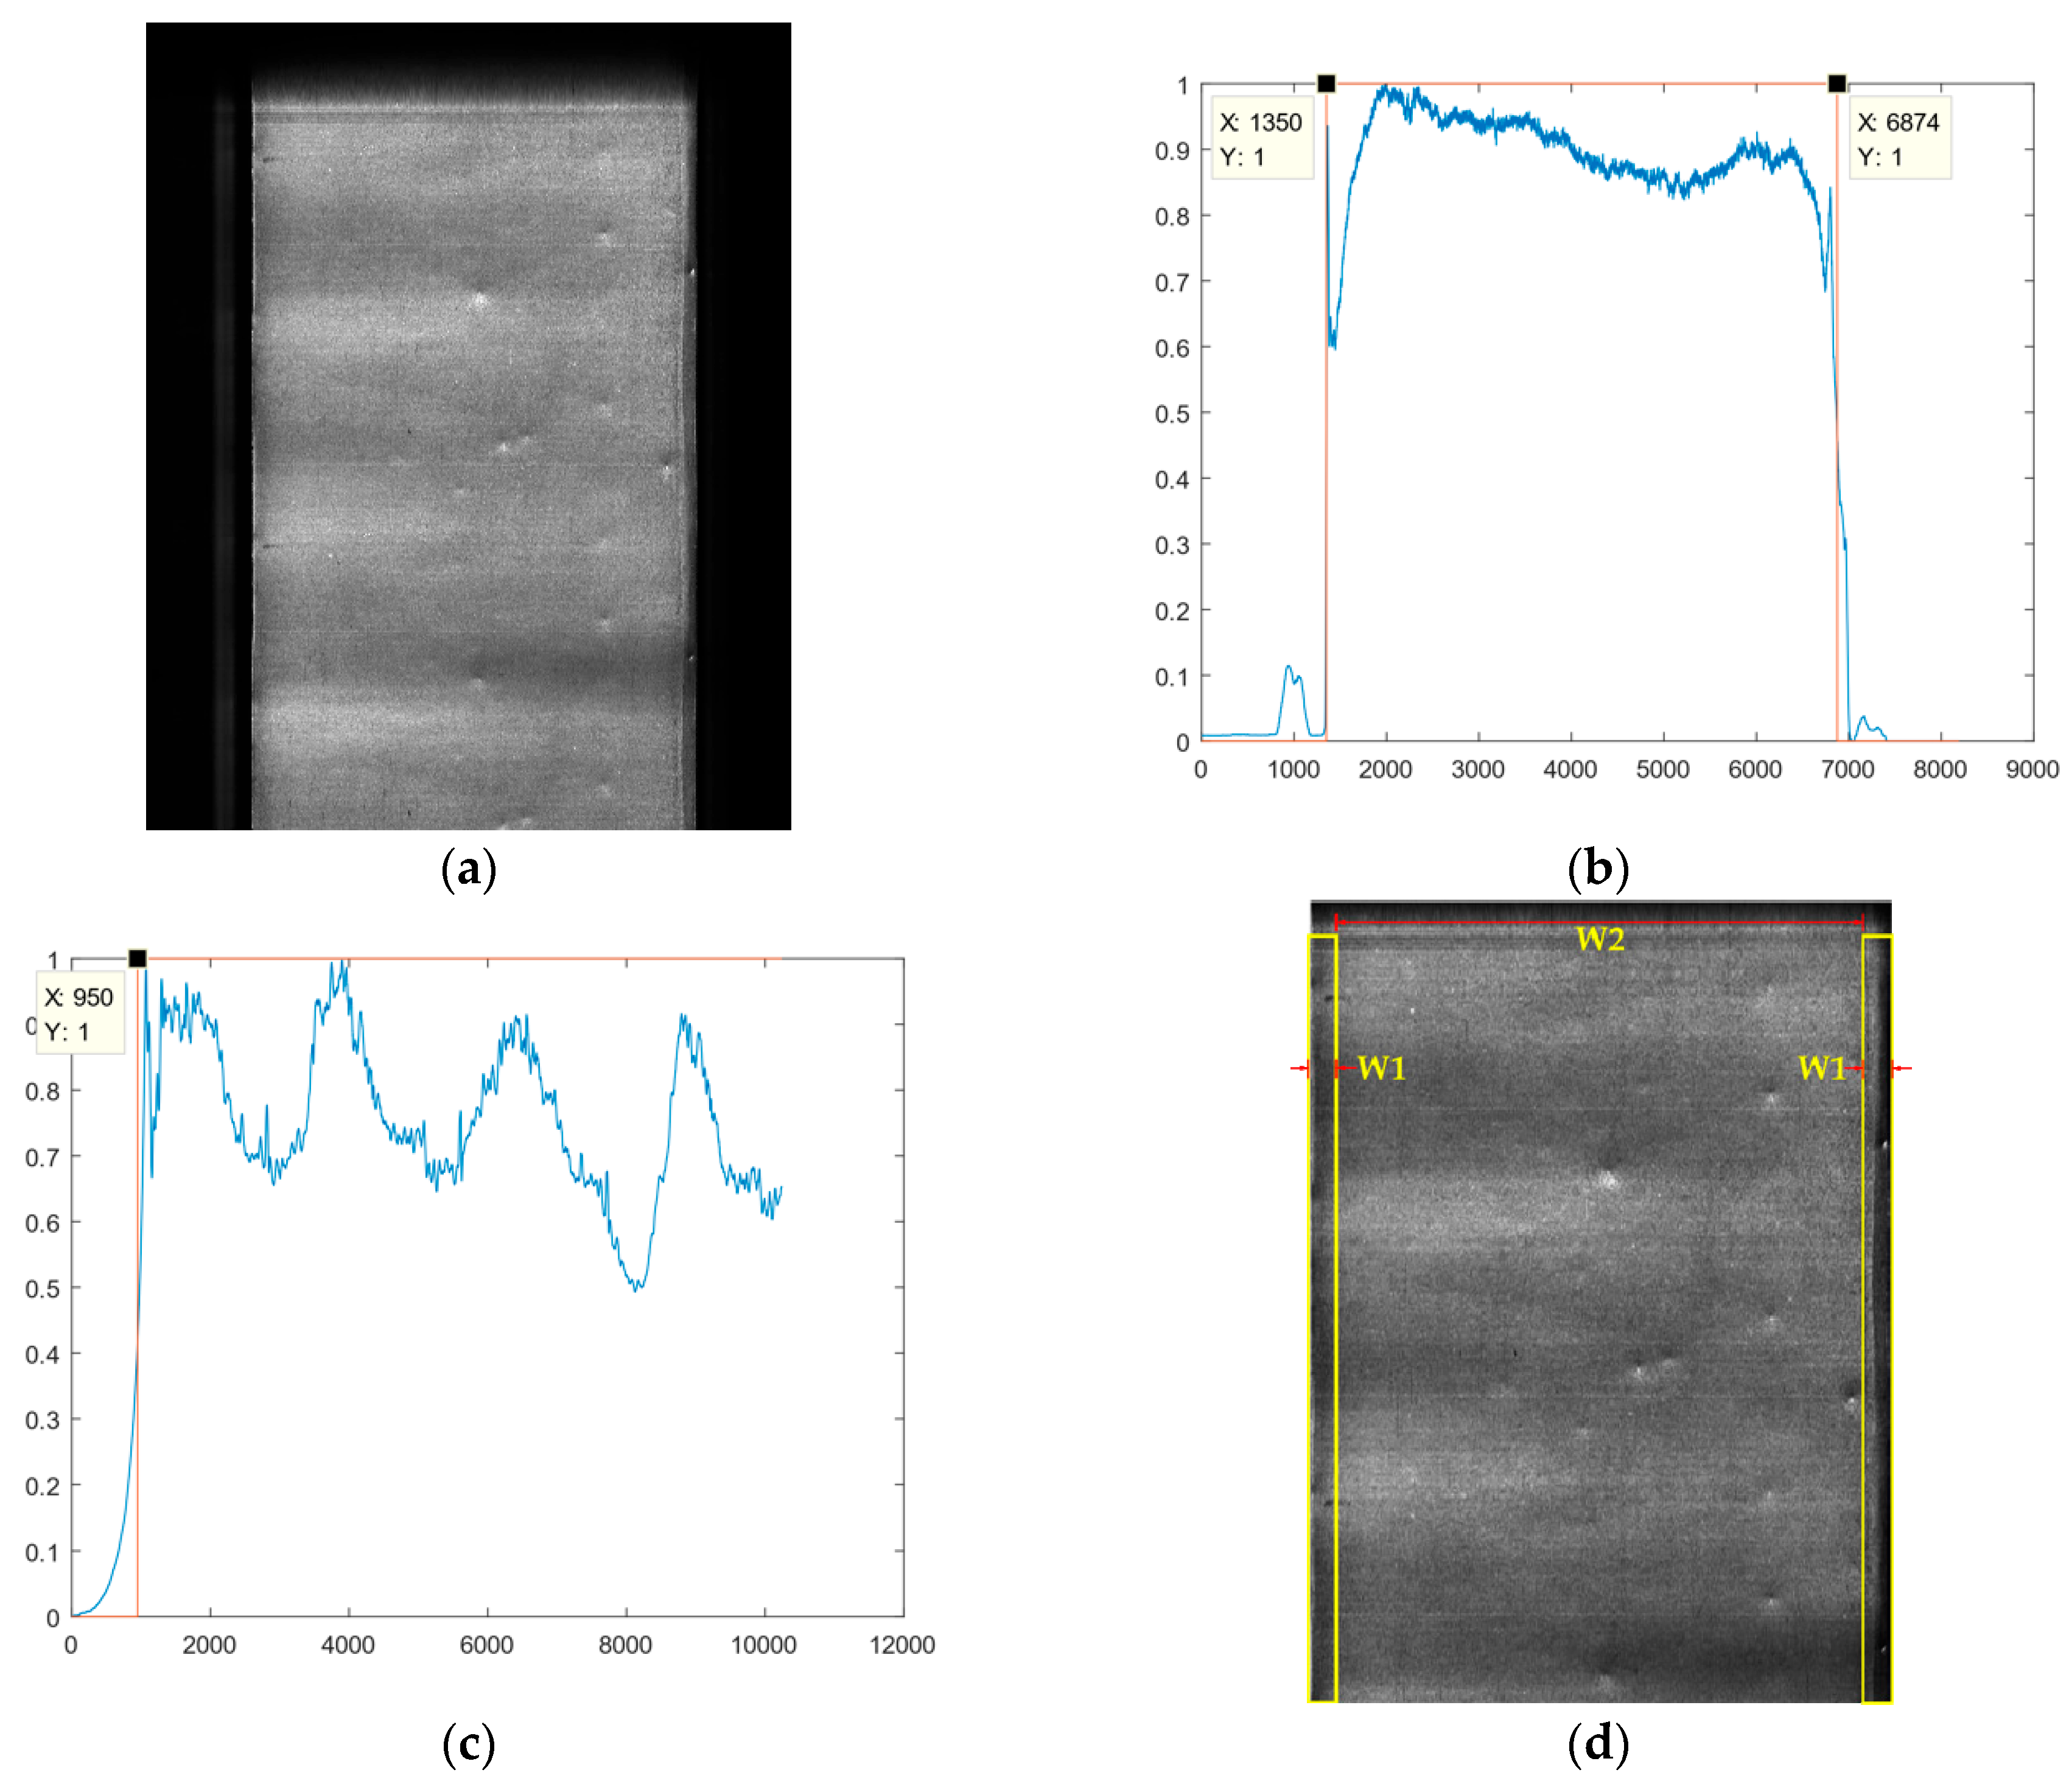
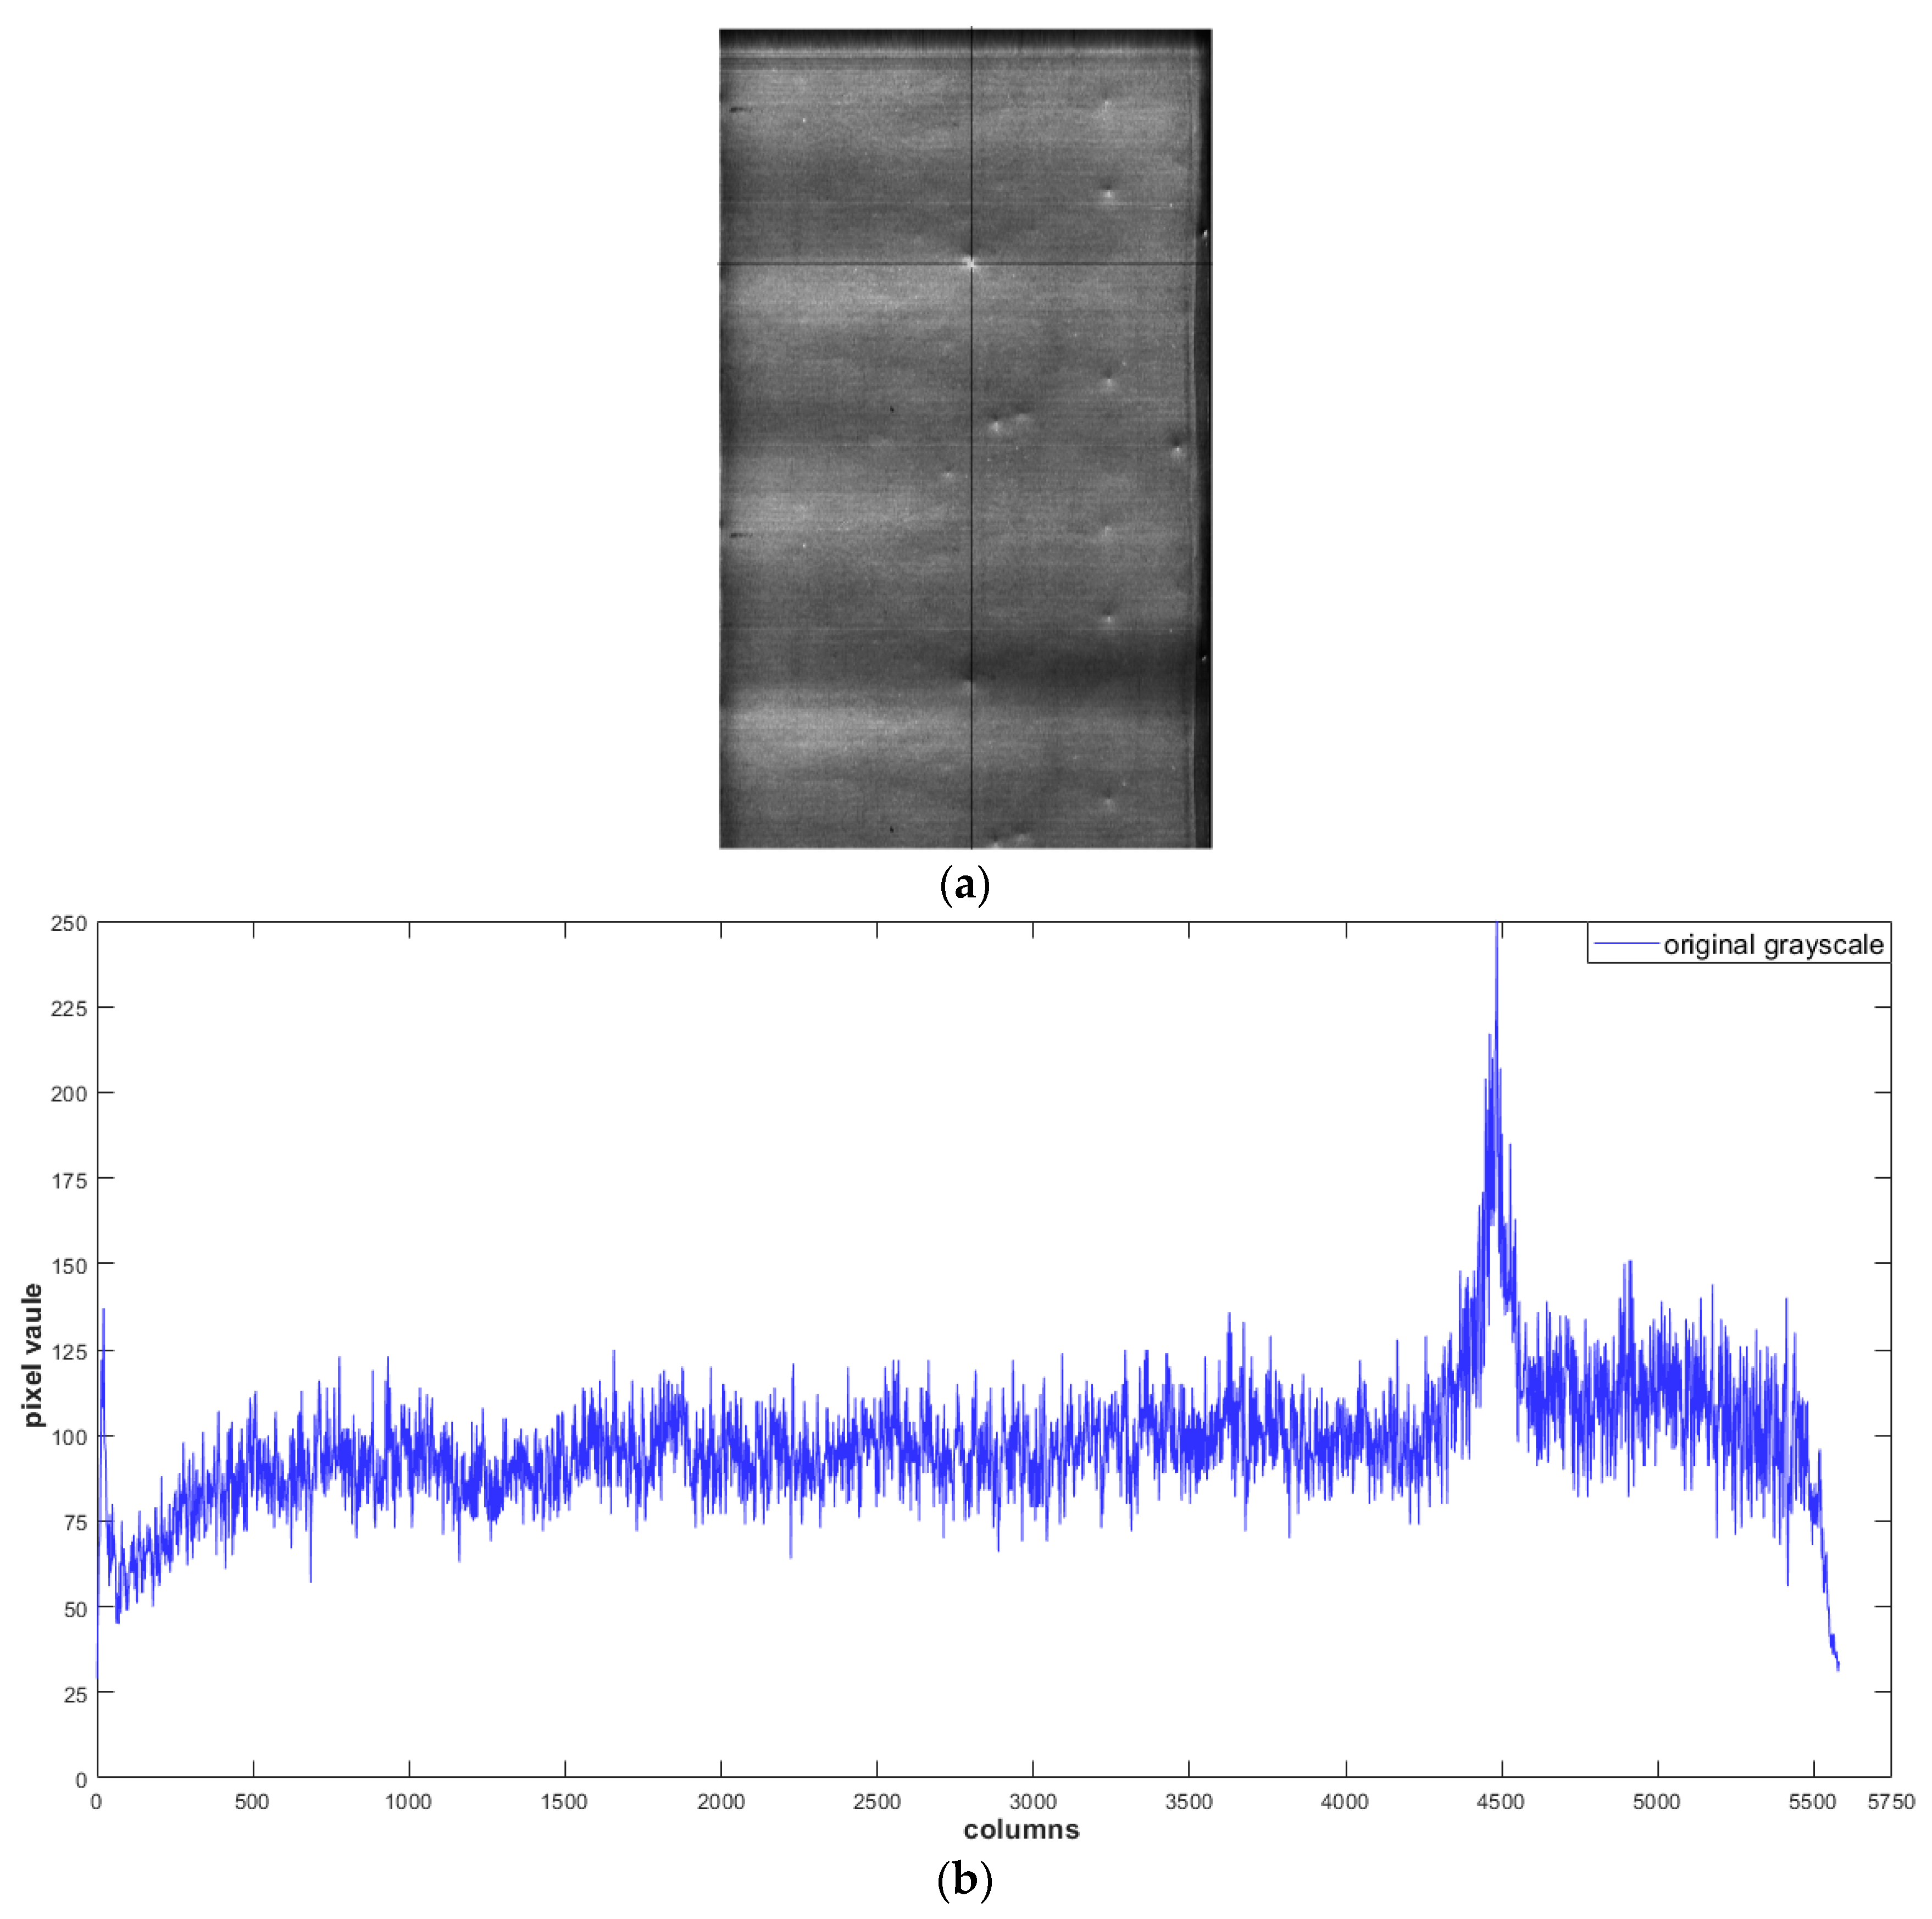
- The pixel value of each line is identified, and the maximum value is obtained. The pixel value of each point is divided by the maximum value . Correspondingly, the same procedure is performed for column .
- The pixel value between ROI and the background dramatically changes. The boundary point , is determined using this feature, where n is the total number of rows in the image, and m is the total number of columns.
- The column width of ROI was extracted from left to right (Figure 4b).
- The row width of ROI was extracted from top to bottom (Figure 4c).
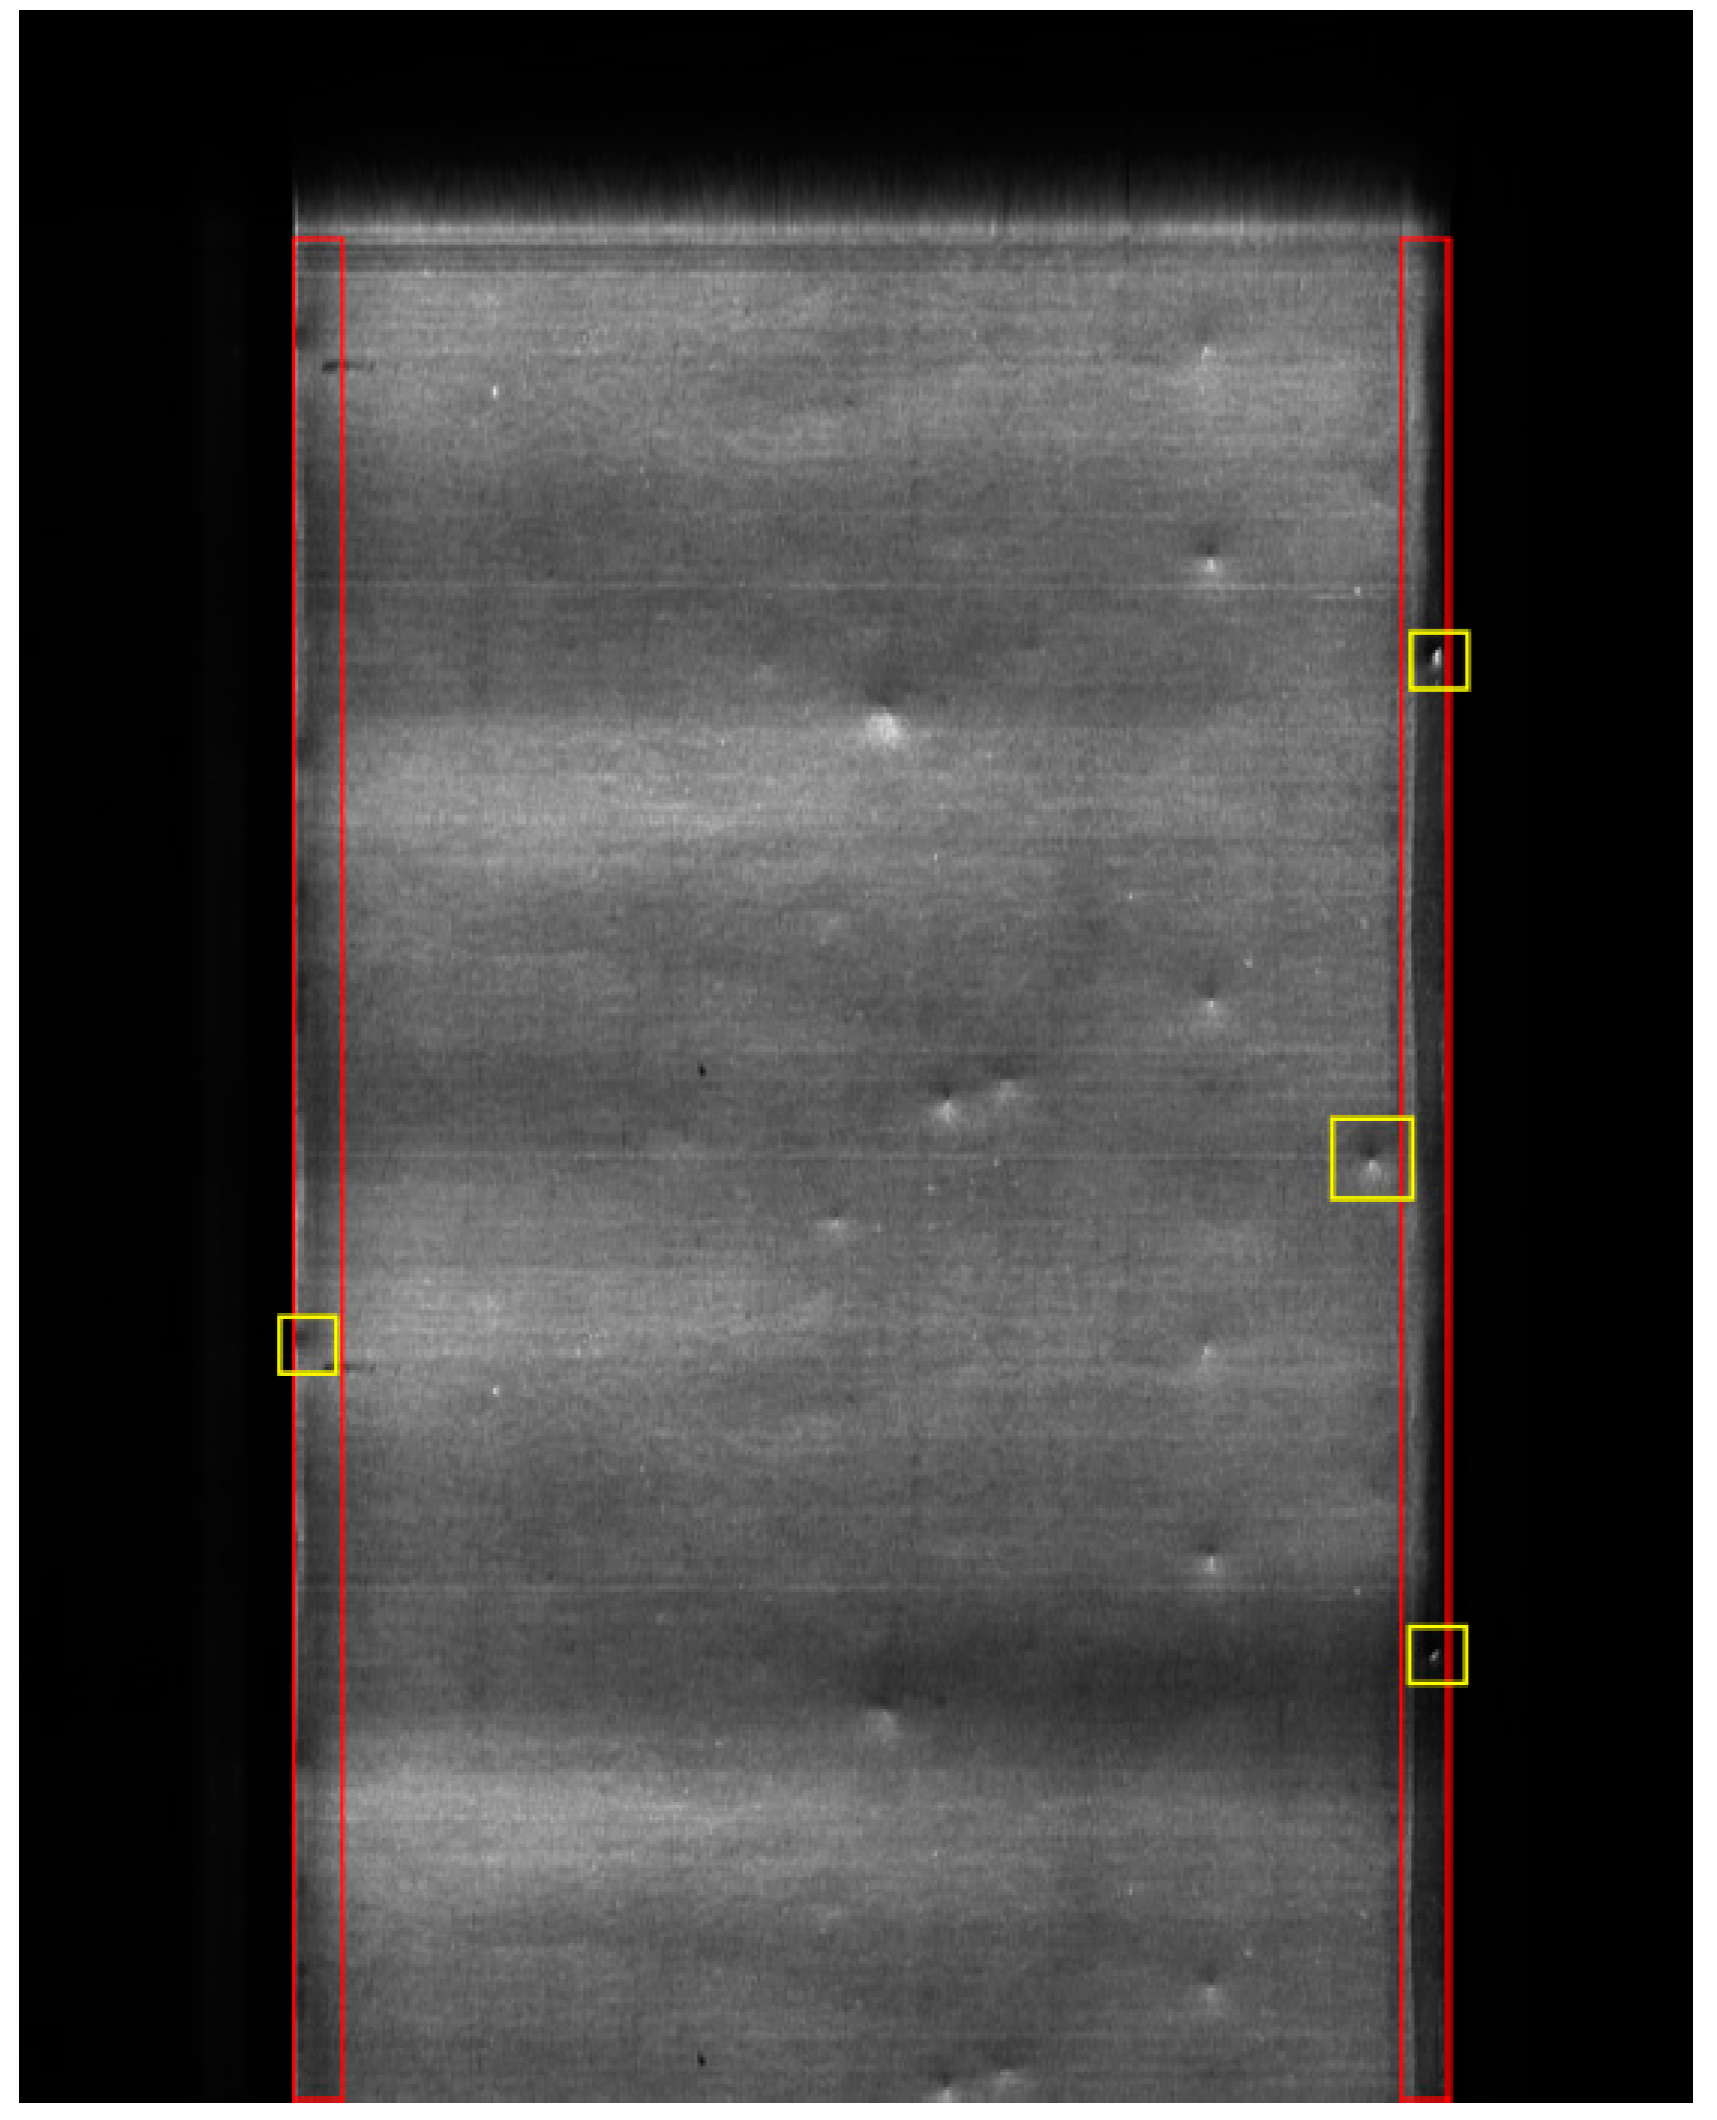
- ROI extraction is completed, and ROI is divided into two sections, namely, edge part and inner part (Figure 4d).
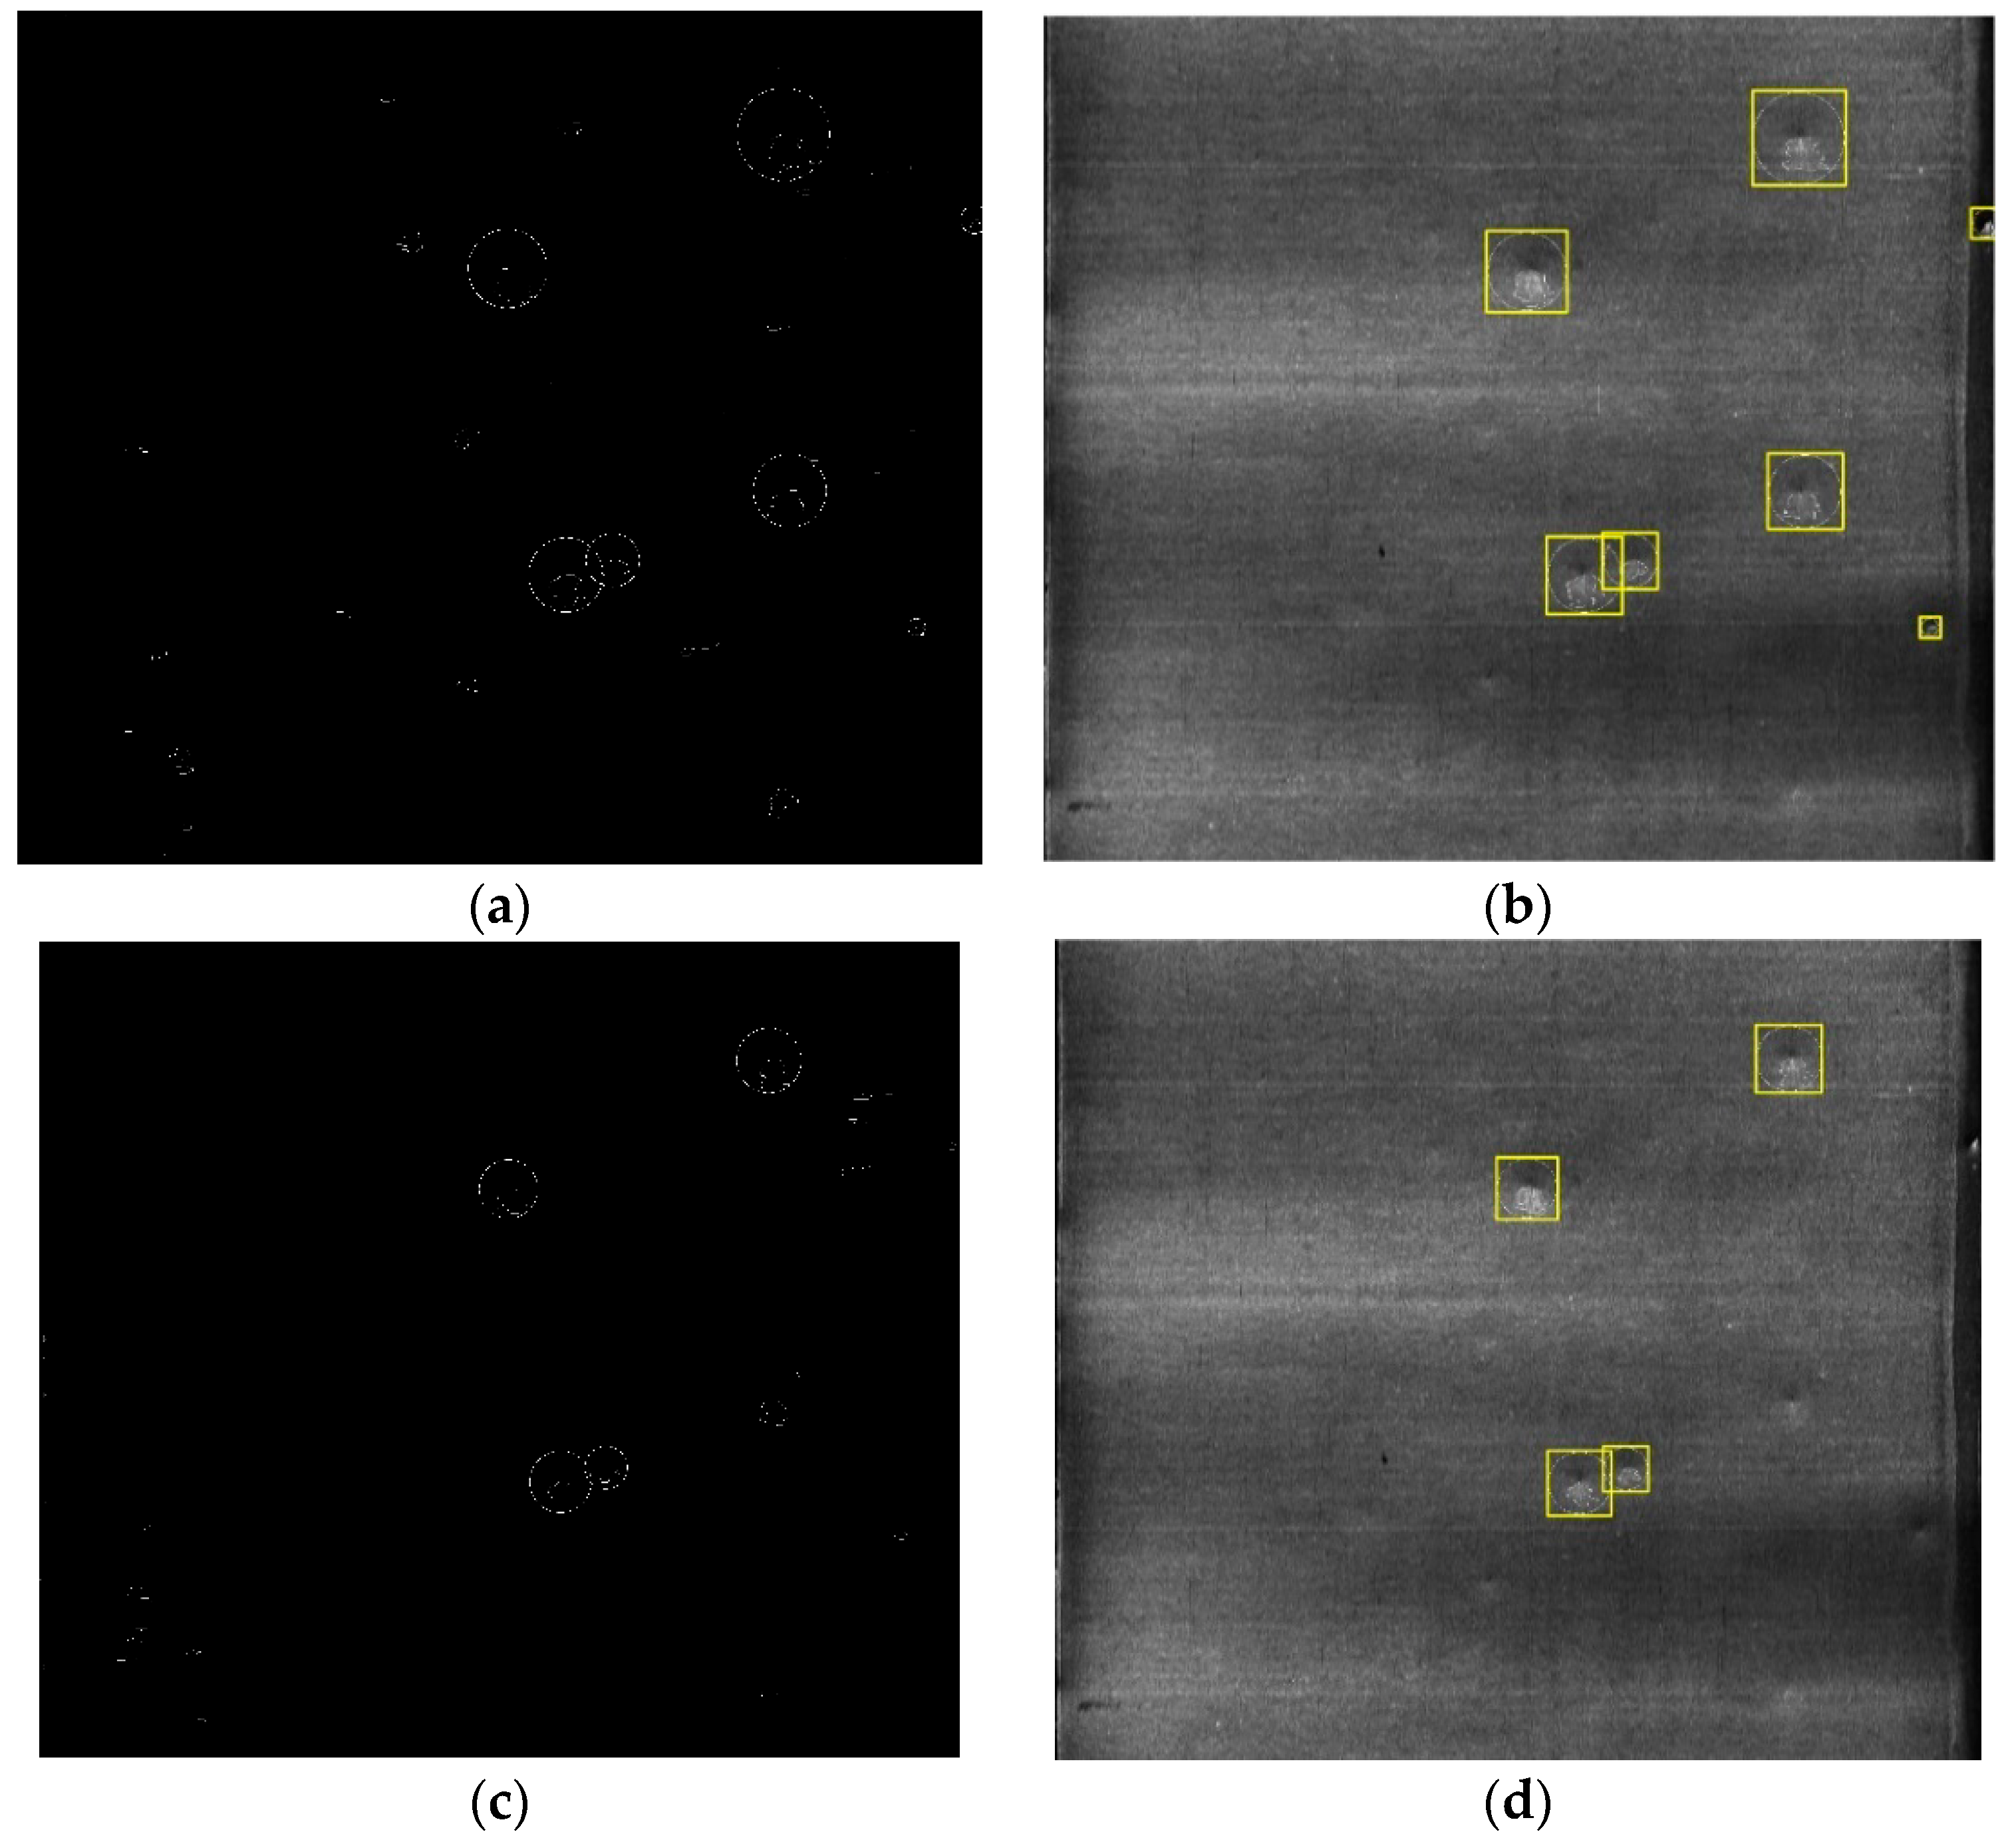
3.2. Gaussian Filtering
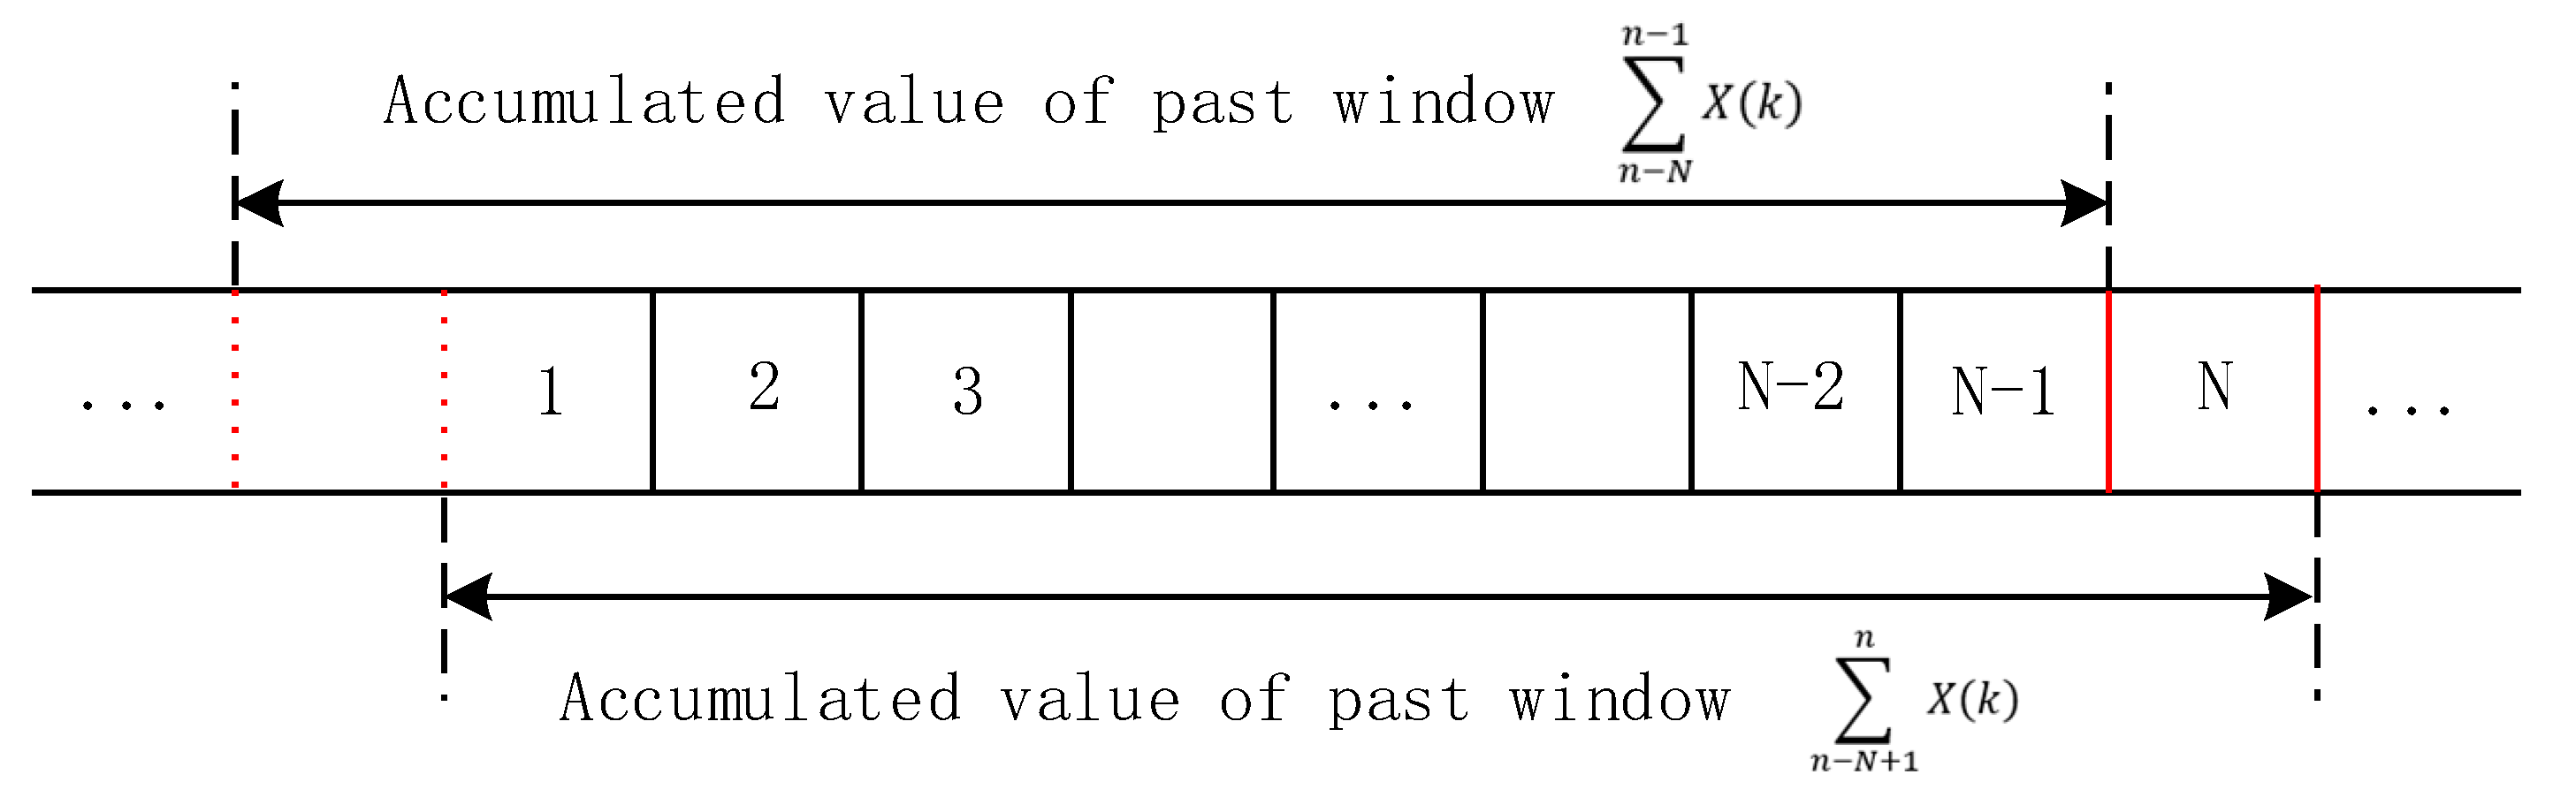
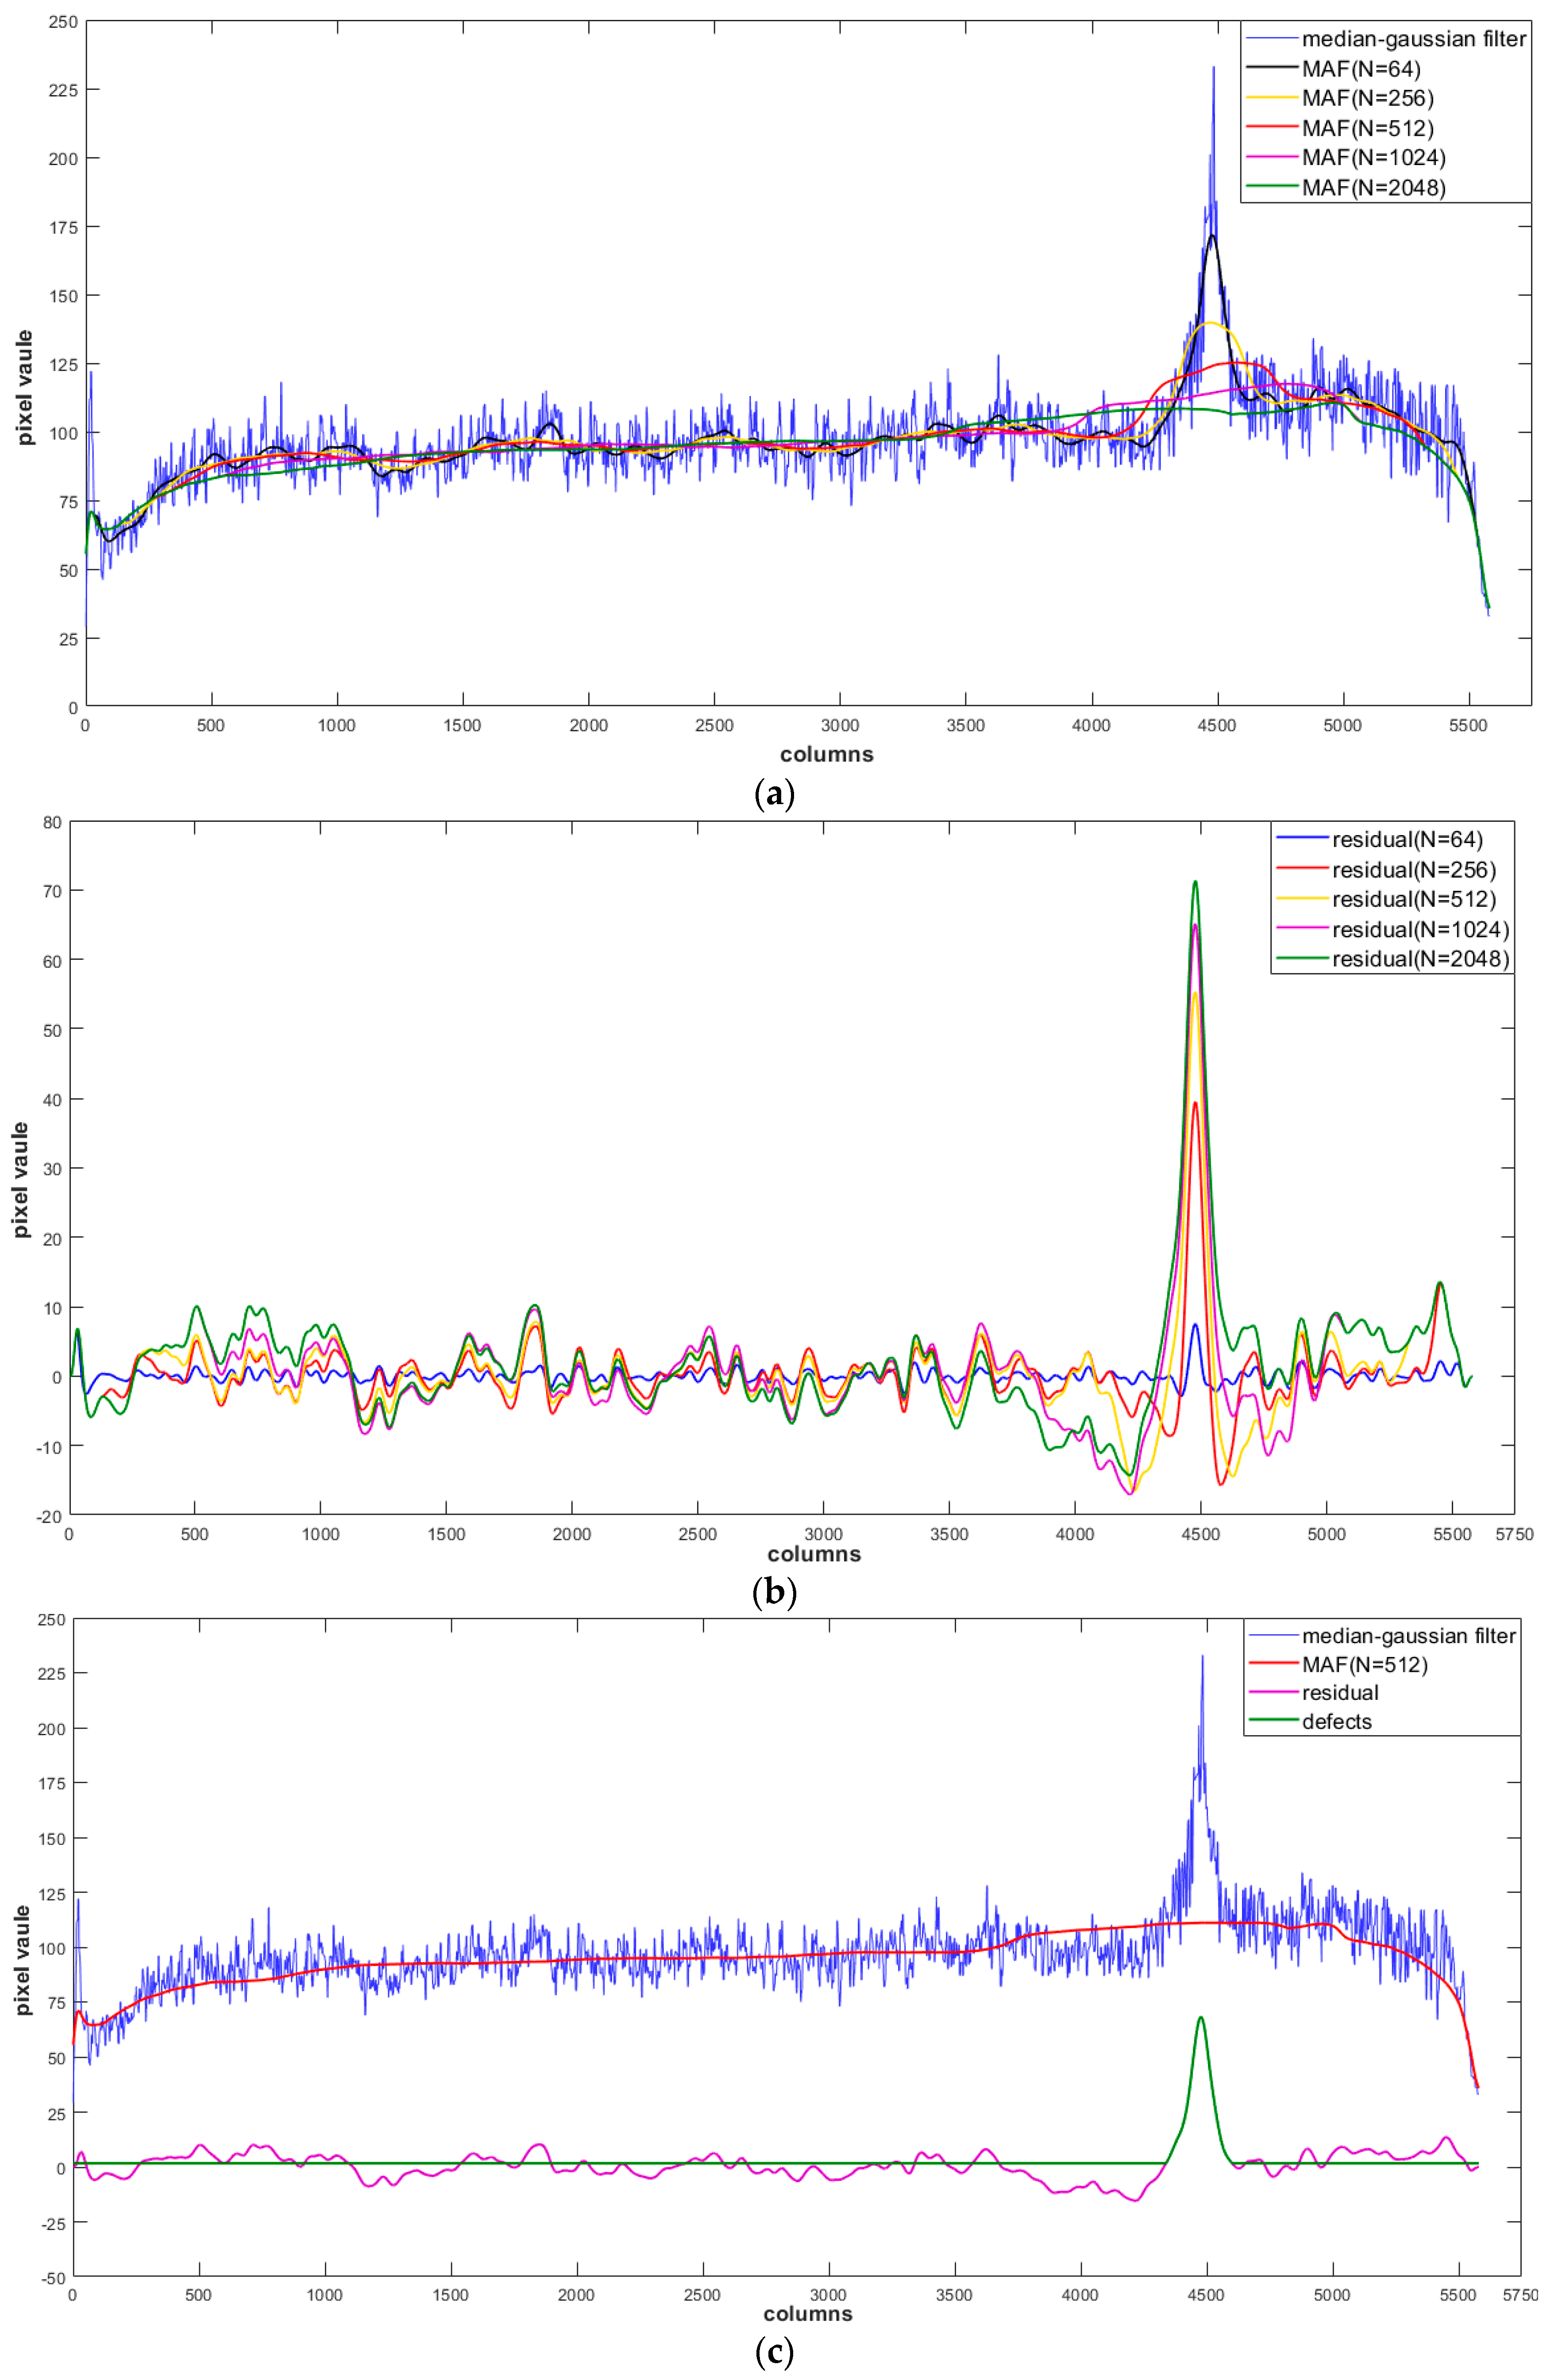
3.3. Moving Average Filtering (MAF)
3.4. Blob Analysis
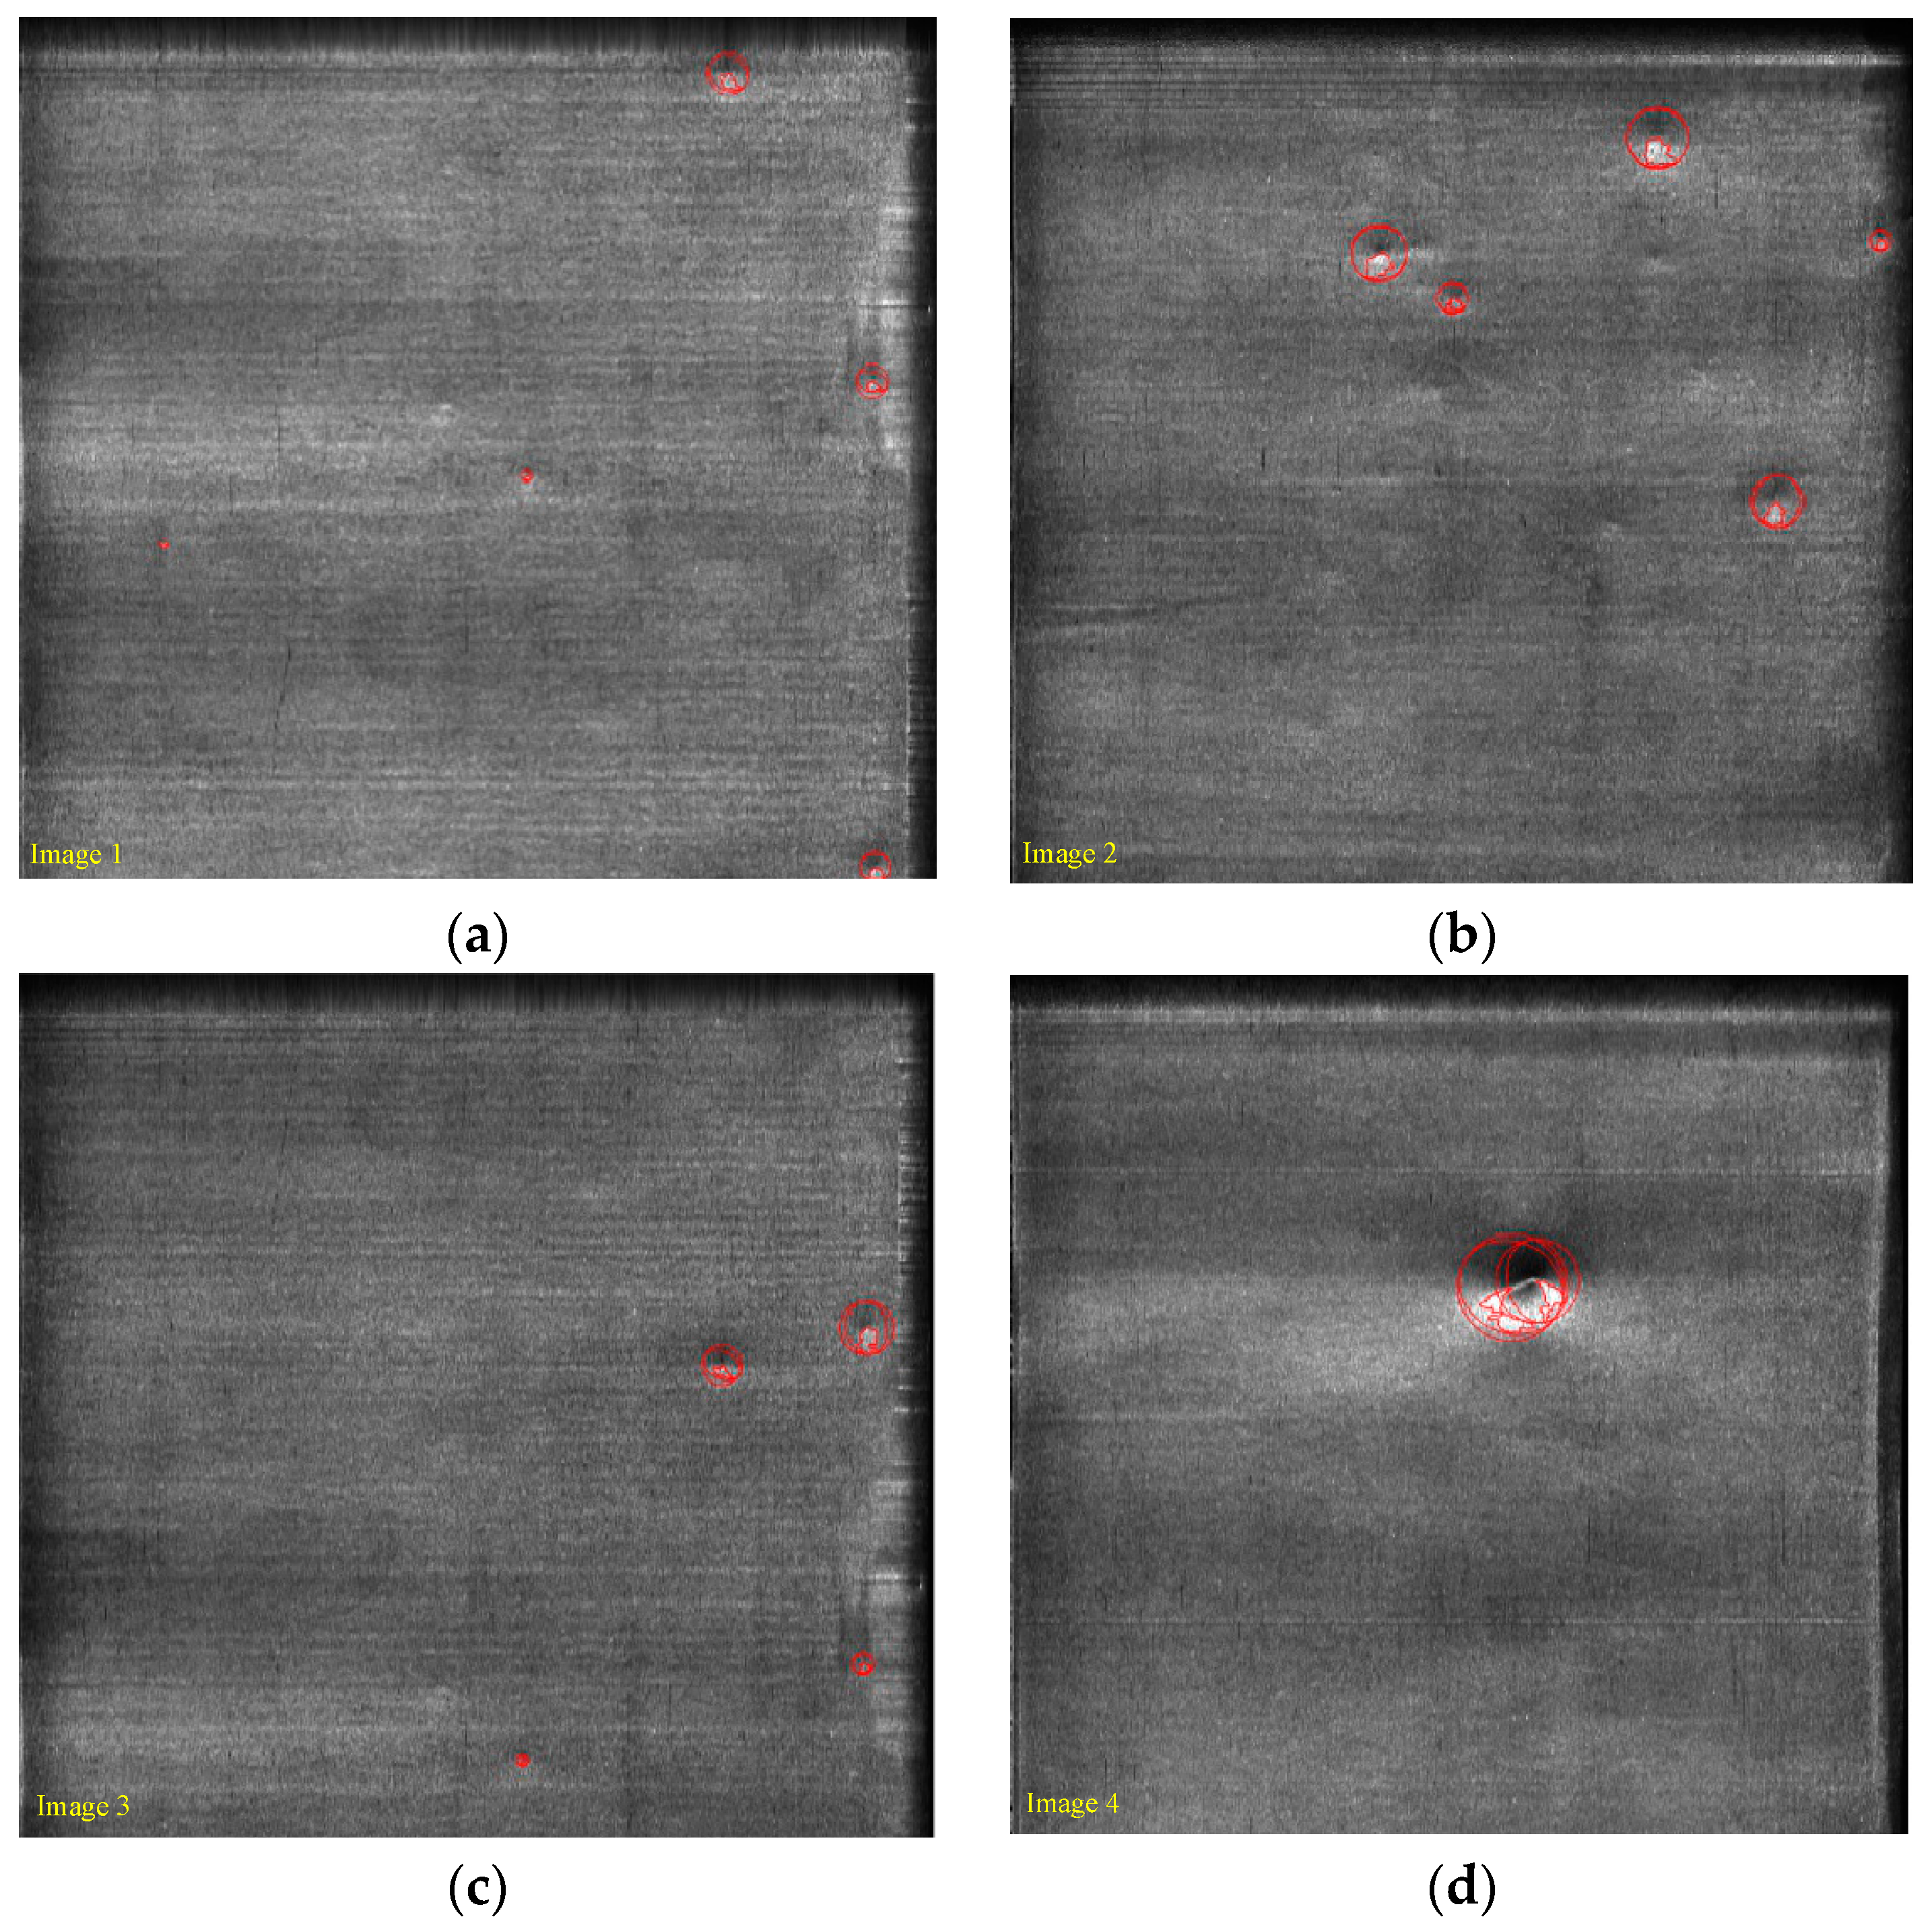
3.5. Analysis of Defect Characteristics
4. Experiments and the Analysis of Results
5. Conclusions
Author Contributions
Funding
Acknowledgments
Conflicts of Interest
References
- Kang, B.; Ceder, G. Battery materials for ultrafast charging and discharging. Nature 2009, 458, 190–193. [Google Scholar] [CrossRef] [PubMed]
- Goodenough, J.B.; Park, K.S. The Li-Ion Rechargeable Battery: A Perspective. J. Am. Chem. Soc. 2013, 135, 1167–1176. [Google Scholar] [CrossRef] [PubMed]
- Plett, G.L. Extended Kalman filtering for battery management systems of LiPB-based HEV battery packs. Part 2. Modeling and identification. J. Power Sources 2004, 134, 262–276. [Google Scholar] [CrossRef]
- Zhao, Y.; Liu, P.; Wang, Z.; Zhang, L.; Hong, J. Fault and defect diagnosis of battery for electric vehicles based on big data analysis methods. Appl. Energy 2017, 207, 354–362. [Google Scholar] [CrossRef]
- Gross, K.A.; Lungevics, J.; Zavickis, J.; Pluduma, L. A comparison of quality control methods for scratch detection on polished metal surfaces. Measurement 2018, 117, 397–402. [Google Scholar] [CrossRef]
- Ono, H.; Ogawa, A.; Yamasaki, T.; Koshihara, T.; Kodama, T.; Iizuka, Y.; Oshige, T. Development of Twin-Illumination and Subtraction Technique for Detection of Concave and Convex Defects on Steel Surfaces; International Society for Optics and Photonics: San Diego, CA, USA, 2016. [Google Scholar] [CrossRef]
- Samma, A.S.B.; Talib, A.Z.; Salam, R.A. Combining Boundary and Skeleton Information for Convex and Concave Points Detection. In Proceedings of the 2010 Seventh International Conference on Computer Graphics, Imaging and Visualization (CGIV), Sydney, Australia, 7–10 August 2010. [Google Scholar]
- Newman, T.S.; Jain, A.K. A Survey of Automated Visual Inspection. Comput. Vis. Image Underst. 1995, 61, 231–262. [Google Scholar] [CrossRef]
- Fitschen, J.; Koj, S.; Bredemeyer, J.; Garbe, H. RF front end for UAS-aided flight inspection of airport surveillance radars. In Proceedings of the 2017 11th European Conference on Antennas & Propagation, Paris, France, 19–24 March 2017. [Google Scholar]
- Leftwich, R.F.; Ordway, G.B. Infrared Inspection of Multilayer Laminates and Composite Structures. IEEE Trans. Ind. Electr. Control Instrum. 1971, 2, 42–44. [Google Scholar] [CrossRef]
- Wang, P.; Gao, Y.; Tian, G.; Wang, H. Velocity effect analysis of dynamic magnetization in high speed magnetic flux leakage inspection. NDT E Int. 2014, 64, 7–12. [Google Scholar] [CrossRef]
- D’orazio, T.; Leo, M.; Distante, A.; Guaragnella, C.; Pianese, V.; Cavaccini, G. Automatic ultrasonic inspection for internal defect detection in composite materials. NDT E Int. 2008, 41, 145–154. [Google Scholar] [CrossRef]
- Deng, X.; Ye, X.; Fang, J.; Lin, C.; Wang, L. Surface Defects Inspection System Based on Computer Vision. In Proceedings of the 2010 International Conference on Electrical and Control Engineering, Wuhan, China, 25–27 June 2010; pp. 2205–2208. [Google Scholar]
- Tang, B.; Kong, J.Y.; Wang, X.D.; Chen, L. Surface Inspection System of Steel Strip Based on Computer Vision. In Proceedings of the 2009 First International Workshop on Database Technology and Applications, Wuhan, China, 25–26 April 2009; pp. 359–362. [Google Scholar]
- Hu, L.; Duan, F.J.; Ding, K.Q.; Ye, S.H. Research on Surface Defects on Line Detection System for Steel Plate Using Computer Vision. Iron and Steel 2005, 40, 59–61. [Google Scholar]
- Li, Y.; Liu, W.; Li, X.; Huang, Q.; Li, X. GA-SIFT: A new scale invariant feature transform for multispectral image using geometric algebra. Inf. Sci. 2014, 281, 559–572. [Google Scholar] [CrossRef]
- Bay, H.; Ess, A.; Tuytelaars, T.; Van Gool, L. Speeded-Up Robust Features (SURF). Comput. Vis. Image Underst. 2008, 110, 346–359. [Google Scholar] [CrossRef]
- Ojala, T.; Pietikäinen, M.; Harwood, D. A comparative study of texture measures with classification based on featured distributions. Pattern Recogn. J. Pattern Recogn. Soc. 1996, 29, 51–59. [Google Scholar] [CrossRef]
- Li, K.; Dan, T. Research and design of inspection of LR6 battery negative surface scratches online defects based on computer vision. In Proceedings of the 2013 International Conference on Communications, Circuits and Systems, Chengdu, China, 15–17 November 2013. [Google Scholar]
- Tian, S.; Xu, K. An Algorithm for Surface Defect Identification of Steel Plates Based on Genetic Algorithm and Extreme Learning Machine. Metals 2017, 7, 311. [Google Scholar] [CrossRef]
- Li, Y.; Zhang, C. Automated vision system for fabric defect inspection using Gabor filters and PCNN. SpringerPlus 2016, 5, 765. [Google Scholar] [CrossRef] [PubMed]
- Li, Q.; Ren, S. A Real-Time Visual Inspection System for Discrete Surface Defects of Rail Heads. IEEE Trans. Instrum. Meas. 2012, 61, 2189–2199. [Google Scholar] [CrossRef]
- Fujigaki, M.; Oura, Y.; Asai, D.; Murata, Y. High-speed height measurement by a light-source-stepping method using a linear LED array. Opt. Express 2013, 21, 23169–23180. [Google Scholar] [CrossRef] [PubMed]
- Dong, T.; Hua, D.; Li, Y.; Ni, J. Measuring principle of vertical target density based on single linear array CCD camera. J. Appl. Opt. 2014, 125, 176–178. [Google Scholar] [CrossRef]
- Ito, K. Gaussian filter for nonlinear filtering problems. In Proceedings of the 39th IEEE Conference on Decision & Control, Sydney, Australia, 12–15 December 2000. [Google Scholar]
- Wang, Y.; Yang, K.; He, C.; Chen, G. A harmonic elimination approach based on moving average filter for cascaded DSTATCOM. In Proceedings of the 40th Annual Conference of the IEEE Industrial Electronics Society, Dallas, TX, USA, 29 October–1 November 2014; pp. 4508–4513. [Google Scholar]
- Zhang, M.; Wu, T.; Beeman, S.C.; Cullen-McEwen, L.; Bertram, J.F.; Charlton, J.R.; Charlton, J.R.; Baldelomar, E.; Bennett, K.M. Efficient Small Blob Detection based on Local Convexity, Intensity and Shape Information. IEEE Trans. Med. Imaging 2015, 35, 1127–1137. [Google Scholar] [CrossRef]
- Karimi, M.H.; Asemani, D. Surface defect detection in tiling Industries using digital image processing methods: Analysis and evaluation. ISA Trans. 2014, 53, 834–844. [Google Scholar] [CrossRef]
- Chen, J.; Liu, Z.; Wang, H.; Núñez, A.; Han, Z. Automatic Defect Detection of Fasteners on the Catenary Support Device Using Deep Convolutional Neural Network. IEEE Trans. Instrum. Meas. 2017, 67, 257–269. [Google Scholar] [CrossRef]
- Liu, Y.; Xu, K.; Wang, D. Online Surface Defect Identification of Cold Rolled Strips Based on Local Binary Pattern and Extreme Learning Machine. Metals 2018, 8, 197. [Google Scholar] [CrossRef]


| Methods | 1 | 2 | 3 | 4 | 5 | Mean | Time (s) |
|---|---|---|---|---|---|---|---|
| partition | 98.82% | 98.56% | 93.54% | 96.45% | 95.35% | 95.94% | 3.3303 |
| tradition | 73.45% | 73.45% | 77.35% | 82.35% | 78.45% | 75.96% | 3.3321 |
| Methods | Defect Type | Time (s) | Accuracy (%) | Ref |
|---|---|---|---|---|
| Deep Convolutional Neural Network | concave and convex | 83 (training time:133min) | 96.72% | [29] |
| LBP | concave and convex | 8.2683 | 95.13% | [30] |
| SURF | concave and convex | 7.4512 | 89.70% | [17,30] |
| Gabor-Otsu | concave and convex | 4.1859 | 82.32% | [19] |
| Polynomial Fitting | concave and convex | 3.7280 | 95.43% | Our work |
| MAF | concave and convex | 3.3303 | 95.94% | Our work |
© 2019 by the authors. Licensee MDPI, Basel, Switzerland. This article is an open access article distributed under the terms and conditions of the Creative Commons Attribution (CC BY) license (http://creativecommons.org/licenses/by/4.0/).
Share and Cite
Hu, H.; Zhang, B.; Xu, D.; Xia, G. Battery Surface and Edge Defect Inspection Based on Sub-Regional Gaussian and Moving Average Filter. Appl. Sci. 2019, 9, 3418. https://doi.org/10.3390/app9163418
Hu H, Zhang B, Xu D, Xia G. Battery Surface and Edge Defect Inspection Based on Sub-Regional Gaussian and Moving Average Filter. Applied Sciences. 2019; 9(16):3418. https://doi.org/10.3390/app9163418
Chicago/Turabian StyleHu, Haibing, Bo Zhang, Dongjian Xu, and Guo Xia. 2019. "Battery Surface and Edge Defect Inspection Based on Sub-Regional Gaussian and Moving Average Filter" Applied Sciences 9, no. 16: 3418. https://doi.org/10.3390/app9163418