A Comparative Study of the Fitness and Trueness of a Three-Unit Fixed Dental Prosthesis Fabricated Using Two Digital Workflows


Abstract
:1. Introduction
2. Materials and Methods
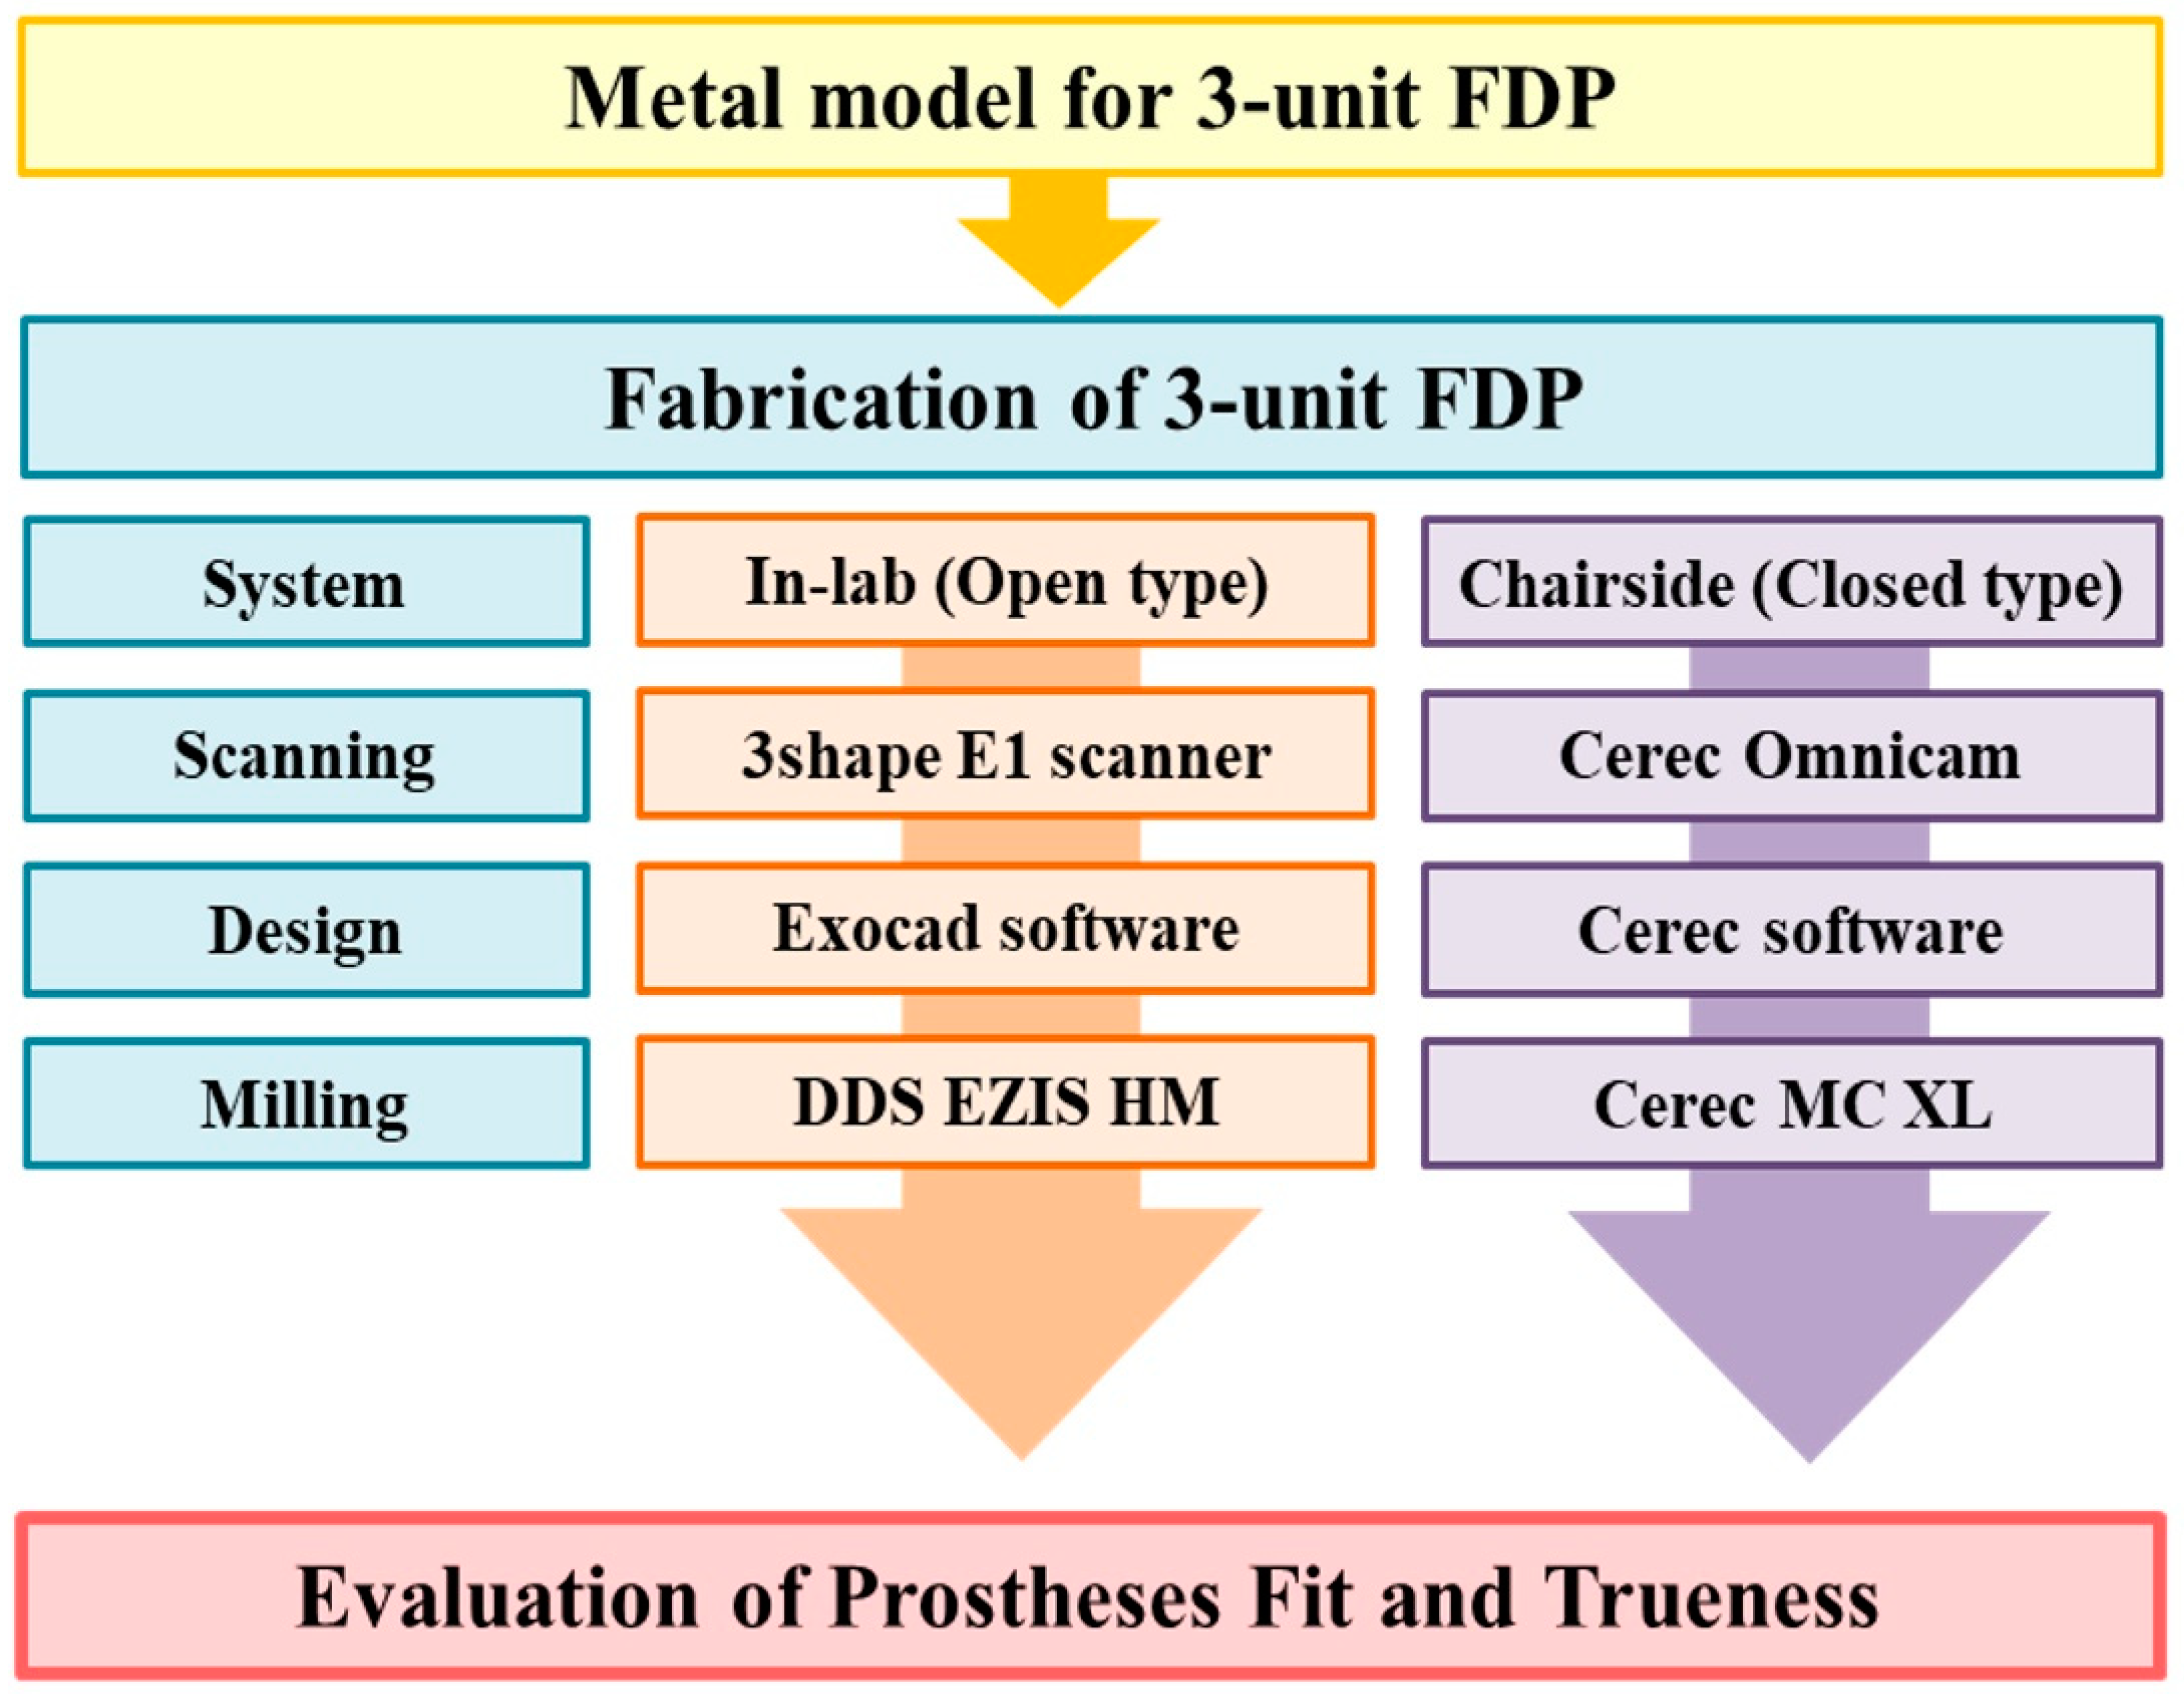
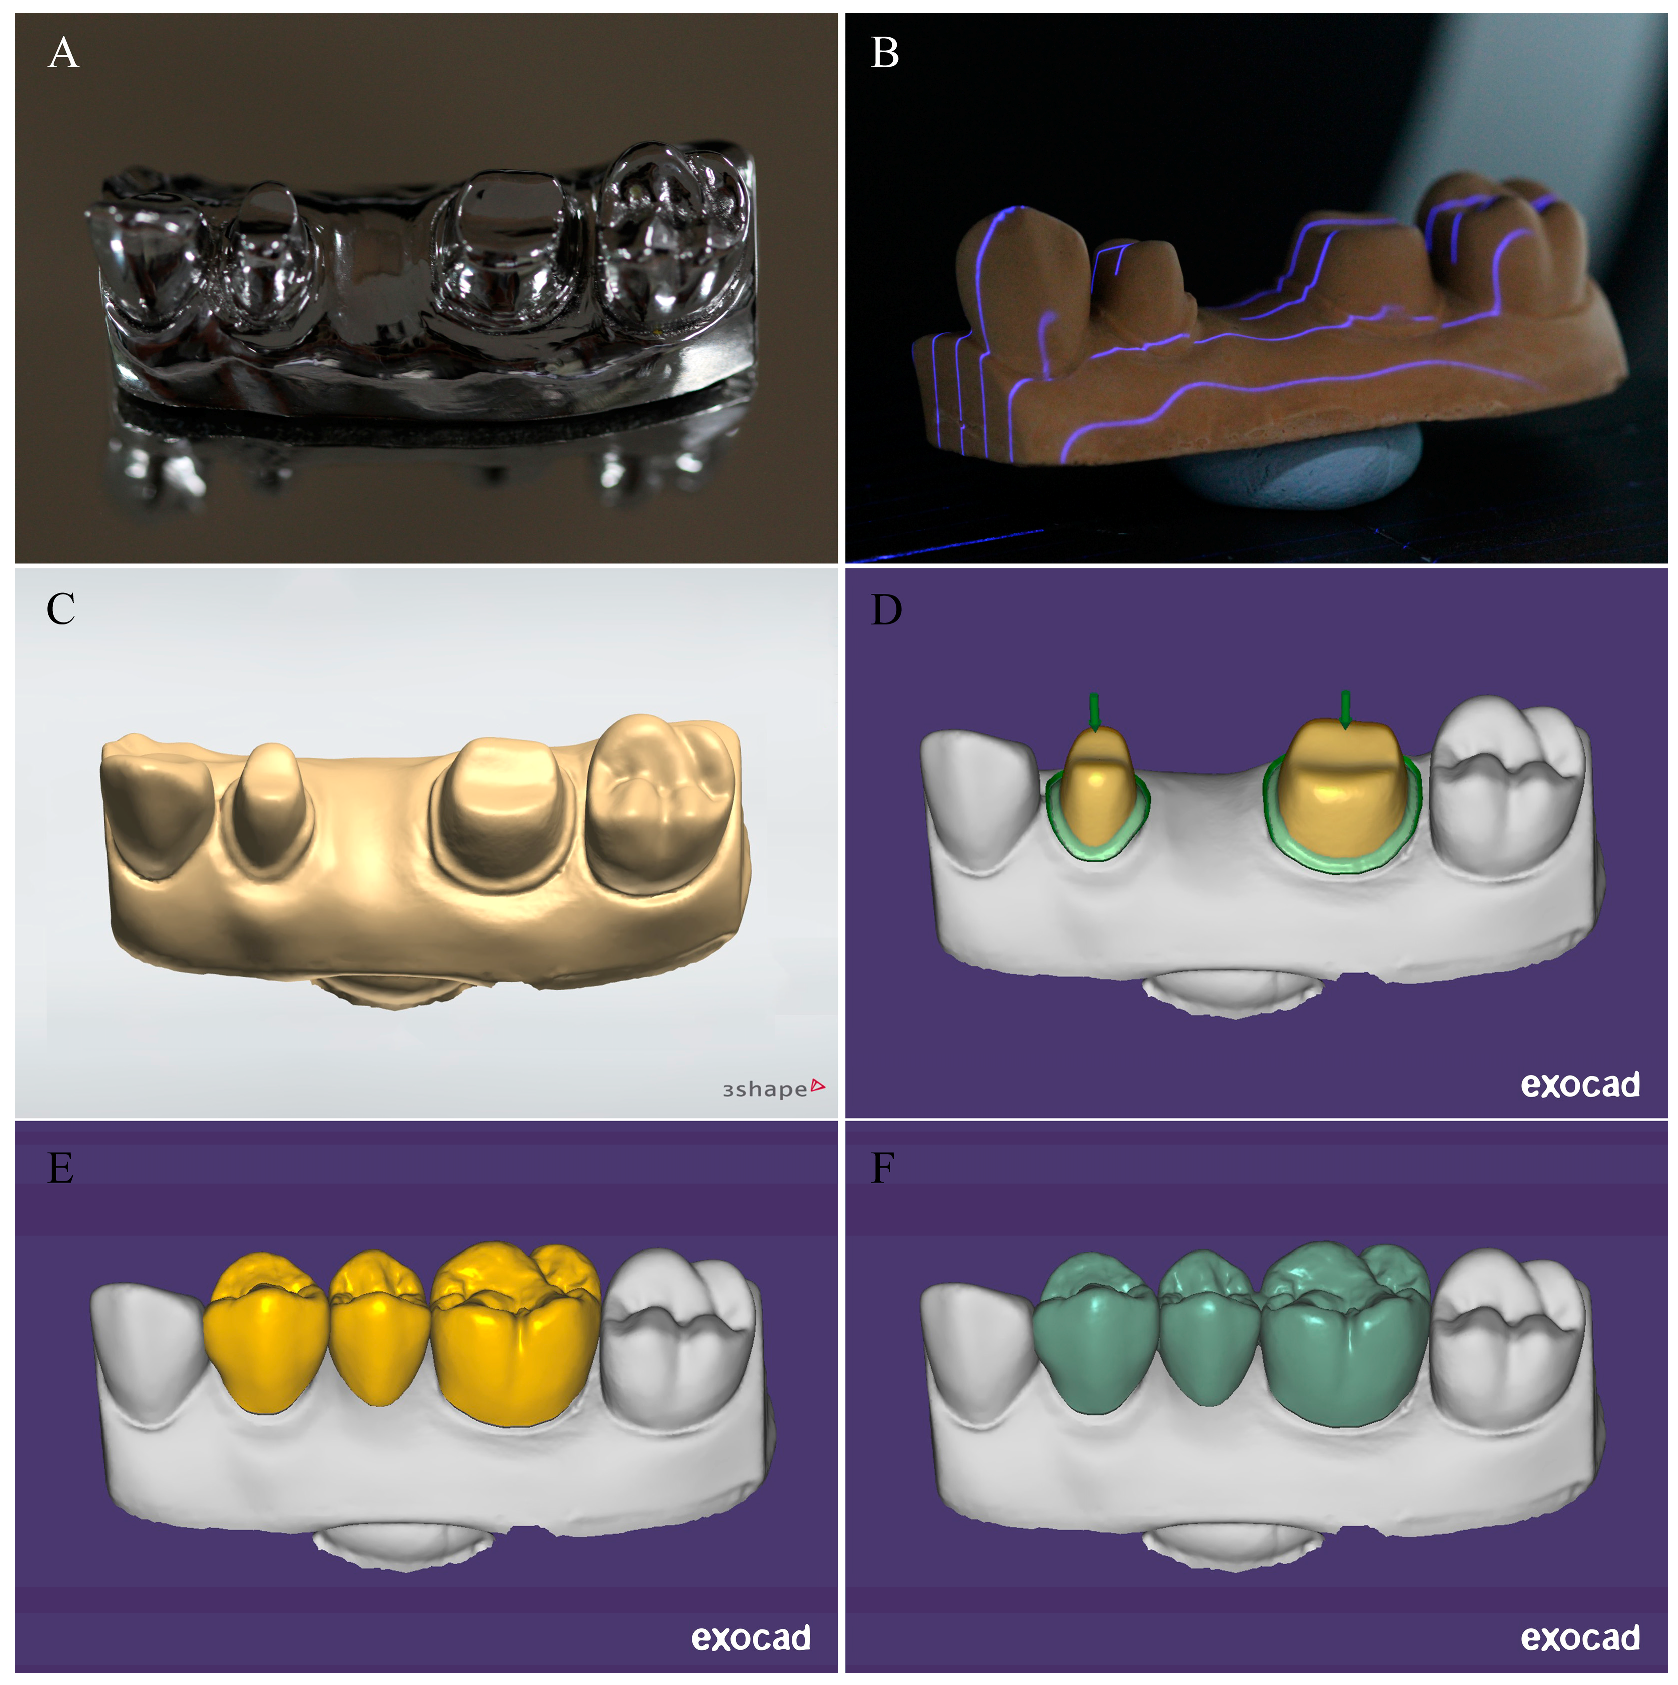
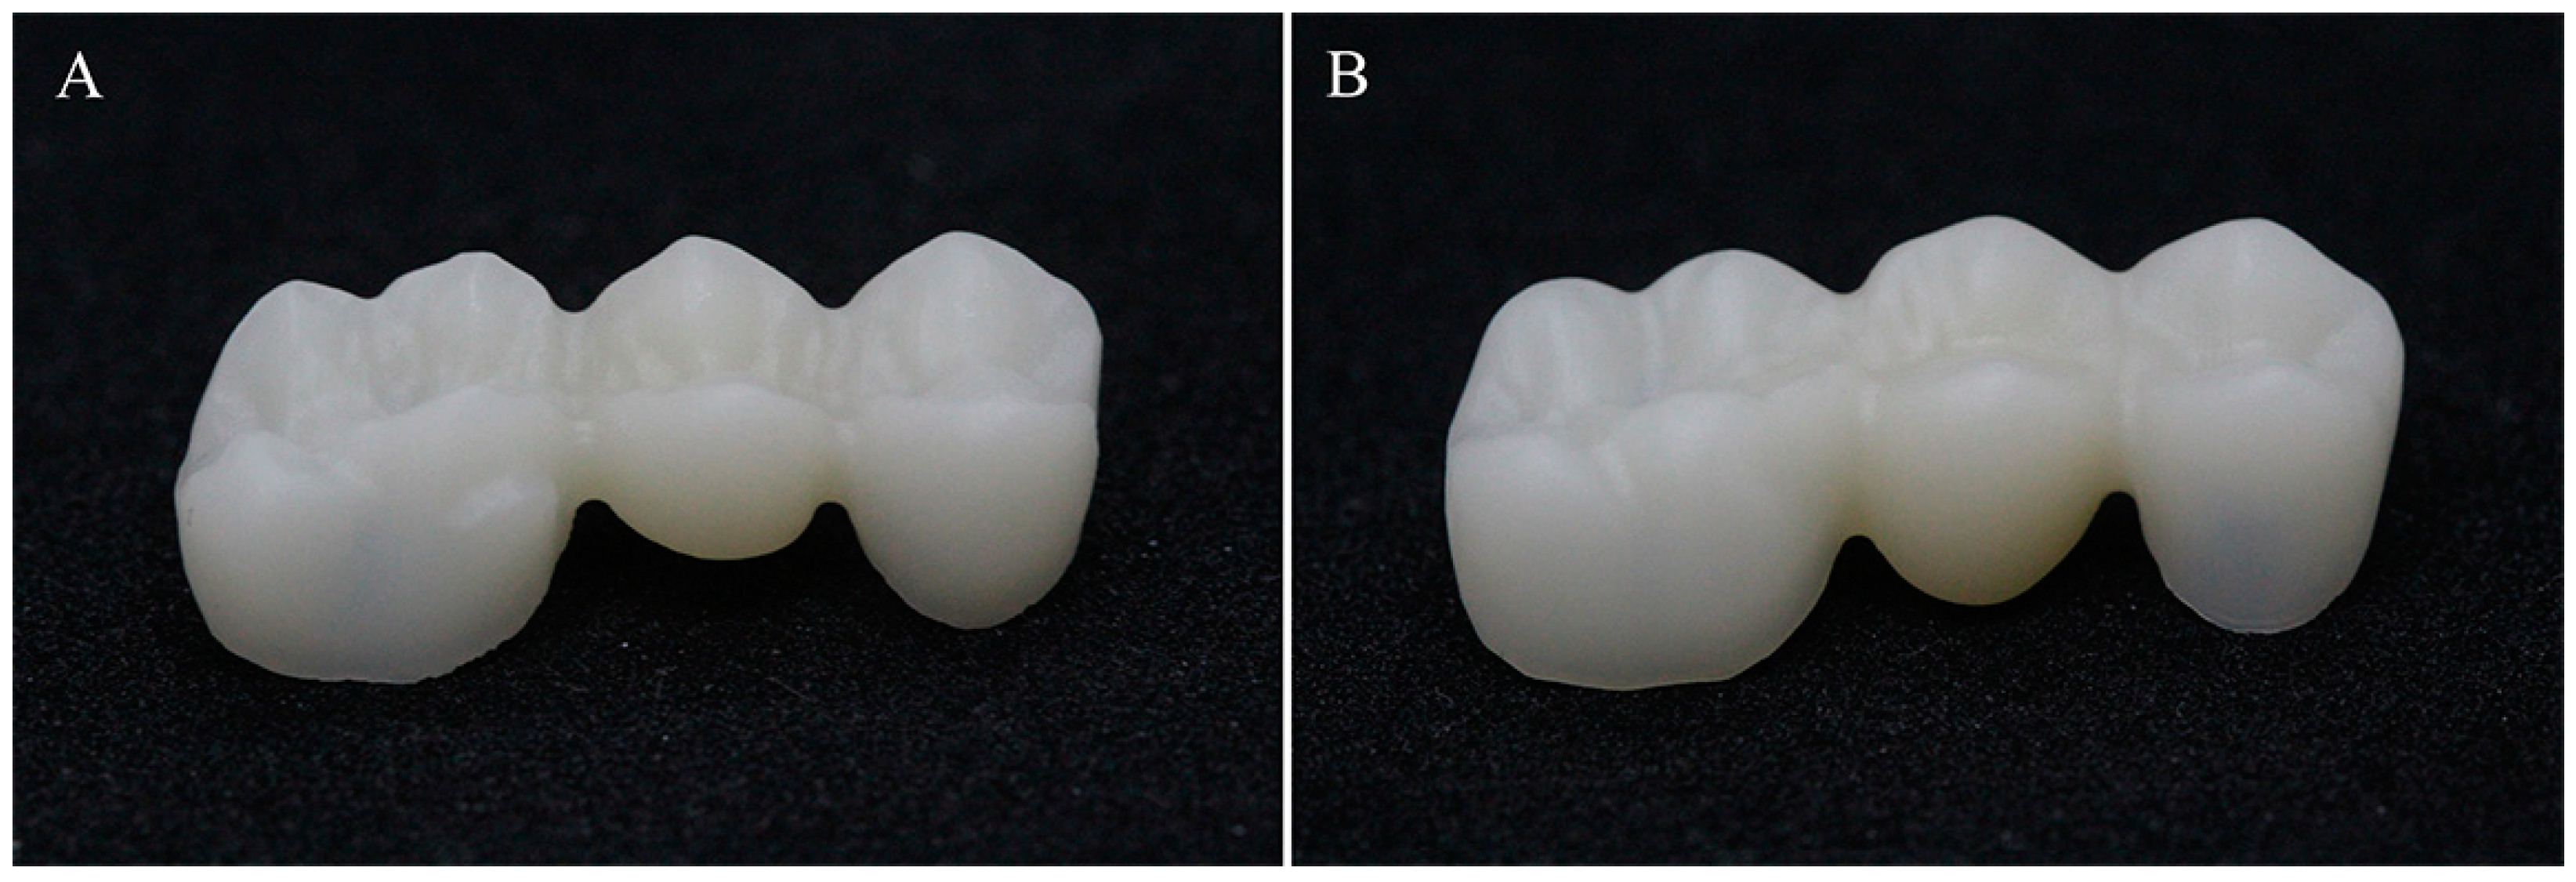
2.1. Sample Preparation
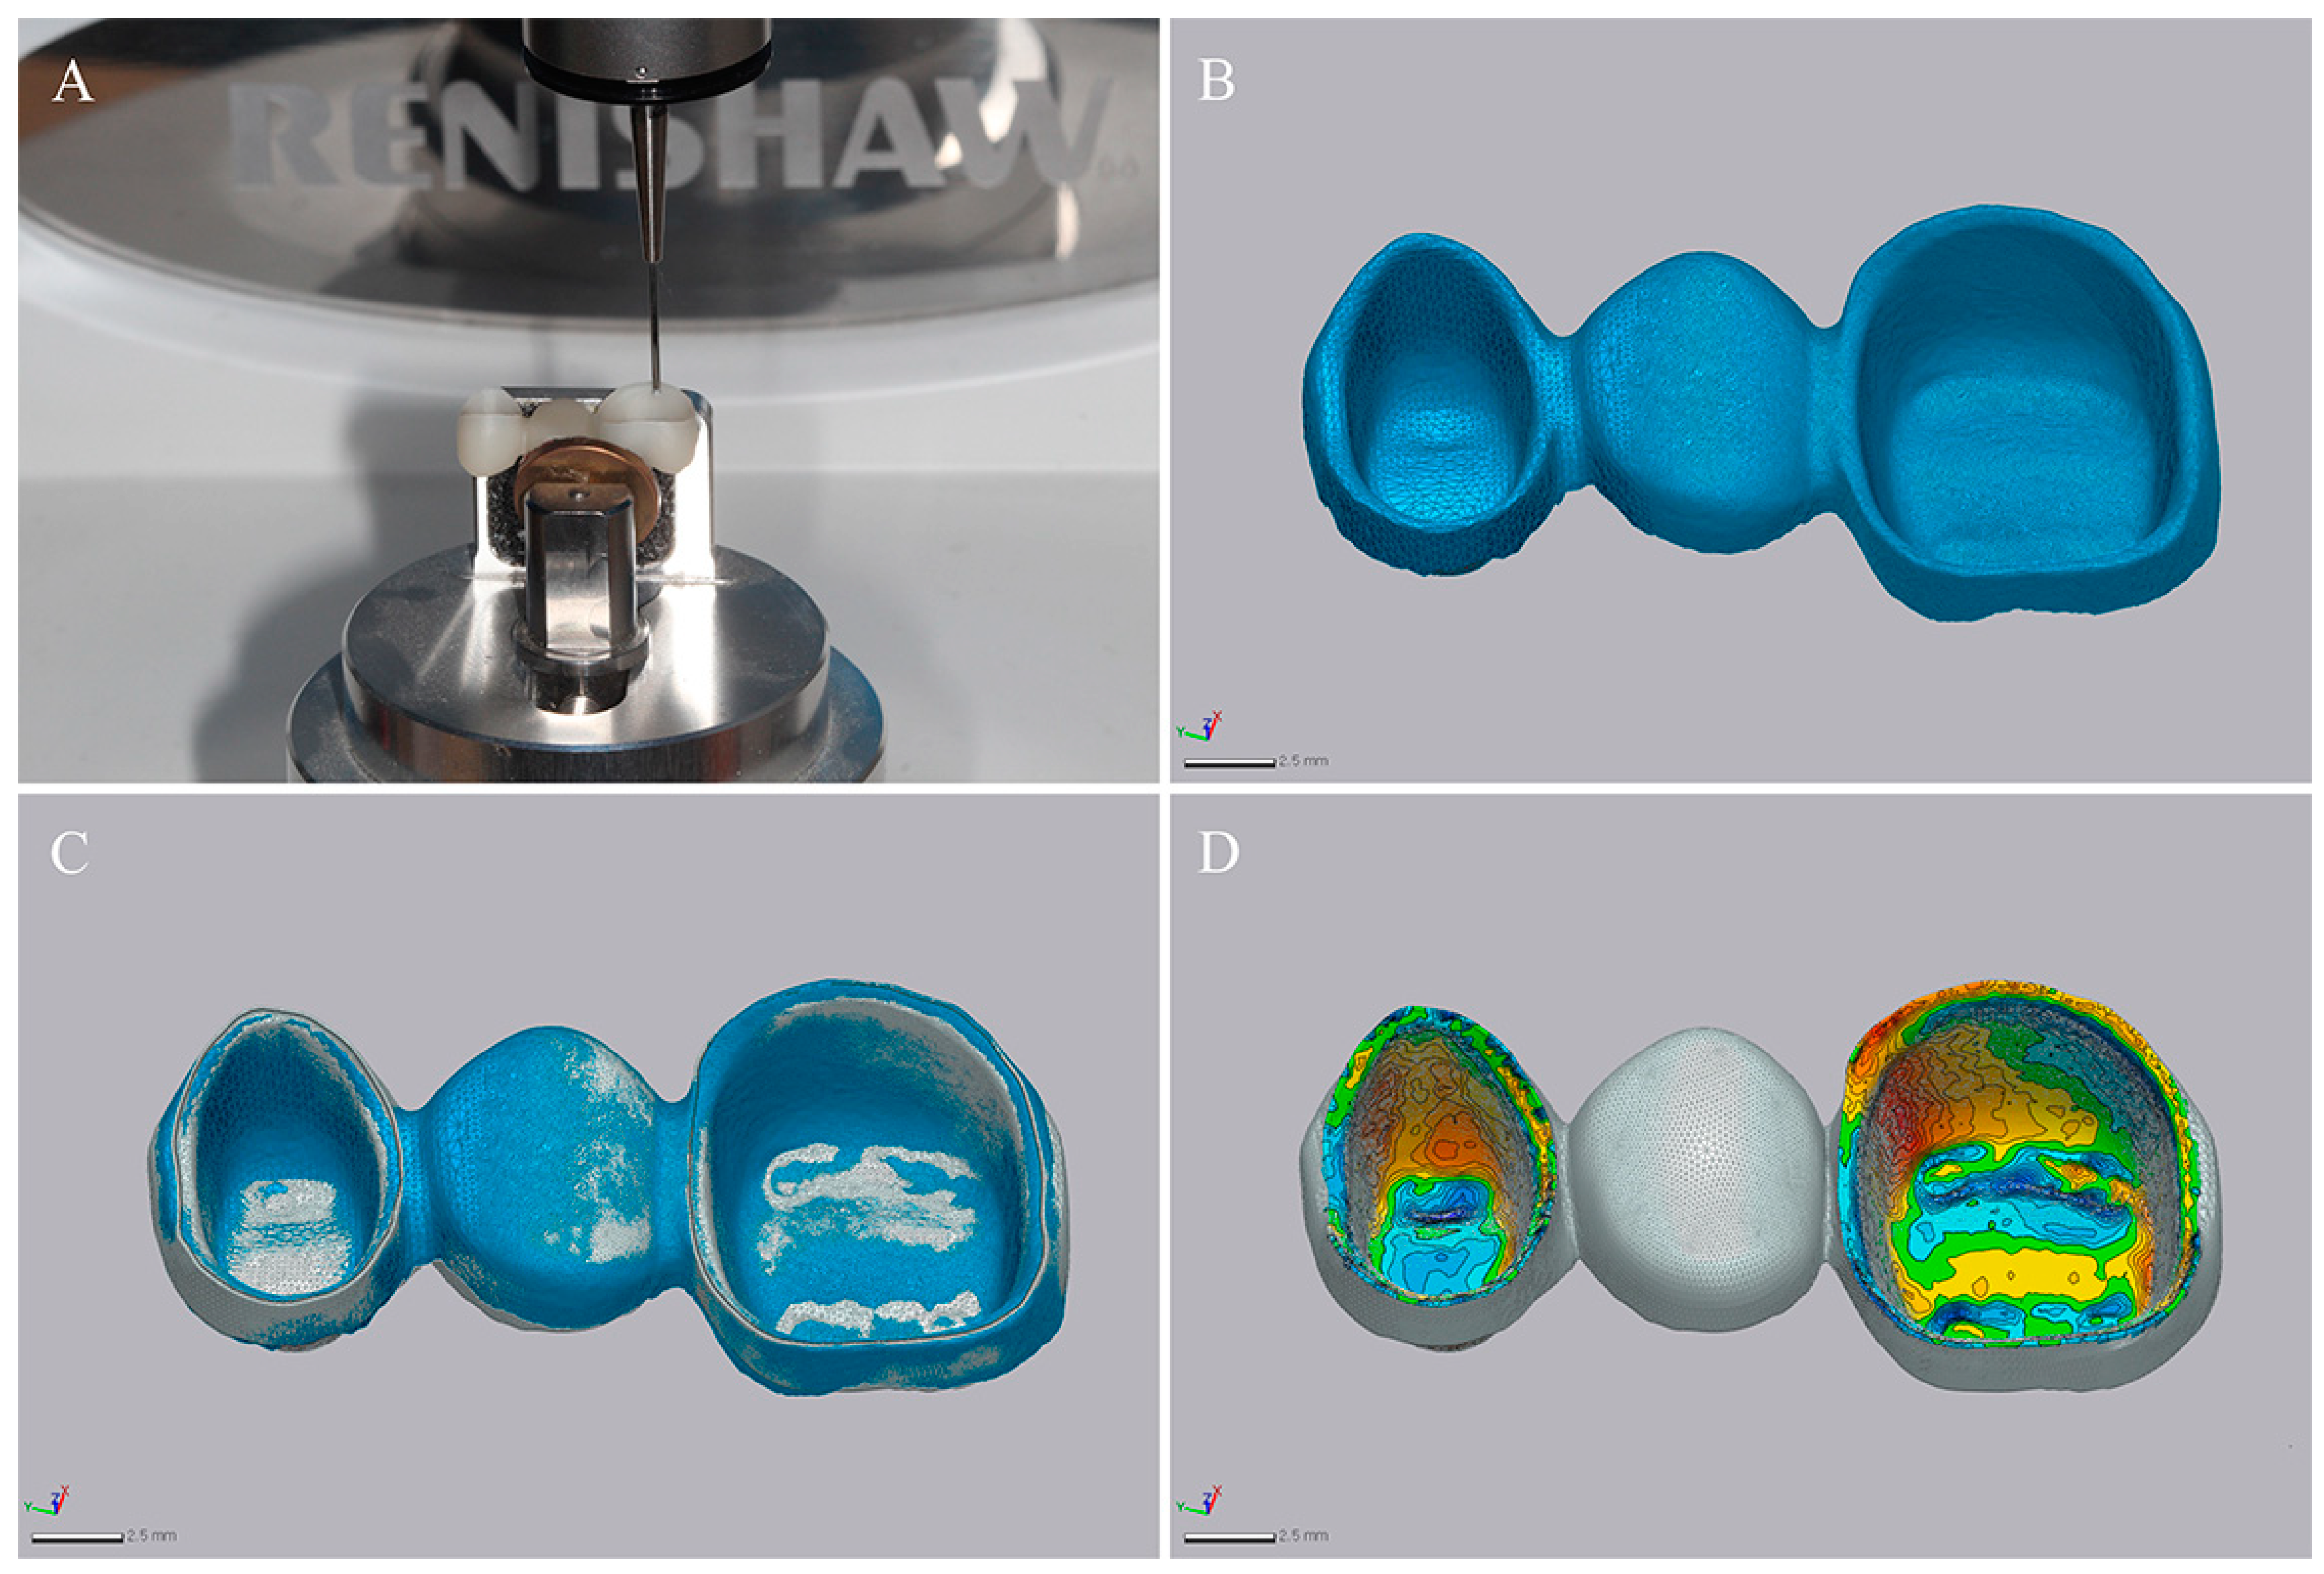
2.2. Evaluation of Trueness
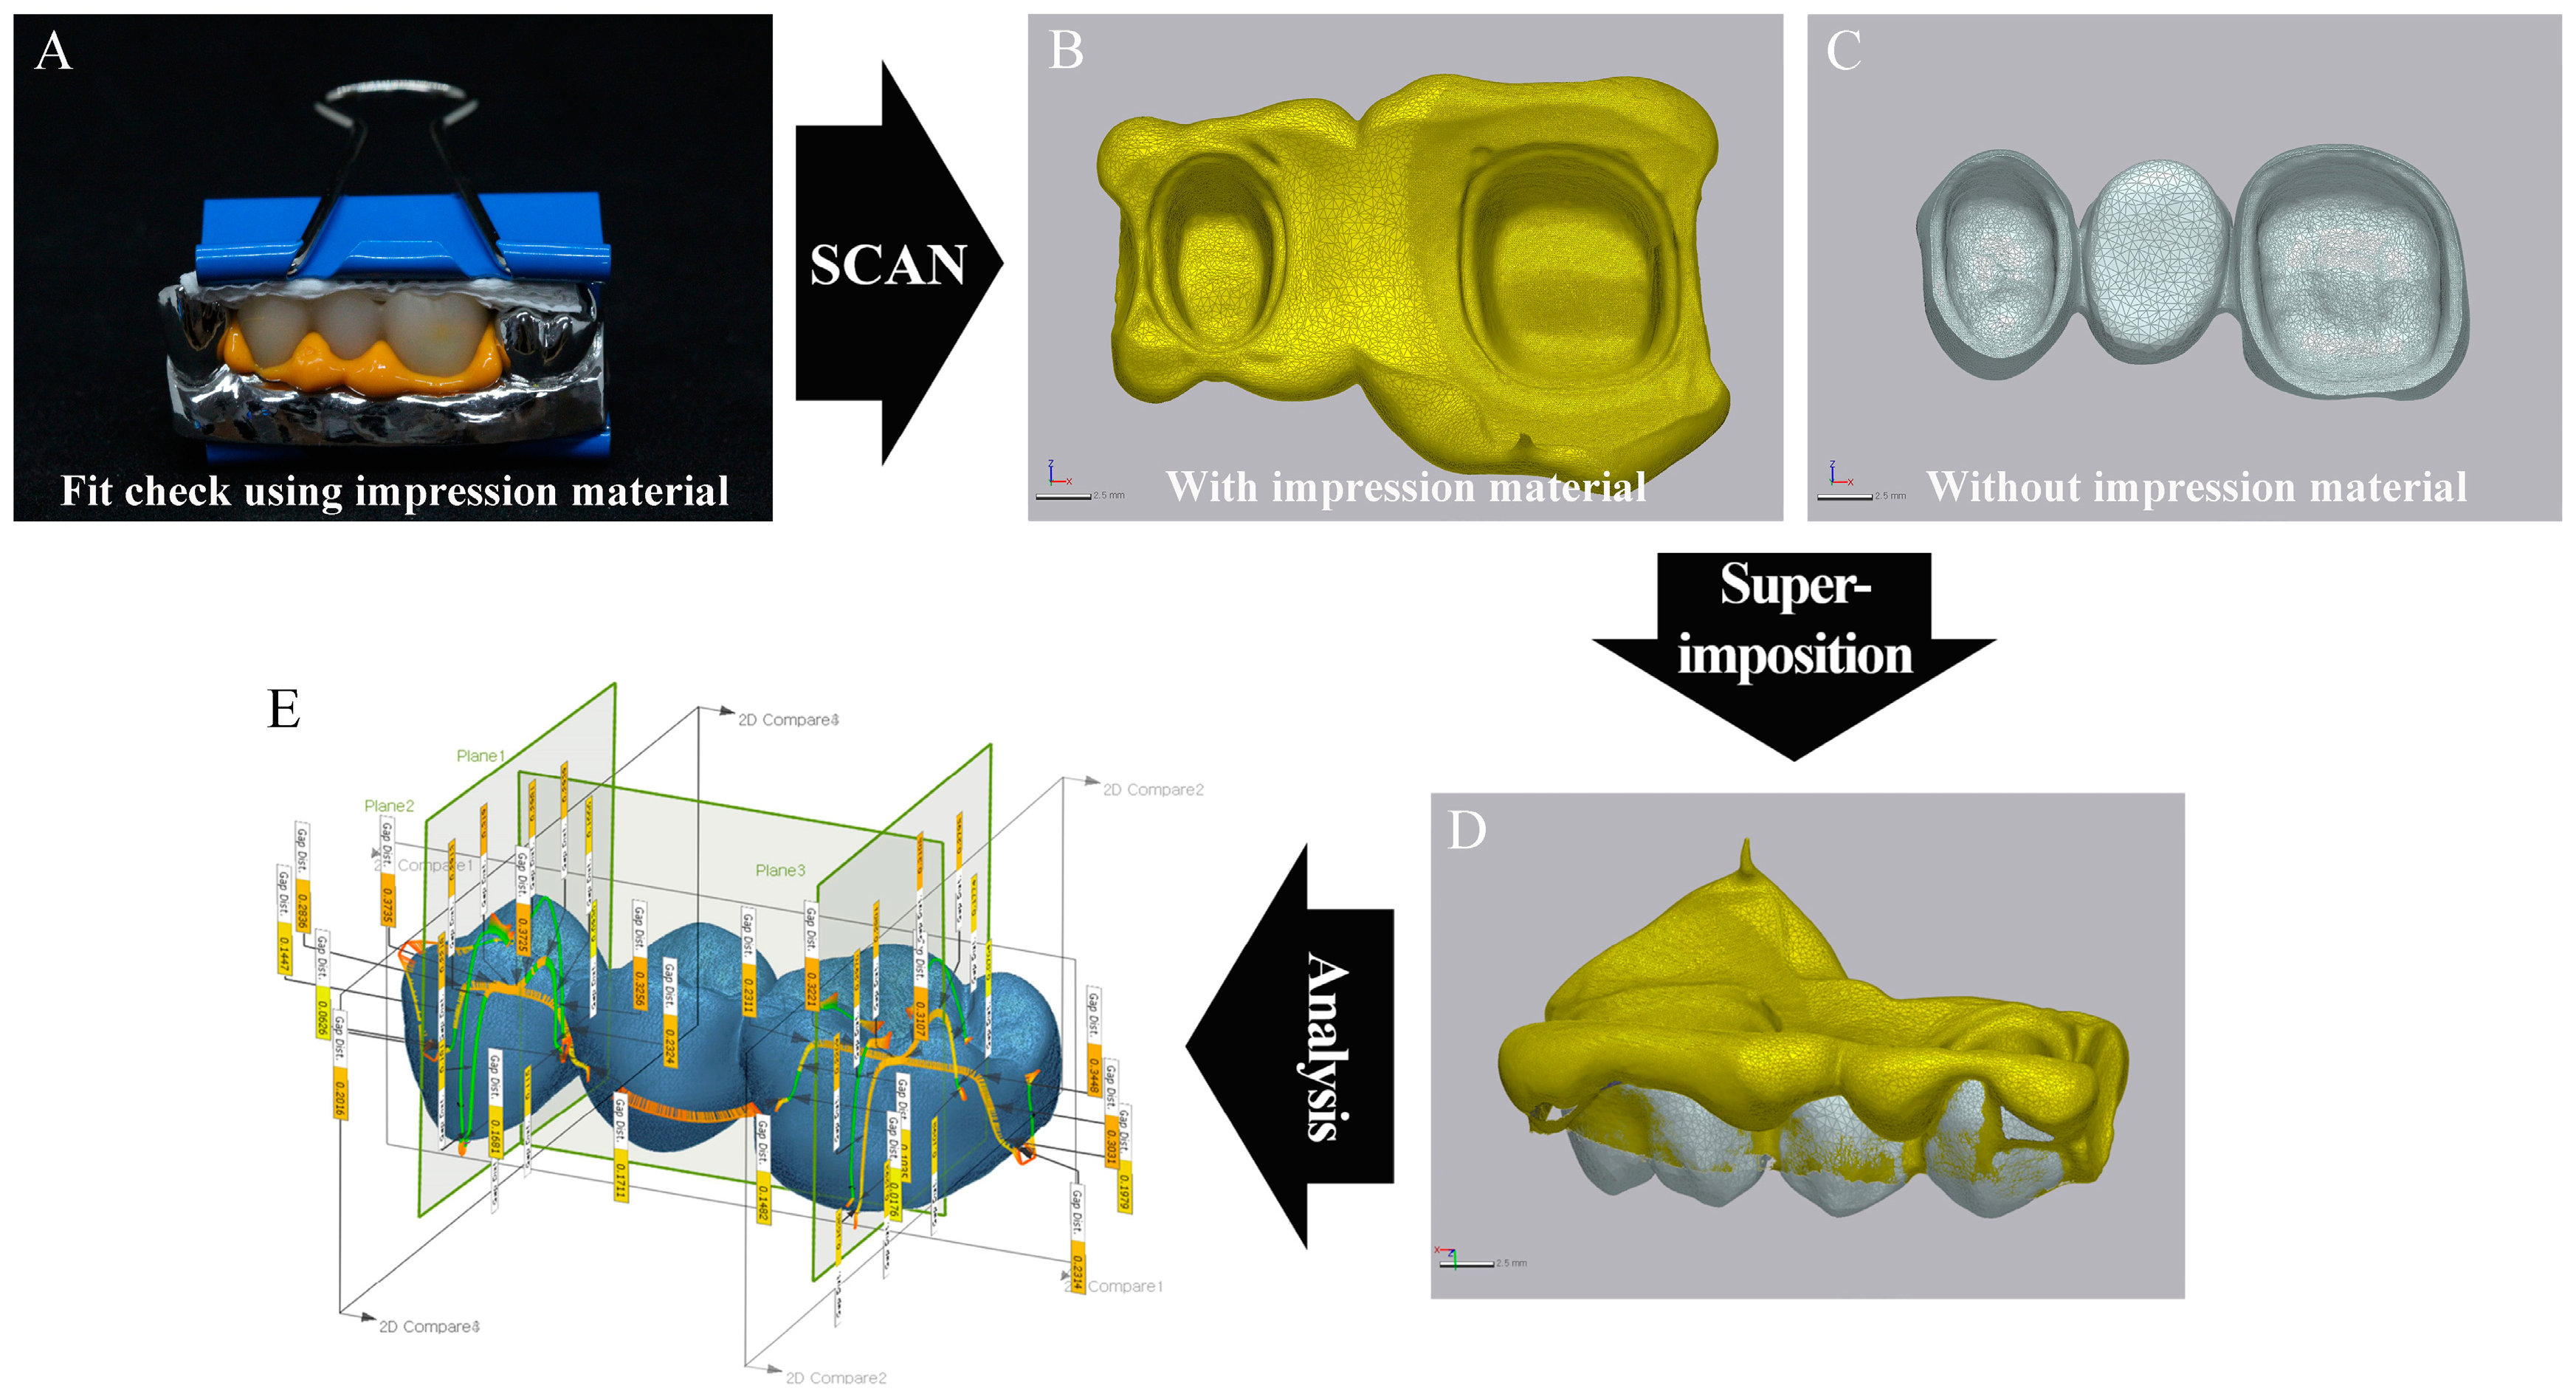
2.3. Evaluation of Fitness
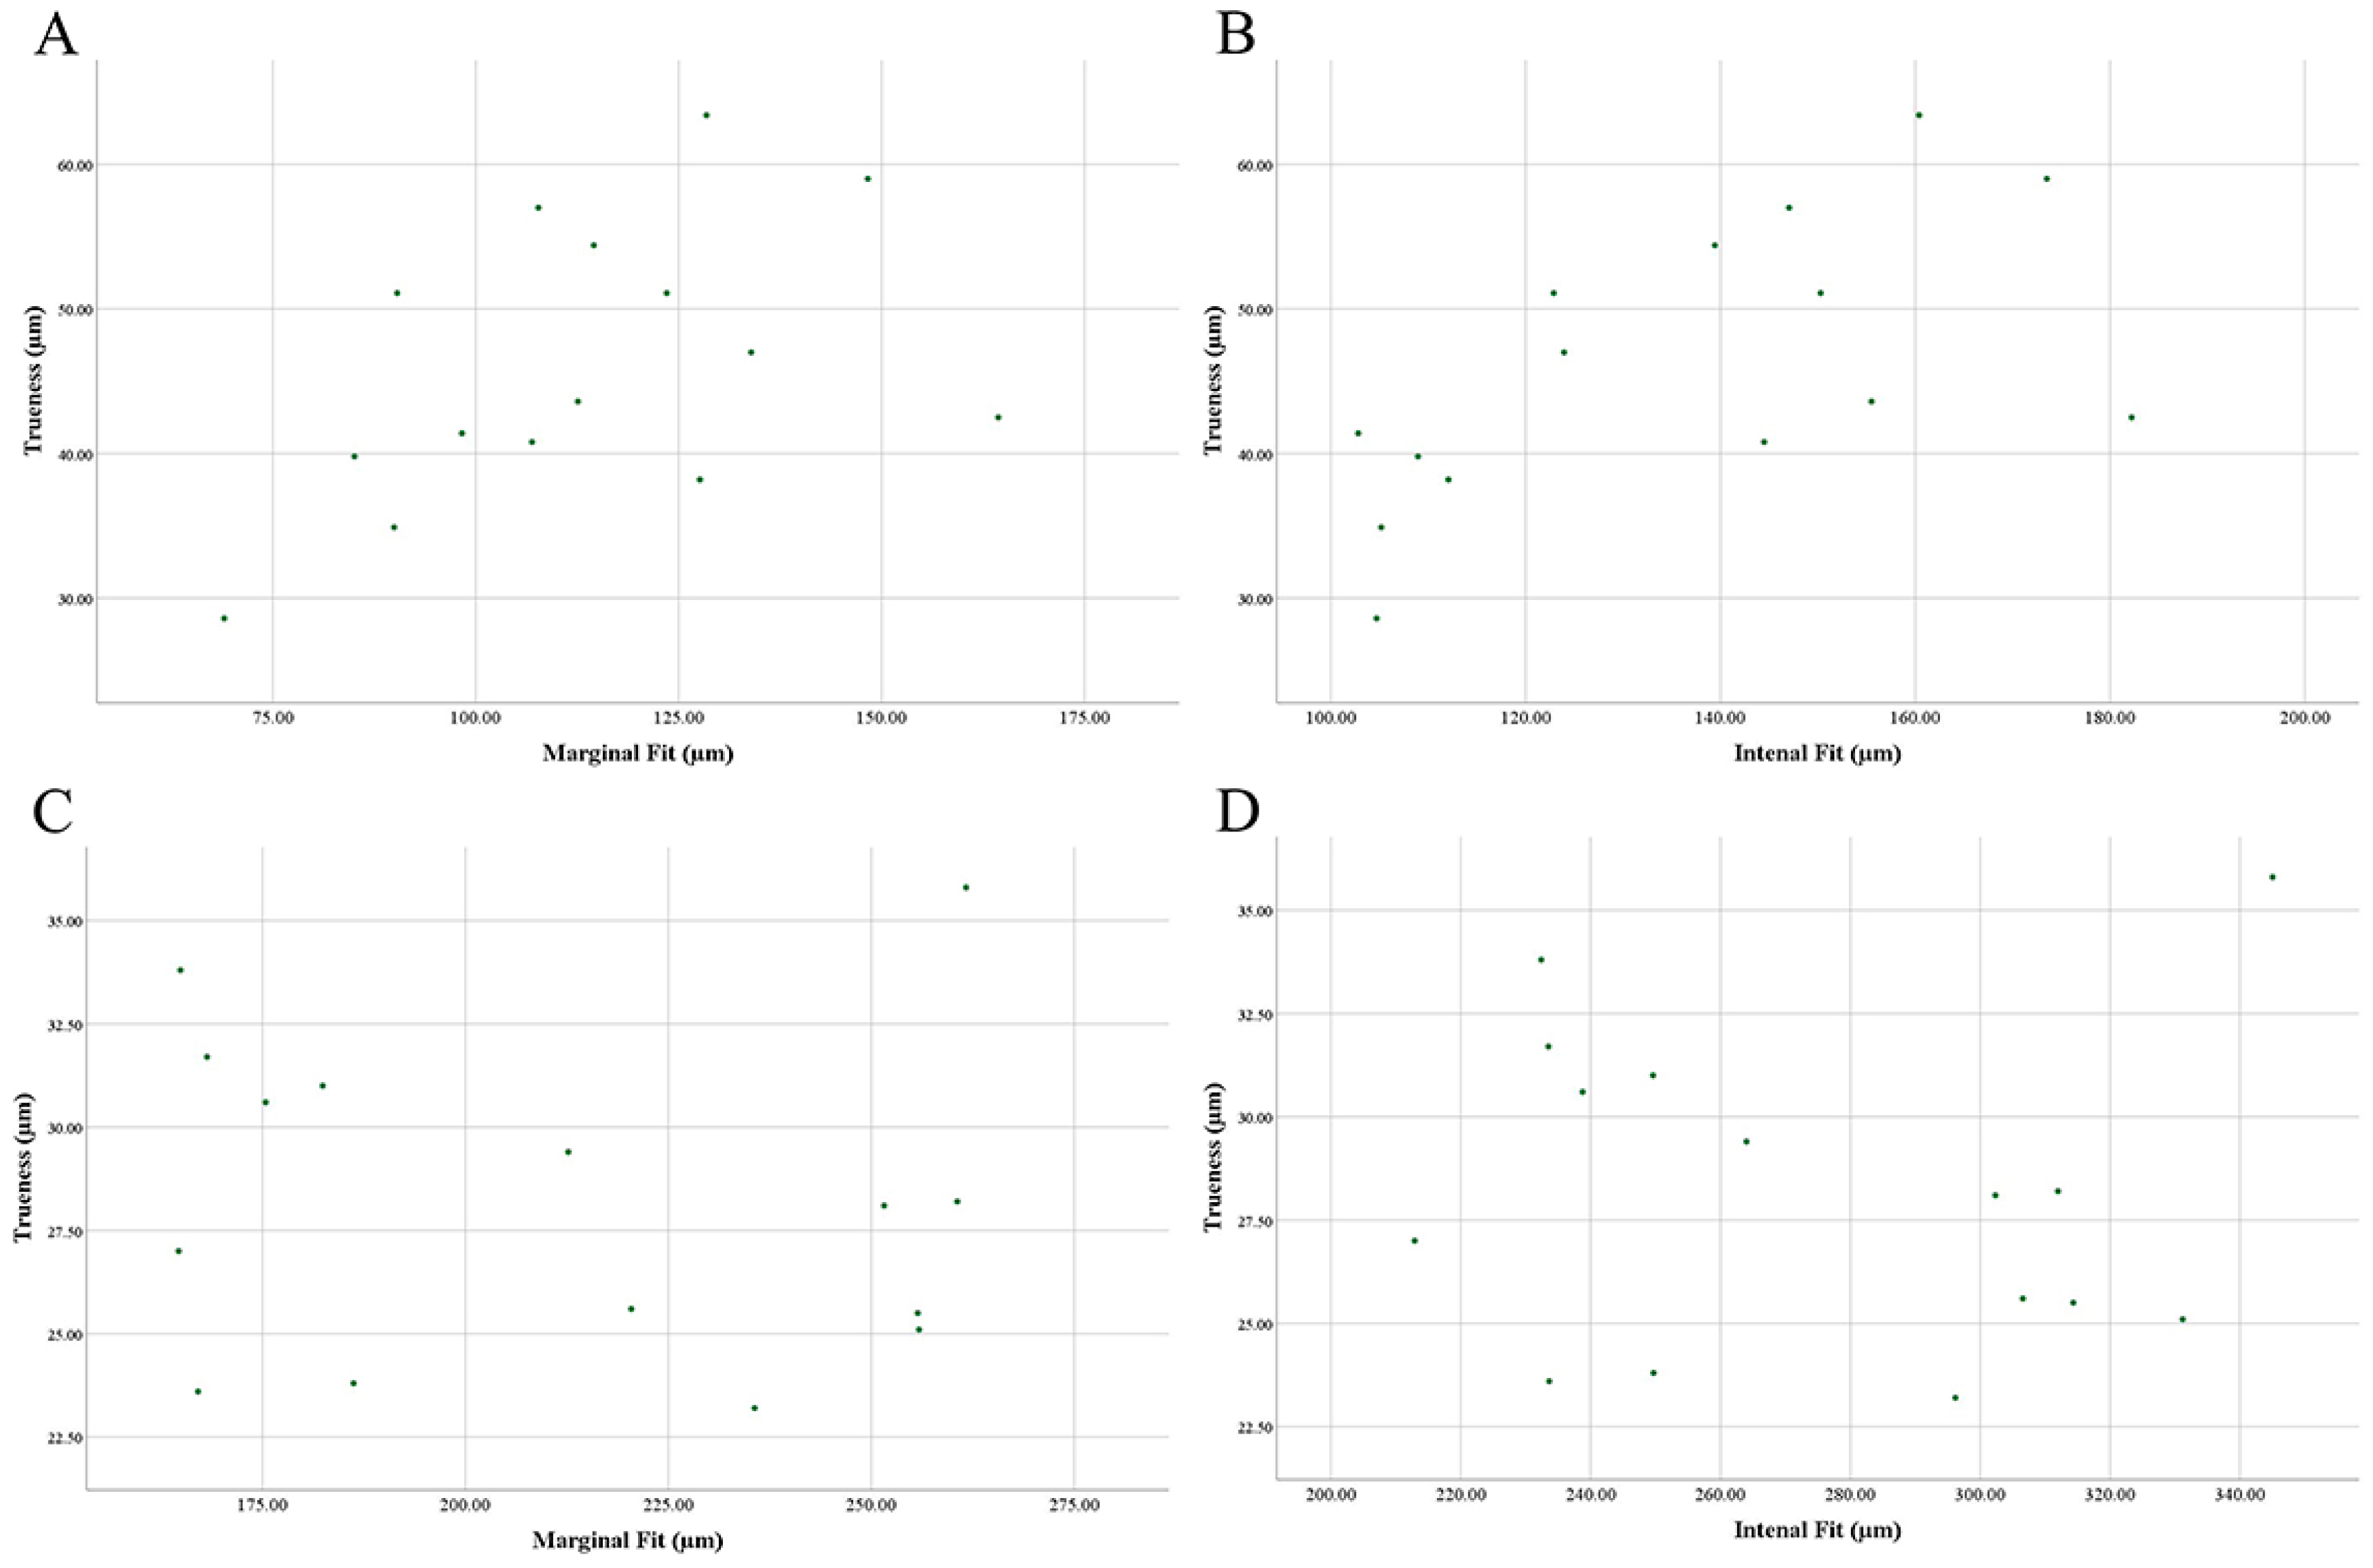
2.4. Statistical Analysis
3. Results
4. Discussion
5. Conclusions
Author Contributions
Funding
Acknowledgments
Conflicts of Interest
References
- Park, G.-H.; Son, K.; Lee, K.-B. Feasibility of using an intraoral scanner for a complete-arch digital scan. J. Prosthet. Dent. 2019, 121, 803–810. [Google Scholar] [CrossRef] [PubMed]
- Abduo, J. Accuracy of casts produced from conventional and digital workflows: A qualitative and quantitative analyses. J. Adv. Prosthodont. 2019, 11, 138–146. [Google Scholar] [CrossRef] [PubMed]
- Jeon, J.-H.; Hwang, S.-S.; Kim, J.-H.; Kim, W.-C. Trueness and precision of scanning abutment impressions and stone models according to dental CAD/CAM evaluation standards. J. Adv. Prosthodont. 2018, 10, 335–359. [Google Scholar] [CrossRef] [PubMed]
- Kim, D.-Y.; Lee, K.-E.; Jeon, J.-H.; Kim, J.-H.; Kim, W.-C. Evaluation of the reproducibility of various abutments using a blue light model scanner. J. Adv. Prosthodont. 2018, 10, 328–334. [Google Scholar] [CrossRef] [PubMed]
- Park, H.-N.; Lim, Y.-J.; Yi, W.-J.; Han, J.-S.; Lee, S.-P. A comparison of the accuracy of intraoral scanners using an intraoral environment simulator. J. Adv. Prosthodont. 2018, 10, 58–64. [Google Scholar] [CrossRef] [PubMed]
- Arezoobakhsh, A.; Shayegh, S.S.; Ghomi, A.J.; Hakimaneh, S.M.R. Comparison of marginal and internal fit of 3-unit zirconia frameworks fabricated with CAD-CAM technology using direct and indirect digital scans. J. Prosthet. Dent. 2019. [Google Scholar] [CrossRef] [PubMed]
- Park, J.-M.; Kim, R.J.-Y.; Lee, K.-W. Comparative reproducibility analysis of 6 intraoral scanners used on complex intracoronal preparations. J. Prosthet. Dent. 2019. [Google Scholar] [CrossRef] [PubMed]
- Aranda Yus, E.; Cantarell, J.M.A.; Miñarro Alonso, A. Comparison of the marginal fit of milled yttrium stabilized zirconium dioxide crowns obtained by scanning silicone impressions and by scanning stone replicas. J. Adv. Prosthodont. 2018, 10, 236–244. [Google Scholar] [CrossRef]
- Alqarni, H.; AlHelal, A.; Kattadiyil, M.T.; Goodacre, C.J. Selective implant scan body modification to restore severely tilted adjacent implants: A completely digital workflow. J. Prosthet. Dent. 2019. [Google Scholar] [CrossRef]
- Mangano, F.; Gandolfi, A.; Luongo, G.; Logozzo, S. Intraoral scanners in dentistry: A review of the current literature. BMC Oral Health 2017, 17, 149. [Google Scholar] [CrossRef]
- Sadid-Zadeh, R.; Katsavochristou, A.; Squires, T.; Simon, M. Accuracy of marginal fit and axial wall contour for lithium disilicate crowns fabricated using three digital workflows. J. Prosthet. Dent. 2019. [Google Scholar] [CrossRef] [PubMed]
- Son, K.; Lee, S.; Kang, S.H.; Park, J.; Lee, K.-B.; Jeon, M. A Comparison Study of Marginal and Internal Fit Assessment Methods for Fixed Dental Prostheses. J. Clin. Med. 2019, 8, 785. [Google Scholar] [CrossRef] [PubMed]
- Son, K.; Yu, B.Y.; Yoon, T.H.; Lee, K.-B. Comparative Study of the Trueness of the Inner Surface of Crowns Fabricated from Three Types of Lithium Disilicate Blocks. Appl. Sci. 2019, 9, 1798. [Google Scholar] [CrossRef]
- Woo, H.-W.; Cho, S.-A.; Lee, C.-H.; Lee, K.-B.; Cho, J.-H.; Lee, D.-H. Precision of the milled full-arch framework fabricated using pre-sintered soft alloy: A pilot study. J. Adv. Prosthodont. 2018, 10, 128–131. [Google Scholar] [CrossRef] [PubMed] [Green Version]
- Şen, N.; Şermet, I.B.; Gürler, N. Sealing capability and marginal fit of titanium versus zirconia abutments with different connection designs. J. Adv. Prosthodont. 2019, 11, 105–111. [Google Scholar] [CrossRef] [PubMed] [Green Version]
- Ji, M.-K.; Park, J.-H.; Park, S.-W.; Yun, K.-D.; Oh, G.-J.; Lim, H.-P. Evaluation of marginal fit of 2 CAD-CAM anatomic contour zirconia crown systems and lithium disilicate glass-ceramic crown. J. Adv. Prosthodont. 2015, 7, 271–277. [Google Scholar] [CrossRef] [PubMed] [Green Version]
- Lee, W.-S.; Kim, W.-C.; Kim, H.-Y.; Kim, W.-T.; Kim, J.-H. Evaluation of different approaches for using a laser scanner in digitization of dental impressions. J. Adv. Prosthodont. 2014, 6, 22–29. [Google Scholar] [CrossRef] [PubMed] [Green Version]
- Ha, S.-J.; Cho, J.-H. Comparison of the fit accuracy of zirconia-based prostheses generated by two CAD/CAM systems. J. Adv. Prosthodont. 2016, 8, 439–448. [Google Scholar] [CrossRef] [PubMed] [Green Version]
- Kang, S.-Y.; Park, J.-H.; Kim, J.-H.; Kim, W.-C. Accuracy of provisional crowns made using stereolithography apparatus and subtractive technique. J. Adv. Prosthodont. 2018, 10, 354–360. [Google Scholar] [CrossRef] [PubMed]
- Jeong, I.I.D.; Kim, W.-C.; Park, J.; Kim, C.-M.; Kim, J.-H. Ceramic molar crown reproducibility by digital workflow manufacturing: An in vitro study. J. Adv. Prosthodont. 2017, 9, 252–256. [Google Scholar] [CrossRef] [Green Version]
- Wang, W.; Yu, H.; Liu, Y.; Jiang, X.; Gao, B. Trueness analysis of zirconia crowns fabricated with 3-dimensional printing. J. Prosthet. Dent. 2019, 121, 285–291. [Google Scholar] [CrossRef] [PubMed]
- Aladağ, A.; Oğuz, D.; Çömlekoğlu, M.E.; Akan, E. In vivo wear determination of novel CAD/CAM ceramic crowns by using 3D alignment. J. Adv. Prosthodont. 2019, 11, 120–127. [Google Scholar] [CrossRef] [PubMed]
- Weigl, P.; Sander, A.; Wu, Y.; Felber, R.; Lauer, H.-C.; Rosentritt, M. In-vitro performance and fracture strength of thin monolithic zirconia crowns. J. Adv. Prosthodont. 2018, 10, 79–84. [Google Scholar] [CrossRef] [PubMed]
- Choi, J.-W.; Kim, S.-Y.; Bae, J.-H.; Bae, E.-B.; Huh, J.-B. In vitro study of the fracture resistance of monolithic lithium disilicate, monolithic zirconia, and lithium disilicate pressed on zirconia for three-unit fixed dental prostheses. J. Adv. Prosthodont. 2017, 9, 244–251. [Google Scholar] [CrossRef] [PubMed]
- Lo Russo, L.; Caradonna, G.; Biancardino, M.; De Lillo, A.; Troiano, G.; Guida, L. Digital versus conventional workflow for the fabrication of multiunit fixed prostheses: A systematic review and meta-analysis of vertical marginal fit in controlled in vitro studies. J. Prosthet. Dent. 2019. [Google Scholar] [CrossRef]
- Örtorp, A.; Jönsson, D.; Mouhsen, A.; von Steyern, P.V. The fit of cobalt–chromium three-unit fixed dental prostheses fabricated with four different techniques: A comparative in vitro study. Dent. Mater. 2011, 27, 356–363. [Google Scholar] [CrossRef]
- Varol, S.; Kulak-Özkan, Y. In Vitro Comparison of Marginal and Internal Fit of Press-on-Metal Ceramic (PoM) Restorations with Zirconium-Supported and Conventional Metal Ceramic Fixed Partial Dentures Before and After Veneering. J. Prosthodont. 2015, 24, 387–393. [Google Scholar] [CrossRef]
- Bayramoğlu, E.; Özkan, Y.K.; Yildiz, C. Comparison of marginal and internal fit of press-on-metal and conventional ceramic systems for three-and four-unit implant-supported partial fixed dental prostheses: An in vitro study. J. Prosthet. Dent. 2015, 114, 52–58. [Google Scholar] [CrossRef]
- Massignan Berejuk, H.; Hideo Shimizu, R.; Aparecida de Mattias Sartori, I.; Valgas, L.; Tiossi, R. Vertical microgap and passivity of fit of three-unit implant-supported frameworks fabricated using different techniques. Int. J. Oral Maxillofac. Implants 2014, 29, 1061–1070. [Google Scholar] [CrossRef]
- Park, J.-M. Comparative analysis on reproducibility among 5 intraoral scanners: Sectional analysis according to restoration type and preparation outline form. J. Adv. Prosthodont. 2016, 8, 354–362. [Google Scholar] [CrossRef]
- Kim, C.-M.; Kim, S.-R.; Kim, J.-H.; Kim, H.-Y.; Kim, W.-C. Trueness of milled prostheses according to number of ball-end mill burs. J. Prosthet. Dent. 2016, 115, 624–629. [Google Scholar] [CrossRef] [PubMed]
- Kirsch, C.; Ender, A.; Attin, T.; Mehl, A. Trueness of four different milling procedures used in dental CAD/CAM systems. Clin. Oral Investig. 2017, 21, 551–558. [Google Scholar] [CrossRef] [PubMed]
- Izadi, A.; Vafaee, F.; Shishehian, A.; Roshanaei, G.; Afkari, B.F. Evaluation of dimensional accuracy of dental bridges manufactured with conventional casting technique and CAD/CAM system with Ceramill Sintron blocks using CMM. J. Dent. Res. Dent. Clin. Dent. Prospects 2018, 12, 264. [Google Scholar] [CrossRef] [PubMed]
- Persson, A.; Andersson, M.; Oden, A.; Sandborgh-Englund, G. A three-dimensional evaluation of a laser scanner and a touch-probe scanner. J. Prosthet. Dent. 2006, 95, 194–200. [Google Scholar] [CrossRef] [PubMed]
- Dimitrova, M. A 3D Evaluation of the Repeatability of Accuracy in Optical and Contact Scanners; Cardiff Metropolitan University: Cardiff, UK, 2017. [Google Scholar]


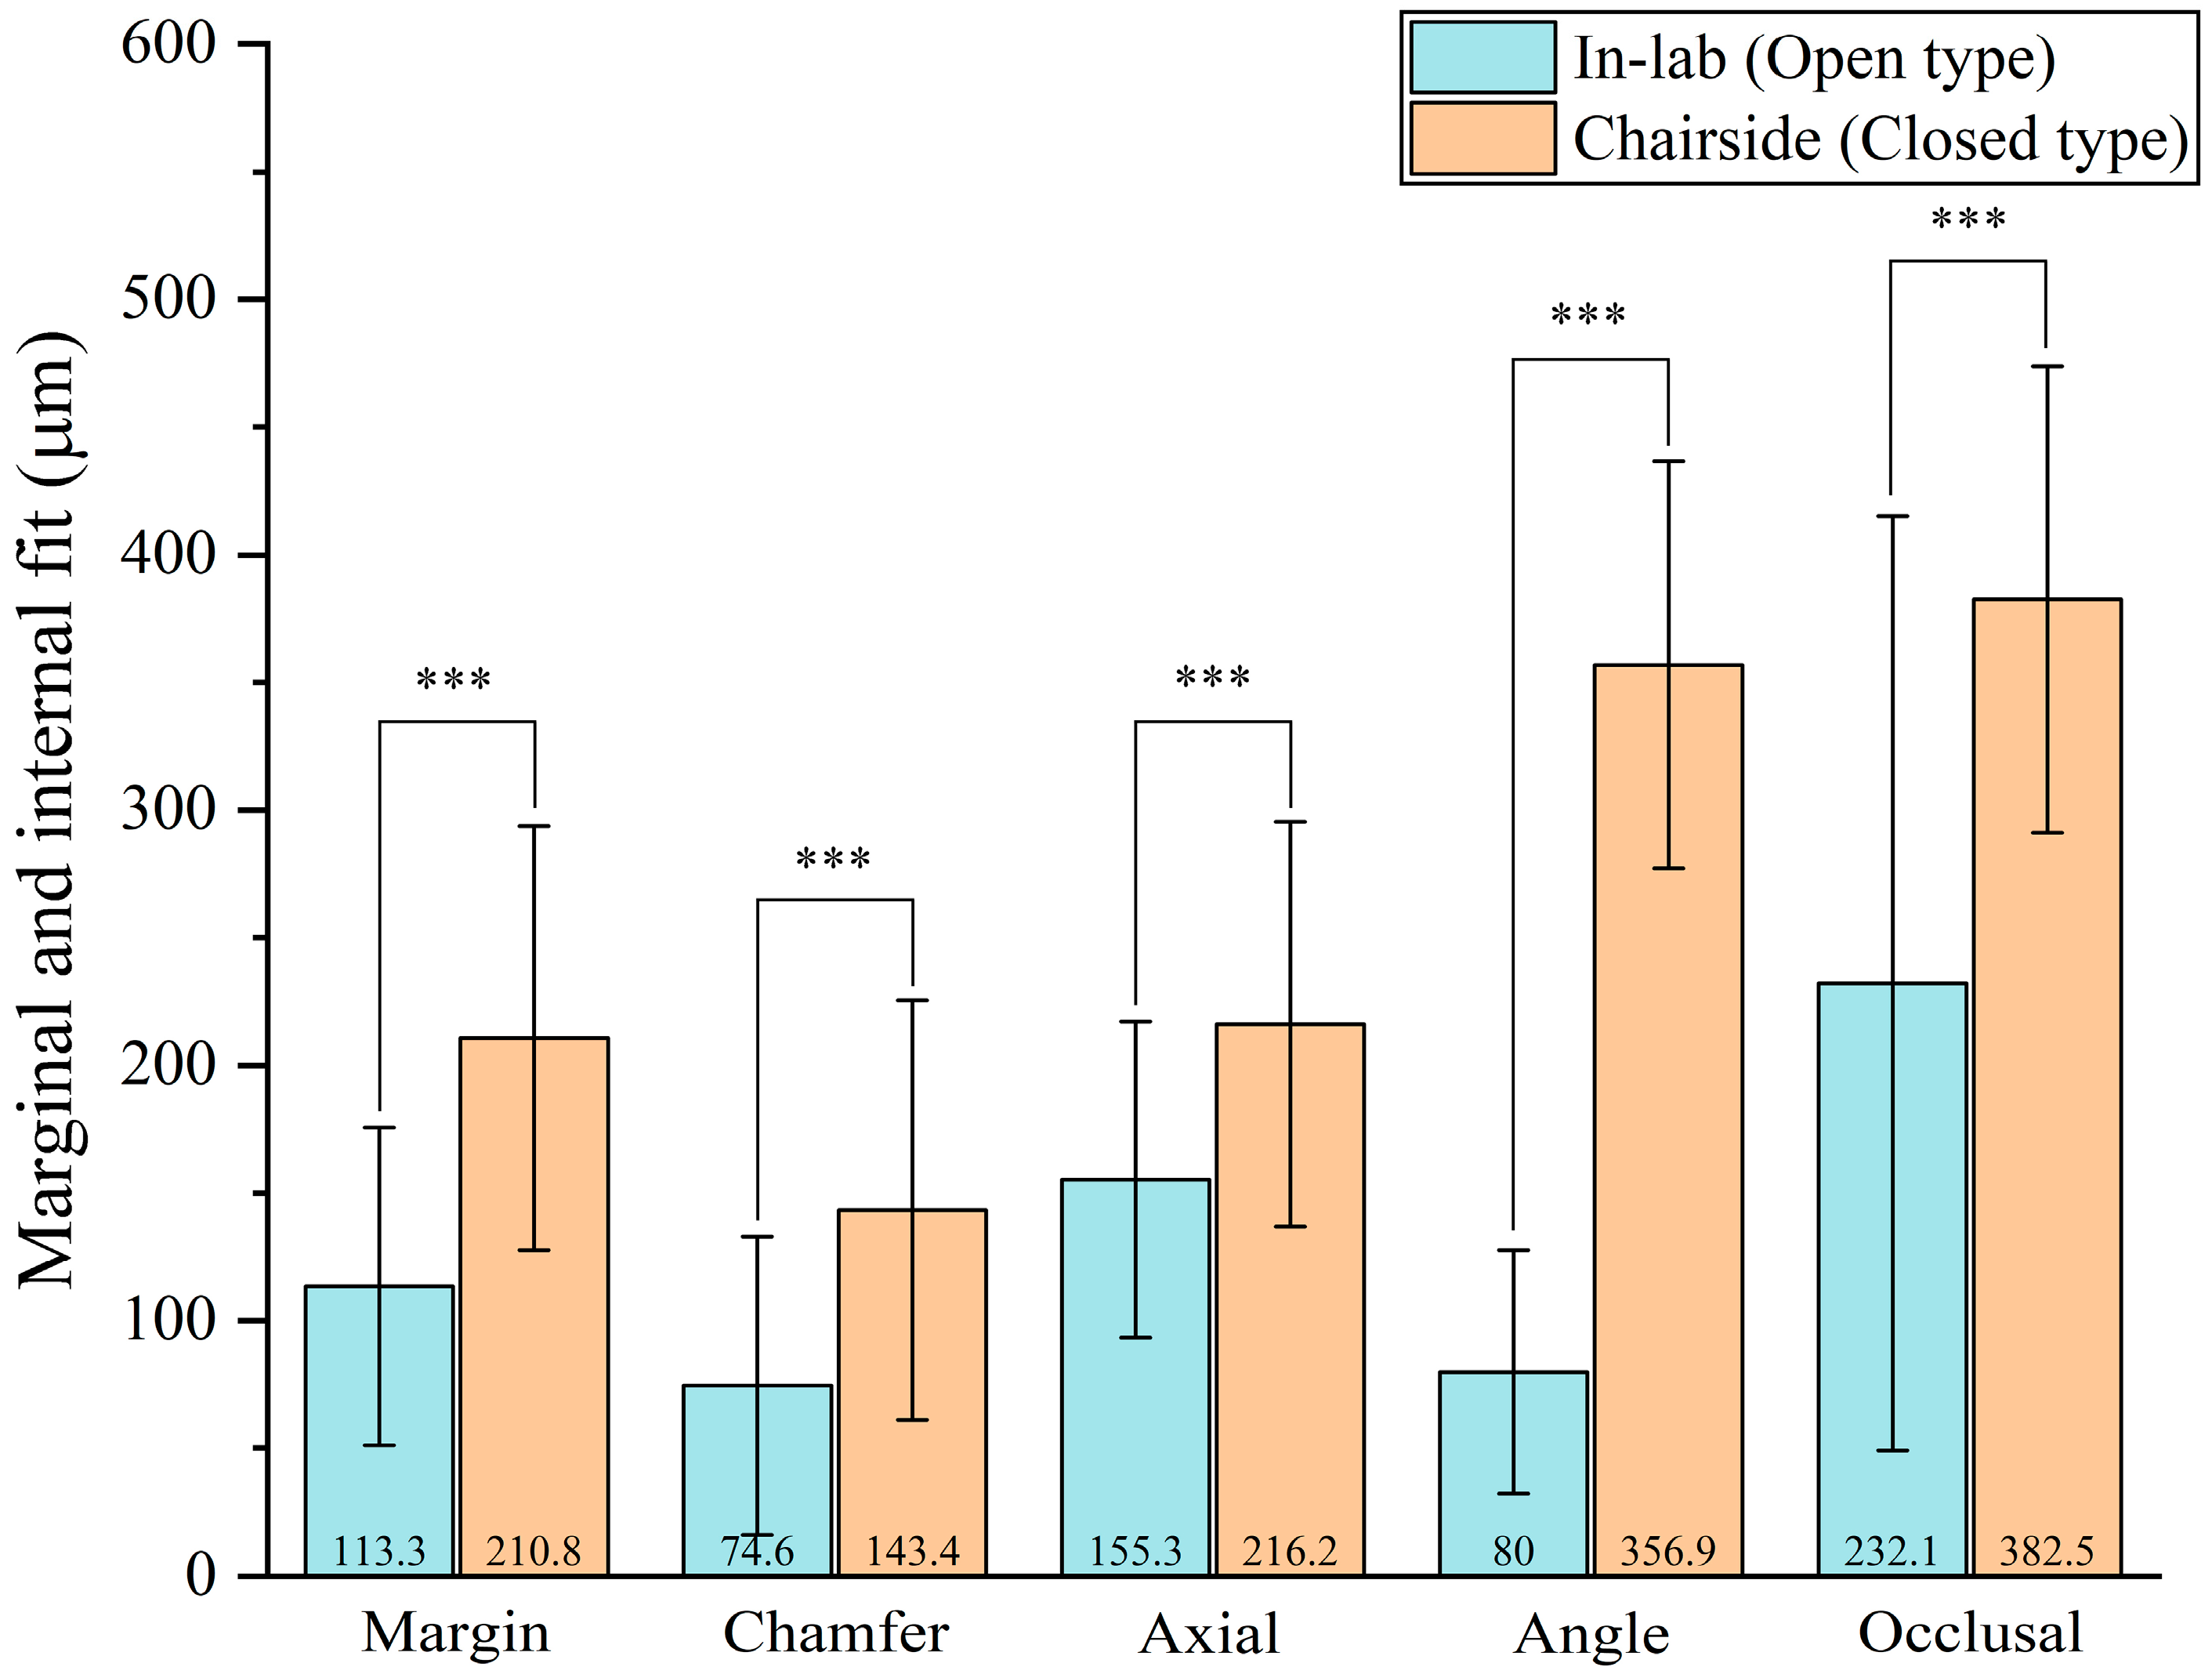
| System | Margin | Chamfer | Axial | Angle | Occlusal |
|---|---|---|---|---|---|
| Fitness (µm), Mean ± SD | |||||
| Chairside group | 210.8 ± 83 | 143.4 ± 82.1 | 216.2 ± 79.2 | 356.9 ± 79.6 | 382.5 ± 91.4 |
| In-lab group | 113.3 ± 62.3 | 74.6 ± 58.5 | 155.3 ± 61.9 | 80 ± 47.8 | 232.1 ± 183 |
| P | <0.001 *** | <0.001 *** | <0.001 *** | <0.001 *** | <0.001 *** |
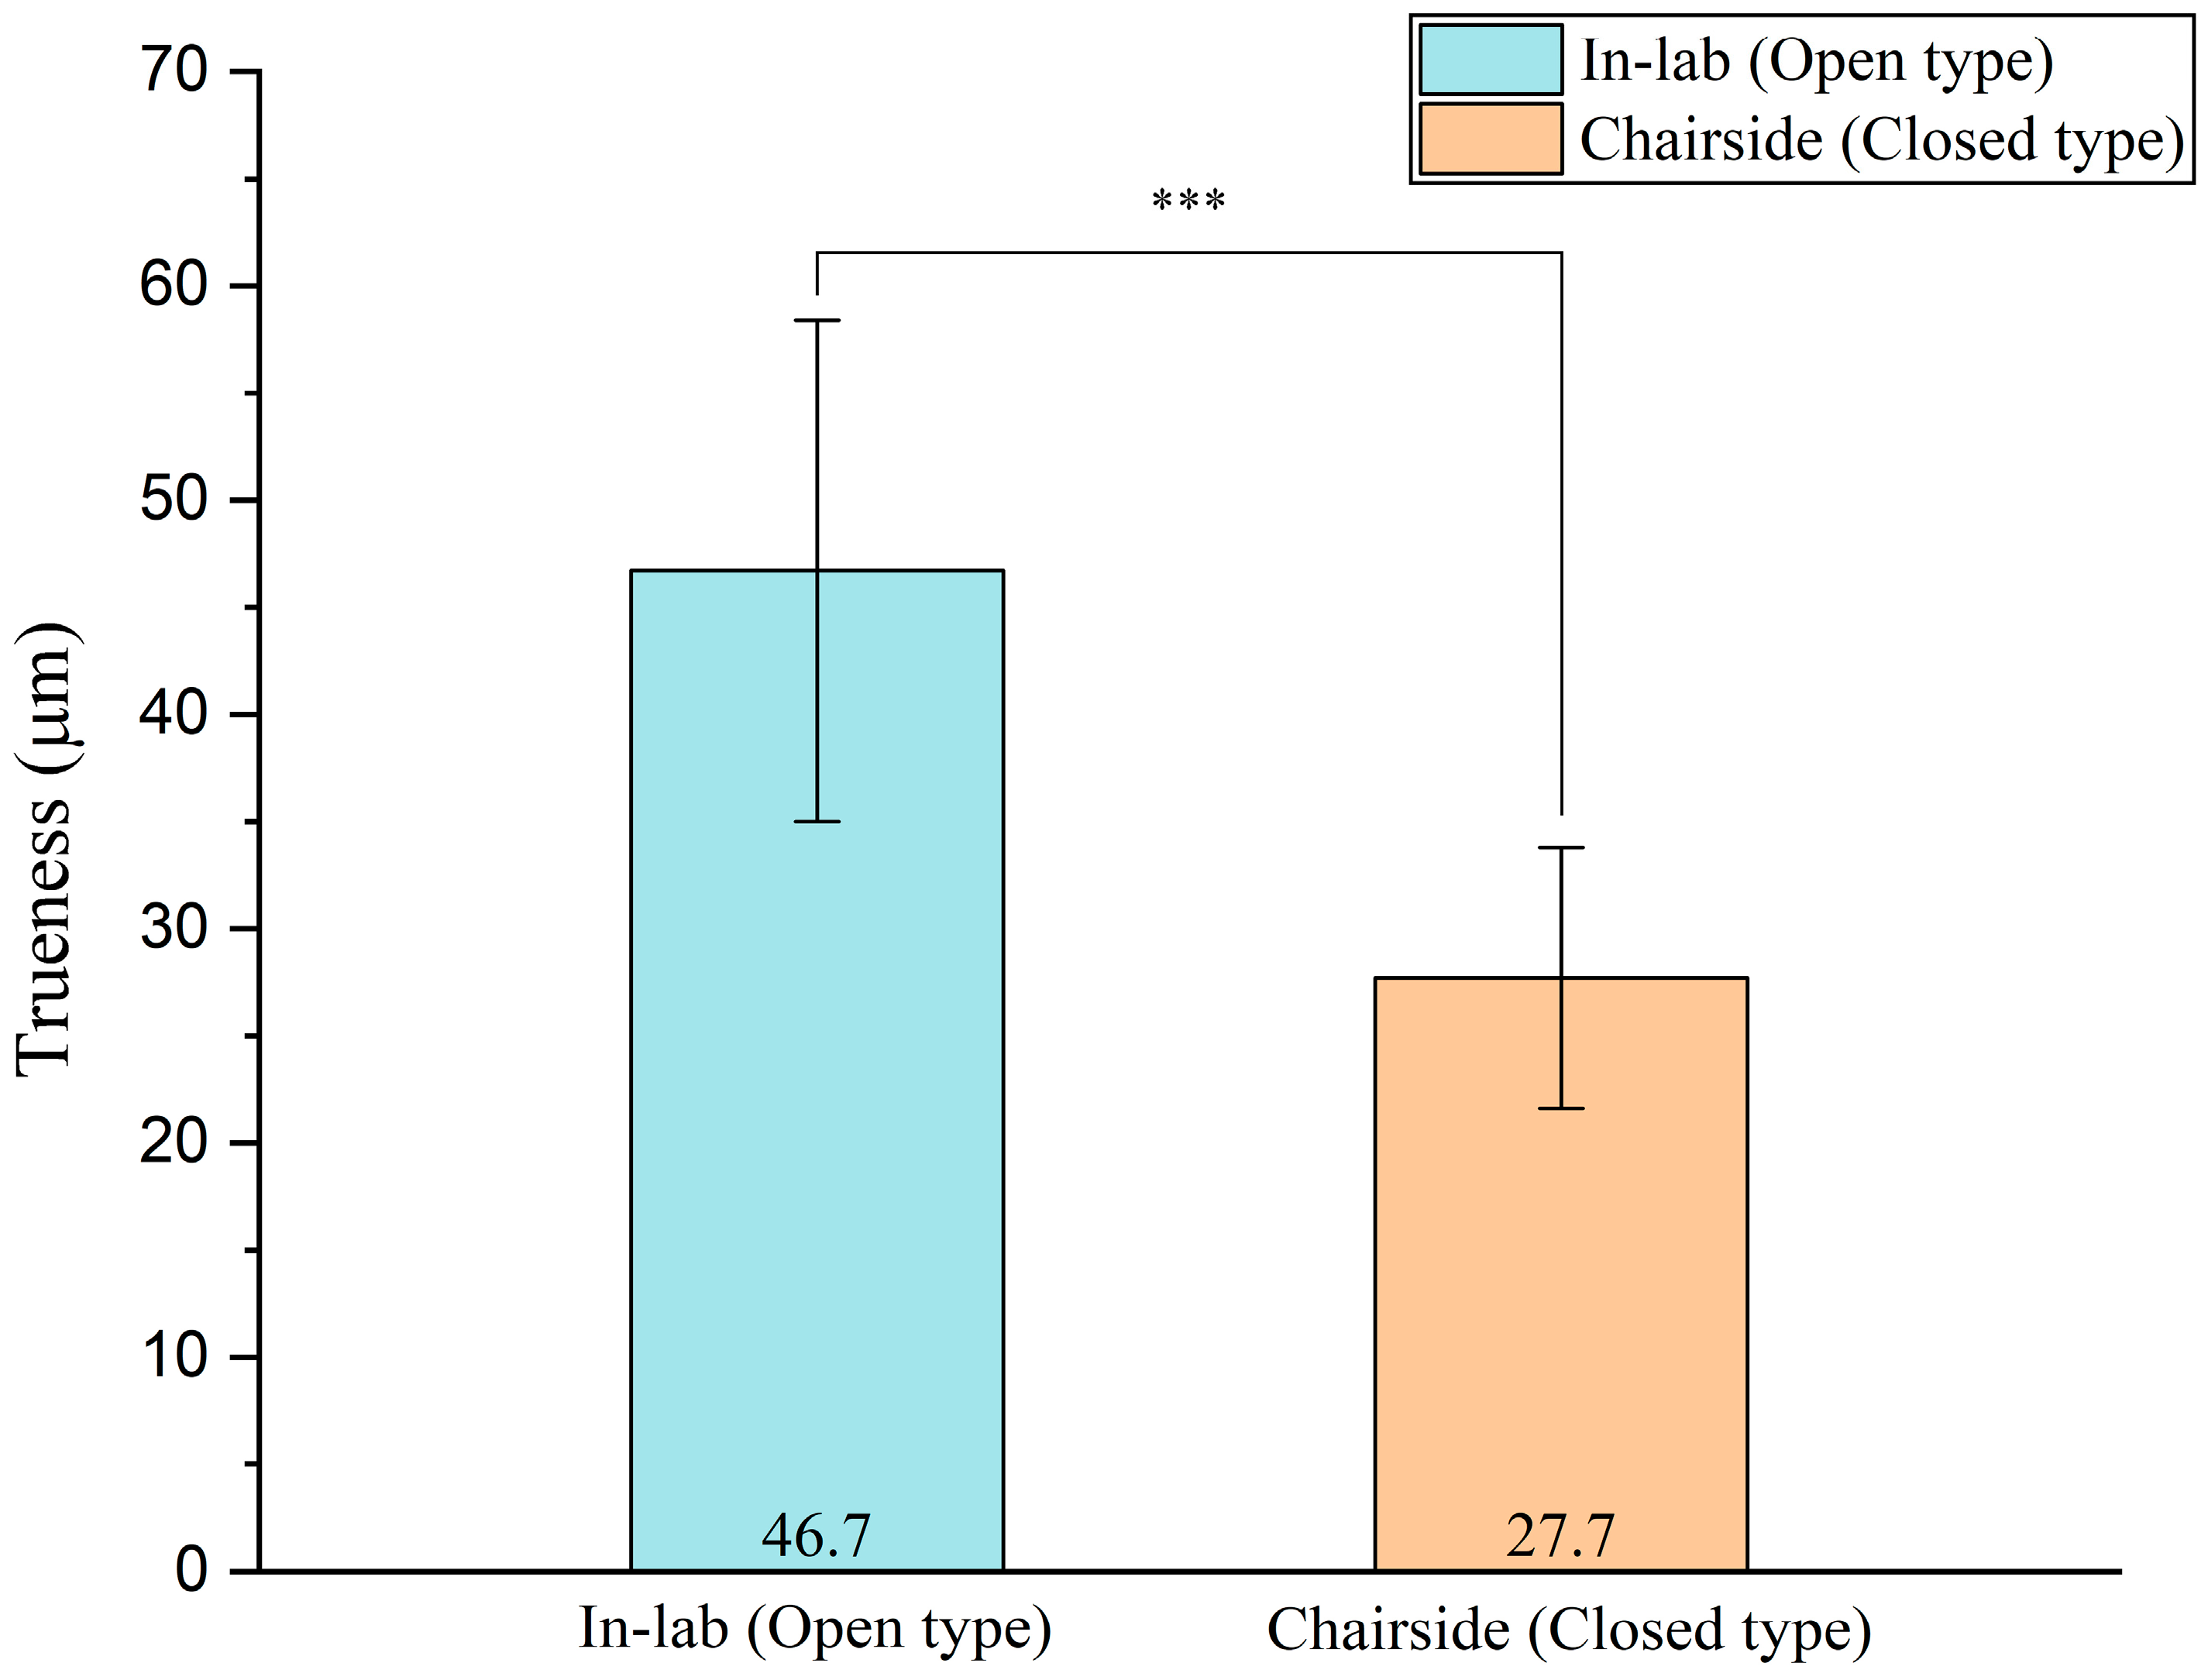
| System | Trueness (µm), Mean ± SD |
|---|---|
| Chairside group | 27.7 ± 6.1 |
| In-lab group | 46.7 ± 11.7 |
| P | <0.001 *** |
© 2019 by the authors. Licensee MDPI, Basel, Switzerland. This article is an open access article distributed under the terms and conditions of the Creative Commons Attribution (CC BY) license (http://creativecommons.org/licenses/by/4.0/).
Share and Cite
Jang, D.; Son, K.; Lee, K.-b. A Comparative Study of the Fitness and Trueness of a Three-Unit Fixed Dental Prosthesis Fabricated Using Two Digital Workflows. Appl. Sci. 2019, 9, 2778. https://doi.org/10.3390/app9142778
Jang D, Son K, Lee K-b. A Comparative Study of the Fitness and Trueness of a Three-Unit Fixed Dental Prosthesis Fabricated Using Two Digital Workflows. Applied Sciences. 2019; 9(14):2778. https://doi.org/10.3390/app9142778
Chicago/Turabian StyleJang, Daehee, Keunbada Son, and Kyu-bok Lee. 2019. "A Comparative Study of the Fitness and Trueness of a Three-Unit Fixed Dental Prosthesis Fabricated Using Two Digital Workflows" Applied Sciences 9, no. 14: 2778. https://doi.org/10.3390/app9142778