Article

Confidence Interval Based Fuzzy Evaluation Model for an Integrated-Circuit Packaging Molding Process

1
Business School, Guilin University of Technology, No. 12, Jiangan Rd., Guilin 541004, China
2
Institute of Innovation and Circular Economy, Asia University, Taichung 41354, Taiwan
3
Department of Industrial Engineering and Management, National Chin-Yi University of Technology, Taichung 41170, Taiwan
*
Author to whom correspondence should be addressed.
Appl. Sci. 2019, 9(13), 2623; https://doi.org/10.3390/app9132623
Submission received: 23 May 2019 / Revised: 16 June 2019 / Accepted: 26 June 2019 / Published: 28 June 2019

Abstract

:
The electronics industry in Taiwan has achieved a complete information and communication technology chain with a firm position in the global electronics industry. The integrated-circuit (IC) packaging industry chain adopts a professional division of labor model, and each process (including wafer dicing, die bonding, wire bonding, molding, and other subsequent processes) must have enhanced process capabilities to ensure the quality of the final product. Increasing quality can also lower the chances of waste and rework, lengthen product lifespan, and reduce maintenance, which means fewer resources invested, less pollution and damage to the environment, and smaller social losses. This contributes to the creation of a green process. This paper developed a complete quality evaluation model for the IC packaging molding process from the perspective of a green economy. The Six Sigma quality index (SSQI), which can fully reflect process yield and quality levels, is selected as a primary evaluation tool in this study. Since this index contains unknown parameters, a confidence interval based fuzzy evaluation model is proposed to increase estimation accuracy and overcome the issue of uncertainties in measurement data. Finally, a numerical example is given to illustrate the applicability and effectiveness of the proposed method.

1. Introduction

Integrated-circuit (IC) packaging is a procedure in which a processed wafer is cut into dies and then coated in materials such as resin, ceramics, and metal. The small volume of ICs means that electronic components are very close together, but this allows circuits to work faster and more reliably and protects the crystallites from external contamination. Thus, ICs are fundamental components of electronic products [1]. The cluster effect in the electronics industry in Taiwan has resulted in a complete information and communication technology industry chain with a firm position in the global electronics industry [2,3,4]. At present, the output values of Taiwan’s wafer foundry industry and IC packaging and testing industry take up the largest shares of the global market (approximately 70% and 50%, respectively). Companies in Taiwan also provide vertically integrated services including design, research and development (R&D), component supply, assembly, and original equipment manufacturer (OEM) manufacturing, such as MediaTek’s IC design services, Taiwan Semiconductor Manufacturing Company (TSMC)’s wafer foundry services, and Foxconn’s assembly and production services [5]. During the production process, the quality of all components and the assembly must be ensured so as to provide consumers with safe products of good quality and performance. For this, process capability indices (PCIs) are useful and convenient tools used to determine whether the process quality reaches the customer’s requirements [6,7,8,9,10,11,12,13,14,15]. A number of researchers have examined the relationship between PCIs and Six Sigma quality levels [5,16,17,18].
As ICs are the key components of modern electronic products, a package is required to protect the die so that it does not take on any physical or chemical damage during component and circuit production processes. The molding process in IC packaging has three crucial smaller-the-better (STB) quality characteristics: (A) lead frame deformation, (B) wire sweep, and (C) package warpage. Excessive lead frame deformation, wire sweep, or package warpage will affect subsequent IC product processes or the functions of the final product. Moreover, a PCI contains unknown parameters, μ and σ, which means that it requires sample data for estimation. In this paper, we investigate the relationships between the process quality levels ω and the value of a Six Sigma quality index (SSQI) Q P U for the three STB quality characteristics. We propose a novel, confidence interval based fuzzy testing method using the upper confidence limit of SSQI Q P U to evaluate the quality of the IC packaging molding process. Because this approach is grounded on confidence intervals, it reduces the risk of misjudgment caused by sampling errors and also increases the accuracy of decision-making in measuring the quality of the IC packaging molding process.
The remainder of this paper is organized as follows. Section 2 proposes an SSQI for the IC packaging molding process. Estimators of index accuracy and index precision are used to derive confidence interval based fuzzy numbers of SSQIs as well as the membership function for the development of a fuzzy evaluation model. Section 3 presents an example of a practical application. Finally, conclusions are provided in Section 4.

2. Materials and Methods

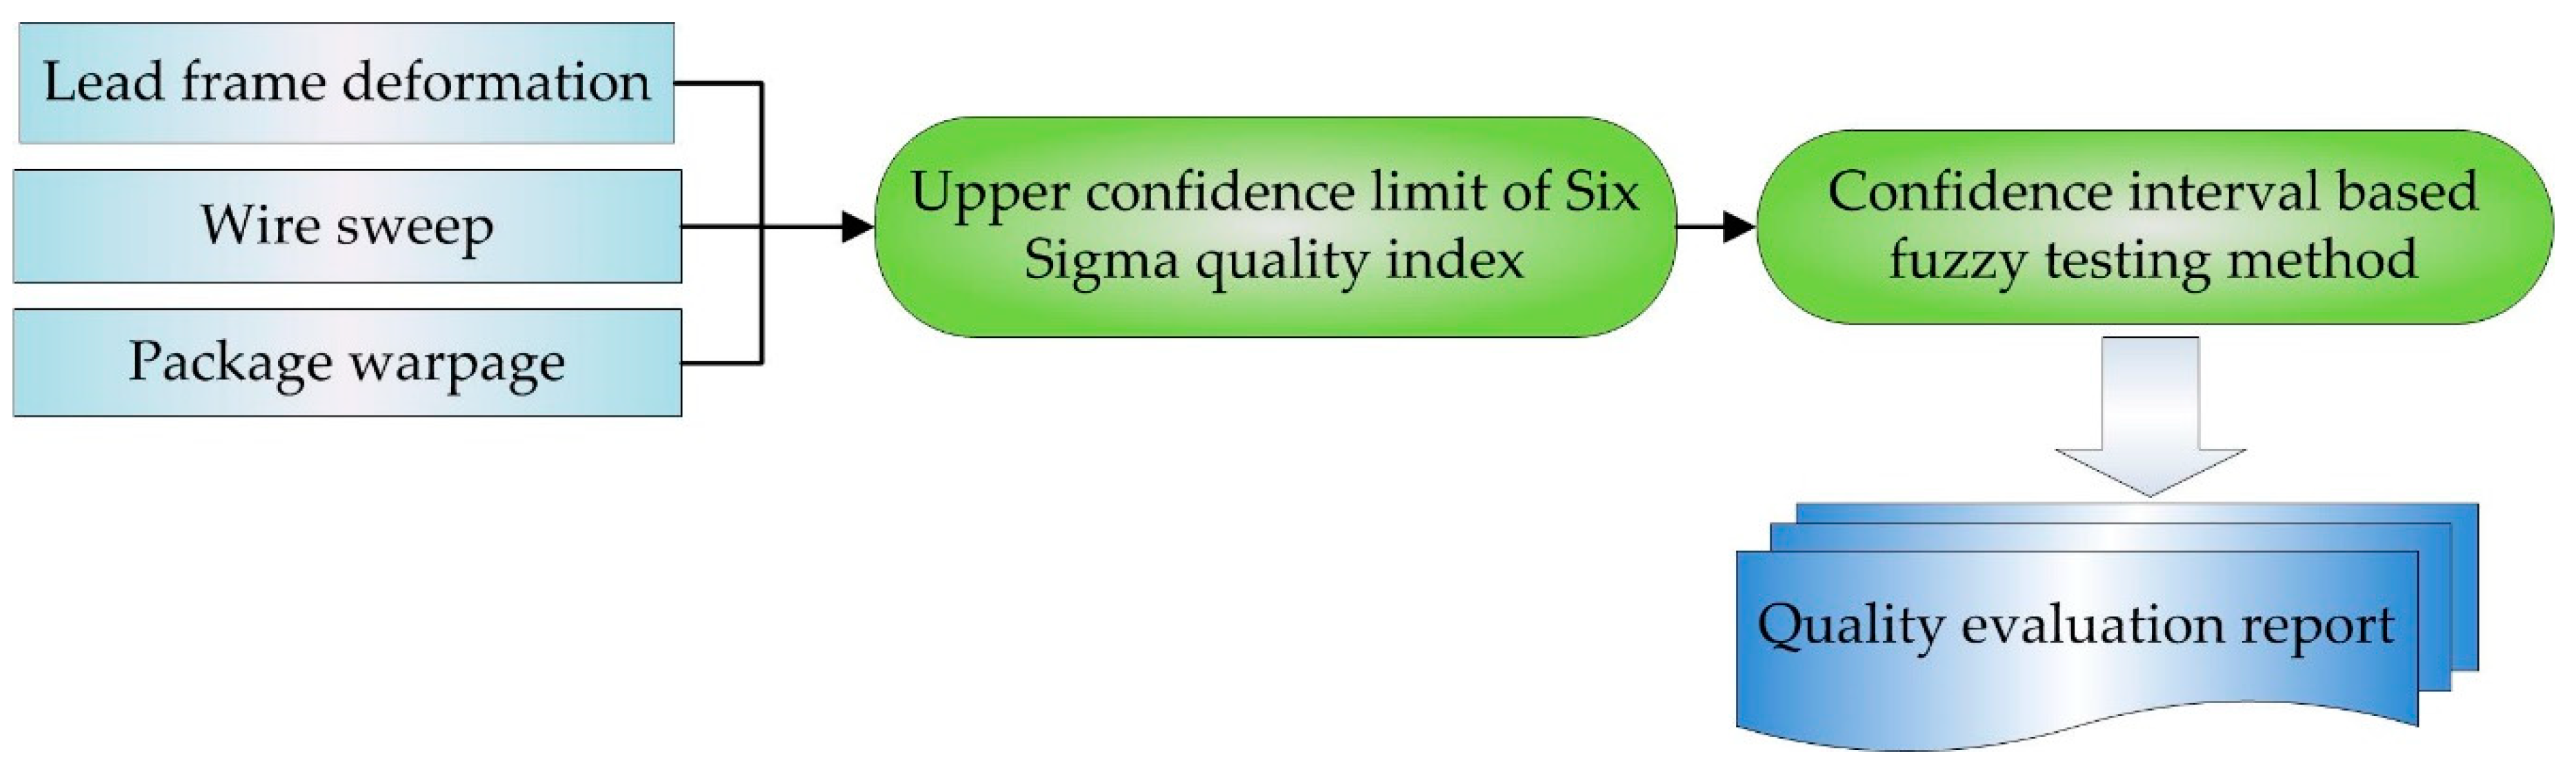
2.1. Six Sigma Quality Index for an Integrated-Circuit (IC) Packaging Molding Process

As previously mentioned, the molding process in IC packaging has three crucial STB quality characteristics: (A) lead frame deformation, (B) wire sweep, and (C) package warpage. For these STB quality characteristics, the target value T is zero [19]. Thus, the tolerance d = U S L T = U S L , and let
Y = X T d = X U S L ,
where USL is the upper specification limit. Then, Y is distributed normally with mean δ = μ / U S L and standard deviation γ = σ / U S L ( i . e . ,   Y ~ N ( δ , γ 2 ) ) . Therefore, the transformed USL is 1, and an SSQI for STB quality characteristics can be defined as follows [19]:
Q P U = U S L μ σ + 1.5 = 1 δ γ + 1.5 .
When U S L μ ( ω 1.5 ) σ , then the process reaches ω s i g m a quality level [19]. If we let Q P U ( ω ) denote the value of Q P U with U S L μ = ( ω 1.5 ) σ , then
Q P U Q P U ( ω ) = ( ω 1.5 ) σ σ + 1.5 = ω .
Obviously, when the process quality level is ω s i g m a , then the value of Q P U is at least equal to ω . Furthermore, under the assumption of normality, there exists a one-to-one mathematical relationship between index Q P U and process yield, which can be shown as follows:
p = 1 N ( δ , γ 2 ) d y = Q P U 1.5   1     d Φ ( z ) = Φ ( Q P U 1.5 ) ,
where Φ ( z ) is the cumulative function of standard normal distributions ( i . e . ,   Z ~ N ( 0 , 1 ) ) .
Table 1 displays the upper specification limit U S L h of these three quality characteristics (h = 1, 2, and 3).
Assume a random variable Y h is normally distributed with mean δ h and standard deviation γ h ( i . e . ,   Y h ~ N ( δ h , γ h 2 ) ) . The SSQI for these three quality characteristics can, therefore, be defined as follows:
Q P U h = 1 δ h γ h + 1.5 .
As in the work of [1], the SSQI for the IC packaging molding process can be defined as follows:
Q P U T = Φ 1 { 1 h = 1 3 [ 1 Φ ( Q P U h 1.5 ) ] } + 1.5 .
Let the event E h = { Y h 1 } and the compliment event of E h be E h C = { Y h > 1 } , h = 1, 2, and 3. Then, based on Equation (4),
p h = p { Y h 1 } = p { Z 1 δ h γ h } = Q P U h 1.5 1 2 π e x p { z 2 2 } d z = Φ ( Q P U h 1.5 ) ;
q h = 1 p h = p ( E h C ) = 1 Φ ( Q P U h 1.5 ) .
Let E = E 1 E 2 E 3 . Then, based on the De Morgan theorem and Boole’s inequality, the yield p T of the IC packaging molding process is as follows:
p T = P ( E ) = P ( E 1 E 2 E 3 ) 1 P ( E 1 C ) P ( E 2 C ) P ( E 3 C ) = 1 h = 1 3 [ 1 Φ ( Q P U h 1.5 ) ] = Φ ( Q P U T 1.5 ) .
Thus, there is an inequality between index Q P U T and process yield p T . For example, when Q P U T = 5.0 , then we can guarantee the product yield p T Φ ( 3.5 ) = 99.977 % . Let Q P U T = ω , then
p T p T ( ω ) = Φ ( ω 1.5 ) .
Obviously, p T ( Q P U T ) is an increasing function of Q P U T . When the required quality level of the IC packaging molding process is ω s i g m a , then the quality levels of the three quality characteristics must reach ω s i g m a and ω ω [5,20]. Based on Equation (6),
ω = Φ 1 { 1 h = 1 3 [ 1 Φ ( ω 1.5 ) ] } + 1.5 .
Equivalently,
ω = Φ 1 ( 1 1 Φ ( ω 1.5 ) 3 ) + 1.5 .
Table 2 presents a comparison of quality levels for ω and ω . For example, when the quality levels of the three quality characteristics reach ω s i g m a , then we can guarantee the quality level of IC packaging molding process is 6σ. Clearly, for the IC packaging molding process to be 6σ, the quality characteristics should reach 6.23σ.

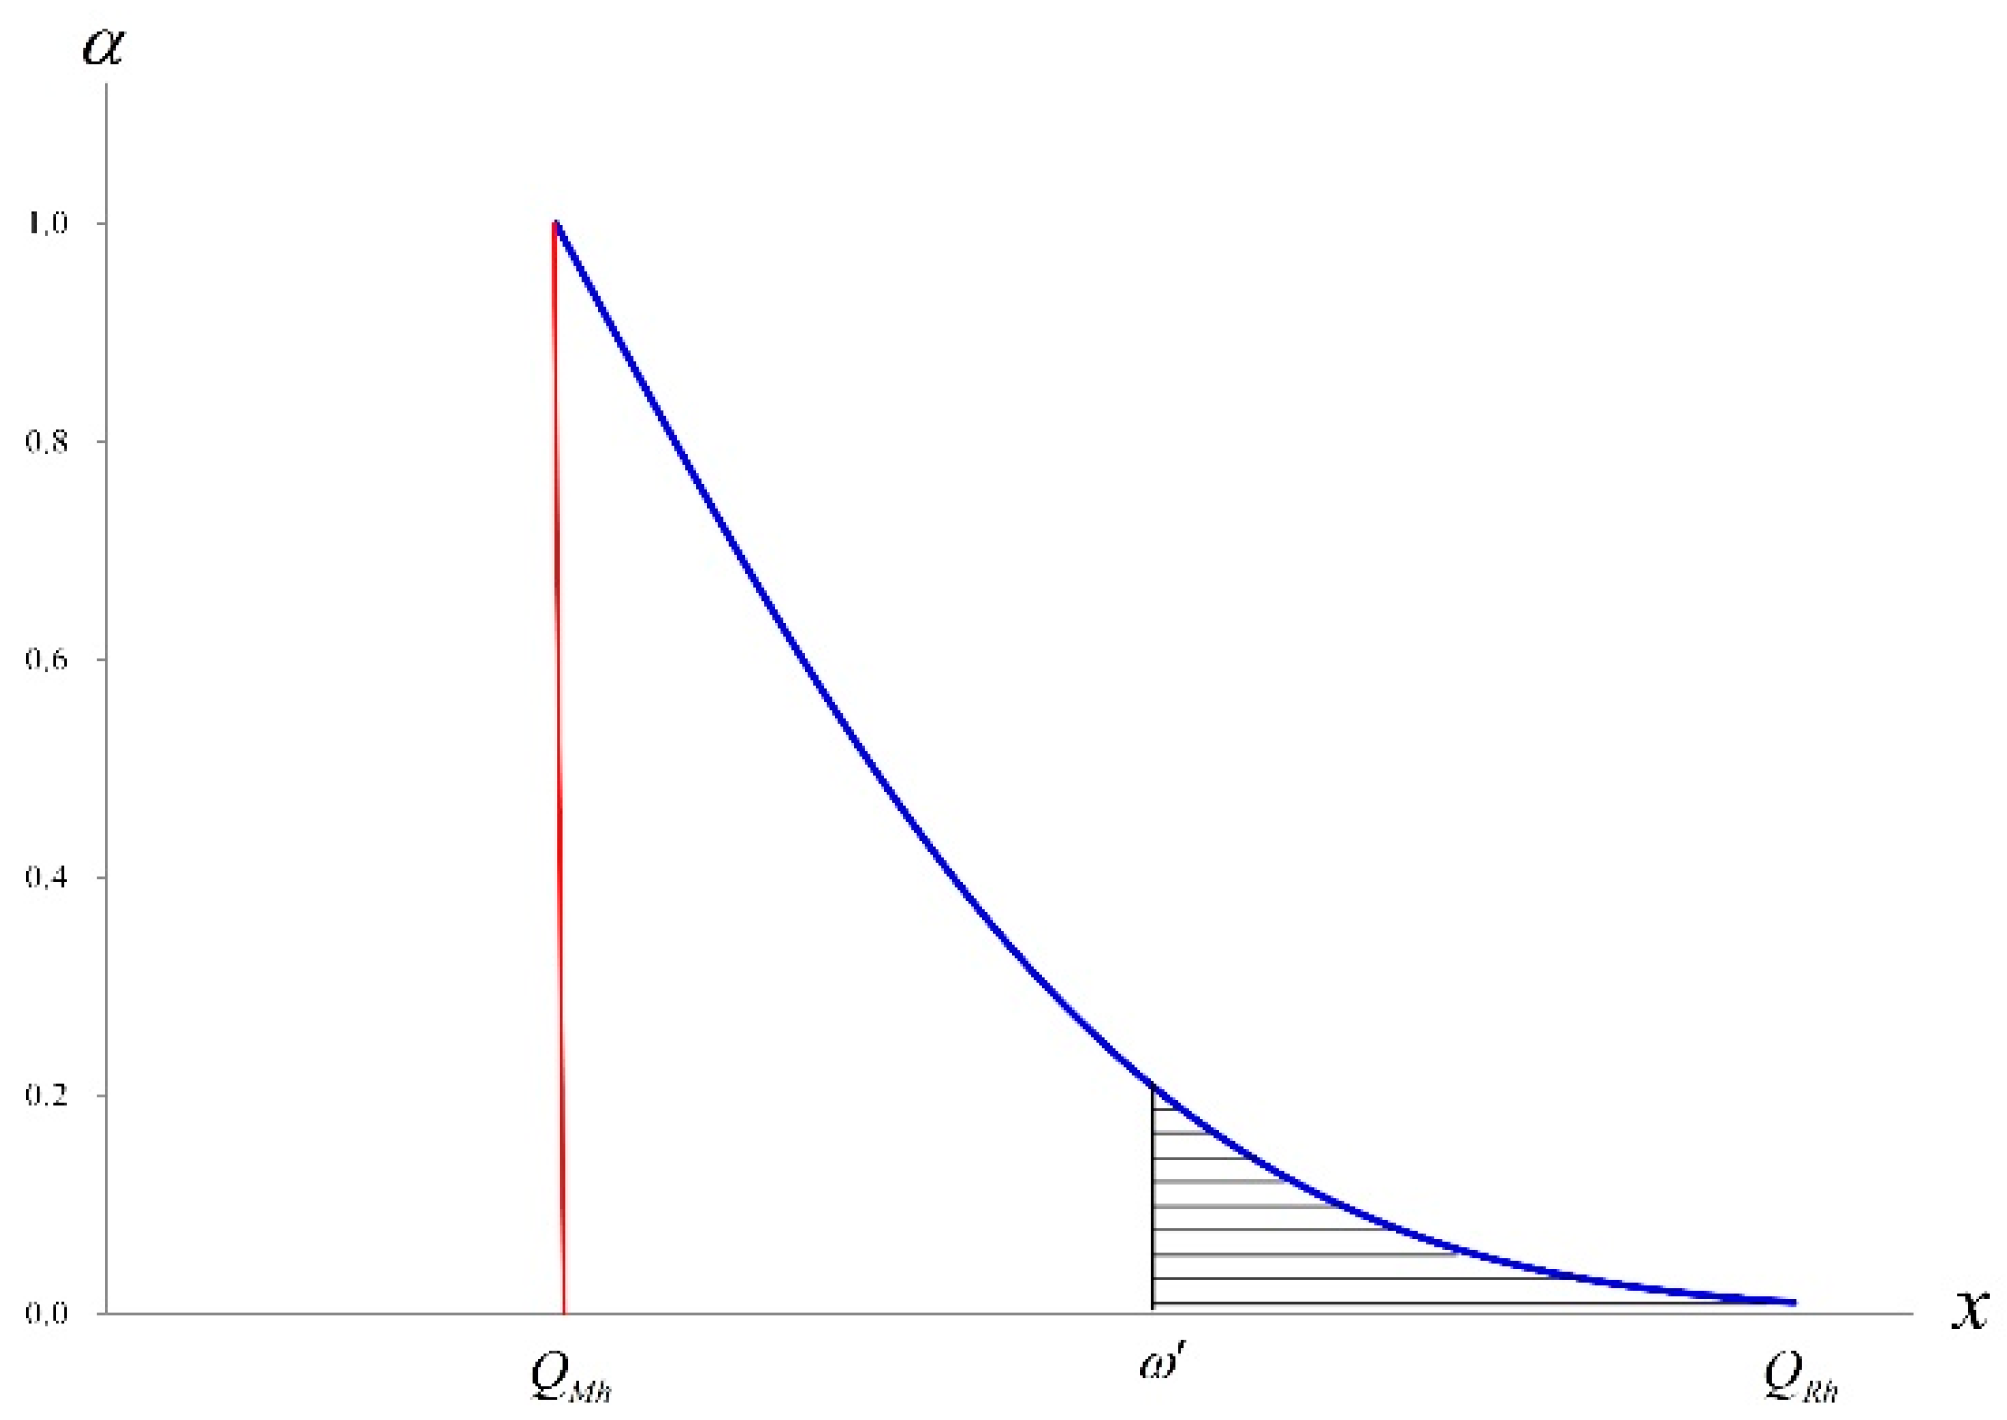
2.2. Confidence Interval Based Fuzzy Numbers

As mentioned previously, the proposed scheme can derive the SSQI for the IC packaging molding process, which further enables development of a fuzzy model. An estimator of index accuracy δ h and an estimator of index precision γ h are used to derive confidence interval based fuzzy numbers for the SSQI as well as the membership function for development of the fuzzy evaluation model.
We assume that the random variables Y h ~ N ( δ h , γ h 2 ) represent the process distribution of quality characteristic h, where Yh1,…, Yhi,…, Yhn is a set of sample data related to quality characteristic h, and the sample size is n. The estimator of index Q P U h for quality characteristic h can be derived using these sample data, as follows:
Q P U h = 1 δ h γ h + 1.5 ,
where δ h = n 1 × i = 1 n Y h i and γ h = 1 n 1 i = 1 n ( Y h i δ h ) 2 .
Similarly, if we let
Z = n [ ( Q P U h 1.5 ) ( Q P U h 1.5 ) × ( γ h γ h ) ] = n ( δ h δ h ) γ h ,
then Z follows standard normal distribution; i.e., Z ~ N ( 0 , 1 ) .
Therefore,
p { n [ ( Q P U h 1.5 ) ( Q P U h 1.5 ) × ( γ h γ h ) ] Z α / 2 } = 1 α 2 .
Equivalently,
P { Q P U h ( Q P U h 1.5 ) × ( γ h γ h ) + Z α / 2 n + 1.5 } = 1 α 2 ,
where Z α / 2 is the upper α / 2 quantile of standard normal distribution. Conversely, if we let
K = ( n 1 ) γ h 2 γ h 2 = i = 1 n ( Y h i δ h ) 2 γ h 2 ,
then K presents a chi-square distribution with n 1 degrees of freedom (i.e., χ n 1 2 ). Thus, we can further derive the following:
p ( ( n 1 ) γ h 2 γ h 2 χ 1 α / 2 , n 1 2 ) = 1 α 2 .
Equivalently,
p ( γ h γ h χ 1 α / 2 , n 1 2 n 1 ) = 1 α 2 ,
where χ 1 α / 2 , n 1 2 is the lower α / 2 quantile of the chi-square distribution with n 1 degrees of freedom. In fact, index Q P U h is a function of ( δ h , γ h ) . To derive the ( 1 α ) × 100 % upper confidence limits on index Q P U h , this paper defines events A and B of ( δ h , γ h ) as follows:
A = { ( δ h , γ h ) | Q P U h ( Q P U h 1.5 ) × ( γ h γ h ) + Z α / 2 n + 1.5 } ; B = { ( δ h , γ h ) | γ h γ h χ 1 α / 2 , n 1 2 n 1 } .
Clearly, p ( A ) = p ( B ) = 1 α / 2 and p ( A C ) = p ( B C ) = α / 2 . According to De Morgan’s theorem, we have ( A C B C ) C = A B and p ( A B ) = 1 p ( A C B C ) 1 p ( A C ) p ( B C ) = 1 α . Thus,
p { Q P U h ( Q P U h 1.5 ) × ( γ h γ h ) + Z α / 2 n + 1.5 ,         γ h γ h χ 1 α / 2 , n 1 2 n 1 } 1 α .
Equivalently,
p { Q P U h ( Q P U h 1.5 ) × χ 1 α / 2 , n 1 2 n 1 + Z α / 2 n + 1.5 } 1 α .
Let y h i be the observed value of Yhi and the observed values of δ h and γ h be
δ h 0 = 1 n i = 1 n y h i   and   γ h 0 = 1 n 1 i = 1 n ( y h i δ h 0 ) 2 .
Similar to [10], the observed value of the 100 ( 1 α ) % upper confidence limit U Q P U h 0 can be described as follows:
U Q P U h 0 = ( Q P U h 0 1.5 ) × χ 1 α / 2 , n 1 2 n 1 + Z α / 2 n + 1.5 ,
where Q P U h 0 = 1 δ h 0 γ h 0 + 1.5 .
Applying the upper confidence limit U Q P U h 0 in accordance with the method from [21], the α - cuts of the half-triangular fuzzy number Q ˜ P U h 0 are derived as follows:
Q ˜ P U h 0 [ α ] = { [ U Q P U h 0 ( 1 ) , U Q P U h 0 ( α ) ] , for     0.01 α 1 [ U Q P U h 0 ( 1 ) , U Q P U h 0 ( 0.01 ) ] , for     0 α 0.01 ,
where U Q P U h 0 ( α ) = ( Q P U h 0 1.5 ) × χ 1 α / 2 , n 1 2 n 1 + Z α / 2 n + 1.5 .
Thus, the half-triangular fuzzy number of U Q P U h 0 is Q ˜ P U h 0 = Δ (   Q M h ,   Q R h ) , where
Q M h = ( Q P U h 0 1.5 ) × χ 0.5 , n 1 2 n 1 + 1.5 ;
Q R h = ( Q P U h 0 1.5 ) × χ 0.975 , n 1 2 n 1 + Z 0.025 n + 1.5 .
It follows that the membership function of the fuzzy number Q ˜ P U h 0 is
η h ( x ) = { 0 i f   x < Q M h 1 i f   x = Q M h α i f   Q M h < x Q R h 0 i f   Q R h < x ,
where α is determined by U Q P U h 0 ( α ) = x ; i.e.,
( Q P U h 0 1.5 ) × χ 1 α / 2 , n 1 2 n 1 + Z α / 2 n + 1.5 = x .
The numerical examples of η h ( x ) are shown in Section 3.

2.3. Fuzzy Evaluation Model

Before developing the fuzzy hypothesis testing method, we examined the process of statistical hypothesis testing. In determining whether the index Q P U h was at least equal to ω , we adopted the null hypothesis as H 0 : Q P U h ω and the alternative hypothesis as H 1 : Q P U h < ω . For the upper confidence limit U Q P U h 0 , the rules of statistical hypothesis testing were as follows:
  • If U Q P U h 0 ω , then do not reject H 0 , and conclude that Q P U h ω .
  • If U Q P U h 0 < ω , then reject H 0 , and conclude that Q P U h < ω .
In fact, U Q P U h 0 is a decreasing function of sample size n , which can be rewritten as U Q P U h 0 ( n ) . Let n < n such that U Q P U h 0 ( n ) ω and U Q P U h 0 ( n ) < ω , then
  • U Q P U h 0 ( n ) ω , do not reject H 0 , and conclude that U Q P U h ω .
  • U Q P U h 0 ( n ) < ω , reject H 0 , and conclude that U Q P U h < ω .
It is clear that sample size n influences the statistical inference results. Thus, this paper will be in accordance with [21] and [22] to propose a fuzzy hypothesis testing method. For the sake of convenience, we referred to [22] and replaced the area of membership function with the bottom line of membership function. Based on this concept, we developed a novel approach to fuzzy testing involving H 0 : Q P U h ω and H 1 : Q P U h < ω . Figure 1 presents a diagram corresponding to the membership function η h ( x ) and vertical line x = ω .
We can compute the total area a T h of η h ( x ) as follows:
a T h = Q M h Q R h   η h ( x )   d x .
Similarly, we can compute the slashed area a R h of η h ( x ) as follows:
a R h = ω Q R h   η ( x )   d x .
According to [21], we can use a R h as the numerator and 2 a T h as the denominator and then perform fuzzing testing using a R h / 2 a T h . Supposing that d R h = Q R h ω , d R h is the base of slashed area η h ( x ) . Based on Equation (20), d R h can be shown as follows:
d R h = ( Q P U h 0 1.5 ) × χ 0.975 , n 1 2 n 1 + Z 0.025 n ( ω 1.5 ) .
Similarly, the base of η h ( x ) can be expressed as d T h = Q R h Q M h . Based on Equations (19) and (20), d T h can be shown as follows:
d T h = ( Q P U h 0 1.5 ) × ( χ 0.975 , n 1 2 n 1 χ 0.5 , n 1 2 n 1 ) + Z 0.025 n .
For the sake of convenience, we referred to [22] and replaced a R h / 2 a T h with d R h / 2 d T h for fuzzy testing; d R h / 2 d T h is defined as follows:
d R h / 2 d T h = { 0 i f   ω Q R h Q R h ω 2 ( Q R h Q M h ) i f   Q M h < ω < Q R h 1 / 2   i f   ω Q M h .
If we let   0   <   ϕ 1 < ϕ 2 < 0.5 , in accordance with [21], we can consider employing two numbers as follows:
(1)
If d R h / 2 d T h ϕ 1 , then we reject H 0 , and we conclude that Q P U h < ω .
(2)
If ϕ 1 < d R h / 2 d T h < ϕ 2 , then we make no decision regarding whether to reject/not reject.
(3)
If ϕ 2 d R h / 2 d T h 0.5 , then we do not reject H 0 , and we conclude that Q P U h ω .
Figure 2 illustrates the procedures of the proposed fuzzy evaluation model for the IC packaging molding process. The evaluation report produced by this model offers concrete measures for improving the process.

3. Practical Application

In this section, a numerical example is used to verify the proposed confidence interval based fuzzy evaluation model. As mentioned earlier, lead frame deformation (h = 1), wire sweep (h = 2), and package warpage (h = 3) are three crucial STB quality characteristics associated with the IC packaging molding process. Based on [5,20], according to Table 2, if we want to test whether Q P U h is bigger than 5.28σ ( ω = 5.28), then the null hypothesis H 0 : Q P U h 5.28 versus the alternative hypothesis will be H 1 : Q P U h < 5.28 ,         h = 1 ,         2 ,         3 . The observed values of three indices with sample size n = 36 can be described as follows:
Q P U 10 = 4.2 ,   Q P U 20 = 5.1 ,   and   Q P U 30 = 5.3
Based on Equations (19) and (20), the half-triangular fuzzy numbers of Q ˜ P U 10 , Q ˜ P U 20 , and Q ˜ P U 30 are as follows:
Δ ( Q M 1 ,   Q R 1 ) = Δ ( 4.17 ,   5.47 ) ,   Δ ( Q M 2 ,   Q R 2 ) = Δ ( 5.07 ,   6.37 ) ,   and   Δ ( Q M 3 ,   Q R 3 ) = Δ ( 5.27 ,   6.57 )
In addition, based on Equation (21), the membership function of fuzzy number Q ˜ P U 10 is
η 1 ( x ) = { 0 i f   x < 4.17 1 i f   x = 4.17 α i f   4.17 < x 5.47 0 i f   5.47 < x ,
where α is determined by
2.7 × χ 1 α / 2 , 35 2 35 + Z α / 2 6 + 1.5 = x .
Similarly, the membership function of fuzzy number Q ˜ P U 20 is
η 2 ( x ) = { 0 i f   x < 5.07 1 i f   x = 5.07 α i f   5.07 < x 6.37 0 i f   6.37 < x ,
where α is determined by
3.6 × χ 1 α / 2 , 35 2 35 + Z α / 2 6 + 1.5 = x .
The membership function of fuzzy number Q ˜ P U 30 is
η 3 ( x ) = { 0 i f   x < 5.27 1 i f   x = 5.27 α i f   5.27 < x 6.57 0 i f   6.57 < x ,
where α is determined by
3.8 × χ 1 α / 2 , 35 2 35 + Z α / 2 6 + 1.5 = x .
Obviously, the upper confidence limits of these three indices were all larger than 5.28. Based on statistical testing rules, we do not reject H 0 . However, although the observed value of Q P U 10 was 4.2, which is far less than 5.28, our conclusion was that Q P U 1 5.28 . This was because the smaller sample size (n = 36) led to a substantial error. We therefore applied the fuzzy evaluation model proposed in Section 2.3. Based on Equations (25) and (26), the values of d R h and d T h for h = 1, 2, 3 are as follows:
d R 1 = Q R 1 5.28 = 5.47 5.28 = 0.19 ; d R 2 = Q R 2 5.28 = 6.37 5.28 = 1.09 ; d R 3 = Q R 3 5.28 = 6.57 5.28 = 1.29 ; d T 1 = Q R 1 Q M 1 = 5.47 4.17 = 1.30 ; d T 2 = Q R 2 Q M 2 = 6.37 5.07 = 1.30 ; d T 3 = Q R 3 Q M 3 = 6.57 5.27 = 1.30 .
Therefore,
d R 1 / 2 d T 1 = 0.19 / 2.60 = 0.073 ; d R 2 / 2 d T 2 = 1.09 / 2.60 = 0.419 ; d R 3 / 2 d T 3 = 1.29 / 2.60 = 0.496 .
In fact, ϕ 1 and ϕ 2 can be determined by industry characteristics. In this paper, we adopted [21] to set ϕ 1 and ϕ 2 as 0.2 and 0.4, respectively. Because d R 1 / 2 d T 1 = 0.073 < ϕ 1 , then we reject H 0 and conclude that Q P U 1 < 5.28 . However, since both d R 2 / 2 d T 2 and d R 3 / 2 d T 3 are larger than ϕ 2 , we do not reject H 0 and conclude that Q P U 2 5.28 and Q P U 3 5.28 . Clearly, in this case, the quality level of lead frame deformation in the IC packaging molding process does not meet requirements; improvements are necessary.

4. Conclusions

The molding process of IC packaging has three crucial STB quality characteristics: lead frame deformation, wire sweep, and package warpage. Since SSQIs are capable of comprehensively reflecting Six Sigma quality levels and have one-to-one mathematical relationships with process yield, we adopted these indices to evaluate these three STB quality characteristics. First, the estimators δ h and γ h were used to derive confidence interval based fuzzy numbers for SSQIs as well as the membership function for development of a fuzzy evaluation model. This method reduces the risk of misjudgment caused by sampling errors and also enhances the accuracy of decision-making in measuring the quality of the IC packaging molding process. We also proposed an easier calculation method for d R h / 2 d T h to obtain their approximate values in order to facilitate practical applications. Finally, we used an example to demonstrate the proposed model, the results of which were more reasonable than those obtained using conventional statistical testing methods because it reduced the substantial error caused by a smaller sample size. In this paper, we used α-cut fuzzy estimators to develop a fuzzy evaluation model for the molding process of IC packaging. Future studies could extend the proposed model by using non-asymptotic fuzzy estimators [23] to compare the findings with this study.

Author Contributions

Conceptualization, K.-S.C.; Data curation, K.-S.C. and C.-M.Y.; Formal analysis, K.-S.C., K.-P.L., and C.-M.Y.; Funding acquisition, K.-S.C. and C.-M.Y.; Methodology, K.-S.C. and K.-P.L.; Resources, K.-S.C.; Supervision, K.-S.C. and K.-P.L.; Validation, K.-S.C. and C.-M.Y.; Writing—original draft, K.-S.C., K.-P.L., and C.-M.Y.

Funding

This research was funded by National Natural Science Foundation of China, grant number 71762008; Guilin University of Technology, grant number GUTQDJJ6616075; and the Ministry of Science and Technology Taiwan, grant number MOST 107-2622-E-167-003-CC3.

Conflicts of Interest

The authors declare no conflict of interest.

References

  1. Chang, T.C.; Chen, K.S. Testing process quality of wire bonding with multiple gold wires from the viewpoint of producers. Int. J. Prod. Res. 2018, 1–14. [Google Scholar] [CrossRef]
  2. Tunn, V.S.C.; Bocken, N.M.P.; van den Hende, E.A.; Schoormans, J.P.L. Business models for sustainable consumption in the circular economy: An expert study. J. Clean. Prod. 2019, 212, 324–333. [Google Scholar] [CrossRef]
  3. Tseng, M.L.; Chiang, J.H.; Lan, L.W. Selection of optimal supplier in supply chain management strategy with analytic network process and choquet integral. Comput. Ind. Eng. 2009, 57, 330–340. [Google Scholar] [CrossRef]
  4. Chen, K.S.; Wang, C.H.; Chang, T.C. The construction and application of capability evaluation models for larger-the-better type process on the assembly and packaging of passive components industry. Appl. Mech. Mater. 2011, 58, 1618–1623. [Google Scholar] [CrossRef]
  5. Wang, C.C.; Chen, K.S.; Wang, C.H.; Chang, P.H. Application of 6-sigma design system to developing an improvement model for multi-process multi-characteristic product quality. Proc. Inst. Mech. Eng. B J. Eng. 2011, 225, 1205–1216. [Google Scholar] [CrossRef]
  6. Pearn, W.L.; Chen, K.S. A Bayesian-like estimator of Cpk. Commun. Stat.-Simul. Comput. 1996, 25, 321–329. [Google Scholar] [CrossRef]
  7. Chen, K.S. Estimation of the process incapability index. Commun. Stat.-Theor. Methods 1988, 27, 1263–1274. [Google Scholar] [CrossRef]
  8. Yu, K.T.; Sheu, S.H.; Chen, K.S. The evaluation of process capability for a machining center. Int. J. Adv. Manuf. Tech. 2007, 33, 505–510. [Google Scholar] [CrossRef]
  9. Kashif, M.; Aslam, M.; Al-Marshadi, A.H.; Jun, C.H.; Khan, M.I. Evaluation of modified non-normal process capability index and its bootstrap confidence intervals. IEEE Access 2017, 5, 12135–12142. [Google Scholar] [CrossRef]
  10. Chen, K.S.; Wang, K.J.; Chang, T.C. A novel approach to deriving the lower confidence limit of indices Cpu, Cpl, and Cpk in assessing process capability. Int. J. Prod. Res. 2017, 55, 4963–4981. [Google Scholar] [CrossRef]
  11. de-Felipe, D.; Benedito, E. Monitoring high complex production processes using process capability indices. Int. J. Adv. Manuf. Technol. 2017, 93, 1257–1267. [Google Scholar] [CrossRef] [Green Version]
  12. Lepore, A.; Palumbo, B.; Castagliola, P. A note on decision making method for product acceptance based on process capability indices Cpk and Cpmk. Eur. J. Oper. Res. 2018, 267, 393–398. [Google Scholar] [CrossRef]
  13. Otsuka, A.; Nagata, F. Quality design method using process capability index based on Monte-Carlo method and real-coded genetic algorithm. Int. J. Prod. Econ. 2018, 204, 358–364. [Google Scholar] [CrossRef]
  14. Aslam, M. Statistical monitoring of process capability index having one sided specification under repetitive sampling using an exact distribution. IEEE Access 2018, 6, 25270–25276. [Google Scholar] [CrossRef]
  15. Liao, M.Y.; Pearn, W.L. Modified weighted standard deviation index for adequately interpreting a supplier’s lognormal process capability. Proc. Inst. Mech. Eng. B J. Eng. 2019, 233, 999–1008. [Google Scholar] [CrossRef]
  16. Chen, K.S.; Chen, H.T.; Wang, C.H. A study of process quality assessment for golf club-shaft in leisure sport industries. J. Test. Eval. 2012, 40, 512–519. [Google Scholar] [CrossRef]
  17. Chang, T.C.; Wang, K.J.; Chen, K.S. Capability performance analysis for processes with multiple characteristics using accuracy and precision. Proc. Inst. Mech. Eng. B J. Eng. 2014, 228, 766–776. [Google Scholar] [CrossRef]
  18. Yu, K.T.; Chen, K.S. Testing and analyzing capability performance for products with multiple characteristics. Int. J. Prod. Res. 2016, 54, 6633–6643. [Google Scholar] [CrossRef]
  19. Chen, K.S.; Chen, H.T.; Chang, T.C. The construction and application of six sigma quality indices. Int. J. Prod. Res. 2017, 55, 2365–2384. [Google Scholar] [CrossRef]
  20. Chen, K.S.; Wang, C.H.; Chen, H.T. A MAIC approach to TFT-LCD panel quality improvement. Microelectron. Reliab. 2006, 46, 1189–1198. [Google Scholar] [CrossRef]
  21. Buckley, J.J. Fuzzy statistics: Hypothesis testing. Soft Comput. 2005, 9, 512–518. [Google Scholar] [CrossRef]
  22. Chen, K.S.; Wang, C.H.; Tan, K.H. Developing a fuzzy green supplier selection model using Six Sigma quality indices. Int. J. Prod. Econ. 2016, 212, 1–7. [Google Scholar] [CrossRef]
  23. Sfiris, D.S.; Buckley, J.J. Non-asymptotic fuzzy estimators based on confidence intervals. Inf. Sci. 2014, 279, 446–459. [Google Scholar] [CrossRef]
Figure 1. Diagram corresponding to η h ( x ) and vertical line x = ω .
Applsci 09 02623 g001
Figure 2. Flowchart of the fuzzy evaluation model for the IC packaging molding process.
Applsci 09 02623 g002
Table 1. Upper specification limit (USLh) of three quality characteristics.
hQuality CharacteristicSpecification
1Lead frame deformation<0.05 mm
2Wire sweep<10%
3Package warpage<3 mil
Table 2. Comparison of quality levels for ω and ω .
Quality Level ω ω
6σ6.006.23
5σ5.005.28
4σ4.004.37
3σ3.003.51

