Article

Estimation of Work of Breathing from Respiratory Muscle Activity In Spontaneous Ventilation: A Pilot Study

by
Isabel Cristina Muñoz
1,
Alher Mauricio Hernández
1,* and
Miguel Ángel Mañanas
2
1
Bioinstrumentation and Clinical Engineering Research Group—GIBIC, Bioengineering Department, Engineering Faculty, Universidad de Antioquia UdeA, Calle 70 No. 52-21, Medellín 050010, Colombia
2
Department of Automatic Control (ESAII), Biomedical Engineering Research Center (CREB) and Biomedical Research Networking Center in Bioengineering, Biomaterials, and Nanomedicine, CIBER-BBN, Universitat Politècnica de Catalunya, 08928 Barcelona, Spain
*
Author to whom correspondence should be addressed.
Appl. Sci. 2019, 9(10), 2007; https://doi.org/10.3390/app9102007
Submission received: 22 March 2019 / Revised: 18 April 2019 / Accepted: 9 May 2019 / Published: 16 May 2019
(This article belongs to the Special Issue Signals in Health Care)

Abstract

:
Work of breathing (WOB) offers information that may be relevant to determine the patient’s status under spontaneous mechanical ventilation in Intensive Care Unit (ICU). Nowadays, the most reliable technique to measure WOB is based on the use of invasive catheters, but the use of qualitative observations such as the level of dyspnea is preferred as a possible indicator of WOB level. In this pilot study, the activity of three respiratory muscles were recorded on healthy subjects through surface electromyography while they were under non-invasive mechanical ventilation, using restrictive and obstructive maneuvers to obtain different WOB levels. The respiratory pattern between restrictive and obstructive maneuvers was classified with the Nearest Neighbor Algorithm with a 91% accuracy and a neural network model helped classify the samples into three WOB levels with a 89% accuracy, Low: [0.3–0.8) J/L, Medium: [0.8–1.3] J/L and Elevated: (1.3–1.8] J/L, demonstrating the relationship between the respiratory muscle activity and WOB. This technique is a promising tool for the healthcare staff in the decision-making process when selecting the best ventilation settings to maintain a low WOB. This study identified a model to estimate the WOB in different ventilatory patterns, being an alternative to invasive conventional techniques.

1. Introduction

The work of breathing (WOB) has been defined as the energy required to accomplish the body´s ventilatory demand, which in spontaneous breathing depends on the effort performed by respiratory muscles [1]. Monitoring WOB levels provides several advantages for healthcare staff in the decision-making process, making it possible to adjust the mechanical ventilator’s settings, and the pharmacological treatment; furthermore, it helps understand the mechanism of the pathologies and assess the patient’s evolution post-extubation [1,2,3].
Some authors have identified WOB values for different patients, both with and without mechanical ventilation. WOB values in the range of 0.3 to 0.8 J/L are considered indicators of low respiratory demand in patients under spontaneous mechanical ventilation or low WOB [4,5,6]. Sharp et al. [6] found that 96% of patients with a WOB lower than 0.8 J/L had a successful weaning process. On the other hand, values in the range of 0.8–1.3 J/L are considered a population with high respiratory demand, such as people with airway and pulmonary parenchymal abnormalities, intubated patients, people with dynamic hyperinflation, airflow obstruction (Chronic Obstructive Pulmonary Disease or COPD patients) or obese people [4,7,8]. In addition, WOB values in the range of 1.3–1.8 J/L are considered elevated, making it impossible to maintain an adequate spontaneous ventilation for a long period of time [5,8].
According to the state of the art, the use of an esophageal balloon catheter is required to accurately measure the work of breathing. However, this technique is invasive and uncomfortable for the patient, which restricts its use in clinical practice [9,10].
Several clinical strategies to detect an increase in work of breathing include distress or dyspnea, vital signs, physical signs of increased breathing effort, breathing rate, tidal volume, and frequency/tidal volume ratio [3,5,11]. However, these strategies are not reliable in all cases, which hampers its generalization [3].
Dyspnea is defined as “breathing discomfort”, which occurs when there is an imbalance between the load imposed upon the respiratory muscles and the capacity of these to overcome it. For that reason, many authors have successfully used surface electromyography (sEMG) signals of respiratory muscles to quantify the level of dyspnea [12,13,14]. Therefore, a relationship between respiratory muscle activity and work of breathing can be inferred.
Some authors have proposed indexes from sEMG signals of respiratory muscles, in the following domains: time, frequency, and time-frequency [12,15,16,17]. However, the relationship between respiratory muscle activity and work of breathing has not been proven yet, because those authors had no WOB measurements. Furthermore, considering that multiple respiratory muscles are involved, patients may have different ventilation patterns to achieve the same work, and to our knowledge this has not been studied.
Some researchers have studied muscle activity patterns from sEMG signals and used different machine learning algorithms to recognize activation patterns in several muscles, mainly of the limbs. Chowdhury et al. [18] presented a review describing the use of sEMG, showing selected features, used muscles, classification algorithms, objective, and the accuracy of the studies. A common objective was the classification of patients with neuromuscular diseases and muscular fatigue using sEMG signals of the Biceps brachii muscle. Consequently, classifiers like the Simple Fisher Linear Discriminant Analysis (LDA), statistical K-Nearest Neighbor (KNN), Support Vector Machine (SVM), Neural Networks (NN), among others, were used.
In mechanical ventilation, in order to achieve an optimal configuration of the ventilator, some authors have used Artificial Neural Networks to monitor parameters like total positive end-expiratory pressure (PEEP) [19] and power of breathing or work of breathing per minute [11,20] from ventilatory signals.
In previous studies, our team used unsupervised learning techniques to find indexes that were related to the patient’s condition or identify muscle respiratory patterns [15,17,21]. Based on the hierarchical cluster, an unsupervised learning technique, Hernández et al. [21] characterized different muscular responses attributed to changes in the mechanical ventilator settings. Using similar techniques, Salazar et al. [15] identified muscle weakness in ventilated patients, and in a complementary study, patients who presented failures in the weaning process were separated from patients with a successful weaning [17].
This paper presents a strategy to estimate work of breathing exerted by the subject during the ventilation process using indexes from sEMG signals based on machine learning techniques to identify and discriminate different respiratory patterns in spontaneous ventilation.

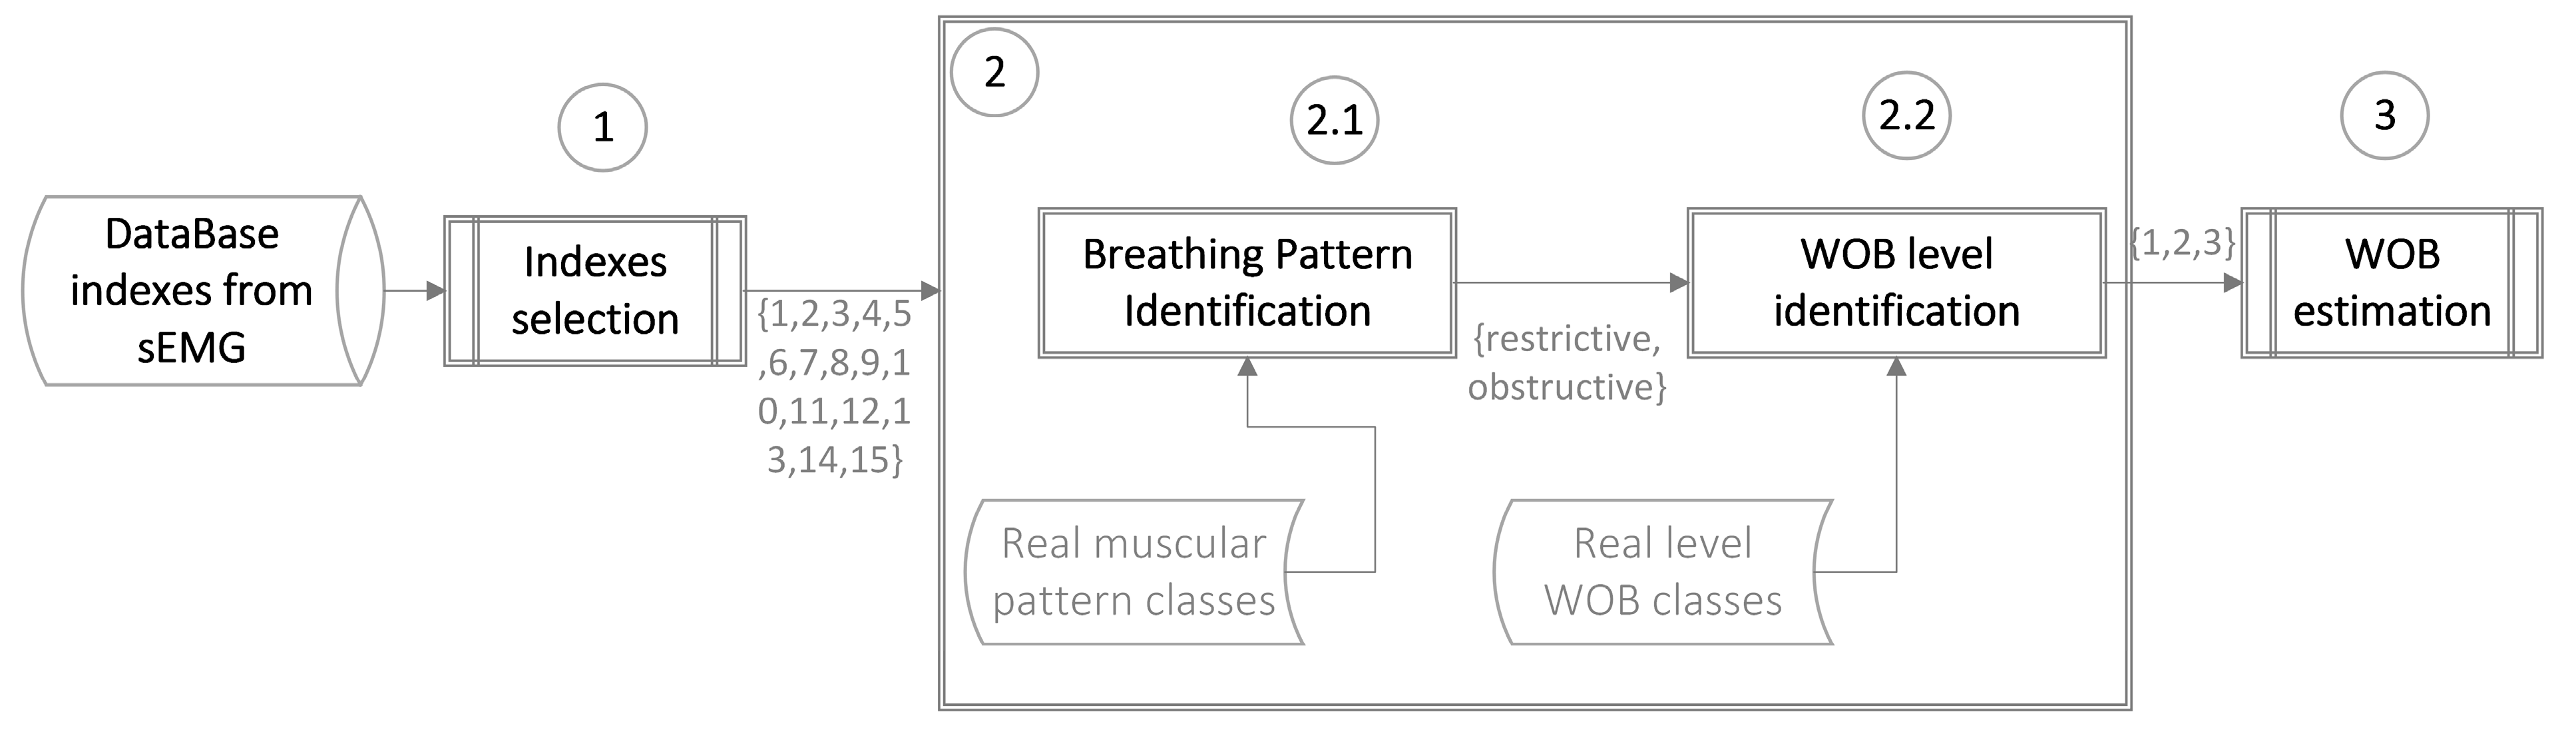
2. Materials and Methods

2.1. Experimental Design

The study was conducted according to the Helsinki Declaration with subsequent revisions. The experimental design and written consent were approved by the Ethics Committee of the University of Antioquia, approval report 15-59-664.
Two experiments were designed to achieve different levels of work of breathing. Experiment one (E1) involved restrictive maneuvers to reduce the respiratory system compliance and experiment two (E2) involved obstructive maneuvers to increase airway resistance.
In both experiments, the participants were connected to a mechanical ventilator Hamilton G5 (Hamilton Medical, Bonaduz, Switzerland) through a non-invasive oronasal mask. The ventilator was set in the spontaneous mode, with a PEEP of 0 cmH2O, pressure support of 0 cmH2O, and FiO2 of 21%.
In E1, a cuirass [22] was placed on the chest and abdomen of the volunteers changing the pressure in the cuirass with an external controlled pump, which allowed the reduction of the respiratory system compliance. Four samples were recorded for each subject. The first sample was recorded without the cuirass, followed by three samples sequentially with pressures of 0, 10, and 20 cmH2O inside the cuirass.
In E2, two different external airflow resistors (Model 7100R; Hans Rudolph, Inc., Kansas City, MO) were used between the oronasal mask and the flow sensor. Three samples were recorded in each subject sequentially with resistive loads of 0, 5, and 20 cmH2O/L/s (see Figure 1).
Each sample consisted of a 3-minute recording, where the first two minutes were considered an adaption period after a change of stimulus because there is high variability among subjects during the transient. Therefore, only the last minute associated with stable state was analyzed in this study. As shown in Figure 1, the samples obtained per volunteer are recorded sequentially, e.g., in E2, the volunteer began with an external resistor of 0 cmH2O for 3 minutes, and subsequently, the external resistor was changed to 5 cmH2O; the 2 minutes following the change in resistance is considered the adaption period or time needed to stabilize the ventilatory process.

2.2. Subjects

The inclusion criterion was: Adult male subjects. The exclusion criteria were: subjects with a body mass index higher than 30, those undergoing medical treatment, with implanted electronic devices or thoracic trauma, those who had ingested alcohol 48 h prior, those who frequently use hallucinogens and who practiced yoga or pilates due to atypical breathing patterns [23].
A public and independent call for volunteers was made to participate in each experiment, looking for at least twenty-two participants per experiment in accordance with Equation (1) [24].
N = ( θ ( 1 θ ) z β + 0 . 5 z α 0 . 5 θ ) 2
where α is the significance value, β the statistical test power and θ the probability that the alternative hypothesis is met. With a reported variability of respiratory pattern of 0.15 (θ = 0.15) [25], α = 0.05 (Zα = 1.645), and β = 0.99 (Zβ = 2.326), the sample size N should be at least 22.3. According to this result, twenty-two volunteers (age of 25.95 ± 6.54 years, height of 173.18 ± 5.11 cm and weight of 72.90 ± 6.54 Kg) were enrolled to the restrictive maneuver experiment (E1) and thirty-two different volunteers (age of 26.62 ± 5.79 years, height of 172.45 ± 4.48 cm and weight of 72.82 ± 9.43 Kg) were enrolled to the obstructive maneuver experiment (E2) (see Figure 1).

2.3. Measurements and Signal Acquisition

2.3.1. Respiratory and Surface Electromyography Signals

Airflow, airway pressure and tidal volume signals were recorded using a datalogger attached to the mechanical ventilator (Hamilton Medical, Bonaduz, Switzerland) and sEMG of respiratory muscles was acquired with the biopotential amplifier Bagnoli-8 (Bagnoli EMG system, Delsys, Boston, US, 2003). A sampling frequency of 1024 Hz was used in both equipment for each single channel.
Ag-AgCl electrodes in bipolar configuration were placed on all subjects to record three respiratory muscles, diaphragm (Dia), intercostal (Int) and sternocleidomastoid (Strn). A pair of electrodes was used to record Dia, placed between the seventh and eighth intercostal spaces, located in the middle of the mid axillary line and the external clavicular line [26]. Electrodes placed in the second and third intercostal spaces, at the midclavicular line, were used to record Int [27], and electrodes between the mastoid process and mid-point of the muscle were used to record Strn [26].

2.3.2. Respiratory Mechanics

To estimate the respiratory system compliance, an occlusion for 3 seconds was set in the ventilator at the end of inspiration, the occlusion maneuver was performed by the mechanical ventilator during the last minute in the first respiratory cycle. Once the respiratory system compliance was estimated, an optimization algorithm was applied to calculate the airway resistance (see technical details in [28,29]).
After estimating the airway resistance and respiratory system compliance, the muscular pressure (Pmus) was calculated with equation of motion (2) and WOB with Equation (3) for each inspiratory cycle.
P mus = 1 C V T + R Q + PEEP T P aw
WOB r = 1 V T 0 t P mus × Q   dt
where Paw, Q, and VT represent pressure measured at the mouth, airflow, and tidal volume respectively. PEEPT is total positive pressure at the end of expiration, C is respiratory system compliance, R is airway resistance, and t is the inspiratory time [30].
According to the literature, depending of the subject’s effort and respiratory load, the WOB takes values in different ranges that can be divides into three groups [4,5,6,7,8], G1: [0.3–0.8) J/L, G2: [0.8–1.3] J/L, and G3: (1.3–1.8] J/L. The determined group was considered as the true value in the classification process.

2.4. Data Analysis

2.4.1. Indexes from Surface Electromyography of Respiratory Muscles

From the last minute, variable epochs of at least thirty seconds of sEMG signals were selected, avoiding motion artifacts per epoch. Each signal was filtered with a 4th-order Butterworth 60 Hz bandstop filter and a FIR bandpass filter between 10 Hz and 500 Hz [31,32]. Furthermore, a 5th-order RLS adaptive filter was used to reduce cardiac artifacts [33].
The ventilatory and sEMG signals were synchronized through an auxiliary signal recorded by both the ventilator and EMG amplifier [34] in order to identify the respiratory cycles. All indexes were calculated for each respiratory cycle during the epoch of thirty seconds, and the average was obtained for each sample.

Time Domain Indexes

The amplitude of sEMG signals was obtained through the Hilbert transformation and its maximum was calculated as the difference between maximum and minimum values during the inspiratory phase (see Figure 2) [16]. Information concerning muscle synchronization was obtained by calculating the Pearson’s correlation coefficient between sEMG amplitude signals [15] (see Table 1).

Frequency Domain Indexes

The power spectral density (PSD) of sEMG signals was estimated using the Burg method with an 8th-order (see Figure 2). Using the PSD, the central frequency and ratio between high and low frequencies, RHL (LF: 20–40 Hz and HF: 138–240 Hz) were calculated to quantify activation level of different types of muscle fibers [17,21]. Finally, the coherence between sEMG signals of different muscles was obtained to identify the muscle engagement in the frequency domain (see Table 1).

2.4.2. Work of Breathing Estimation

Figure 3 summarizes the methodology to estimate the level of WOB from sEMG signals. The first part consists of determining which indexes from the sEMG signals are relevant in describing the breathing pattern and the work of breathing. The second part includes two classification steps. The first one identifies whether the breathing pattern corresponds to a restrictive or obstructive one. Once the breathing pattern is identified, the subjects are classified into one of the three WOB levels, as established in the literature [4,5,6,7,8]. Lastly, the work of breathing is estimated using information from respiratory muscle sEMG signals.
• Relevant Indexes Selection
Before the first classification, a dimension reduction was performed to choose the most relevant indexes (see Section 2.3.1). The following two algorithms of relevant indexes selection were used: the stepwise regression and the mutual information criterion. Statistically significant indexes were examined using Kruskal-Wallis test, followed by the post hoc Tukey-Kramer test for multiple comparisons. Additionally, a Mann–Whitney test on each pair of groups was done to determine which groups differed from each other.
1. Stepwise Regression
The stepwise regression is a systematic method for adding and removing indexes based on their statistical significance in a regression [35]. In this study, the p-value for determining the use of an index was 0.05. The summarized sequential algorithm steps are [35]:
  • Calculus of correlation coefficients of n-indexes with the response variable Y.
  • Sort the n-indexes from highest to lowest correlation coefficient X = [x1, x2…..xn].
  • Add index xi to the P vector.
  • Calculus of regression and partial Fj-values between response variable Y and P, where j is the index in the P vector.
  • Selection of the lowest Fj-value and comparison between this and the F-value at α = 0.05 in the F-distribution.
  • If the Fj-value is higher than the F-value at α = 0.05, i is incremented by one, the index Pj is removed from the P vector.
  • Steps 3–6 are repeated until the last index enters the P vector.
The final P vector contains the relevant indexes.
2. Mutual Information
The mutual information gives an idea of the general statistical dependence between two variables [36]. In this study, the mutual information was calculated between each one of the sEMG indexes and the target group through Equation (4).
I ( X ; Y ) = H ( X ) H ( X , Y )
where X was each one of the indexes, Y the target group, and H the entropy of a random variable defined by Equation (5).
H ( X ) =   p ( X ) l o g 2 p ( x )
where p(X) is the probability density function of index X.
The indexes were sorted from higher to lower mutual information, and each one was examined with a multiple comparisons test.
3. Kruskal-Wallis and Post Hoc Analysis
The indexes selected with each one of the algorithms were examined with the Kruskal-Wallis test followed by the post hoc Tukey-Kramer multiple comparisons correction and Mann–Whitney tests on each pair of groups. Only the indexes that separate statistically (p-value < 0.05) in any of the groups were considered in the machine learning process.
• Machine Learning
Steps 2.1 and 2.2 in Figure 3 identify the respiratory muscular pattern and the WOB level, respectively.
Due to the fact that in clinical practice, knowing the ventilatory pattern is not common, its identification is necessary before the WOB level classification. In this study, the ventilatory pattern was defined according to the respiratory muscular activity, in order to know what muscles, participate in the ventilatory process.
Several supervised learning techniques were selected according to their wide and successful use in classifying biomedical data [18]. The techniques tested were: LDA, SVM, KNN, an ensemble algorithm, and NN. The parameters of the three first classifiers (LDA, SVM, and KNN) were optimized using the Bayesian optimization through the option of the MATLAB algorithms. In the case of the Neural Network, three hidden layer sizes, with default values of 10, 5 and 20, were tested. Table 2 shows the parameters obtained for greater accuracy (see Table 2).
For linear discriminant analysis (LDA), the indexes of sEMG were logarithmically transformed based on the fundamental assumption of normally distributed variables for this method. Indexes were standardized for the algorithms where the assumption is not applicable [37] (see configuration details in Table 2).
An ensemble technique was implemented to enhance the power of single classification techniques, looking to combine single classifiers through different strategies. In this study, the stacking algorithm was selected to combine three single classifiers or supervised methods (LDA, SVM, and KNN). The stacking algorithm has two levels (see Figure 4), the single classifiers (Ck) on the first level where the indexes are the inputs (Fn) and the correct classes are the outputs (Gn); at this level the single classifiers predict the classes (φk), which will be the inputs for the meta-classifier (supervised method) on the second level, where the outputs are also the correct classes [38]. The meta-classifier implemented in this study was a KNN model and the predicted classes (Φ) were compared with the correct classes.
Once the hidden layer size was determined for the fourth implemented classification algorithm, NN, one thousand neural networks were tested using a different randomized segmentation for training and validation dataset (80% and 20% respectively). Also, the initial weights were randomized for each one. The best NN was selected based on its relation to training and validation loss function.
The accuracy, specificity and sensitivity were calculated for the best algorithms according to Subasi et al. [39]. In the case of the WOB level classification, the calculus was as follows:
  • Accuracy: number of samples correctly classified/number of total samples
  • Specificity: number correctly classified as normal WOB/number of total normal WOB.
  • Sensitivity (Group 2 only): number correctly classified as medium WOB/number of total medium WOB.
  • Sensitivity (Group 3 only): number correctly classified as elevated WOB/number of total elevated WOB.
  • Sensitivity (Group 2 and Group 3): number correctly classified as high WOB/number of total high WOB.
• Modeling to Estimate the WOB
From previous patient observations [15,17], our research group state the following hypothesis: “high work of breathing implies high respiratory muscle activity, differentiating the diaphragm activity from accessory muscles”. Equation (6) is proposed in this article as a model to quantify work of breathing from the muscular activity of two accessory muscles and diaphragm.
W O B e =   α 1   ×   M a x A m p D i a   + α 2   × ( M a x A m p I n t   +   M a x A m p S t r n   )   M a x A m p D i a   +   M a x A m p I n t   +   M a x A m p S t r n
where MaxAmpDia, MaxAmpInt, and MaxAmpStrn are the maximum amplitudes of the surface electromyographic signals of the diaphragm, intercostal and sternocleidomastoid muscles respectively. α1 and α2 are coefficients that express the contribution of the main and accessory muscles respectively to achieve the necessary work of an inspiratory cycle.
Surface electromyography is a technique sensitive to size and type of tissue over the muscle, which influences the level of attenuation of the signal [18]. The standardization of Equation (6) by the sum of the maximum amplitudes was done to know the contribution of each muscle to the ventilatory process, reducing the effect of different anatomy structures in the surface electromyography recording.

Optimization of Model Parameters

An optimization algorithm based on sequential quadratic programming (SQP) was applied to find α1 and α2 values in each WOB group (G). Equation (7) was the function to be minimized.
J =   1 N i = 1 N | WOB r WOB e |
where N is the number of samples in each group, WOBr is the real work of breathing represented by Equation (3) and WOBe is the estimated work of breathing from muscular activity, using the proposed Equation (6).
In the optimization algorithm, two nonlinear constraints were proposed to find parameters with a physical meaning. The first constraint, Equation (8), looks for values of α1 and α2 that express the contribution of the diaphragm and accessory muscles, the sum of α1 and α2 must be equal to the proportion between the average work of breathing ( WOB rG ¯ ) and the average maximum amplitude of sEMG signals of all muscles ( MaxAmp G ¯ ) for each group (G).
α 1 G + α 2 G =   β G ;   where   G = 1 ,   2 ,   3 β G =   WOB rG ¯ MaxAmp G ¯
The second constraint, Equation (9), ensures that the highest coefficient is equivalent to the highest muscular activity. For example, if the maximum diaphragm amplitude is higher than the other two maximum amplitudes (intercostal and sternocleidomastoid), α1 will be higher than α2. In addition, if any of the maximum amplitudes of accessory muscles is higher than the maximum diaphragm amplitude, α2 will be higher than α1.
MaxAmpDia G > MaxAmpInt G   &   MaxAmpDia G > MaxAmpStrn G     α 1 G > α 2 G MaxAmpInt G > MaxAmpDia G   | |   MaxAmpStrn G > MaxAmpDia G     α 2 G > α 1 G
The model implementation and the parameter optimization were performed for each data set obtained from the Experiments 1 and 2. The validation technique was mainly K-fold 20%.

2.5. Statistical Analysis

For the normal distribution data, the mean and standard deviation are presented, and all other data are characterized by the median and interquartile range. Normal distribution was tested with the Lilliefors test. To compare two datasets, ANOVA and Kruskal-Wallis analyses were applied to the normal and non-normal distribution respectively. To compare more than two data sets, a Tukey-Kramer test was implemented. For all tests, statistical significance was assumed at p-value < 0.05.

3. Results

Seventy-six and eighty-three samples with work of breathing lower than 1.8 J/L (superior limit according to literature) were obtained from E1 and E2, respectively. Therefore, one hundred and fifty-nine samples were used in the training and testing of the algorithms. Figure 5 shows a scheme of the best model proposed.

3.1. Ventilatory Pattern Classification

The first step was classifying the samples into a respiratory pattern. Four out of the fifteen indexes from dimension reduction (stepwise regression and mutual information) were relevant in differentiating the samples between the restrictive and obstructive patterns. The indexes were coherence between the diaphragm and the accessory muscles (CDia-Int and CDia-Strn), the central frequency, and ratio between high and low frequencies of the sternocleidomastoid muscle (FCStrn and RHLStrn, respectively). Table 3 shows the median values and interquartile ranges of these four indexes. Furthermore, the p-value that indicates significant differences between E1 and E2 is presented.
The intercostal accessory muscle supports the diaphragm during obstructive maneuvers more than the sternocleidomastoid, with the highest coherence between the diaphragm and intercostal, which indicates synchronization of these muscles in the ventilatory process. In contrast, the sternocleidomastoid supports the diaphragm during restrictive maneuvers, with the highest coherence between diaphragm and sternocleidomastoid, and highest central frequency and ratio between high and low frequencies for the sternocleidomastoid, which indicates that this muscle has a higher engagement in the ventilatory process of restrictive maneuvers.
The classification capabilities of the machine learning algorithms to distinguish restrictive and obstructive patterns were 86.16%, 90.57% and 90.85% for LDA, SVM, and KNN, respectively, with KNN being the best algorithm; therefore, the latter was selected for the final model (see Figure 5).

3.2. WOB Level Classification
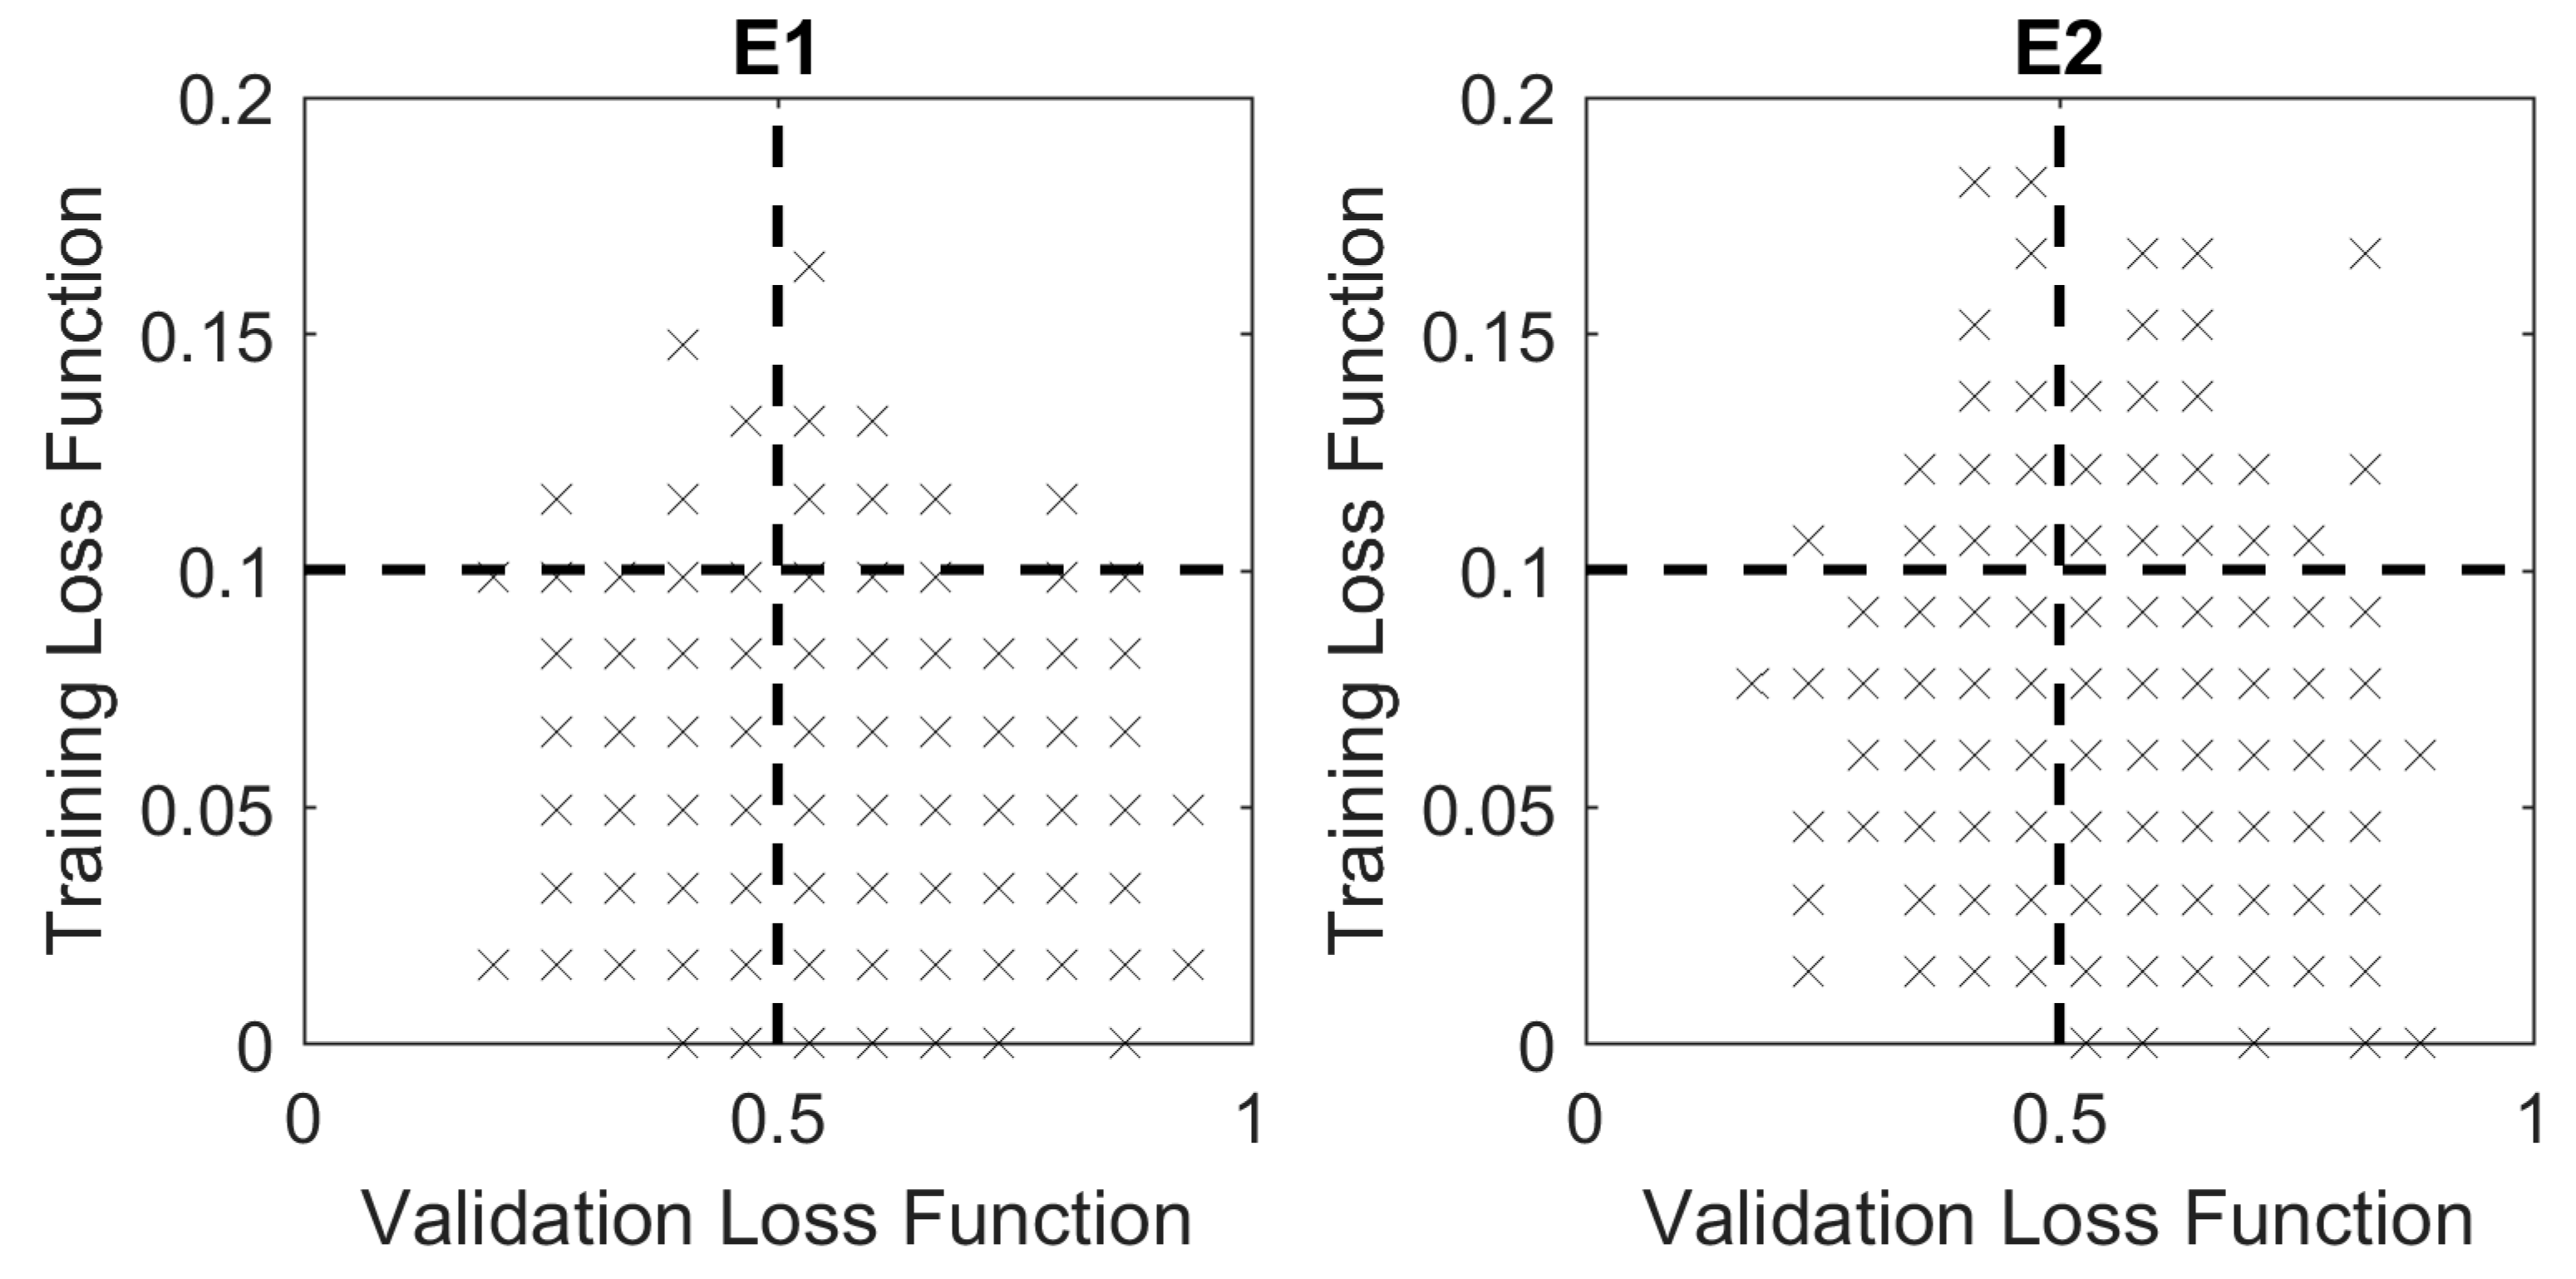
The second step was classifying the samples in one level of work of breathing. After applying the stepwise regression and mutual information tests, the MaxAmpDia and MaxAmpInt were relevant in identifying the level of WOB for E1, the MaxAmpDia and MaxAmpStrn for E2, and CDia-Int was relevant for both experiments. Table 4 shows the median values of each of the indexes, with the p-value for each pair of groups.
It should be noted that MaxAmpDia, MaxAmpInt and MaxAmpStrn median values increase when the work of breathing increases. MaxAmpDia separates G1 and G2 from G3 in both experiments. MaxAmpInt separates G1 from G2 and G3 in E1. MaxAmpStrn separates G1 and G2 from G3 in E2. In addition, CDia-Int separates G1 from G3 in E1 and G1 form G2 and G3 in E2.
It is noted that the features are not related in a linear manner, since the accuracy, specificity, and sensitivity were lower for the LDA model. For the case of the NN model, it is noted that the volunteers with elevated WOB (group 3) were different from the other groups in the restrictive database (E1), with a sensitivity of 100%, in contrast to 80% for the obstructive database (E2), such as group 1 or low WOB. However, in medium WOB, a sensitivity of 100% was achieved in the obstructive database, in contrast to 91.67% in the restrictive database. The above could indicate that during restrictive maneuvers, it was possible to achieve a greater number of samples for level 3 of WOB.
The selection of the neural network was according to the training and validation loss function relation, which is shown in Figure 6 for the restrictive and obstructive dataset. It is possible to observe that depending on the dataset obtained for validation (20%) and training (80%), the model could be overfitted, as is the case with the points located in the fourth quadrant in the figure, where it is possible to observe a training loss function of zero but a validation loss function of almost one, while in the third quadrant, there is the NN model, where the loss function of both datasets can be considered low. Therefore, this NN was selected.
The neural network selected for the final model (see Figure 4 and Table 5) obtained an accuracy of 89%, a specificity of 83.67%, a sensitivity of 96.36% (group 2 and group 3), a sensitivity of 90.12% (group 2), and a sensitivity of 89.66% (group 3) (see Table 6).

3.3. WOB Estimation

The last step was estimating the work of breathing value. Figure 7 shows the relation between the real work of breathing (WOBr) and the estimated work of breathing (WOBe) with coefficients α1 and α2 (see Table 4) of the groups found with the NN model. The real WOB and the estimated WOB have a Pearson correlation coefficient higher than 80%.
Figure 6 shows the dispersion of the data, where it is possible to observe that this is smaller for G3, offering higher precision in the prediction for cases that have a risky Work of Breathing (near the superior level). It is also possible to observe the samples that were classified with an incorrect WOB level, being points placed near the next or before the neighboring level, exactly in the overlapping region.

4. Discussion

It is widely known that the use of mechanical ventilation is a treatment that causes complications when used for prolonged periods, increasing patient mortality [40]. The work of breathing (WOB) is an accepted index to know the state of the ventilatory mechanics and respiratory muscles, nevertheless, the monitoring of WOB during spontaneous ventilation is not easy to perform [10].
This pilot study seeks to estimate the WOB in both restrictive and obstructive situations, taking advantage of its relationship with the respiratory muscle activity. Indexes from respiratory muscle sEMG signals were used to classify each one of the muscular patterns (restrictive and obstructive maneuvers) and each one of the levels of WOB.
Three indexes from the frequency domain, FC, RHL of the sternocleidomastoid and coherence (C) between the diaphragm and the accessory muscles discriminated the patterns between restrictive and obstructive (see Table 3). The FC and RHL of the sternocleidomastoid were higher in the restrictive pattern than in the obstructive one, which indicates that the activity of the sternocleidomastoid is located in the high frequency band, therefore, it has a high activity [17,21]. The coherence between the diaphragm and any accessory muscles makes it possible to infer the level of engagement of the involved accessory muscle, the sternocleidomastoid in the restrictive case. On the contrary, in the obstructive case, the muscle that supports the ventilatory process is the intercostal muscle, as observed in the coherence value between the diaphragm and intercostal, which is higher in this pattern than in the restrictive one.
Concerning WOB classification, two of the calculated indexes presented a statistically significant contribution to discriminate the samples: the amplitude and the coherence (see Table 4). The median of the maximum amplitude of sEMG signals of the diaphragm increased with increments in work of breathing in both experiments, confirming that this is the principal muscle in the ventilation process. A differentiated pattern was found related to the accessory muscle activity, the more significant accessory muscle for the restrictive maneuver (E1) was the intercostal muscle (maximum amplitude of sEMG) and in the case of the obstructive maneuver (E2), the significant changes were due to the sternocleidomastoid muscle. For the same reason, the coherence between the diaphragm and the intercostal increased in E1 and decreased in E2.
The findings show that during the ventilatory process of a subject with a restrictive pattern, the muscles with permanent activation are the diaphragm as the main muscle and the sternocleidomastoid as the accessory muscle engaged. However, as the work of breathing increases, there is also an increase in the intercostal muscle activity. Conversely, in a subject with an obstructive pattern, where the muscles are permanently activated are the diaphragm and the intercostal, but when the work of breathing increases, the muscle that showed increments was the sternocleidomastoid.
To identify the muscular pattern between restrictive or obstructive, the best technique was the KNN, obtaining an accuracy of 91%. Meanwhile, to identify the level of work of breathing, LDA, SVM and KNN showed accuracies lower than 60%. Combining the properties of some of these classifiers, the accuracy reached is lower than 80%. However, the neural network was the algorithm with the greatest accuracy, achieving a mean of 89% for the all dataset (see Table 5). It should be noted that the accuracy of the classification of WOB level depends on the real WOB (WOBr), and this was calculated from values of compliance, resistance, and muscular pressure, obtained with an occlusion maneuver and optimization algorithms, thus WOBr may have an estimation error [28,29]. In future work, the classifiers should be validated to increase the accuracy, recording the real WOB with invasive methods in patients with invasive mechanical ventilation.
The proposed algorithm might be useful in critical care medicine, due to its ability to identify the level of work of breathing in a non-invasive manner. With a specificity of 83.67% and a sensitivity (Group 2 and Group 3) of 96.36% (see Figure 5 and Table 6), it is possible to predict who could have a successful weaning, which in terms of low WOB is in line with the study of Kirton et al. [8], where 96% of patients with a work of breathing lower than 0.8 J/L had a successful weaning process.
The model proposed in this study relates work of breathing with the maximum amplitudes of sEMG signals of the diaphragm and two accessory muscles, the intercostal and sternocleidomastoid. However, due to the normalization process, it was necessary to find different coefficients according to the level of WOB. The coefficients indicate the contribution to the ventilatory process of each of the muscles. In all cases, the muscle with the most contribution was the diaphragm with 55% for the first group and 53% for the other groups; additionally, the remaining contribution was distributed between the other respiratory muscles.
The coefficients (α1 y α2) in both experiments were similar, because the minimum error for all the dataset was in the median value of the group. In that case, it was possible to consider only one model for both cases, restrictive and obstructive patterns.
The proposed approach estimates the value of work of breathing with an accuracy of 80.43%. Other authors have shown non-invasive techniques to estimate the work of breathing. Vicario et al. [41] presented a model that estimates the work of breathing of mechanically ventilated patients, using ventilatory signals such as airway pressure, volume, and airflow. Their model offers favorable results in cases in which the patients have normal and controlled respiratory efforts, but it has limitations for uncontrolled efforts. Banner et al. [11,20] presented an Artificial Neuronal Network to estimate the power of breathing or work of breathing per minute from parameters like spontaneous minute ventilation, inspiratory trigger pressure, inspiratory flow rise time, intrinsic PEEP and respiratory muscle pressure, where the last two parameters depend on the respiratory system compliance and airway resistance calculated from controlled ventilations. The model presented in this study can predict the WOB at different levels during total spontaneous ventilation and has the advantage that it does not need ventilatory signals, i.e., it is possible to know the work of breathing in situations that do not require mechanical ventilation or devices to record ventilatory signals that can affect the respiratory mechanics.
This pilot study suggests that the work of breathing can be estimated by measuring the activity of respiratory muscles using surface electromyography. In accordance with other authors who inferred it in previous works, like Salazar M, et al. [15], who found a promising index to assess the participation of respiratory muscle on spontaneous breathing test in poisoned patients, Schmidt M, et al. [14], who showed that measurements of accessory inspiratory muscles by sEMG can contribute to a reliable non-invasive indicator of respiratory effort in mechanically ventilated patients, and Hernandez et al. [21], who showed that changes in indexes from sEMG of the diaphragm and sternocleidomastoid are related to changes in the level of PEEP.
Furthermore, the work of breathing was estimated in different ventilatory patterns in spontaneous ventilation, which corroborates the close relationship, not only of the diaphragm, but of the accessory muscles with the ventilatory process. This offers a promising technique in different areas, mainly in critical care medicine, because the information obtained with this model will not only indicate the state of the patient during mechanical ventilation, but it will also help medical staff decide whether or not a patient needs treatment with mechanical ventilation, determine the right extubation moment and optimize the mechanical ventilator settings. However, for future work, a database of patients in ICU would be recorded to validate the model and its possible use in the daily routine of healthcare professionals.

Author Contributions

Design of the work, I.C.M. and A.M.H.; the data acquisition, I.C.M.; analysis, I.C.M., A.M.H., M.Á.M.; writing—original draft preparation, I.C.M.; writing—review and editing, A.M.H., M.Á.M., and I.C.M.; final approval of the version to be published, A.M.H. and M.Á.M.

Funding

Research was partially supported by PGR-CODI-2015-7851 “Análisis de la actividad muscular respiratoria en ventilación mecánica no invasiva y su relación con la configuración del ventilador”. Grant by University of Antioquia (Medellín, Antioquia, Colombia). By FP44842-450-2018 “Desarrollo de aplicaciones móviles para el aprendizaje del sistema respiratorio: Conceptos básicos, diagnóstico de enfermedades, terapia y rehabilitación”. Grant by Sistema General de Regalías fondos de CTeI de la Gobernación de Antioquia, administrados a través del patrimonio autónomo fondo nacional de financiamiento para la ciencia, la tecnología y la innovación francisco José de Caldas. And by the Spanish Ministry of Economy and Competitiveness- Spain project DPI2017-83989-R.

Conflicts of Interest

The authors declare no conflict of interest.

References

  1. Grinnan, D.C.; Truwit, J.D. Clinical review: Respiratory mechanics in spontaneous and assisted ventilation. Crit. Care 2005, 9, 472–484. [Google Scholar] [CrossRef] [Green Version]
  2. Brochard, L.; Martin, G.S.; Blanch, L.; Pelosi, P.; Belda, F.J.; Jubran, A.; Gattinoni, L.; Mancebo, J.; Ranieri, V.M.; Richard, J.C.M.; et al. Clinical review: Respiratory monitoring in the ICU—A consensus of 16. Crit. Care 2012, 16, 219. [Google Scholar] [CrossRef] [PubMed]
  3. Tulaimat, A.; Patel, A.; Wisniewski, M.; Gueret, R. The validity and reliability of the clinical assessment of increased work of breathing in acutely ill patients. J. Crit. Care 2016, 34, 111–115. [Google Scholar] [CrossRef] [PubMed]
  4. Aboussouan, L. Respiratory Failure and the Need for Ventilatory Support. In Egan’s Fundamentals of Respiratory Care, 11th ed.; Kacmarek, R., Stoller, J., Heuer, A., Eds.; Elsevier: St. Louis, MO, USA, 2017; pp. 971–986. [Google Scholar]
  5. Piraino, T. Monitoring the Patient in the Intensive Care Unit. In Egan’s Fundamentals of Respiratory Care, 11th ed.; Kacmarek, R., Stoller, J., Heuer, A., Eds.; Elsevier: St. Louis, MO, USA, 2017; pp. 1154–1189. [Google Scholar]
  6. Sharp, J.T.; Henry, J.P.; Sweany, S.K.; Meadows, W.R.; Pietras, R.J. The Total Work of Breathing in Normal and Obese Men. J. Clin. Investig. 1964, 43, 728–739. [Google Scholar] [CrossRef]
  7. Diehl, J.L.; Mercat, A.; Guérot, E.; Aïssa, F.; Teboul, J.L.; Richard, C.; Labrousse, J. Helium/oxygen mixture reduces the work of breathing at the end of the weaning process in patients with severe chronic obstructive pulmonary disease. Crit. Care Med. 2003, 31, 1415–1420. [Google Scholar] [CrossRef]
  8. Kirton, O.C.; DeHaven, C.B.; Morgan, J.P.; Windsor, J.; Civetta, J.M. Elevated imposed work of breathing masquerading as ventilator weaning intolerance. Chest 1995, 108, 1021–1025. [Google Scholar] [CrossRef] [PubMed]
  9. Umbrello, M.; Formenti, P.; Longhi, D.; Galimberti, A.; Piva, I.; Pezzi, A.; Mistraletti, G.; Marini, J.J.; Iapichino, G. Diaphragm ultrasound as indicator of respiratory effort in critically ill patients undergoing assisted mechanical ventilation: A pilot clinical study. Crit. Care 2015, 19, 161. [Google Scholar] [CrossRef]
  10. Khirani, S.; Polese, G.; Aliverti, A.; Appendini, L.; Nucci, G.; Pedotti, A.; Colledan, M.; Lucianetti, A.; Baconnier, P.; Rossi, A. On-line monitoring of lung mechanics during spontaneous breathing: A physiological study. Respir. Med. 2010, 104, 463–471. [Google Scholar] [CrossRef] [PubMed]
  11. Banner, M.J.; Tams, C.G.; Euliano, N.R.; Stephan, P.J.; Leavitt, T.J.; Martin, A.D.; Al-Rawas, N.; Gabrielli, A. Real time noninvasive estimation of work of breathing using facemask leak-corrected tidal volume during noninvasive pressure support: Validation study. J. Clin. Monit. Comput. 2016, 30, 285–294. [Google Scholar] [CrossRef] [PubMed]
  12. Schmidt, M.; Chiti, L.; Hug, F.; Demoule, A.; Similowski, T. Surface electromyogram of inspiratory muscles: A possible routine monitoring tool in the intensive care unit. Br. J. Anaesth. 2011, 106, 913–914. [Google Scholar] [CrossRef]
  13. Schmidt, M.; Banzett, R.B.; Raux, M.; Morélot-Panzini, C.; Dangers, L.; Similowski, T.; Demoule, A. Unrecognized suffering in the ICU: Addressing dyspnea in mechanically ventilated patients. Intensive Care Med. 2014, 40, 1–10. [Google Scholar] [CrossRef]
  14. Schmidt, M.; Kindler, F.; Gottfried, S.B.; Raux, M.; Hug, F.; Similowski, T.; Demoule, A. Dyspnea and surface inspiratory electromyograms in mechanically ventilated patients. Intensive Care Med. 2013, 39, 1368–1376. [Google Scholar] [CrossRef]
  15. Salazar, M.B.; Hernandez, A.M.; Mananas, M.A. Assessment of mechanically ventilated patients intoxicated with organophosphates by a novel surface electromyographic index. J. Crit. Care 2017, 41, 260–267. [Google Scholar] [CrossRef]
  16. Salazar, M.B.; Hernandez, A.M.; Mananas, M.A.; Zuluaga, A.F. Potential clinical application of surface electromyography as indicator of neuromuscular recovery during weaning tests after organophosphate poisoning. Rev. Bras. Ter. Intensiv. 2017, 29, 253–258. [Google Scholar] [Green Version]
  17. Munoz, I.C.; Hernandez, A.M.; Alonso, J.F.; Mananas, M.Á.; Atehortúa, L.H. Assessment of weaning indexes based on diaphragm activity in mechanically ventilated subjects after cardiovascular surgery. A pilot study. Rev. Bras. Ter. Intensiv. 2017, 29, 213–221. [Google Scholar] [Green Version]
  18. Chowdhury, R.; Reaz, M.; Ali, M.; Bakar, A.; Chellappan, K.; Chang, T. Surface Electromyography Signal Processing and Classification Techniques. Sensors 2013, 13, 12431–12466. [Google Scholar] [CrossRef] [Green Version]
  19. Perchiazzi, G.; Rylander, C.; Pellegrini, M.; Larsson, A. Monitoring of total positive end-expiratory pressure during mechanical ventilation by artificial neural networks. J. Clin. Monit. Comput. 2017, 31, 551–559. [Google Scholar] [CrossRef]
  20. Banner, M.J.; Euliano, N.R.; Brennan, V.; Peters, C.; Layon, A.J.; Gabrielli, A. Power of breathing determined noninvasively with use of an artificial neural network in patients with respiratory failure. Crit. Care Med. 2006, 34, 1052–1059. [Google Scholar] [CrossRef]
  21. Hernández, A.M.; Salazar, M.B.; Muñoz, I.C. Efecto del incremento del PEEP en la actividad muscular respiratoria en sujetos sanos bajo ventilación espontánea. IATREIA 2016, 29, 280–291. [Google Scholar]
  22. Muñoz, I.C.; Urrego, D.A.; Vallejo, A.F.; Hernández, A.M. Device for simulation of restrictive pathologies in healthy subjects with non-invasive mechanical ventilation. Rev. Fac. Ing. Univ. Antioq. 2018, 1, 19–26. [Google Scholar] [CrossRef]
  23. Stănescu, D.C.; Nemery, B.; Veriter, C.; Maréchal, C. Pattern of breathing and ventilatory response to CO2 in subjects practicing hatha-yoga. J. Appl. Physiol. 1981, 51, 1625–1629. [Google Scholar] [CrossRef]
  24. Chakraborti, S.; Gibbons, J.D. Nonparametric Statistical Inference, 4th ed.; Marcel Dekker, Inc.: New York, NY, USA, 2003. [Google Scholar]
  25. Hernández, A.M. Sistema de Control. Respiratorio Ante Estímulos y Patologías. Análisis, Modelado y Simulación, 1st ed.; Publicia: Saarbrücken, Germany, 2007. [Google Scholar]
  26. Alonso, J.F.; Mañanas, M.A.; Rojas, M.; Bruce, E.N. Coordination of respiratory muscles assessed by means of nonlinear forecasting of demodulated myographic signals. J. Electromyogr. Kinesiol. 2011, 21, 1064–1073. [Google Scholar] [CrossRef] [Green Version]
  27. Chien, M.Y.; Wu, Y.T.; Chang, Y.J. Assessment of diaphragm and external intercostals fatigue from surface EMG using cervical magnetic stimulation. Sensors 2008, 8, 2174–2187. [Google Scholar] [CrossRef] [PubMed]
  28. Muñoz, I.C.; Hernández, A.M. Noninvasive approach to estimate ventilatory mechanics in spontaneous breathing with different PEEP and pressure support values: Validation with mechanical simulation. In Proceedings of the VII Latin American Congress on Biomedical Engineering CLAIB 2016, Bucaramanga, Santander, Colombia, 26–28 October 2016; pp. 241–244. [Google Scholar]
  29. Munoz, I.C.; Hernández, A.M. Cambios en la mecánica ventilatoria debidos a variaciones de la PEEP y la presión soporte: Estudio en sujetos sanos bajo ventilación mecánica no invasiva. Rev. Fac. Med. 2017, 65, 321–328. [Google Scholar] [CrossRef]
  30. Becher, T.; Schädler, D.; Rostalski, P.; Zick, G. Determination of respiratory system compliance during pressure support ventilation by small variations of pressure support. J. Clin. Monit. Comput. 2018, 32, 741–751. [Google Scholar] [CrossRef]
  31. De Luca, C.J.; Donald, G.L.; Kuznetsov, M.; Roy, S.H. Filtering the surface EMG signal: Movement artifact and baseline noise contamination. J. Biomech. 2010, 43, 1573–1579. [Google Scholar] [CrossRef]
  32. Merletti, R.; Parker, P.A. Electromyography: Physiology, Engineering, and Non-Invasive Applications; John Wiley & Sons, Inc.: Hoboken, NJ, USA, 2004. [Google Scholar]
  33. Haykin, S.S. Adaptive Filter Theory, 5th ed.; Pearson Education: Upper Saddle River, NJ, USA, 2014. [Google Scholar]
  34. Camacho, A.; Hernandez, A.M.; Londono, Z.; Serna, L.Y.; Mananas, M.A. A synchronization system for the analysis of biomedical signals recorded with different devices from mechanically ventilated patients. In Proceedings of the 2012 Annual International Conference of the IEEE Engineering in Medicine and Biology Society (EMBC), San Diego, CA, USA, 28 August–1 September 2012; pp. 1944–1947. [Google Scholar]
  35. Draper, N.R.; Smith, H. Selecting the “Best” Regression Equation. In Applied Regression Analysis, 3rd ed.; Draper, N.R., Smith, H., Eds.; John Wiley & Sons, Inc.: New York, NY, USA, 1998; pp. 335–336. [Google Scholar]
  36. Tourassi, G.D.; Frederick, E.D.; Markey, M.K.; Floyd, C.E. Application of the mutual information criterion for feature selection in computer-aided diagnosis. Med. Phys. 2001, 28, 2394–2402. [Google Scholar] [CrossRef]
  37. Hwang, W. Data Mining in Ergonomics. In International Encyclopedia of Ergonomics and Human Factors, 2nd ed.; Karwowski, W., Ed.; Taylor & Francis Group: Louisville, KY, USA, 2006; pp. 3077–3081. [Google Scholar]
  38. Polikar, R. Ensemble based systems in decision making. IEEE Circuits Syst. Mag. 2006, 6, 21–45. [Google Scholar] [CrossRef]
  39. Subasi, A.; Yilmaz, M.; Ozcalik, H.R. Classification of EMG signals using wavelet neural network. J. Neurosci. Methods 2006, 156, 360–367. [Google Scholar] [CrossRef] [PubMed]
  40. Guler, H.; Kilic, U. The development of a novel knowledge-based weaning algorithm using pulmonary parameters: A simulation study. Med. Biol. Eng. Comput. 2017, 56, 373–384. [Google Scholar] [CrossRef] [PubMed]
  41. Vicario, F.; Albanese, A.; Wang, D.; Karamolegkos, N.; Chbat, N.W. Constrained optimization for noninvasive estimation of work of breathing. In Proceedings of the 37th Annual International Conference of the IEEE Engineering in Medicine and Biology Society (EMBC), Milano, Italy, 25–29 August 2015; pp. 5327–5330. [Google Scholar]
Figure 1. Experimental set-up. Two independent experiment were performed: in experiment 1 (E1), 22 volunteers were enrolled, and 4 samples per volunteer were obtained; and in experiment 2 (E2), 32 volunteers were enrolled, and 3 samples per volunteer were obtained.
Applsci 09 02007 g001
Figure 2. sEMG indexes in time and frequency domain during the inspiratory phase. MaxAmp, the maximum amplitude of the sEMG signal; HF and LF, the high and low frequency ranges for calculating RHL.
Applsci 09 02007 g002
Figure 3. Methodology to estimate the level of WOB from sEMG signals. 1—determining which of 15 indexes from the sEMG signals are relevant to describe the breathing pattern and the work of breathing. 2—classification steps: 2.1—identifying if the breathing pattern corresponds to a restrictive or obstructive one; 2.2—classifying the subject in one of three groups of WOB. 3—estimating work of breathing. The results of each step of the methodology are presented in Figure 5.
Applsci 09 02007 g003
Figure 4. Stacking algorithm representation. In the first level, the features of the sEMG signals enter into the single classifiers (LDA, SVM or KNN); the results of these classifiers are the entry features of the metaclassifier, in this case, a KNN classifier.
Applsci 09 02007 g004
Figure 5. Scheme of the best model found to estimate WOB. In the first part, the samples were classified by a KNN algorithm, according to the muscular pattern, with an accuracy of 91%. In the second part, the samples were classified by a NN algorithm, according to WOB level, with an accuracy of 89%. In the last part, the WOB value was predicted with an accuracy of 80.42%.
Applsci 09 02007 g005
Figure 6. Validation and training loss function relation for the one thousand NN of experiment 1 (E1: restrictive dataset) and experiment 2 (E2: obstructive dataset).
Applsci 09 02007 g006
Figure 7. Real work of breathing (WOBr) compared with the estimated work of breathing (WOBe) in each one of the groups. The linear regression analysis is presented.
Applsci 09 02007 g007
Table 1. sEMG indexes in time and frequency domains for each one of the recorded muscles, diaphragm (Dia), intercostal (Int) and sternocleidomastoid (Strn).
IndexTime DomainIndexFrequency Domain
MaxAmpjMaximum amplitude of the sEMG signal of muscle j: Dia, Int or StrnFcjThe central frequency of power spectral density of sEMG signal of muscle j
Rj-kPearson correlation between pairs of amplitudes of sEMG signals of the muscles j and kRHLjThe ratio between high and low frequencies of power spectral density of sEMG signal of muscle j
Cj-kSpectral coherence between pairs of sEMG signals of the muscles j and k
Table 2. Information about configuration and validation of each of the classification algorithms. The algorithms used in each of the cases, classification of the respiratory muscular pattern and WOB level, are specified. LDA: Linear Discriminant Analysis, SVM: Support Vector Machine, KNN: K-Nearest Neighbor, NN: Neural Network.
Respiratory Muscular Pattern
Classifier AlgorithmConfigurationValidation
LDAGamma = 0
Delta = 0
Discriminant type: linear
Indexes: logarithmic transformed
K-fold 20%
SVMBox Constraint = 962.47
Kernel Scale = 8.4
Kernel Function: Gaussian
Indexes: Standardized
K-fold 20%
KNNDistance: Euclidean
Number of Neighbors: 2
Indexes: Standardized
K-fold 20%
WOB LEVEL
Classifier AlgorithmExperiment 1Experiment 2Validation
ConfigurationConfiguration
LDAGamma = 0.49
Delta = 0.06
Discriminant type: linear
Indexes: logarithmic transformed
K-fold 20%
SVMBox Constraint = 1
Kernel Scale = 1
Kernel Function: Gaussian
Indexes: Standardized
Box Constraint = 0.7416
Kernel Scale = 110.77
Kernel Function: Gaussian
Indexes: Standardized
K-fold 20%
KNNDistance: Euclidean
Number of Neighbors: 2
Indexes: Standardized
K-fold 20%
META-CLASSIFIER KNNDistance: Euclidean
Number of Neighbors: 2
Indexes: Standardized
K-fold 20%
NNTraining function: Levenberg-Marquardt
hidden layer: 1
hidden layer sizes: 10
input layer sizes: 4
output layer sizes: 3
Indexes: Standardized
K-fold 20%
Table 3. Restrictive and obstructive breathing pattern classification. The median values and interquartile ranges of each index are shown.
IndexExperimentP-Value
Restrictive (E1)Obstructive (E2)
CDia-Int0.67 [0.64–0.73]0.75 [0.72–0.80]<0.01
CDia-Strn0.72 [0.70–0.76]0.65 [0.62–0.70]<0.01
FCStrn (Hz)77.84 [68.24–86.71]62.37 [58.46–67.88]<0.01
RHLStrn169.76 [107.71–229.17]92.07 [55.00–131.52]<0.01
Table 4. Median and standard deviation of real work of breathing values for each group. G1: Low WOB; G2: medium-high WOB; G3: elevated WOB. Furthermore, the parameters of each model and the selected index values for classification model are shown.
Parameter/IndexRestrictive (E1)P-Value
G1G2G3G1- G2G1- G3G2- G3
WOBr (J/L)0.61 ± 0.131.02 ± 0.141.52 ± 0.13<0.05<0.05<0.05
MaxAmpDia (mV)0.024 [0.022–0.030]0.032 [0.022–0.049]0.054 [0.040–0.068]*<0.05<0.05
MaxAmpInt (mV)0.020 [0.016–0.027]0.032 [0.020–0.043]0.034 [0.020–0.049]<0.05<0.05*
MaxAmpStrn (mV)0.018 [0.010–0.024]0.021 [0.014–0.036]0.021 [0.017–0.041]***
CDia-Int0.66 [0.62–0.68]0.67 [0.65–0.75]0.71 [0.67–0.83]*<0.05*
α10.55 ± 10-51.07 ± 0.041.55 ± 10–5---
α20.45 ± 10-50.93 ± 0.041.45 ± 10–5---
Obstructive (E2)
WOBr (J/L)0.63 ± 0.121.03 ± 0.141.51 ± 0.12<0.05<0.05<0.05
MaxAmpDia (mV)0.028 [0.021–0.038]0.031 [0.023–0.047]0.050 [0.038–0.083]*<0.05<0.05
MaxAmpInt (mV)0.016 [0.010–0.029]0.019 [0.013–0.036]0.023 [0.015–0.045]***
MaxAmpStrn (mV)0.016 [0.010–0.023]0.017 [0.013–0.022]0.030 [0.019–0.048]*<0.05<0.05
CDia-Int0.79 [0.75–0.84]0.75 [0.72–0.78]0.73 [0.69–0.75]<0.05<0.05*
α10.55 ± 10–51.05 ± 10–51.55 ± 10–5---
α20.45 ± 10–50.95 ± 10–51.45 ± 10–5---
* There are no statistically significant differences between groups.
Table 5. Classification accuracies, specificities, and sensitivities obtained for each of the machine learning algorithms for both experiments. In the case of neural networks, the accuracy is determined using 20% of the dataset for validation and the between-brackets accuracy is determined using 100% of the dataset.
AlgorithmAccuracy (%)Specificity (%)Sensitivity (%)
(Group 2)
Sensitivity (%)
(Group 3)
E1E2E1E2E1E2E1E2
LDA56.5855.4257.6917.3963.8975.5635.7153.33
SVM47.3756.630010010000
KNN39.4754.2234.6252.1741.6764.4442.8626.67
STACKING (LDA-SVM-KNN)35.5346.9953.8517.3925.0077.7821.430
STACKING (LDA-KNN-KNN)40.7948.1942.3117.3944.4475.5628.5713.33
STACKING (SVM-KNN-KNN)47.3737.3542.3165.2266.6724.447.1433.33
STACKING (LDA-SVM-KNN-KNN)50.0043.3734.6234.7866.6762.2235.710
NN80.00 [93.42]82.35 [91.57]92.3182.6191.6710010080
Table 6. Confusion matrix for the final classification model of Figure 4.
Real Values
Group 1Group 2Group 3Total
Predicted ValuesGroup 1414045
Group 2573381
Group 3342633
Total498129159

