Article

Evaluation of the Thermoelectric Energy Harvesting Potential at Different Latitudes Using Solar Flat Panels Systems with Buried Heat Sink

by
Pedro Carvalhaes-Dias
1,2,3,†,
Andreu Cabot
2,4,*,† and
J. A. Siqueira Dias
2,3,†
1
Paraná Federal University of Technology—UTFPR, Cornélio Procópio, PR 86300-000, Brazil
2
Catalonia Institute for Energy Research (IREC), Jardins de les Dones de Negre 1, 08930 Barcelona, Spain
3
Department of Semiconductors, Instruments and Photonics, School of Electrical and Computer Engineering, University of Campinas, Campinas, SP 13083-820, Brazil
4
Institució Catalana de Recerca i Estudis Avançats (ICREA), Pg. Lluís Companys 23, 08010 Barcelona, Spain
*
Author to whom correspondence should be addressed.
All authors contributed equally to this work.
Appl. Sci. 2018, 8(12), 2641; https://doi.org/10.3390/app8122641
Submission received: 20 November 2018 / Revised: 10 December 2018 / Accepted: 11 December 2018 / Published: 16 December 2018
(This article belongs to the Special Issue Thermoelectric Power Generation: Material through to System Design)

Abstract

:
Thermoelectric generators (TEG) can harvest solar energy during the day using solar flat panels. They can also benefit from the use of a material that stores solar energy to generate additional power at night, when the panel cools down and the energy stored in this material travels back, through the TEG. The soil can be used as the material that stores solar energy, but the performance of such systems, with the heat sink buried in the soil, depends on the ambient and the soil temperature, parameters which can change drastically with the latitude of the location where the TEG is installed. We present an experimental study with the comparison of the potential energy that can be collected from a TEG system with heat sink buried at different depths and at different latitudes: Campinas, Brazil − 22 54 20 S; and Mataró, Catalonia, Spain − 41 32 17 N. The potential of energy harvesting calculated during 32 winter days in Campinas is 72% of the total calculated during 205 days in Mataró. Experimental results obtained from a complete TEG system showed that in Campinas, during one day, it was possible to store 34.11 J of electrical energy in a supercapacitor. Notably, we demonstrate that the energy generated during the night by the heat stored into the soil can be as high as the energy generated during the day.

1. Introduction

Energy harvesting with thermoelectric generators (TEGs) is usually exploited in applications where large temperature differences can be found, such as combustion engines [1] and industrial furnaces and pipes, as described in [2]. Some more unconventional sources, such as train wheels and axis, where friction with the rails causes heat build-ups, has been also targeted [3]. There are even some extreme cases where the temperature difference is generated exclusively for the purpose of thermoelectric energy harvesting, such as in radioisotope TEGs used in some satellites and space probes [4], which uses radioactive isotopes to generate heat, and convert this heat to electrical energy.
TEG energy harvesting based on environmental temperatures has been also extensively studied in the last two decades, especially for powering autonomous sensors. Converters of human warmth for self-powered sensor nodes were studied by [5,6], thermoelectric energy harvesting in aircraft was studied by [7] and an energy-aware sensor node design was investigated by [8].
A very common application for energy harvesting systems is in wireless sensor networks (WSN), especially in sensors that stay in hard-to-reach places or when maintenance costs are prohibitive [9]. Akbari et al. [10] studied different types of energy harvesting for WSN, ranging from photovoltaic to thermoelectric and RF energy harvesting. Their work concluded that in similar conditions, although solar and vibration energy harvesting seem to provide the most amount of power per cm 2 , with an average of 100 μ W per cm 2 , the harvesting of ubiquitous thermal energy is still very viable, with an average of 60 μ W per cm 2 .
In particular, TEGs can harvest solar thermal energy using solar-flat panels and different configurations of the heat sink, including the use of a heat sink left at the ambient temperature, panels with dissipation phase changing materials (PCMs) in contact with the heat sink (as seen in the works of [11,12]), and TEGs with the heat sink buried in the soil [13]. Among the different configurations, the use of the soil as heat sink is particularly interesting as it allows harvesting energy during both day and night time and is significantly more economic than the use of PCMs.
A simple diagram, showing the heat flow in an energy harvesting flat panel system with buried heat sink is shown in Figure 1.
A study conducted in [14] has demonstrated that, using a low voltage DC-DC converter such as the LTC3108 from Analog Devices, it is possible to harvest energy when the effective temperature gradient across the junctions of the TEG (difference of temperature between the hot and cold sides of the TEG) is Δ T 1 C.
As shown in [15], the electrical power delivered by a TEG, P e l e c , depends on Δ T 2 , and can be written as:
P e l e c = α n α p R L R L + R T E G 2 Δ T 2
where α n and α p are the Seebeck coefficients of the n and p elements of the TEG, R T E G is the output impedance of the TEG, and R L is the impedance of the external load.
Therefore, if we compare the temperature difference between the flat panel and the buried heat sink in different locations (and different depths of the heat sink), we can determine the optimal depth for the heat sink and also provide a good estimation of the energy harvesting capability of a solar flat panel in each location.
In this work we present an experimental study of solar TEGs (STEGs) that make use of heat sinks buried in the soil. We study their potential for energy harvesting as a function of the depths of the heat sink, at two latitudes: one at the Northern Hemisphere and one at the Southern Hemisphere. We performed an analysis of the daily temperature difference between the temperature profiles of the panel and the soil (at various depths), determining the optimal depth for the installation of a STEG at different latitudes. A prototype of a solar flat panel with a TEG was fabricated and installed in the Southern Hemisphere in order to evaluate the electrical energy stored in a supercapacitor during 32 days of operation.

2. Materials and Methods

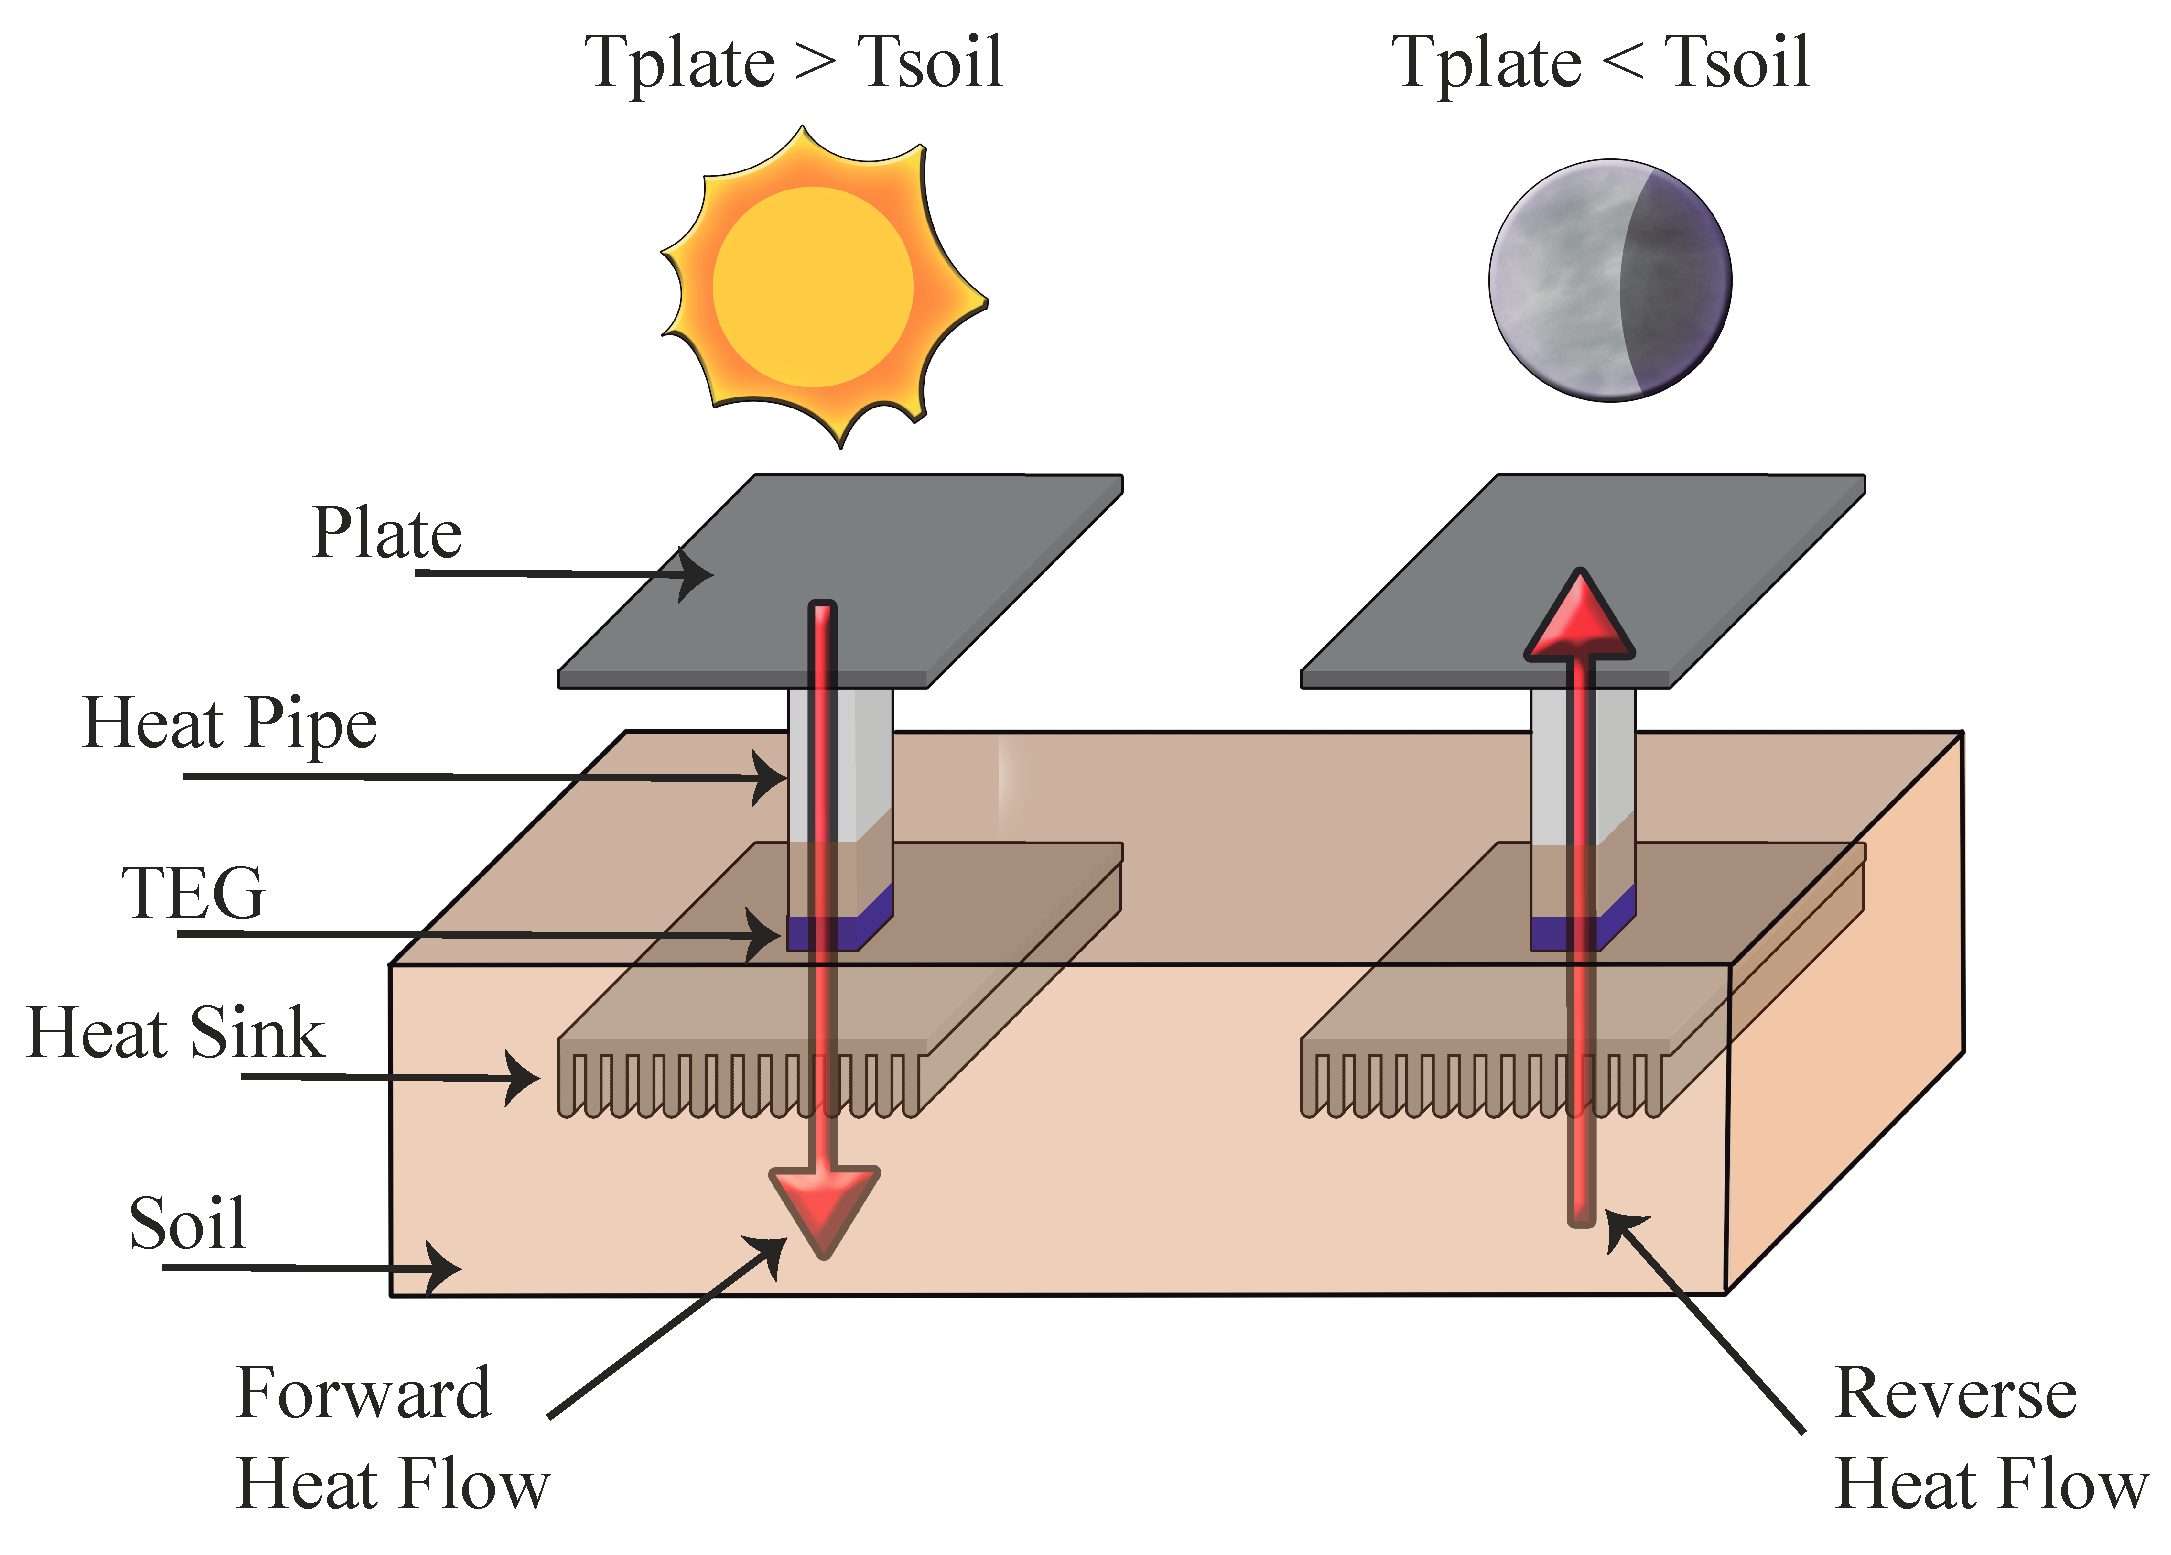
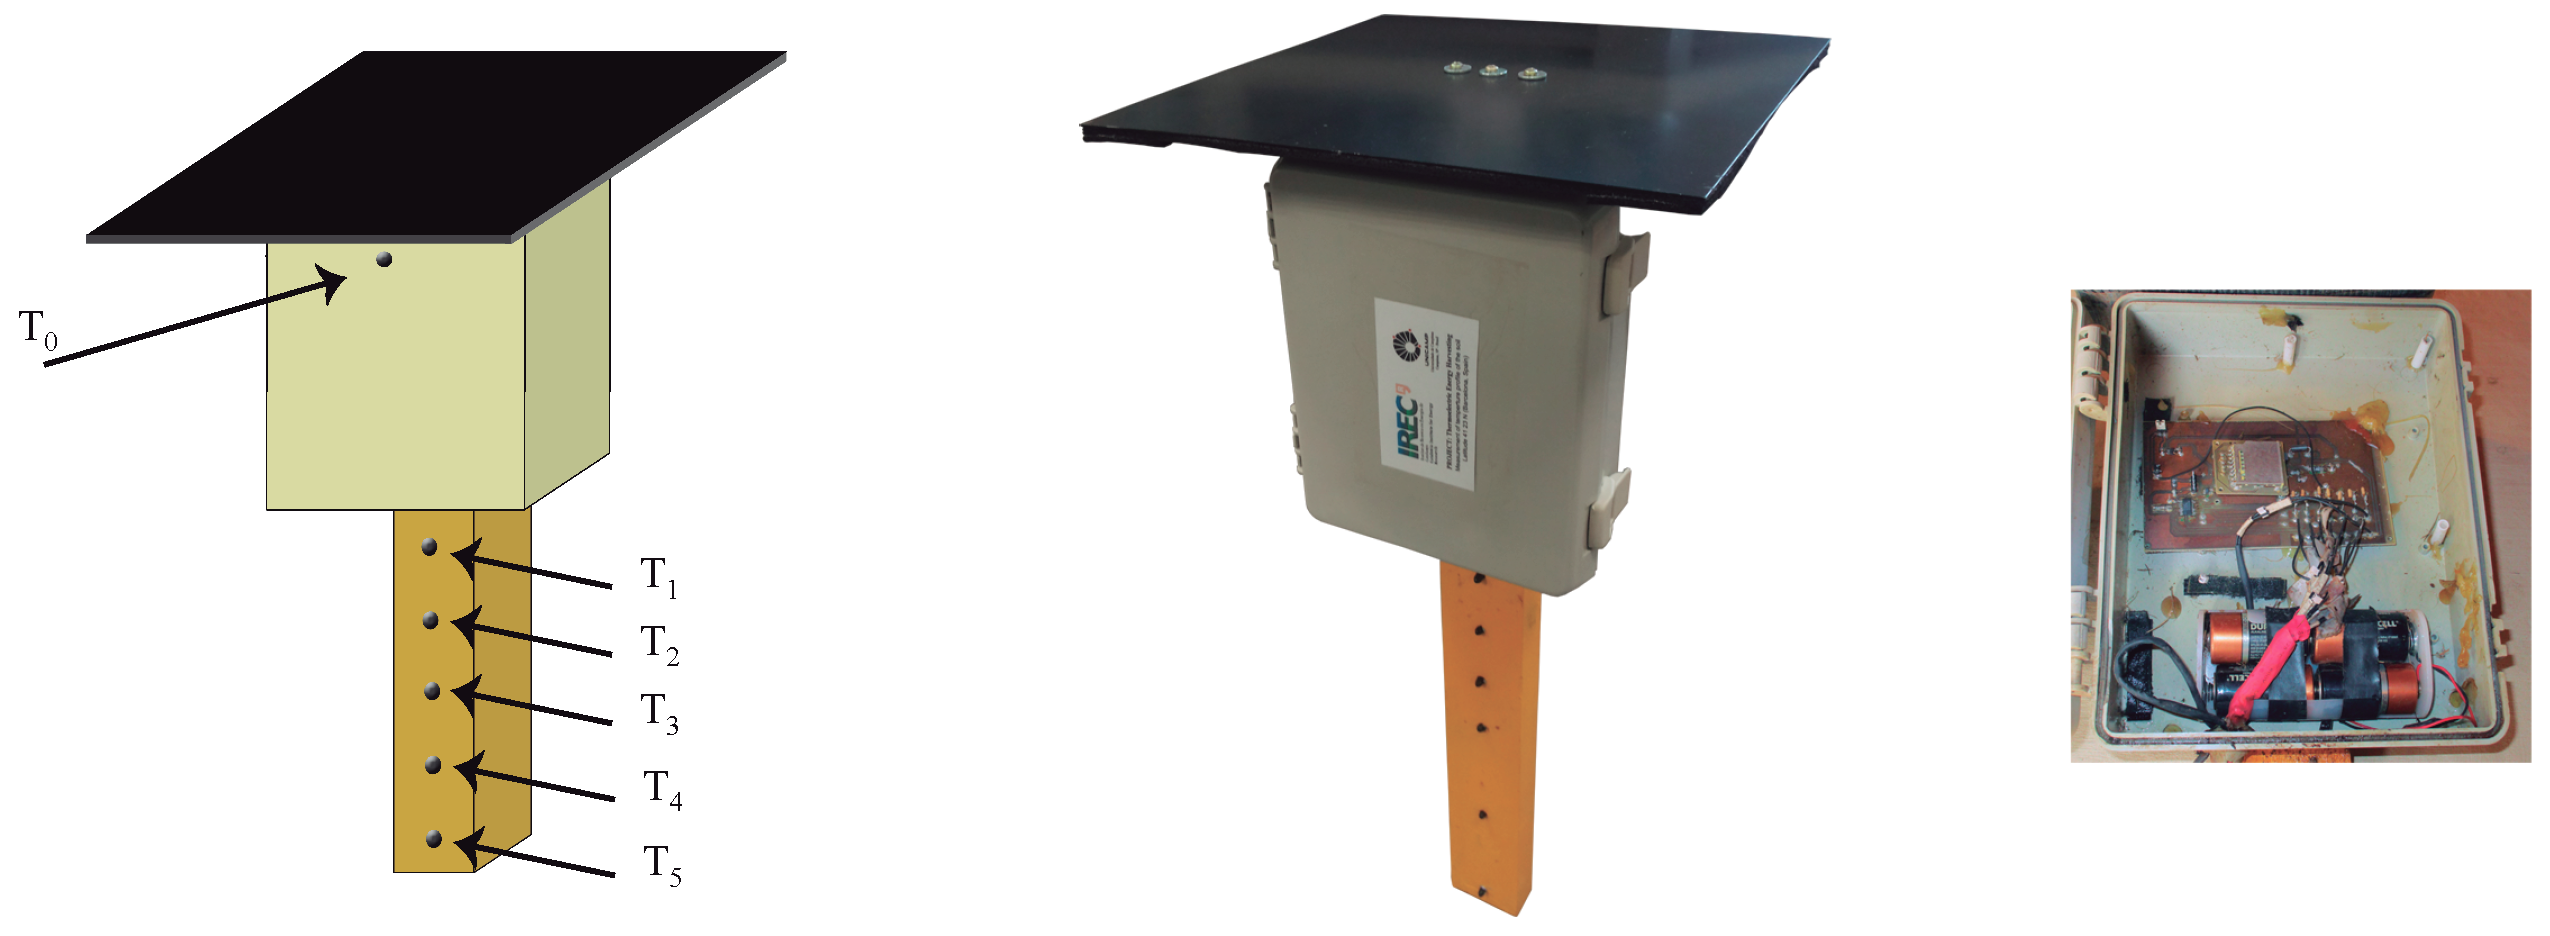
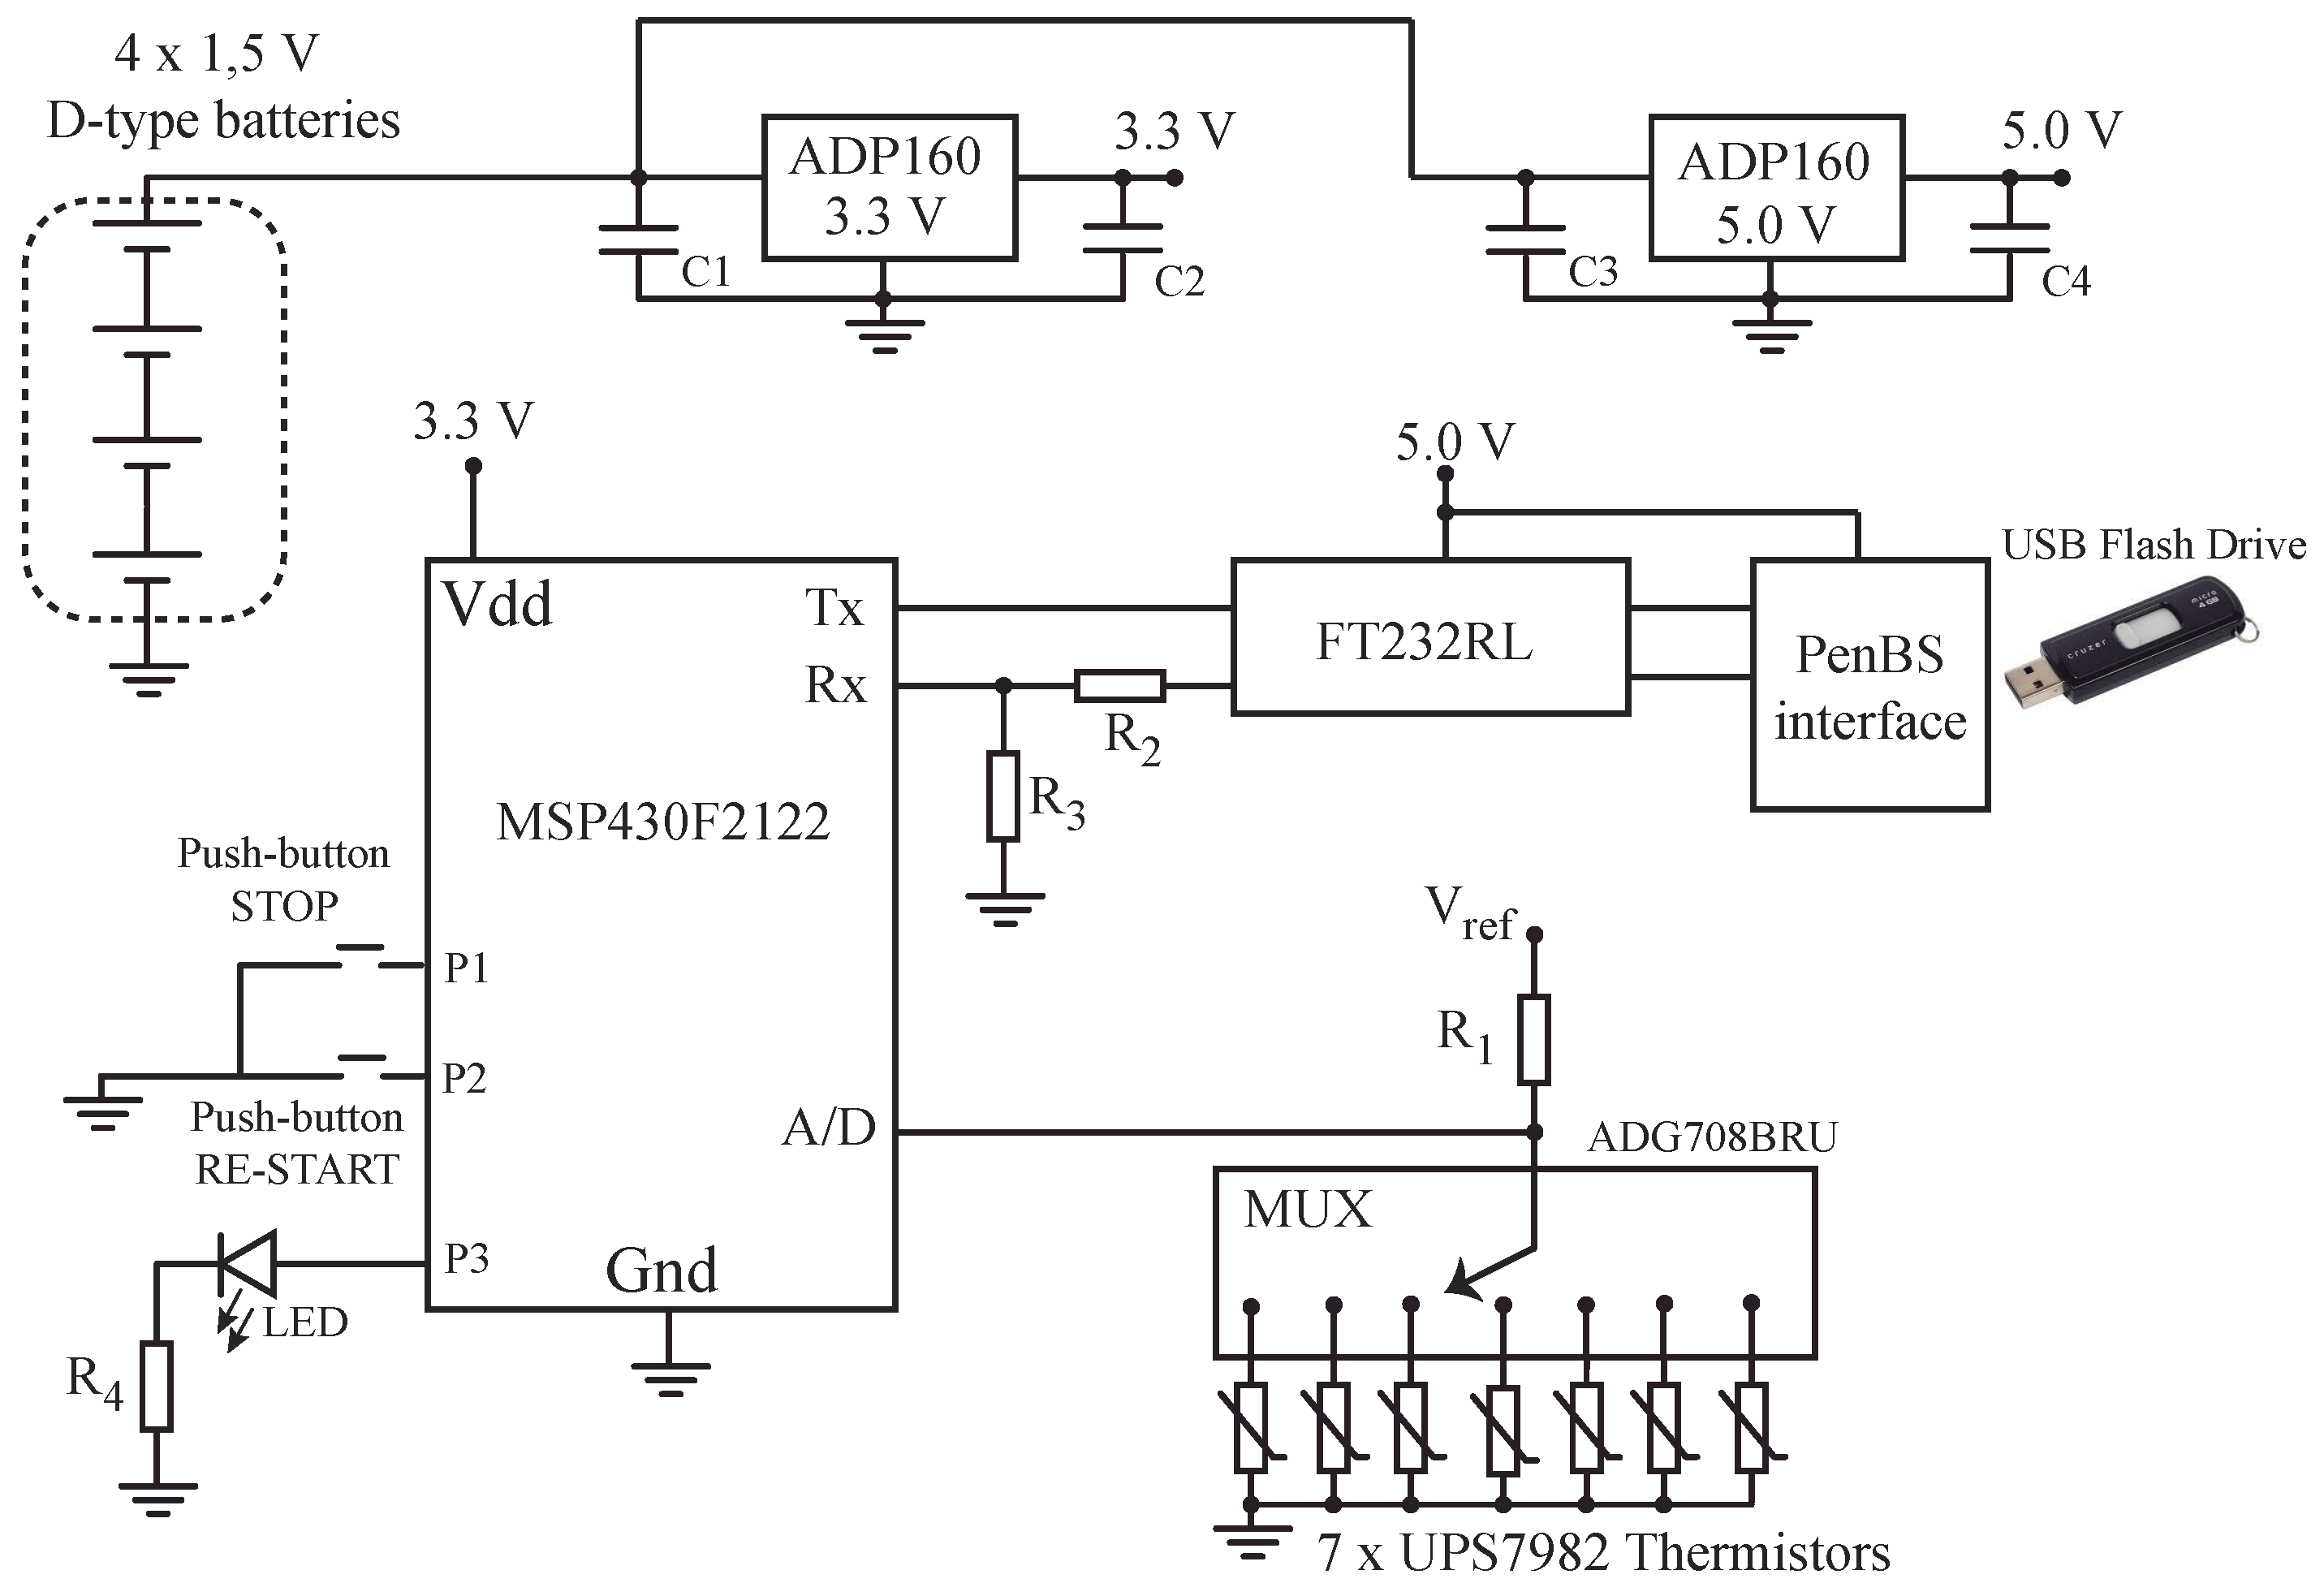
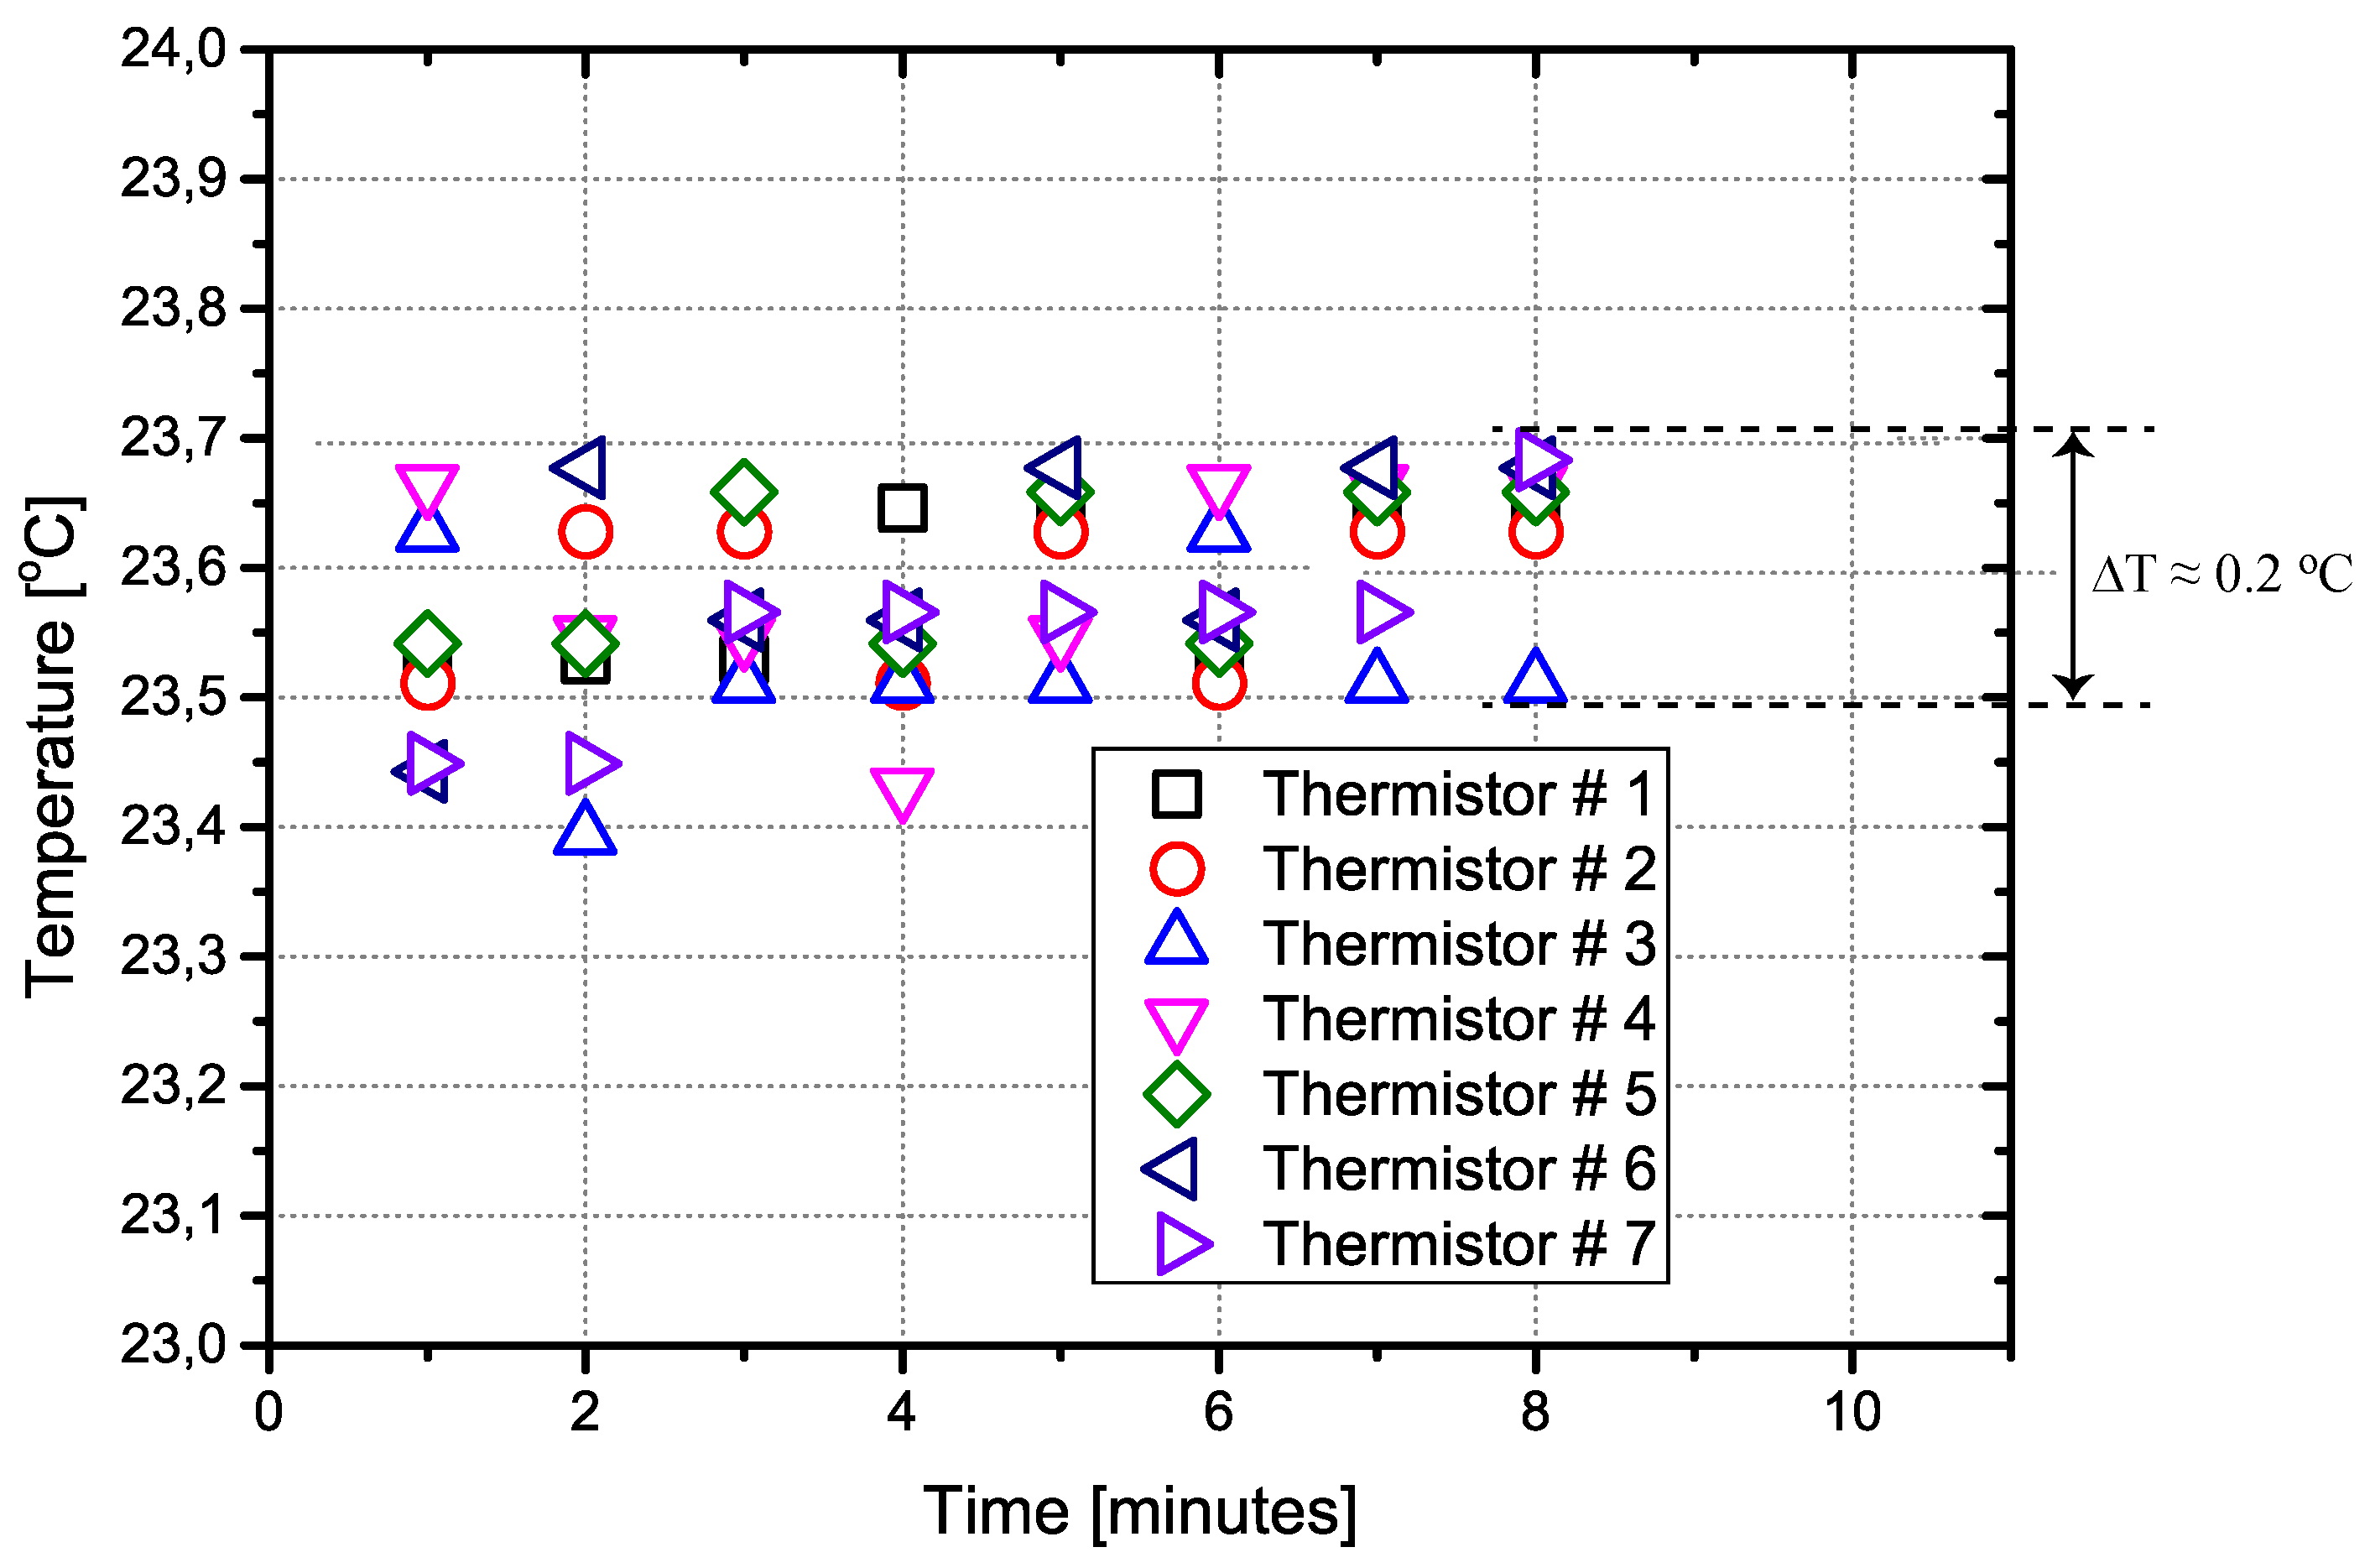
2.1. The Temperature Profiler Data-Logger

We designed a microcontrolled data-logger that is attached to a flat panel installed on the top of a wooden bar with several spaced thermistor, which will be buried to measure the soil temperature profile. A thermistor is also placed on the flat panel, so we can measure its temperature. A sketch and a photograph of the fabricated system used to measure the temperature of the flat panel and the soil temperature profiles is shown in Figure 2.
A block diagram of the data-logger is presented in Figure 3. An ultra low-power microcontroller MSP430F2122 is used to manage the whole system. Seven thermistors UPS7982 (a 10 k Ω ± 1 % vinyl encapsulated NTC manufactured by US Sensors) were connected, through a linearising resistor divider and an eight channel multiplexer (ADG708BRU, from Analogue Devices), to the internal 10 bit analogue-to-digital (A/D) converter in the MSP430F2122, that digitizes the voltage at thermistors.
The microcontroller wakes-up every twelve minutes and reads all the sensors. The digitized values of temperature (from the flat panel and the buried sensors) are stored in the internal memory of the microcontroller, and after five measurements (every hour), the data stored in the microcontroller is transmitted to an external USB flash memory, via an FT232RL interface (from FTDI). Since the microcontroller runs with a Real Time Clock f = 32 . 768 KHz crystal, every packet of data includes the time stamp of the measurement.
At the zero hour of each day, the microcontroller opens a new file in the USB flash drive (the file name is the actual date, in the format “Pxxx.txt” (where xxx is the number of the day, starting with “P000.txt”). The data acquired during the whole day is written to this file. This simplifies searching for the data of any specific day.
To remove the flash drive, a push-button must be pressed, and if a green LED in the PCB turns on, it is safe to remove the USB flash drive. After this push-button is pressed, the system checks if the microcontroller is sending data to the USB port. If the microcontroller is communicating with the USB, the system waits for the end of the transmission, interrupts any future communication between the microcontroller and the USB, and lights up the LED. If the system detects that no transmission is occurring, it interrupts any future communication between the microcontroller and the USB and turns on the LED.
In both cases the microcontroller holds the next packet of data until the USB flash drive is reinserted in the circuit and a second push button is pressed. When this push-button is pressed, the microcontroller checks if the USB flash driver is present. If present, it blinks the LED three times, informing that the communication was re-established and the last packets of data (that were on hold) are immediately transmitted. With this procedure, the USB flash drive can be left out of the circuit for up to 72 h before being reinserted.
The circuit is most of the time in sleeping mode (with the microcontroller running in low-power-mode and the other ICs in shut-down mode), so that the current consumption of the circuit in this state is only 2 . 5 μ A. Since the circuit wakes up only for about one second every twelve minutes (to read the sensors and write the data to the microcontroller) and for about five seconds every one hour (to write the data to the USB flash drive), we powered the system with 4 × 1.5 V D-type battery cells in series, which is enough to operate the system for more than one year.
Concerning the temperature measurements with thermistors, since the UPS7982 is a 10 k Ω ± 1 % , to compensate for these deviations in the value of the thermistors, a calibration (implemented in the software that converts the voltage to temperature) was necessary.
A plot of the temperature measured in the seven thermistors is shown in Figure 4, where we see that, after letting the thermistors in ambient temperature and isolating them from the air flow in the room forced by the air conditioning system, all thermistors indicate a temperature which is within a 0 . 2 C range, around an average temperature T = 23 . 6 C, measured with an AD590 temperature sensor. The ± 1 LSB error of the 10 bit A/D converter of the MSP430F2122 microcontroller corresponds to approximately ± 0 . 1 C in the calculated temperature. This agrees with the data presented in Figure 4.

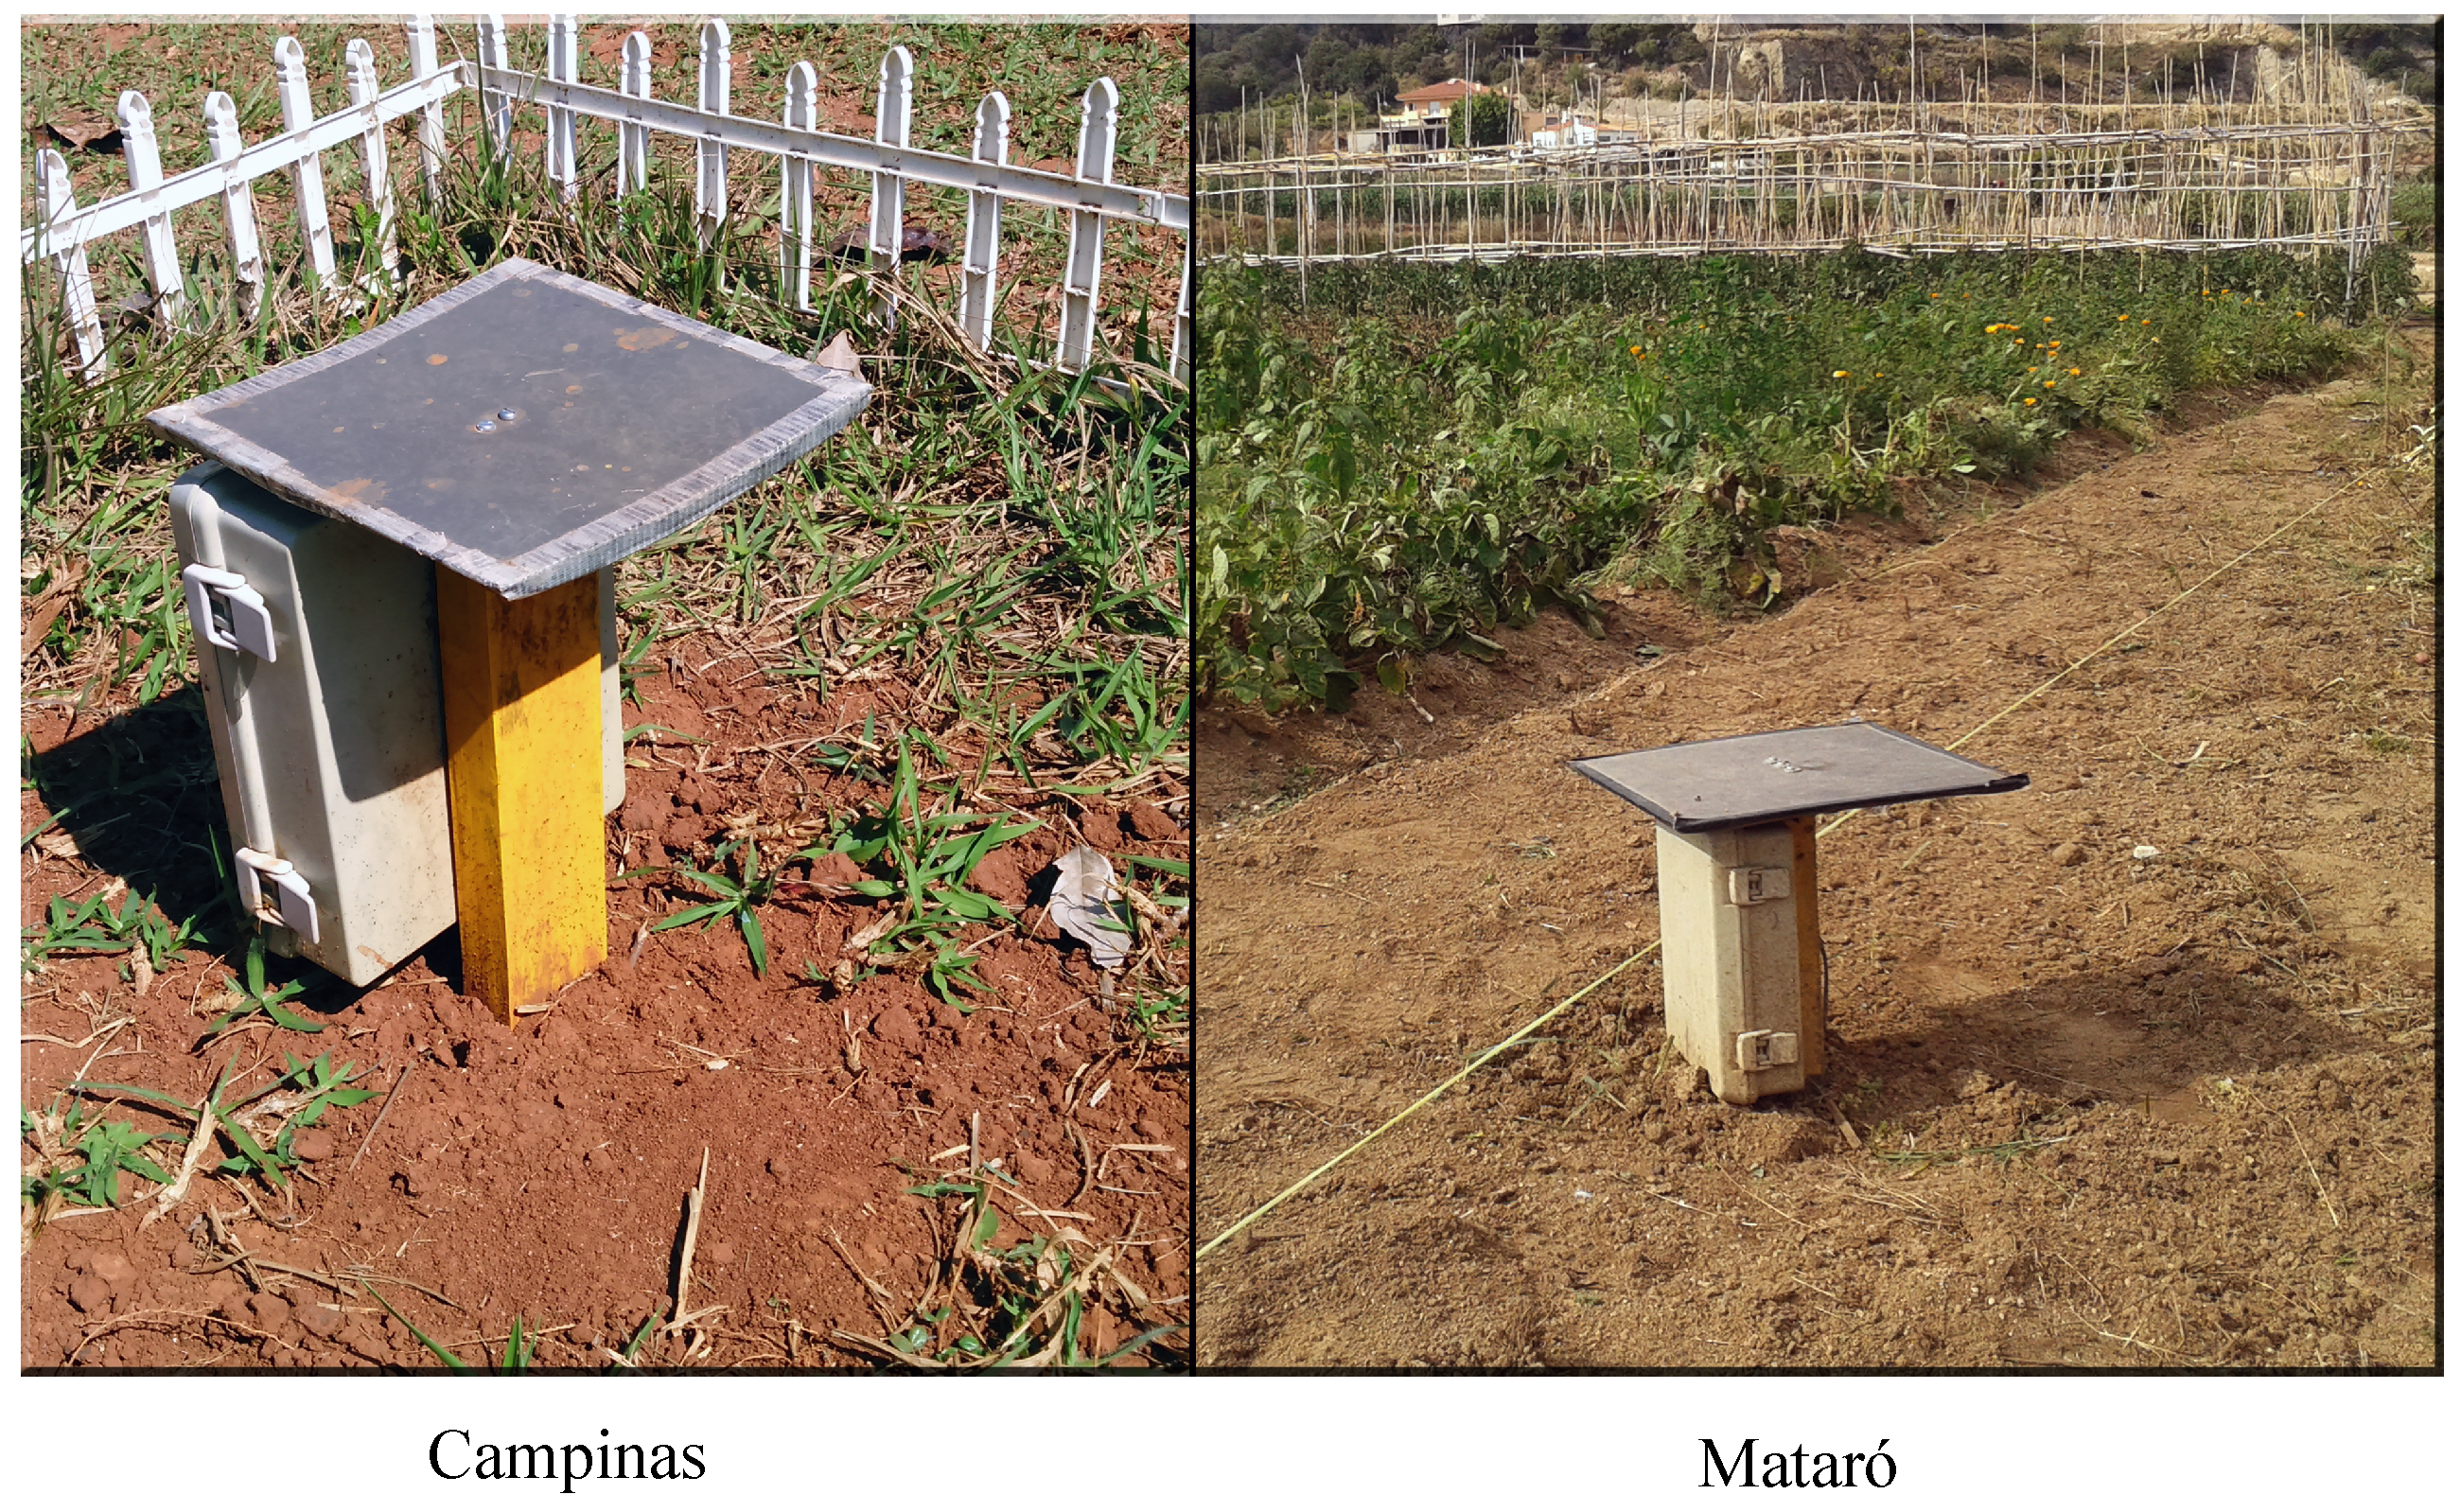
2.2. Installation of the System

We installed two of this soil temperature profile measurement systems, one in Campinas, SP—Brazil (latitude 22 54 20 S), and another in Mataró, Catalonia, Spain (latitude 41 32 17 N). The idea was to measure and compare the soil temperature profiles in two different latitudes, in order to find out the ideal heat sink depth and how it would depend on the latitude where the energy harvesting system will be installed. A photograph of both systems inserted in the soil is shown in Figure 5. In Campinas, the measurement system was installed in a garden at the University of Campinas, while in Mataró it was installed in a small farm, near a plantation of pumpkins.

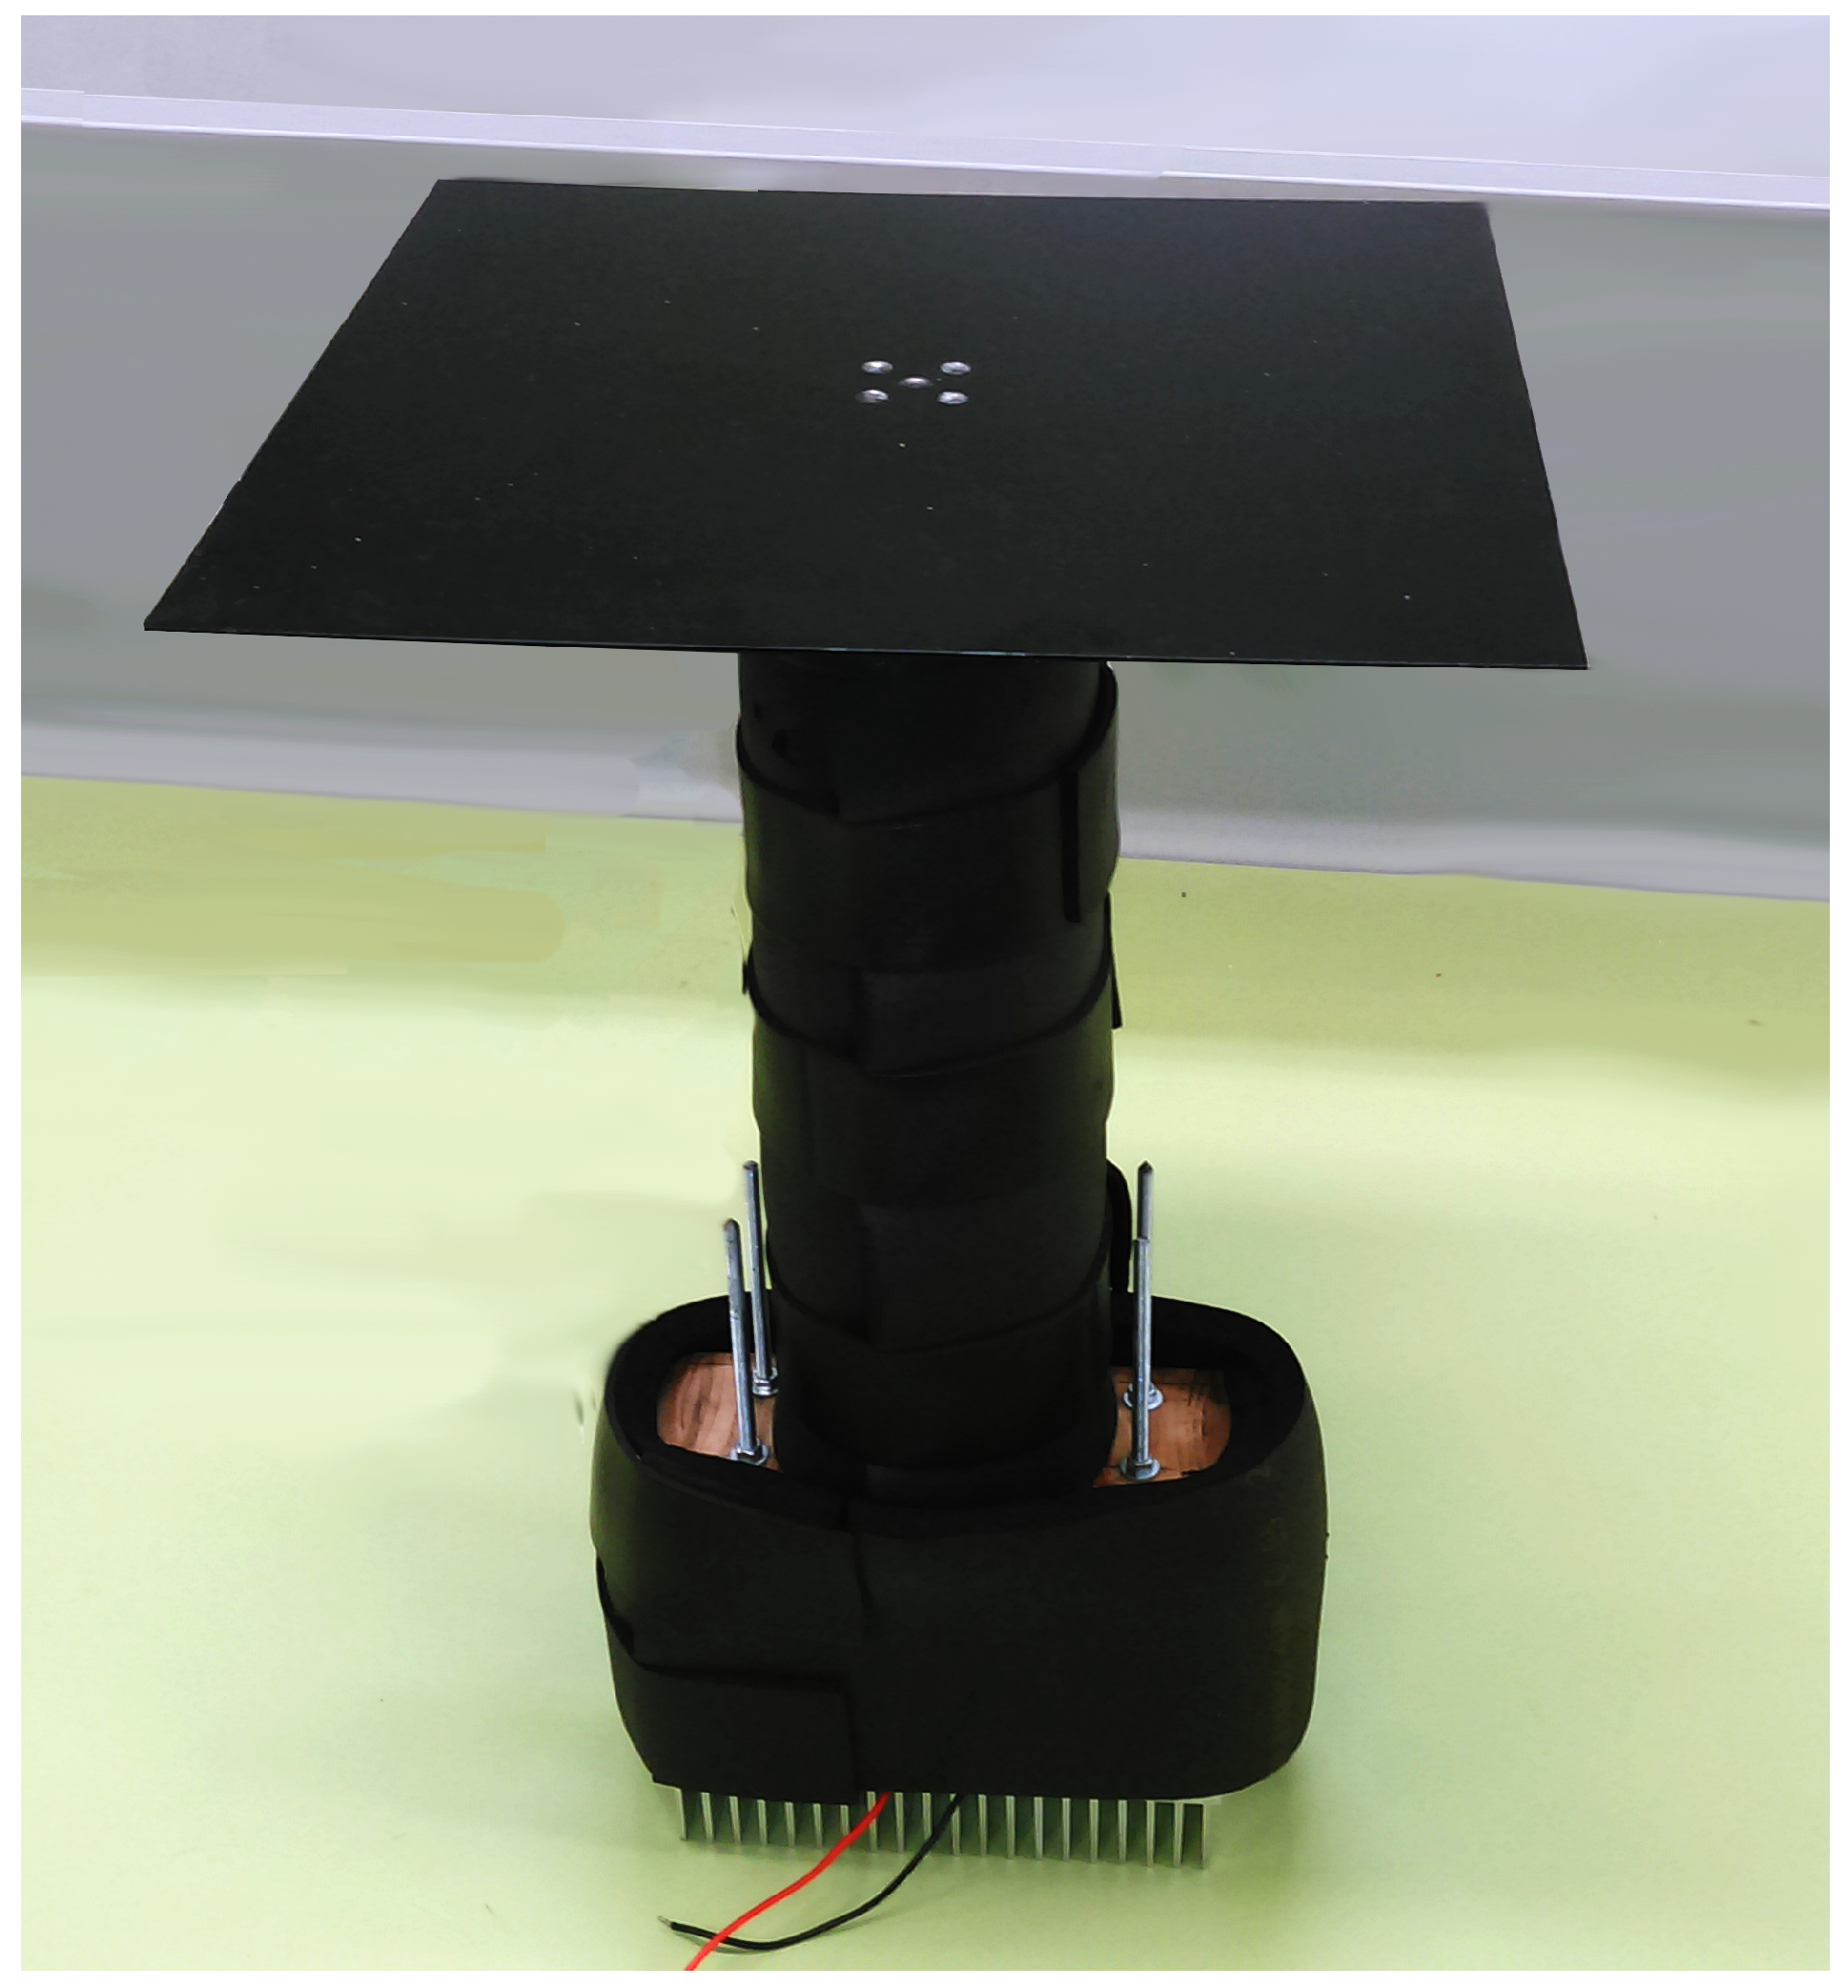
2.3. Fabrication of a Prototype of a STEG Flat Panel System with Buried Heat Sink

Since the evaluation of the energy harvesting potential using the calculations of temperature differences cannot provide an exact value of the energy that can be harvested, a complete prototype of the harvesting system was also fabricated. It includes a DC-DC converter based on a LTC3109, a bipolar version of the LTC3108, because our system can harvest from both positive and negative voltages in the TEG.
To optimize the performance of the heat transfer between the STEG and the buried heat sink, Lawrence et al. [16] proposed the use of a heat pipe, but in our project we used an aluminium bar, and placed the TEG between the aluminium bar and the buried heat sink. A photograph of the prototype, with the insulation foam already applied around the aluminium bar, is shown in Figure 6. It is important to observe that in the work of [16] it is shown that the size and the shape of the heat sink is very important for the efficiency of the system with a heat sink buried in the soil, and concludes that a heat sink with a Starfish shape presents the best performance.
The system is controlled by the same microcontroller used in the soil temperature profile data-logger (MSP430F2122). We used the energy generated by the DC-DC converter to charge a supercapacitor C s t o r e , and the energy stored in this supercapacitor was considered as the total energy effectively harvested. The actual amount of solar energy converted to electric is much greater than the energy stored in the supercapacitor, because the state-of-the-art conversion with very low voltage DC-DC converters based on the LTC 3108/9 present low efficiency, usually less than 20%.
The voltage at this capacitor is measured every 12 min, to verify if it has reached the maximum voltage that it is allowed to charge (4.5 V). When this voltage is reached, an internal comparator turns on a transistor and discharges it quickly, to avoid errors in the calculation of the energy stored [17]. Each cycle of charge-discharge of C s t o r e is added to a counter in the microcontroller, and this value (the number of cycles) is shown in a LED display.
The energy harvested during these N cycles is calculated by:
E = N 1 2 C s t o r e ( 4 . 5 ) 2 + E l a s t
The value of E l a s t is obtained as follows: when the test is complete, the value of the voltage in C s t o r e (which was not enough to complete one charge-discharge cycle) is measured manually, with a voltmeter.

3. Results

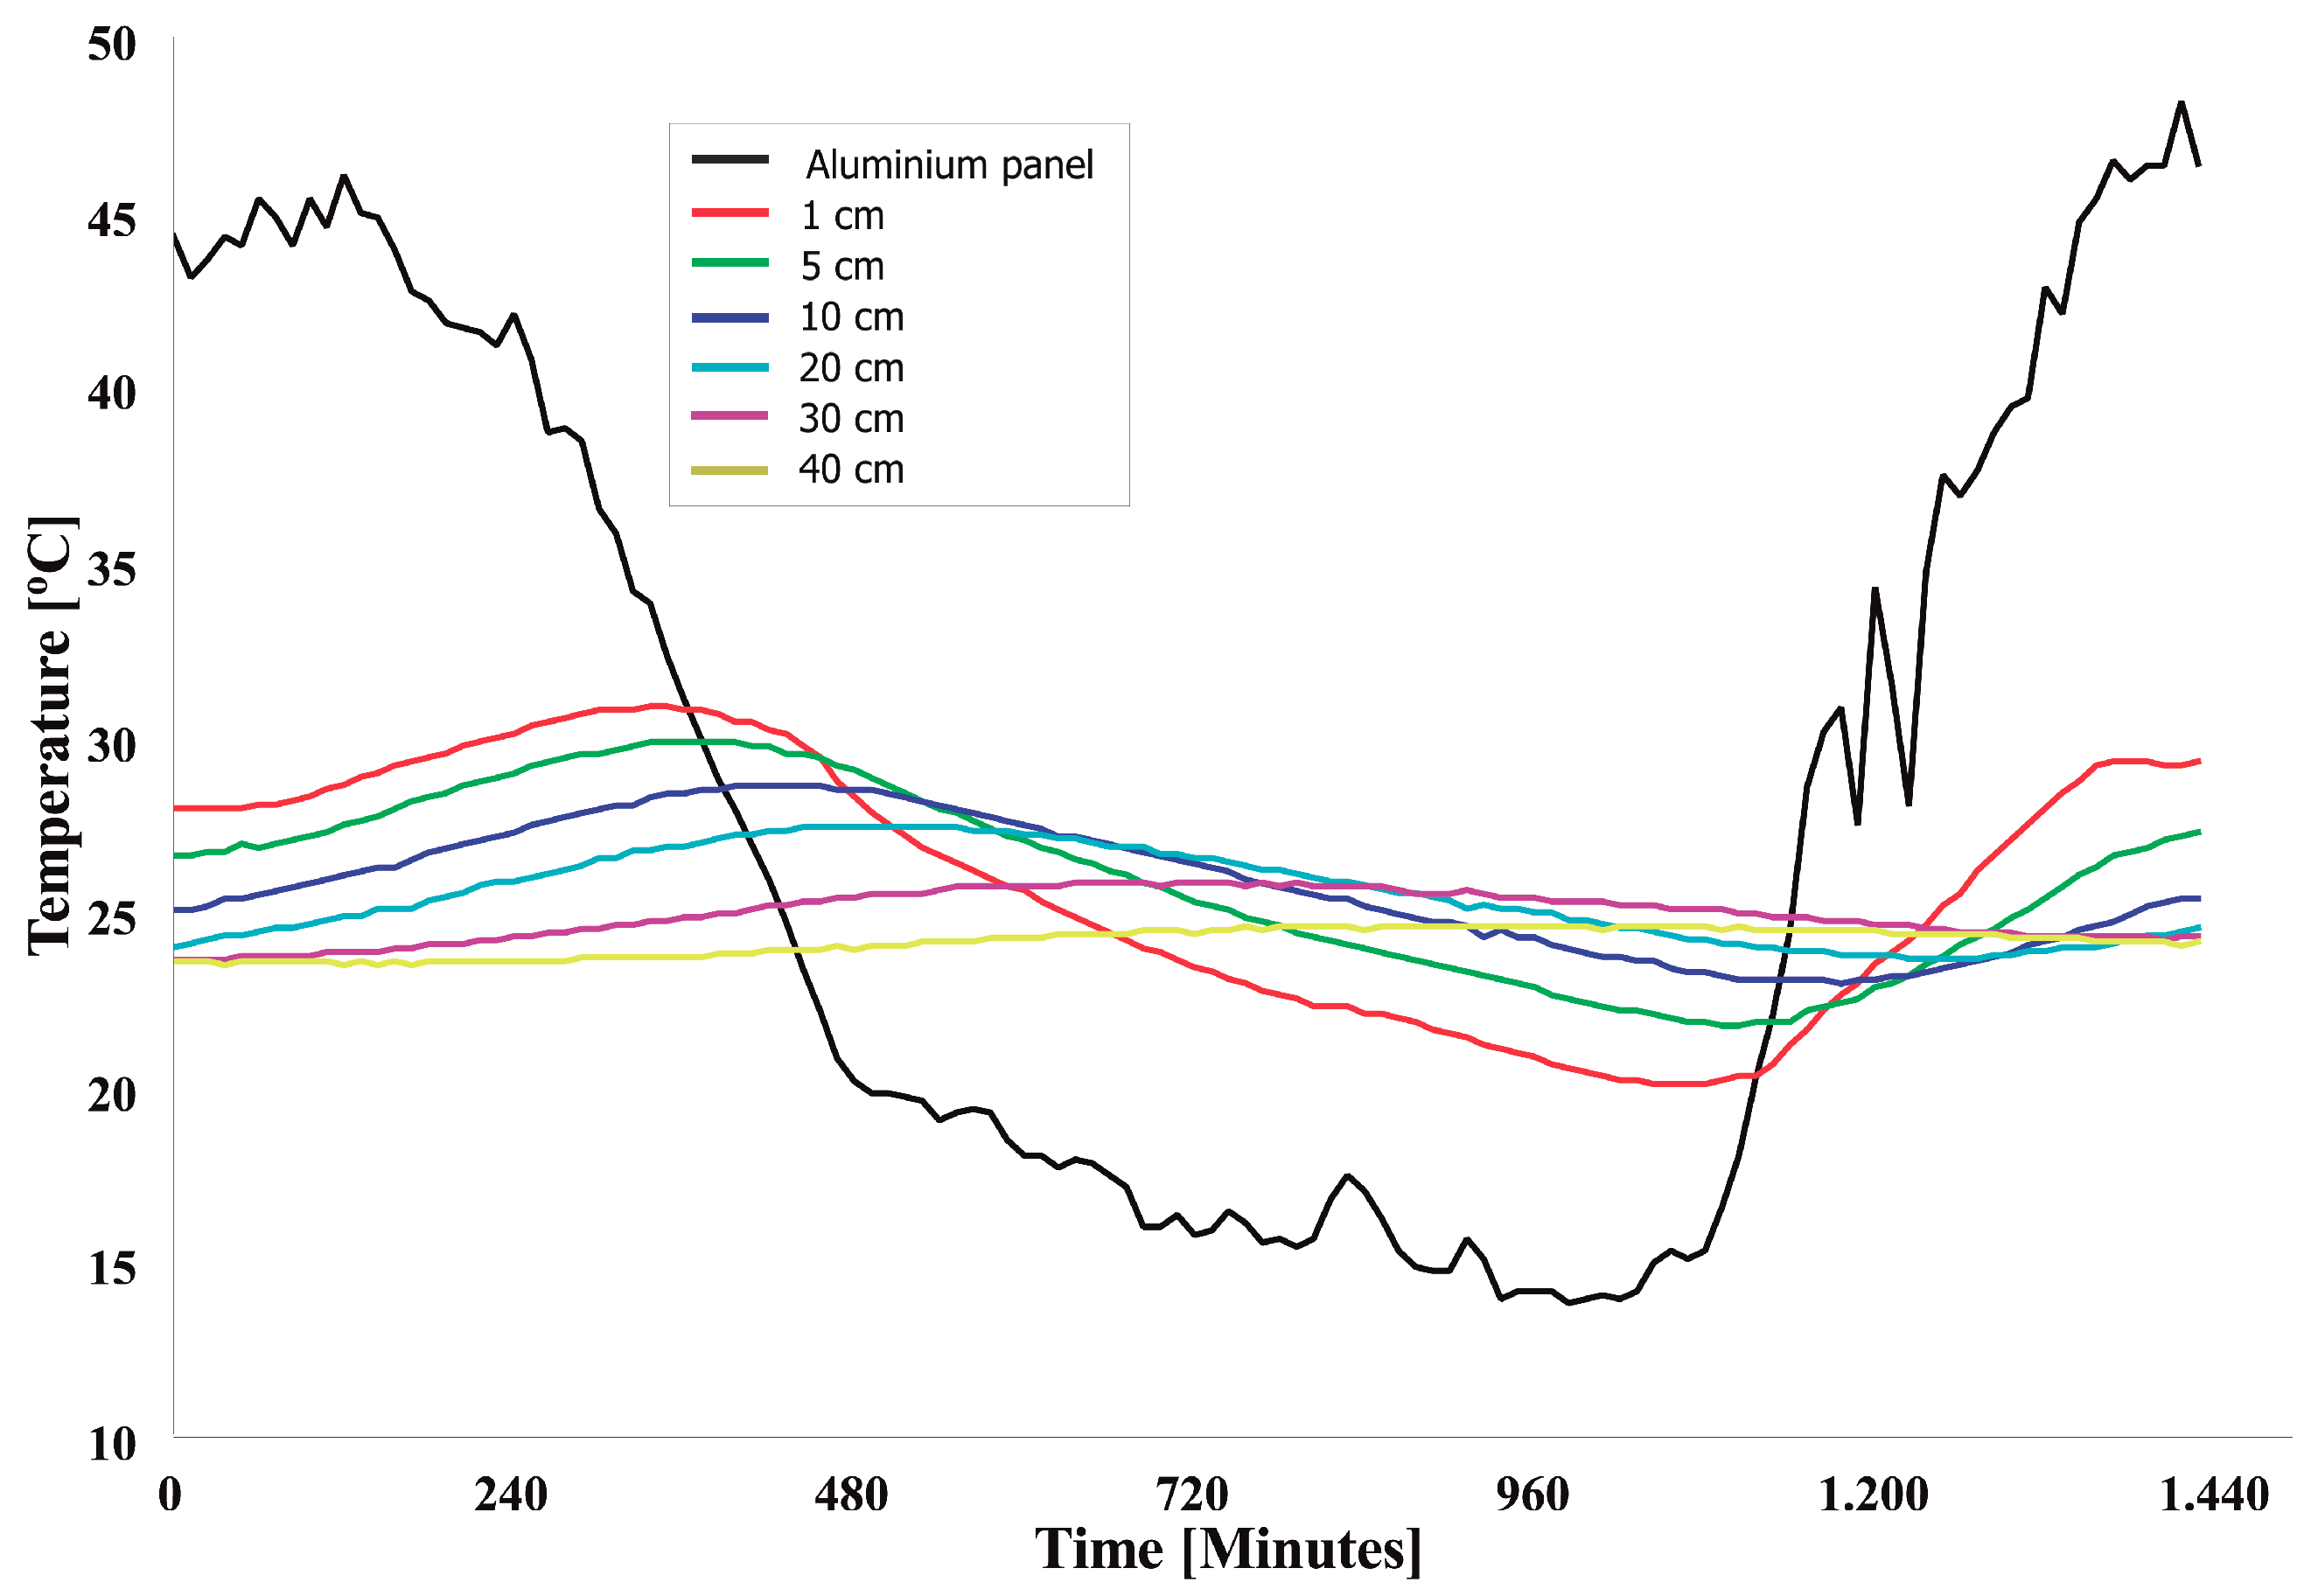
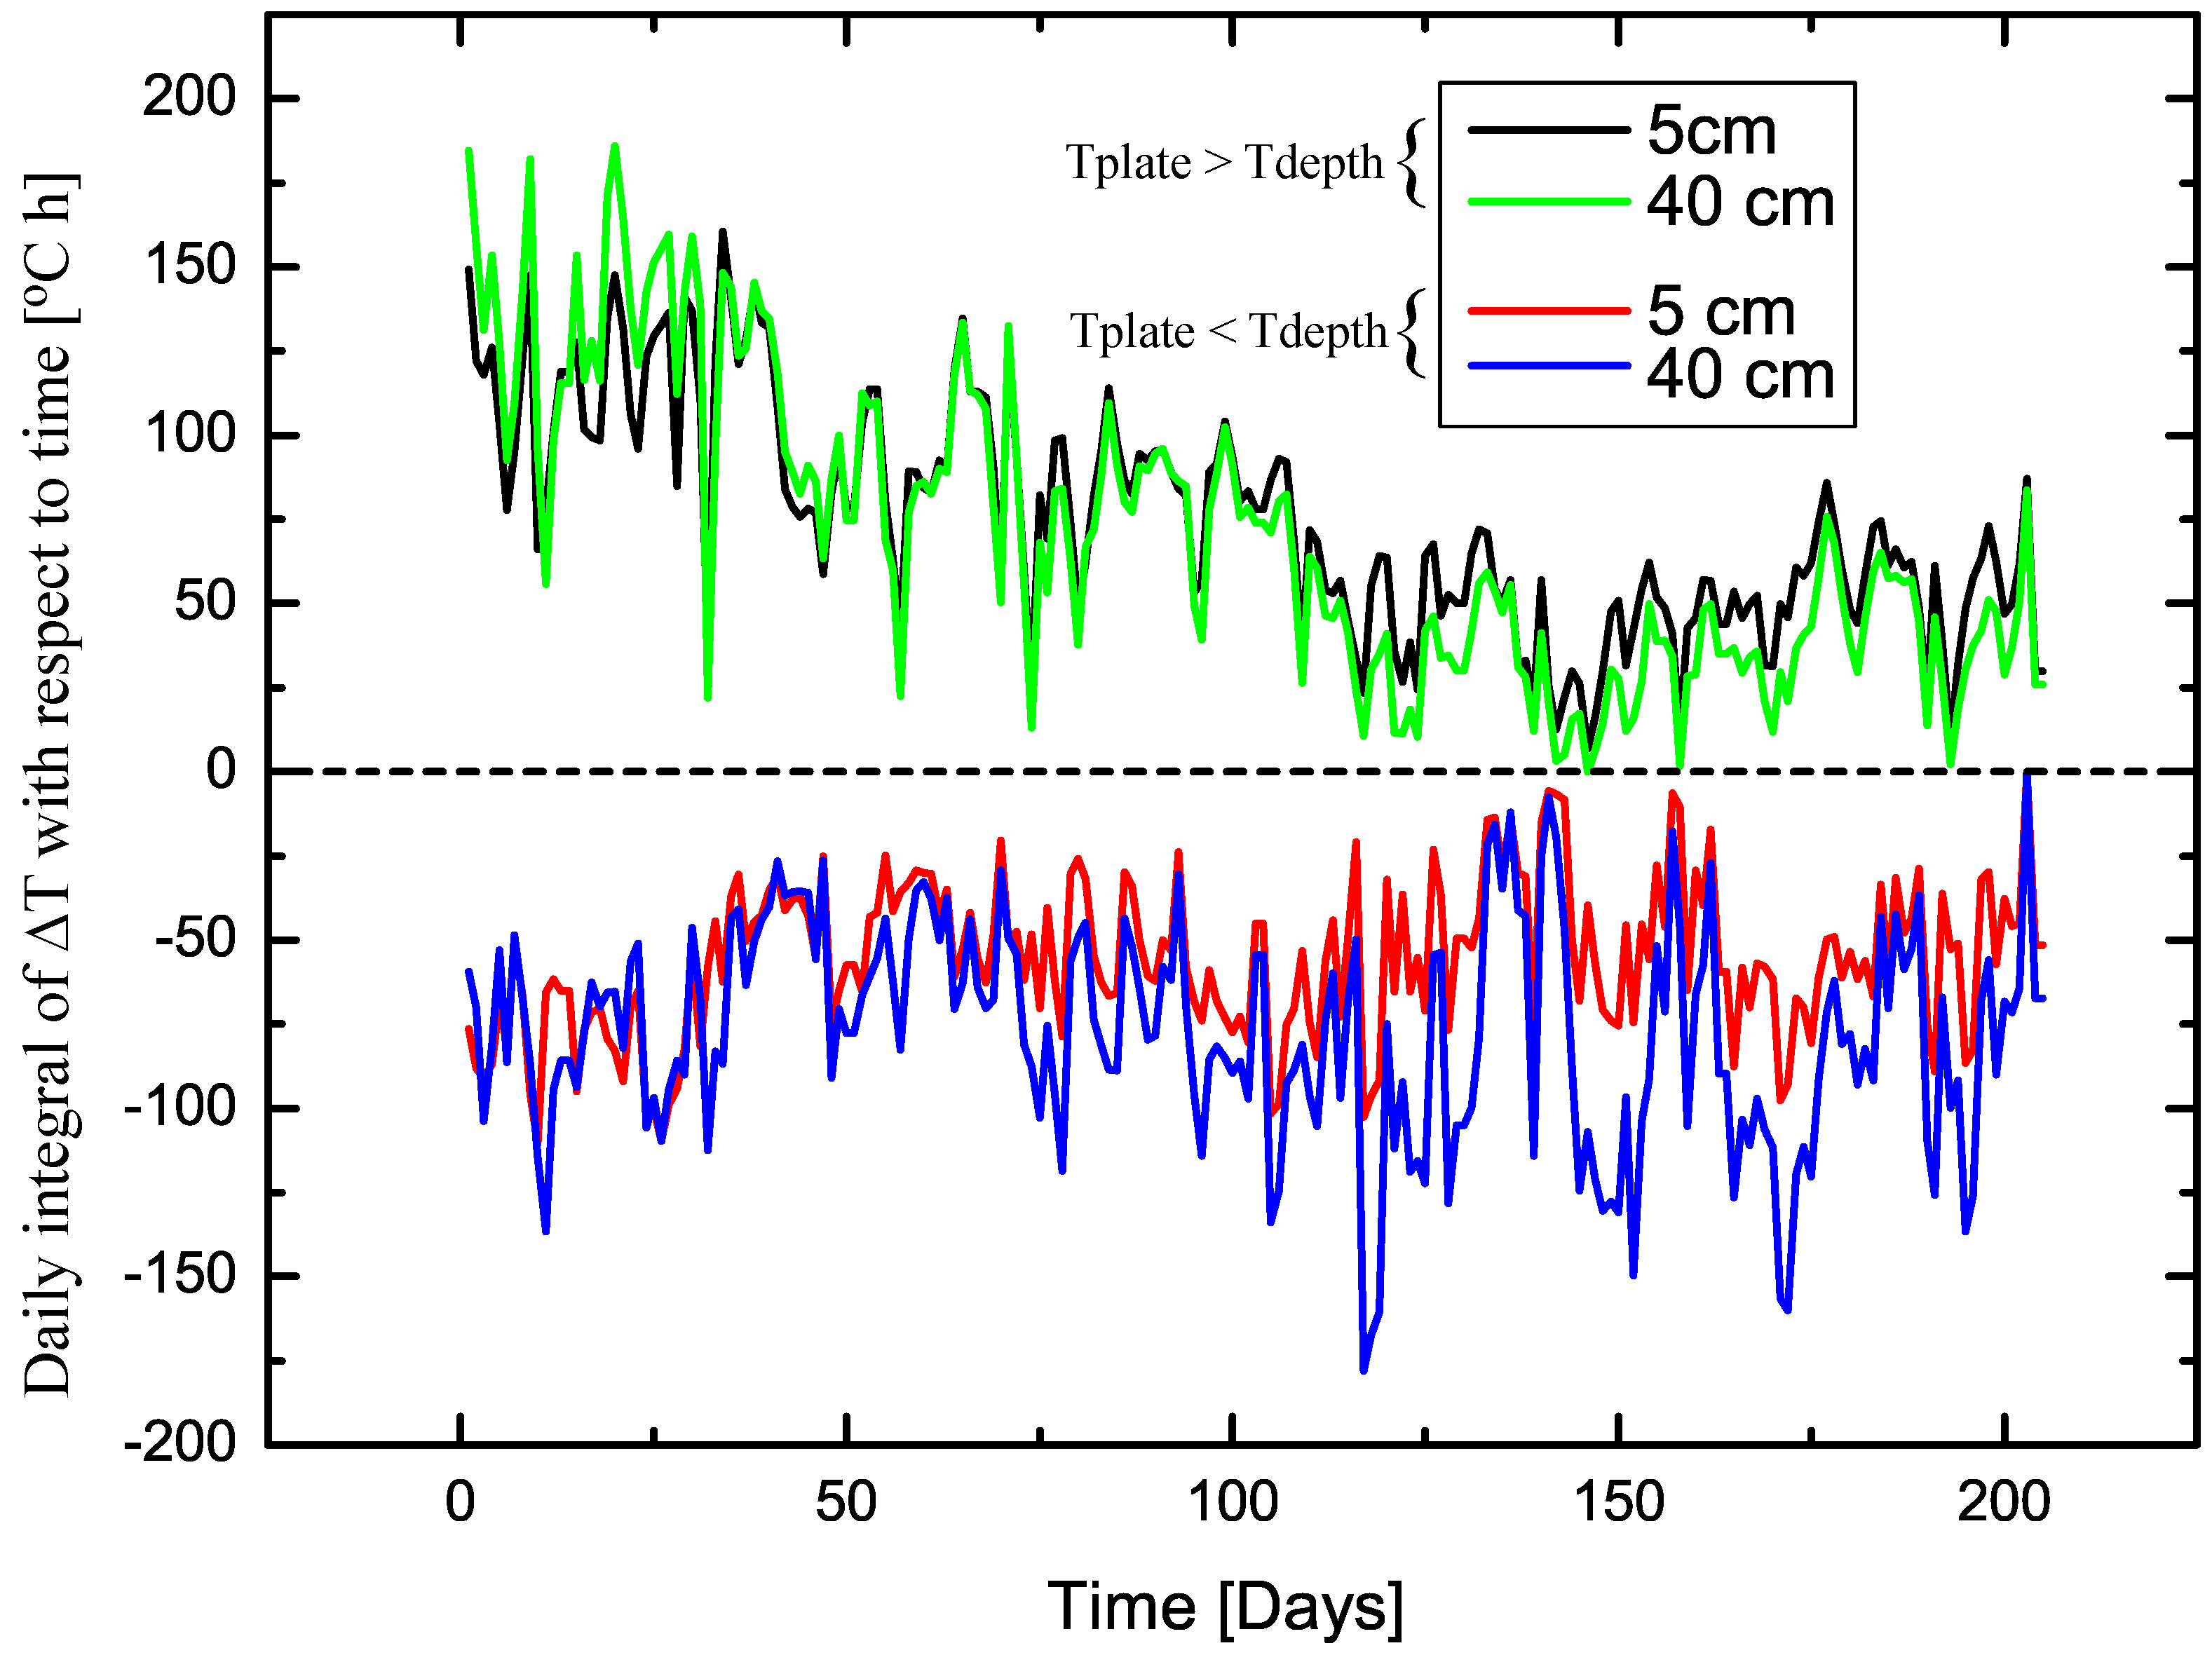
3.1. Analysis of the Measured Data

In Figure 7 we present a plot of the measured temperature profiles (temperatures in the flat panel and at the different depths of the soil), measured during 24 h on 21 July 2015, a sunny winter day in Campinas.
Observing this plot we notice that, as expected, there is an inversion of the temperature profiles from day to night. The graph starts at noon (0 min is 12:00 a.m.), and during the day the temperature in the aluminium panel is much higher than in the soil (reaching 48 C). At around 17:00 h (≈ minute 300) the temperature of the panel begins to go below the soil temperature, and stays below the soil temperature until around 6:30 h in the next day (≈ minute 1110), when the panel’s temperature rises again and goes above the soil’s temperature.
However, simply by looking at the plot of Figure 7, it is impossible to conclude, taking into account both the “forward” (when T p l a t e > T d e p t h ) and “reverse” ( T p l a t e < T d e p t h ) directions, which depth provides the highest accumulated temperature difference.
Thus, we decided to calculate a parameter which gives a clear indication of which depth can result in more energy being harvested: the daily integral with respect to time of the temperature difference between the aluminium plate and the measured points in the soil ( T p l a t e T d e p t h ):
t 0 t 1 T p l a t e T d e p t h d t
where t 0 and t 1 are respectively the initial and final time of the temperature measurements, in hours.
These integrals, that for more clarity we computed as divided in two parts, for the period when T p l a t e > T d e p t h and for the period when T p l a t e < T d e p t h , are shown in Figure 8. Data represented in Figure 8 was measured during 205 consecutive days in Mataró (from 23 June 2015 to 13 January 2016) at the depths of 5 cm and 40 cm.
Concerning the plot in Figure 8, for the positive integrals we can observe that:
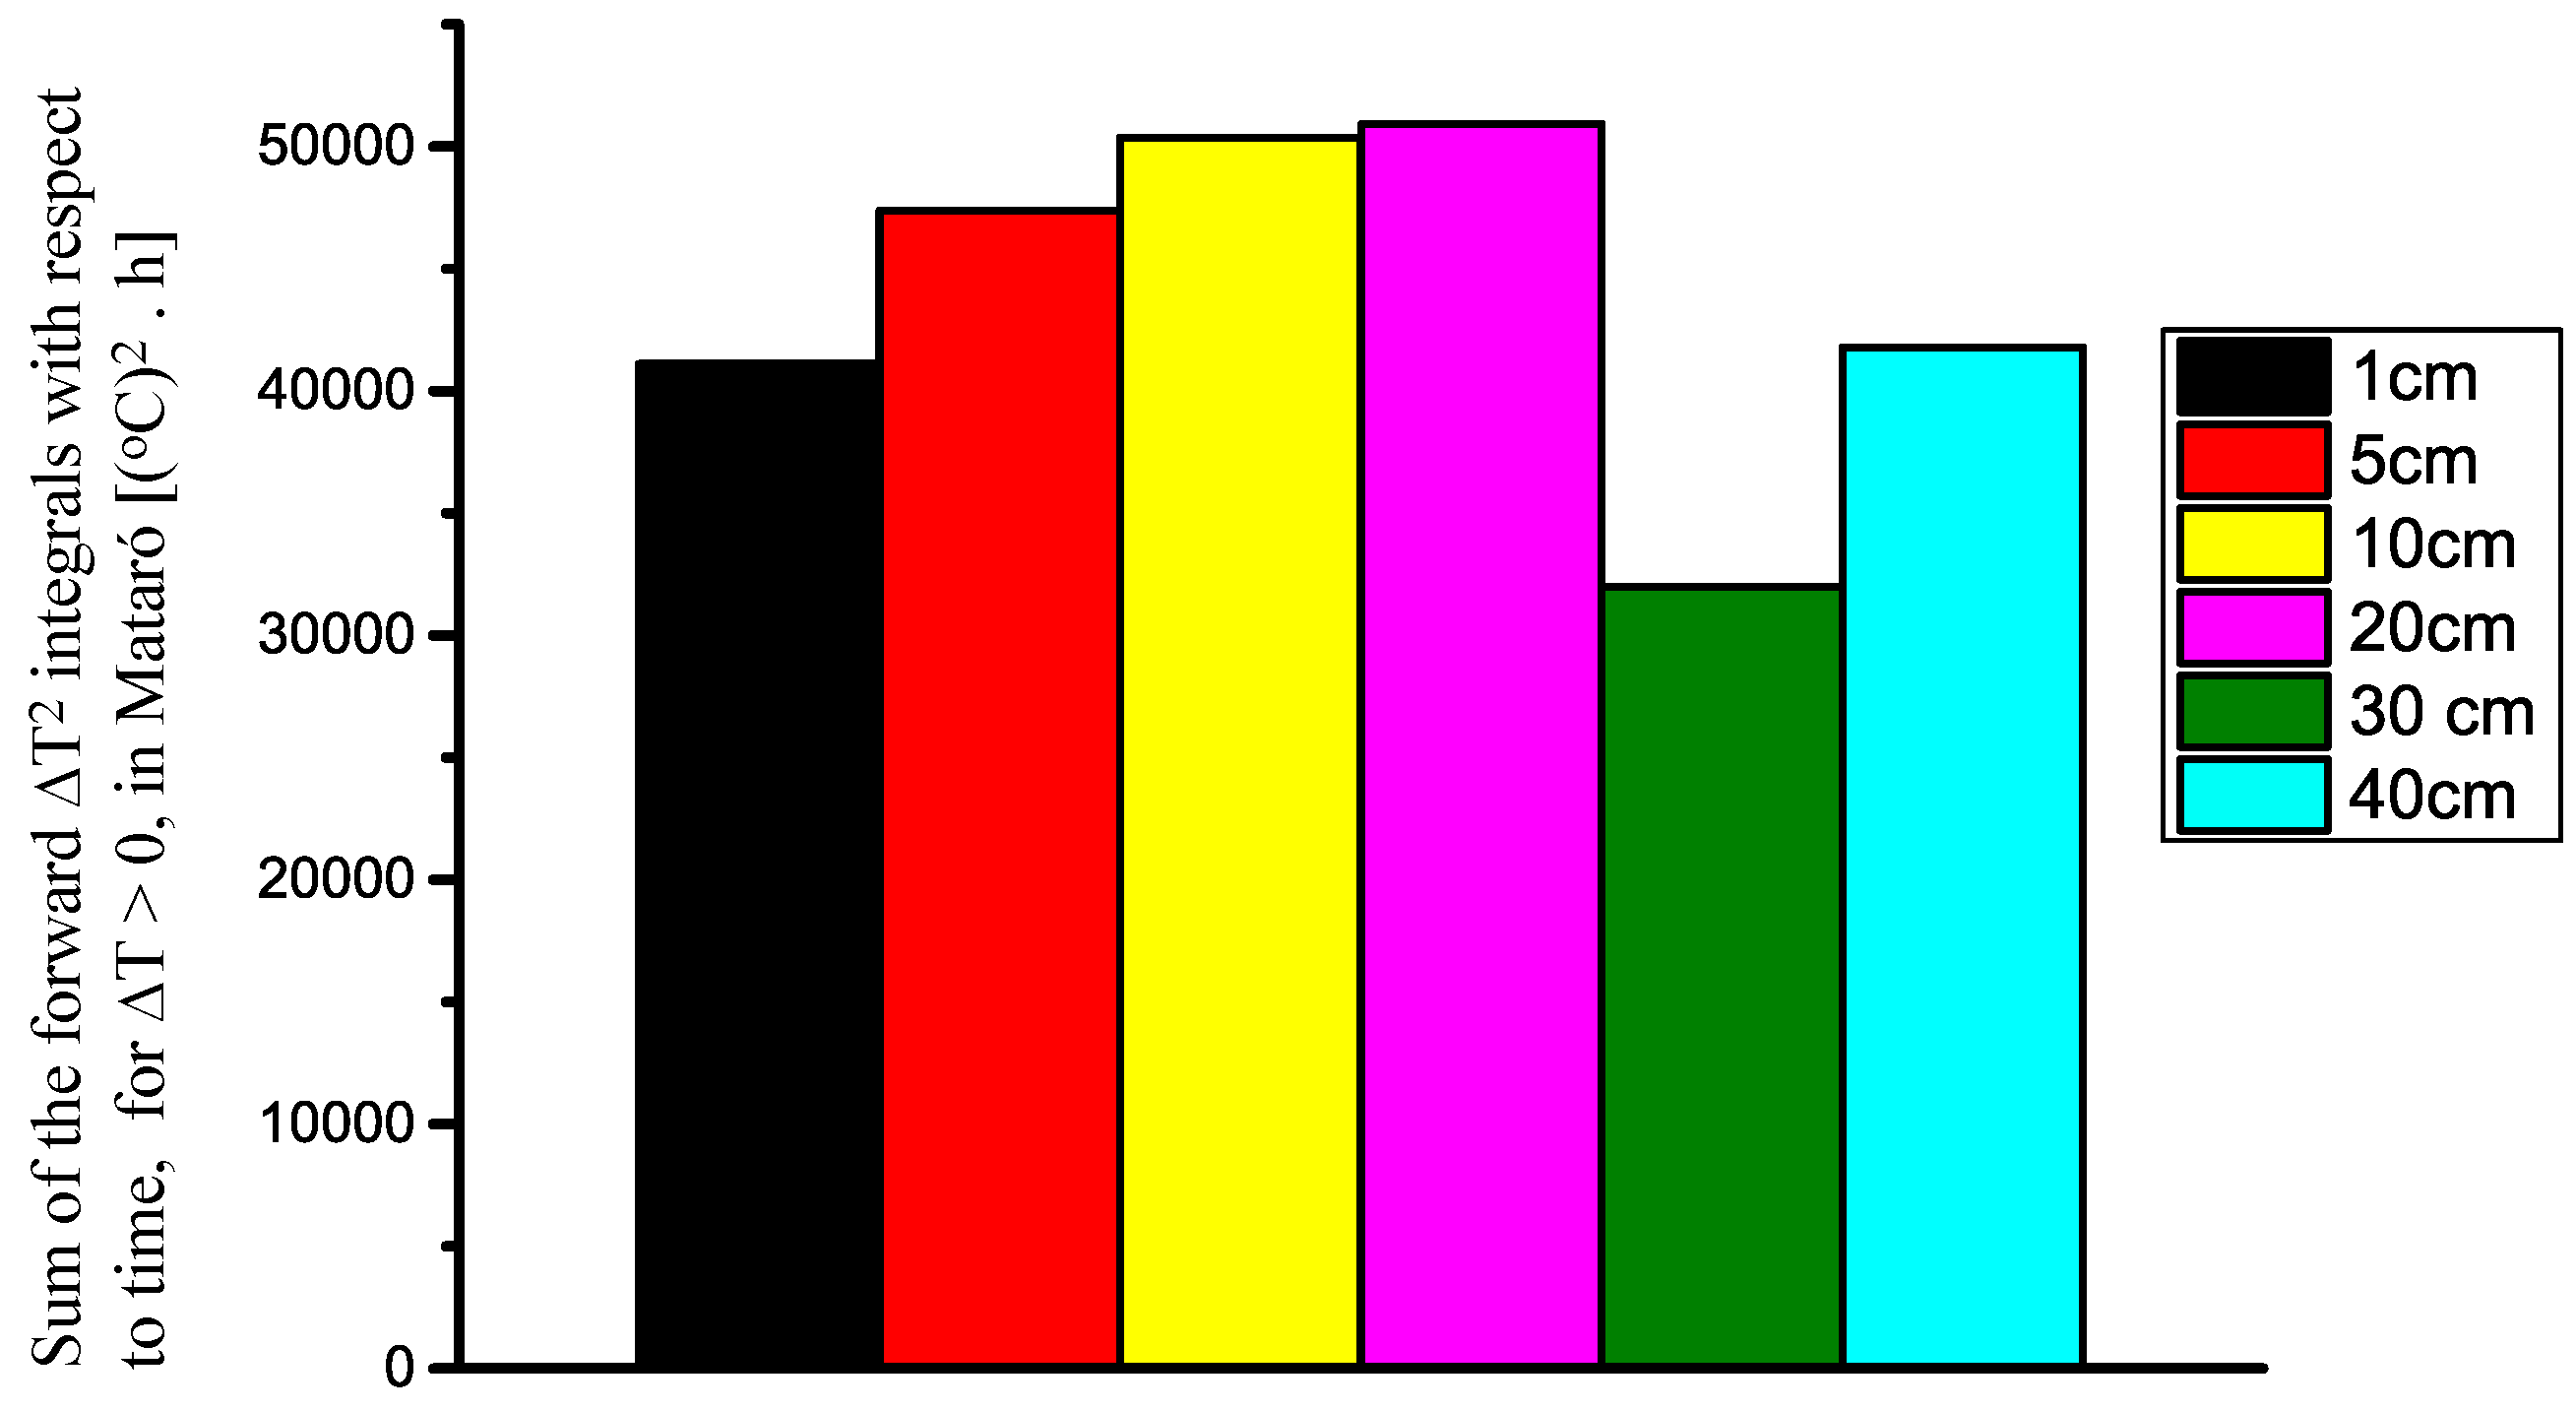
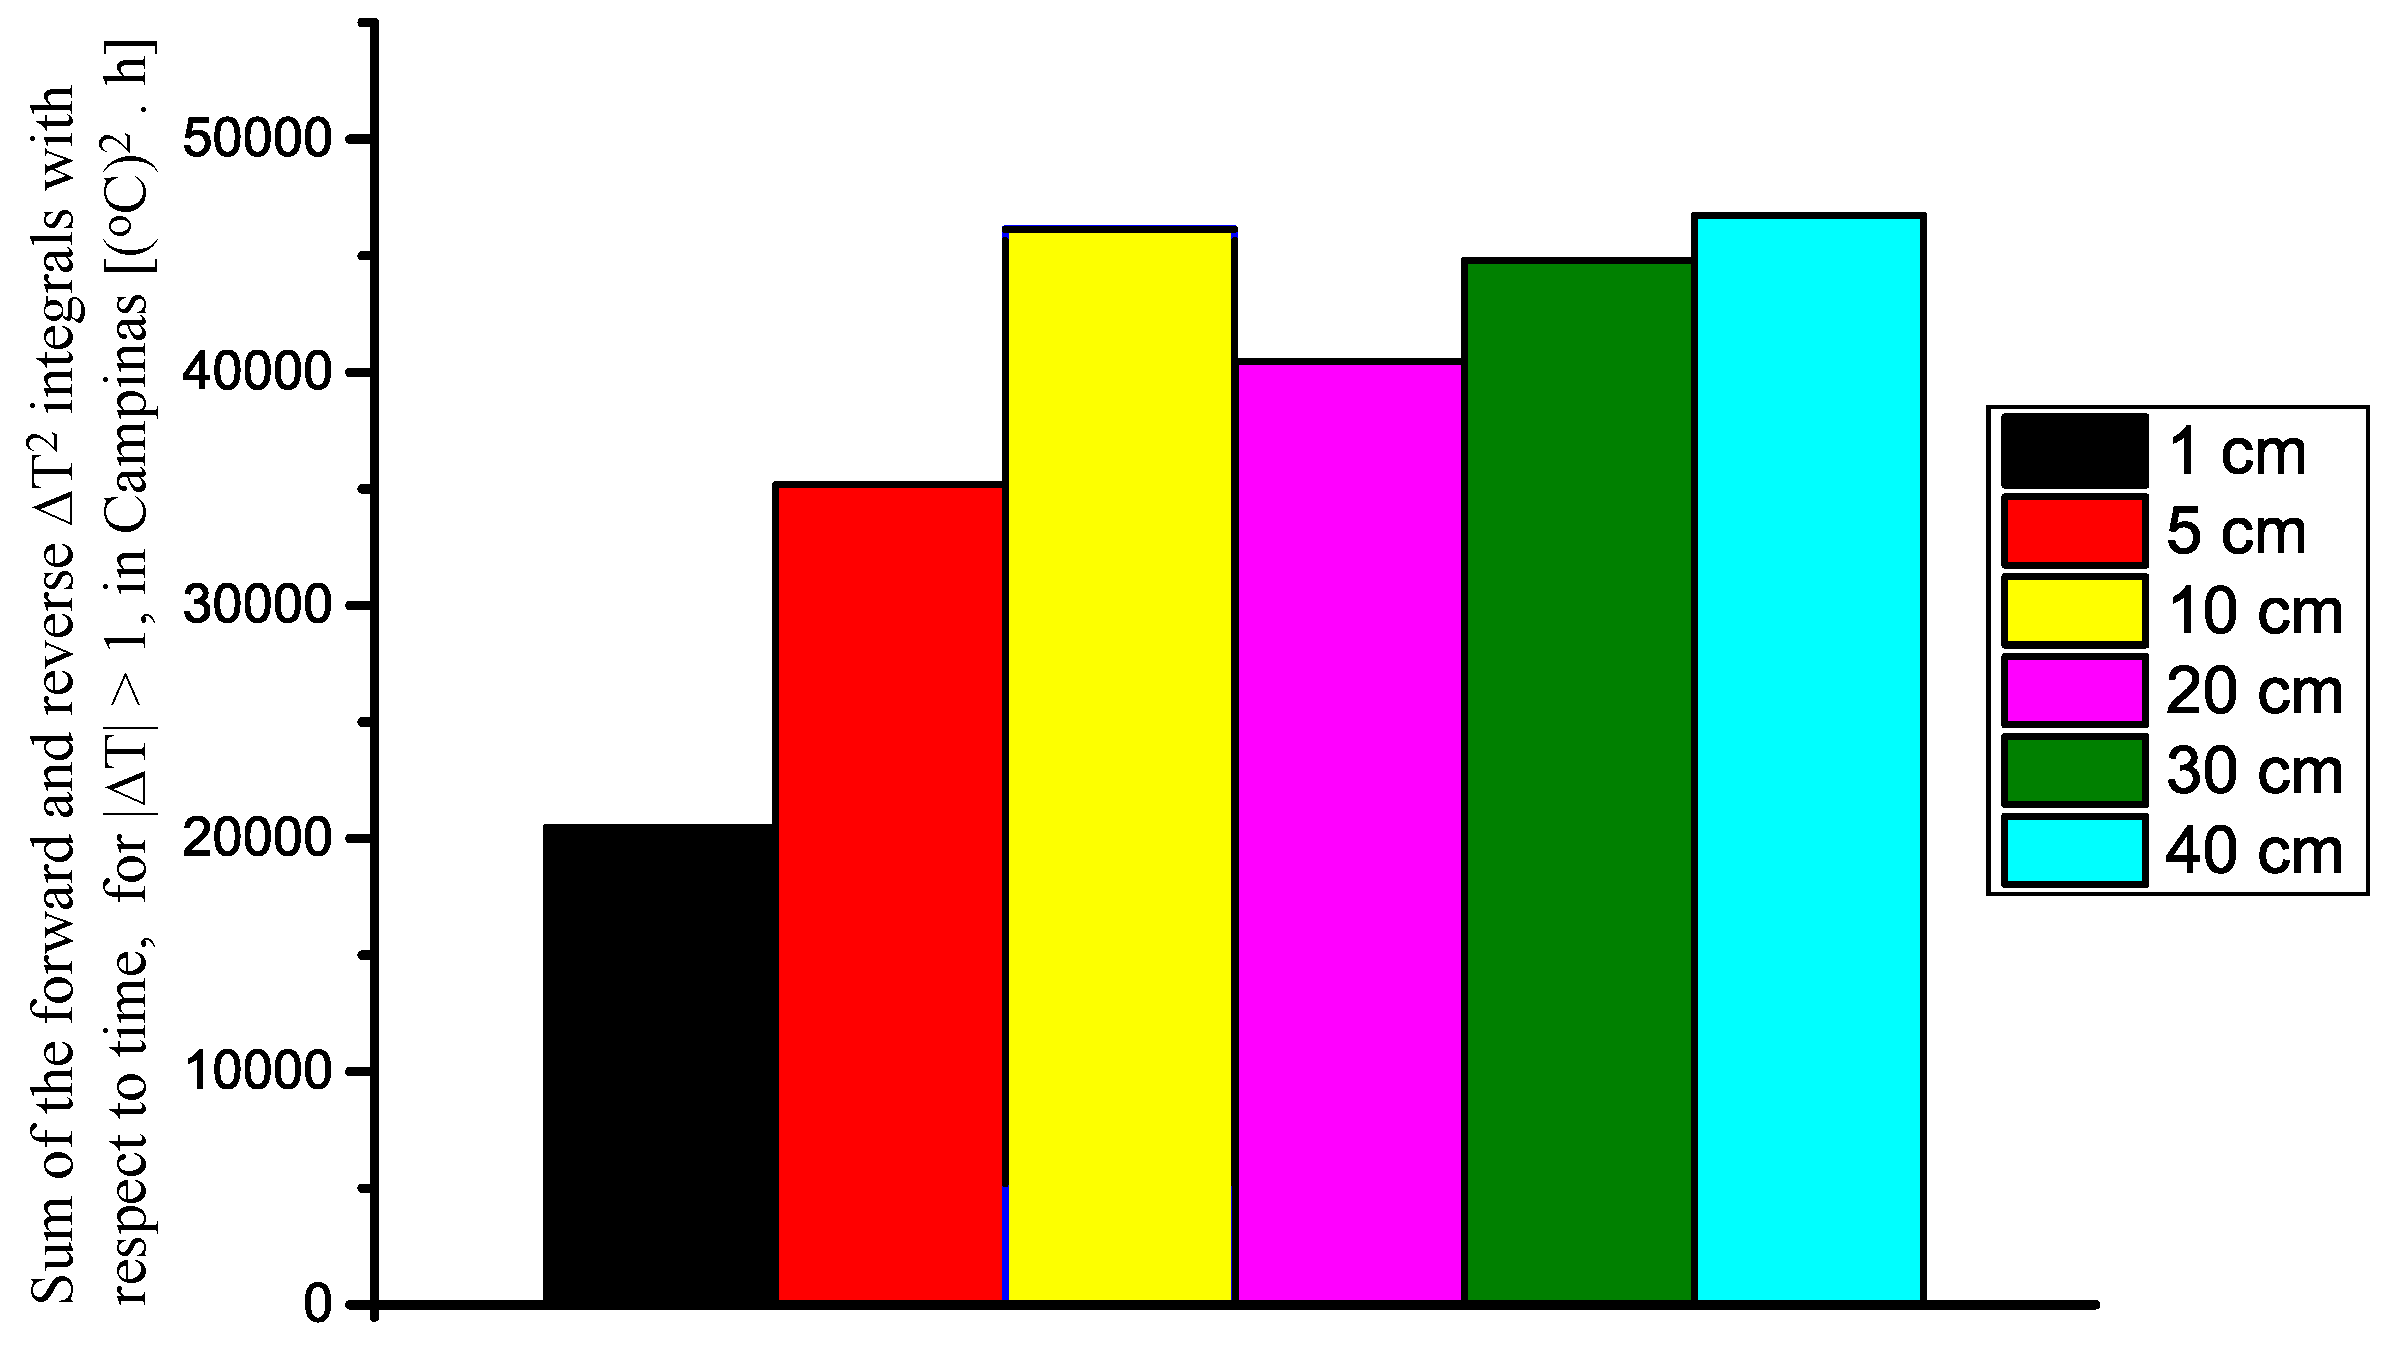
  • During the first 60 days in the summer (approximately day No. 0 to day No. 60), most of the time the diurnal integrals of the 40 cm depth have higher values;
  • During the winter days shown in the plot (approximately day No. 150 to the end of the plot), most of the time the daily integrals of the 5 cm depth present higher values.
For the negative integrals we notice that:
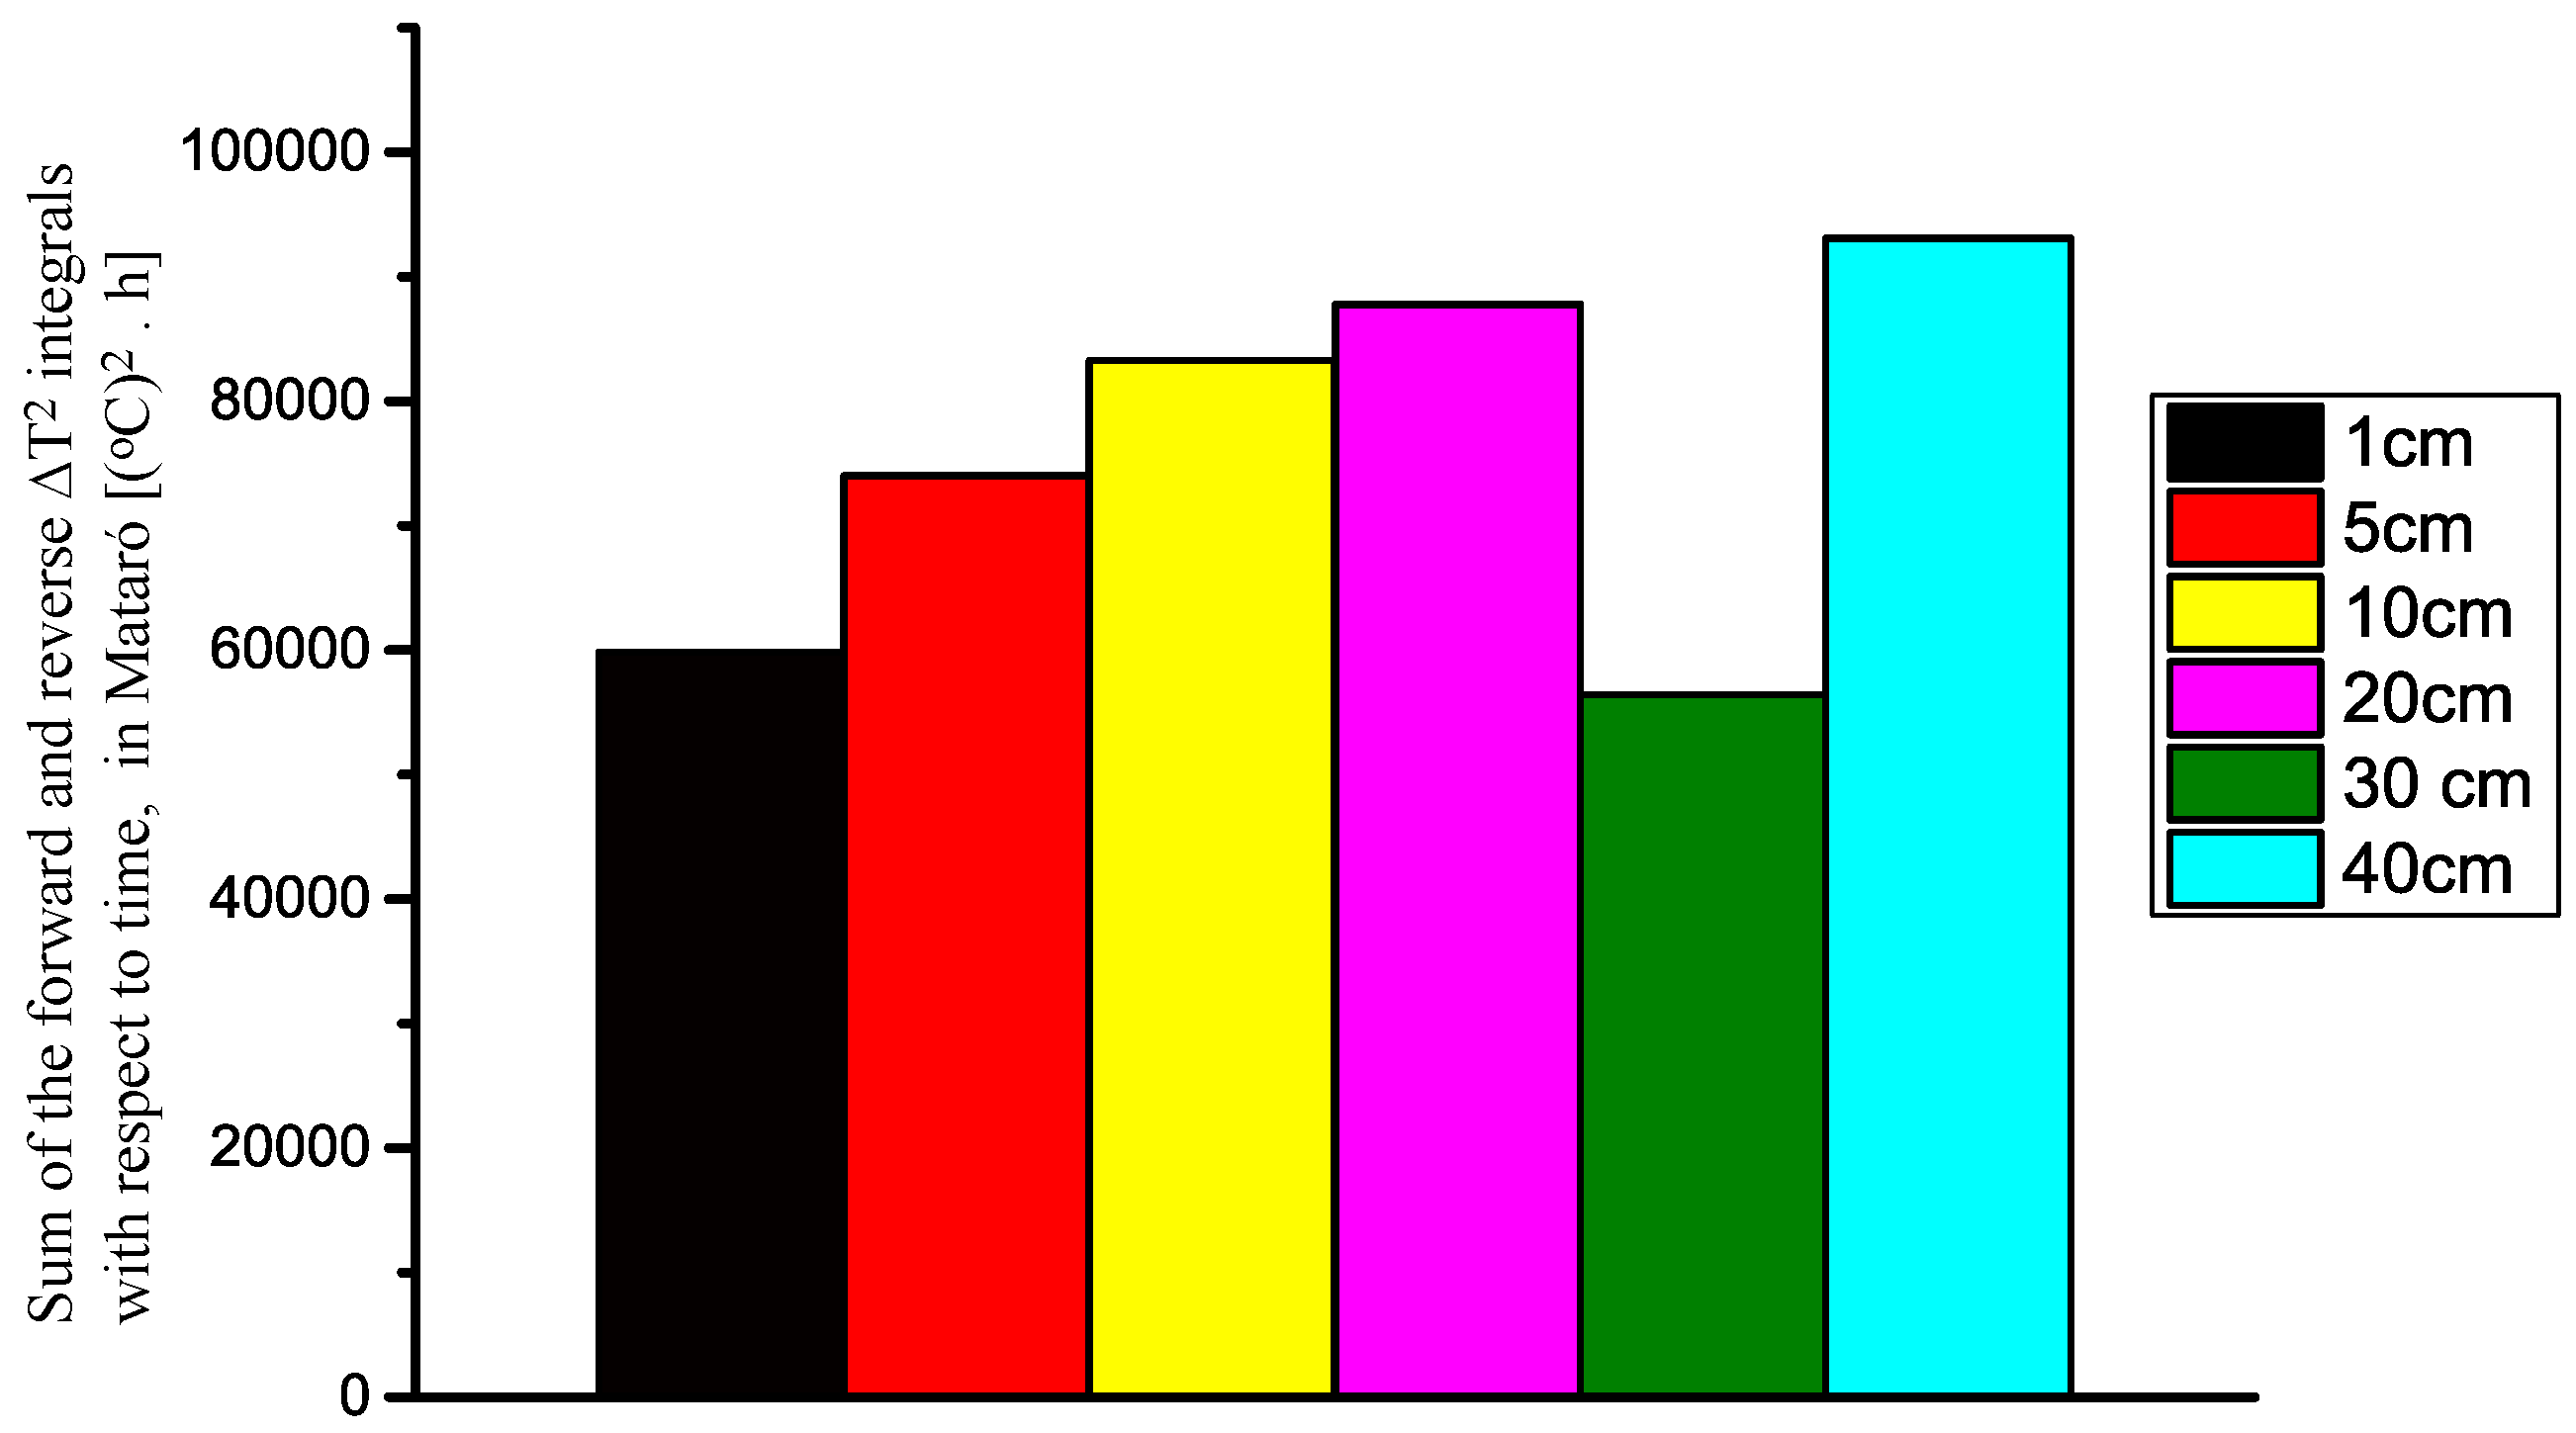
  • During the summer, both 40 cm and 5 cm curves present similar values;
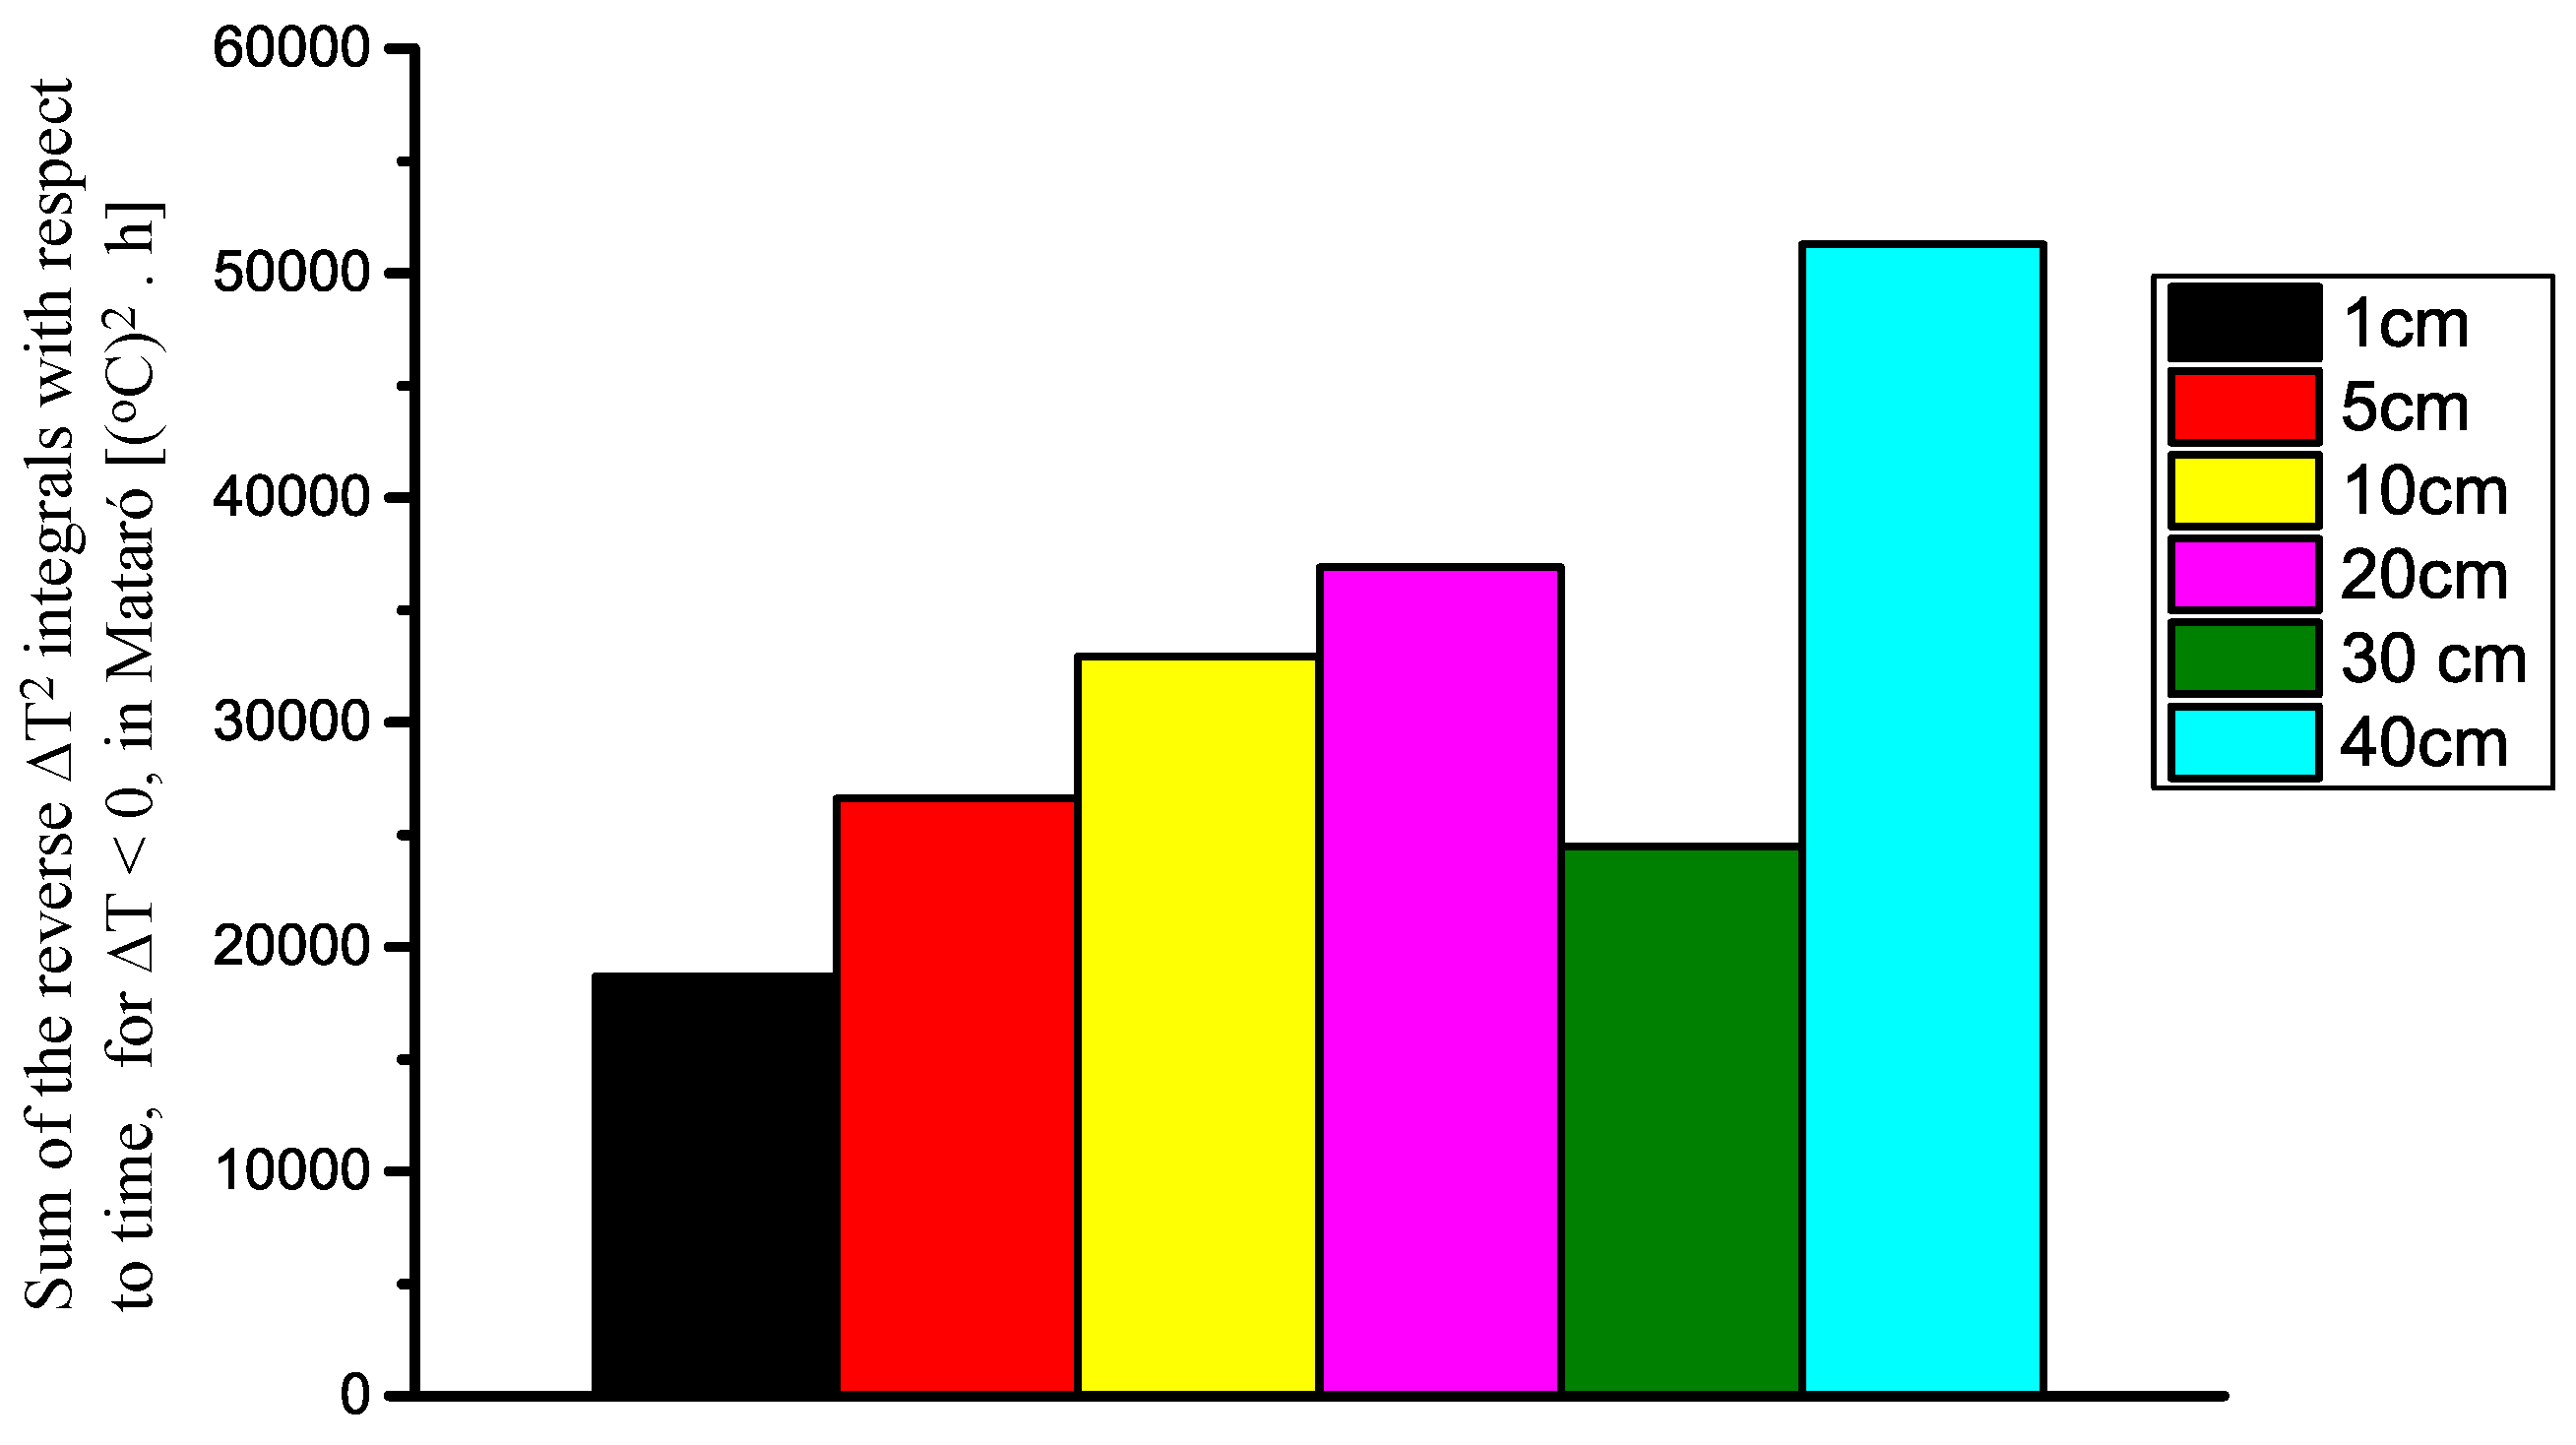
  • For the rest of the days shown, the integral of 40 cm depth presents higher (negative) values.
However, looking at the daily plot of these integrals in Figure 8, it is still difficult to conclude which is the best depth. A more conclusive analysis concerning the potential of energy harvesting with a given soil temperature profile can be made if we perform a summation of the diurnal integrals of the squared Δ T 2 .
Since, according to Equation (1), the electric power that a TEG can deliver is proportional to Δ T 2 , we calculated the energy harvesting potential E H p o t i for each depth i, as the value of these integrals for the whole period:
E H p o t i = t 0 t 1 T p l a t e T d e p t h i 2 d t
These integrals are presented, for each depth, in the form of a bar graph to offer an easy visualization of which depth leads to the best result. The first graph presented, in Figure 9, is for the “forward” integrals (when T p l a t e > T d e p t h ), in Mataró. In this graph it becomes evident that the depth which produces the highest integral is 20 cm, although an installation at the depth of 10 cm would lead to close results.
In Figure 10 we present the plot of the “reverse” integrals of Δ T 2 with respect to time ( T p l a t e < T d e p t h ), for the same 205 days period in Mataró; it is interesting to observe how important is the use of a buried heat sink (to collect energy that is stored in the soil).
From the graph of Figure 10 we notice that the values of the “reverse” energy are not negligible when compared to the “forward” energy (Figure 9), and the best estimated potential for energy harvesting measured for the “reverse” energy (at the depth of 40 cm) is even a little higher than the best “forward” energy at a depth of 20 cm.
The sum of both the “forward” and “reverse” energy from Figure 9 and Figure 10 is presented in Figure 11.
Since a DC-DC converter using the LTC3108 powered with a commercial 110 mV/ C Seebeck coefficient Bismuth Telluride TEG (from EVERREDtronics) requires a Δ T 1 C to start operating [14], we decided to refine the analysis and perform the calculations of the integrals of Δ T 2 only when | T p l a t e T d e p t h | 1 C. The plots in Figure 12 and Figure 13 show the values of these integrals (when | T p l a t e T d e p t h | 1 C), for the installations in Mataró and Campinas, respectively. It is interesting to notice how the restriction | T p l a t e T d e p t h | 1 C influences the system. Comparing Figure 12 with the results from Figure 11 we can see how the condition | T p l a t e T d e p t h | 1 C reduces the performance of the TEG energy harvesting system.
Due to the difference in the latitudes and in the climate of the Northern and Southern Hemispheres, it was obviously expected that the potential of solar energy harvesting in Mataró would be smaller than in Campinas. It is clear that this supposition is correct, as we observe that in a period of only 32 days during the winter in Campinas (5 July to 5 August 2015), a system with the TEG buried at 40 cm (best depth in Campinas) shows a potential of energy harvesting that is 72% of the result obtained, during a period of 205 days (from 23 June 2015 to 13 January 2016) in Mataró, in a system with the TEG buried at 30 cm (best depth in Mataró).

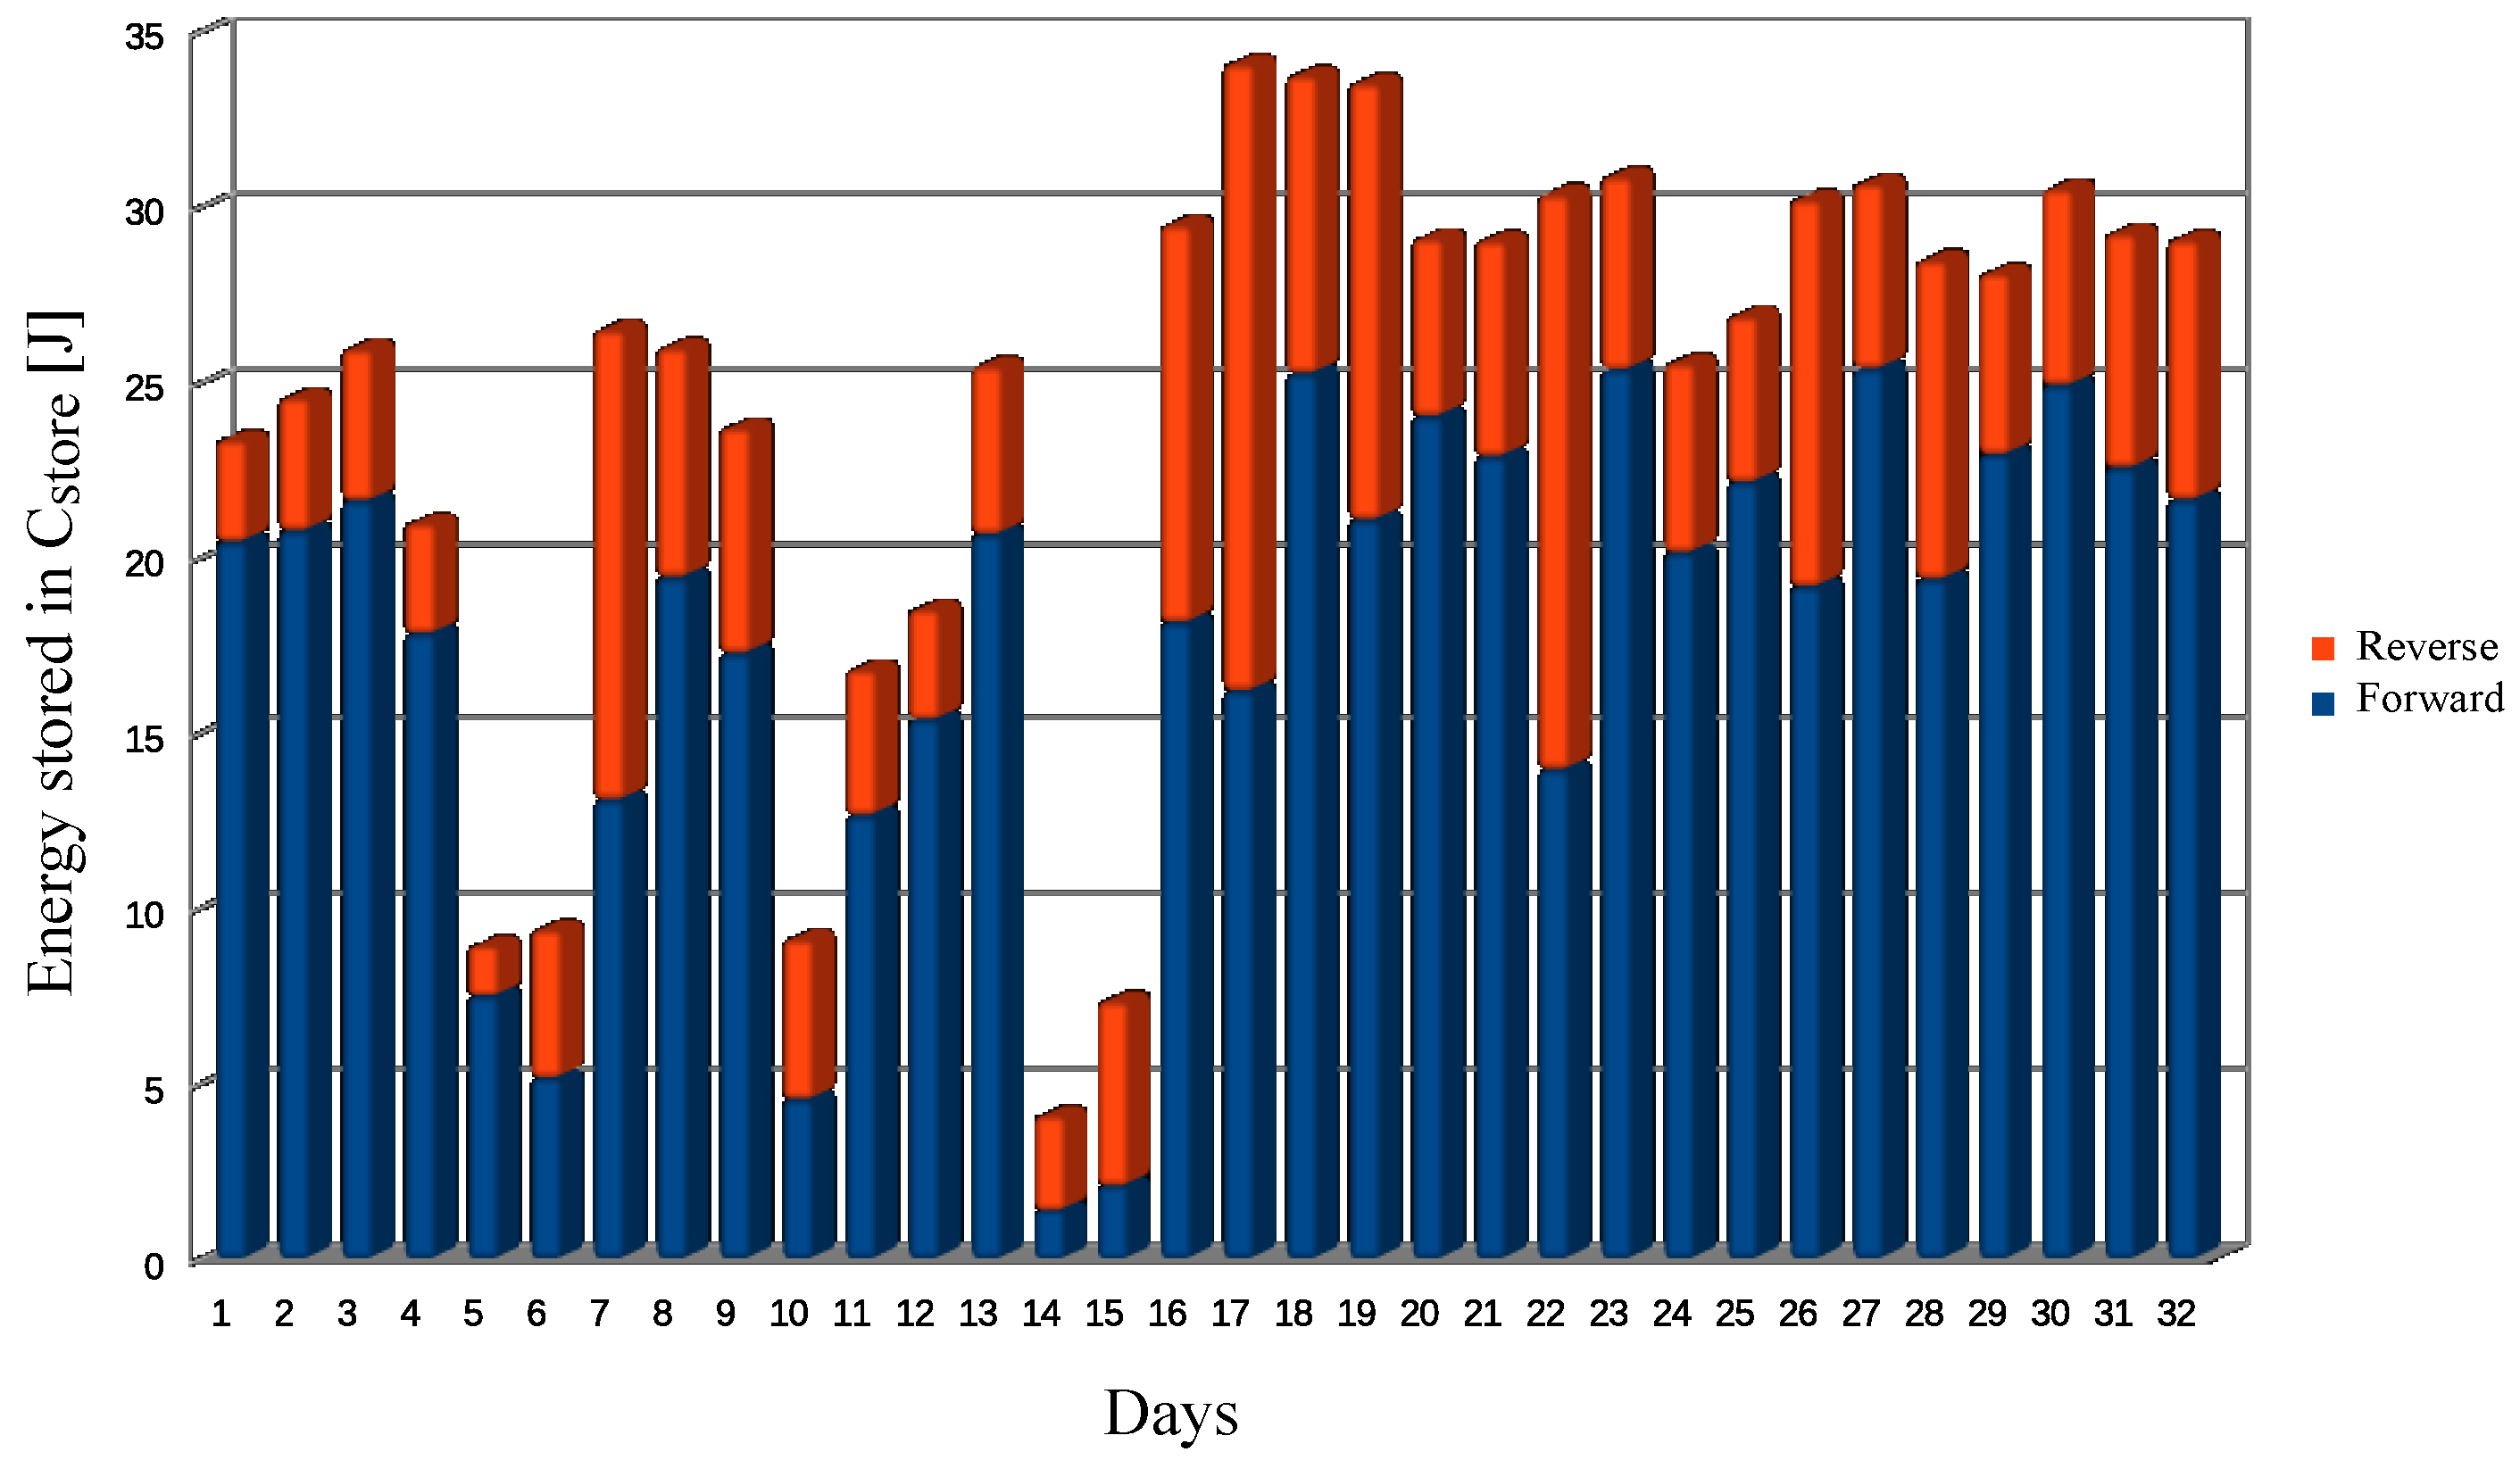
3.2. Measured Results with the Prototype of a STEG Flat Panel System with Buried Heat Sink

Looking at the data presented in Figure 13, we observe that the performance of the system with the heat sink buried at the depths of 10 cm and 40 cm is practically the same, so we installed the prototype with the heat sink buried at a depth of 10 cm, since this provides a cheaper, lighter, and much easier installation. In our prototype we used a heat sink with 200 × 127 mm 2 area, with 16 fins, that presents a thermal resistance R t h = 0 . 3 C W 1 .
Since the supercapacitor is charged both when T p l a t e > T d e p t h and T p l a t e < T d e p t h , we cannot determine when it is being charged with “forward” or “reverse” energy. To be able to distinct when the supercapacitor is being charged with “forward” or “reverse” energy, we installed two AD590 temperature sensors (from Analog Devices), one on each side of the TEG, so we can correlate the charge of the supercapacitor with the sense of the heat flow through the TEG.
The number of cycles (N) in the microcontroller is counted in two distinct registers: one counts N when T p l a t e > T d e p t h and the other when T p l a t e < T d e p t h . In Figure 14 we present the graph of the energy stored in the supercapacitor during 32 consecutive winter days in Campinas.
From Figure 14 we can observe that, as predicted from the integrals of Δ T 2 (Figure 10), the partial part of thermal energy converted to electrical which was stored in the soil is very important. Observing the graph of Figure 14 it is interesting to notice that, in a few days, the amount of “reverse” energy is equal or even higher than the “forward” energy.
In Campinas, the maximum energy supplied by the harvesting system and stored in the supercapacitor in one day (during the 32 days period) occurred on a clear day (12 August 2015,) and the energy stored in the supercapacitor in this day was 34.11 J. It is worth to notice that even during rainy and cloudy days, it was always possible to collect a good amount of energy (the minimum value of energy stored in the supercapacitor in one day was 4.1 J). The daily average energy stored in the supercapacitor during the 32 days period was 24.38 J per day.

4. Discussion

In Mataró, on a cold but sunny winter day (in January) with an ambient temperature of 10 C, we observed that the temperature on the aluminium plate can reach up to 22 C and a high Δ T can be reached in the TEG. However, if we compare two months in the winter in Mataró and Campinas (respectively January and July), the average daily global solar radiation available in Mataró is I E 1 . 89 kW / m 2 / day , a much lower value than in Campinas, where the average daily global solar radiation available, also in the winter, is I E 4 . 66 kW / m 2 / day . Concerning the temperature, in July in Campinas the temperature in the aluminium plate can reach up to 40 C with an ambient temperature of 20 C. These differences result in significantly distinct amounts of energy that can be harvested in different locations, showing that an open air STEG can be difficult to be used to power an autonomous sensor at the latitude of Mataró, if the sensor is not ultra-low power.
To overcome the restrictions of using an open air STEG in countries where, during the winter, the average daily available global solar radiation is low and the low ambient temperature cools the aluminium panel, we implemented a system with a buried TEG. This system can harvest energy when the ambient temperature is in the order of 5 C (or below) because a point at 40 cm into the soil is at a much higher temperature, typically 12 C. Such systems present a much adequate performance to be used at these latitudes.
It was observed that the soil temperature profile in two different latitudes (Campinas, SP—Brazil and Mataró, Catalonia—Spain) are sufficiently different to lead to significant differences in the performance of STEGs with a heat sink buried in the ground. The critical scenario for energy harvesting occurs, as expected, during the winter. Thus, we compared the month of January in Mataró with the month of July in Campinas.
In Mataró, due to the low ambient temperature, the maximum temperature measured in the aluminium panel during January, 2015 was 22 C. On the other hand, in Campinas, during July 2015, the temperature in the aluminium panel reached more than 38 C in 70% of the days. The temperature difference between the aluminium panel and the soil at the depth of 40 cm is very different in Mataró and Campinas, both in the “forward direction” (panel temperature higher than the soil temperature) and “reverse direction” (panel temperature lower than the soil temperature). On the best days in Campinas, the temperature differences, respectively for the “forward direction” and “reverse direction”, were 22 C and 10 C, while in Mataró, the differences were only 12 C and 13 C.
The STEG prototype was buried into the ground in Campinas, at the depth of 10 cm (depth determined after the study of temperature profile), and the energy harvested on a day reached 34.11 J, which is 50% more than an open air STEG was able to harvest [14]. The average energy harvested during a consecutive period of 32 days was 24.38 J per day. We did not have the opportunity to install a buried TEG energy harvesting system in Mataró.
If we assume that the supercapacitor of the energy harvesting system with a buried TEG was at its lowest voltage (1.8 V), since the collected energy during a day reached 34.11 J, this is enough to charge a 3 F supercapacitor up to 5 V (equivalent to 2.66 mAh). Thus, assuming that we have a 2 F supercapacitor charged with 5 V, a sensor system with a standby current of 2 μ A which makes 24 measurements per day (one every 60 min), each measurement requiring 0.5 s to be made and consuming 1 mA, would be able to operate for more than 47 days without harvesting energy, if the self discharge current of the supercapacitor is neglected.

5. Conclusions

We presented an experimental study of the thermoelectric energy harvesting potential at different latitudes using solar flat panels systems with buried heat sink. A data-logger that measured the temperature soil profile at different depths was built and installed at two different latitudes: one in Campinas, SP – Brazil (latitude 22 54 20 S), and another in Mataró, Catalonia, Spain (latitude 41 32 17 N). Since the output power in a TEG is proportional to the square of temperature difference between its hot and cold side, we calculated the integrals of Δ T 2 with respect to time for the several depths where a temperature sensor was installed into the soil. The obtained results show that at each latitude there is an optimal depth where the TEG must be installed to optimize the energy harvesting. The calculated results showed that a measurement of the soil profile temperature is mandatory at each latitude where a STEG with buried heat sink will be installed. It was also possible to show that in regions where the available solar radiation is low, the use of a buried heat sink can improve drastically the performance of the system, almost doubling it when we compared to the result obtained with an open air STEG. An experiment with a prototype STEG with buried heat sink was built and installed in Campinas, where the daily average energy stored in the supercapacitor during the 32 days in period (5 July to 5 August 2015) was 24.38 J per day.

Author Contributions

Conceptualization, P.C.-D., A.C. and J.A.S.D.; methodology, P.C.-D., A.C. and J.A.S.D.; circuit design, PCB layout and circuit tests, P.C.-D.; firmware and software, P.C.-D.; writing—review and editing, A.C. and J.A.S.D.; funding acquisition, P.C.-D.

Funding

This research was funded by FAPESP grant number 2014/01470-3, CAPES and the European Regional Development Funds.

Conflicts of Interest

The authors declare no conflict of interest. The funders had no role in the design of the study; in the collection, analyses, or interpretation of data; in the writing of the manuscript, or in the decision to publish the results.

Abbreviations

The following abbreviations are used in this manuscript:
A/DAnalog to digital
α n and α p Seebeck coefficients of the n and p elements of the TEG
C s t o r e Value of supercapacitor
Δ T Temperature difference between hot and cold side of a TEG
ETotal energy stored in the supercapacitor
E l a s t Energy soreted in the supercapacitor of the last (incomplete) charge/discharge cycle
ETotal energy stored in the supercapacitor
E l a s t Energy soreted in the supercapacitor of the last (incomplete) charge/discharge cycle
I E Average daily global solar radiation
ICIntegrated circuit
LEDLight emitting diode
LSBLeast significant bit
NTCNegative temperature coefficient
NNumber of cycles of charge/discharge of the supercapacitor
PCBPrinted circuit board
P e l e c Electric power delivered by a TEG
PCMPhase changing materials
P E N Potential of energy harvesting (in C 2 ·h)
R t h Thermal resistance of the heat sink
R T E G Output impedance of the TEG
R L Impedance of the external load
RFRadio frequency
STEGSolar thermoelectric generators
TTemperature in C
TEGThermoelectric generators
T p l a t e Temperature measured in the flat panel
T d e p t h Temperature measured at a given depth of the soil
USBUniversal serial bus
WSNWireless sensors network

References

  1. Ismail, B.I.; Ahmed, W.H. Thermoelectric power generation using waste-heat energy as an alternative green technology. Recent Patents Electr. Eng. 2009, 2, 27–39. [Google Scholar] [CrossRef]
  2. Nesarajah, M.; Frey, G. Optimized Design of Thermoelectric Energy Harvesting Systems for Waste Heat Recovery from Exhaust Pipes. Appl. Sci. 2017, 7, 634. [Google Scholar] [CrossRef]
  3. Kim, J.; Lee, Y.J. A study on the applicability of energy harvesting technology for the sensor network of railroad system by thermal deviation. In Proceedings of the Sixth International Conference on Sensor Technologies and Applications, Rome, Italy, 19–24 August 2012; pp. 178–181. [Google Scholar]
  4. NASA Tech. Rep. Available online: http://mars.nasa.gov/msl/mission/technology/technologiesofbroadbenefit/power/ (accessed on 10 December 2018).
  5. Leonov, V.; Torfs, T.; Fiorini, P.; Hoof, C.V. Thermoelectric converters of human warmth for self-powered wireless sensor nodes. IEEE Sens. J. 2007, 7, 650–657. [Google Scholar] [CrossRef]
  6. Gyusoup, L.; Choi, G.; Kim, C.; Kim, T.; Choi, H.; Kim, S.; Kim, H.; Lee, W.; Cho, B. Material Optimization for a High Power Thermoelectric Generator in Wearable Applications. Appl. Sci. 2017, 7, 1015. [Google Scholar] [CrossRef]
  7. Samsona, D.; Klugea, M.; Beckera, T.; Schmid, U. Wireless sensor node powered by aircraft specific thermoelectric energy harvesting. Sens. Actuators A Phys. 2011, 172, 240–244. [Google Scholar] [CrossRef]
  8. Yan, R.; Sun, H.; Qian, Y. Energy-aware sensor node design with its application in wireless sensor network. IEEE Trans. Instrum. Meas. 2013, 62, 1183–1191. [Google Scholar] [CrossRef]
  9. Sardini, E. Serpelloni, M. Passive and self-powered autonomous sensors for remote measurements. Sensors 2009, 9, 943–960. [Google Scholar] [CrossRef] [PubMed]
  10. Akbari, S. Energy Harvesting for Wireless Sensor Networks Review. In Proceedings of the 2014 Federated Conference on Computer Science and Information Systems, Poznan, Poland, 9–12 September 2018; pp. 987–992. [Google Scholar] [CrossRef]
  11. Zhang, Q.; Agbossou, A.; Feng, Z.; Cosnier, M. Solar micro-energy harvesting based on thermoelectric and latent heat effects.part i: Theoretical analysis. Sens. Actuators 2010, 163, 277–283. [Google Scholar] [CrossRef]
  12. Skovajsa, J.; Zalesak, M. The Use of the Photovoltaic System in Combination With a Thermal Energy Storage for Heating and Thermoelectric Cooling. Appl. Sci. 2018, 8, 1750. [Google Scholar] [CrossRef]
  13. Dias, P.C.; Cadavid, D.; Ortega, S.; Ruiz, A.; França, M.B.; Morais, F.; Ferreira, E.; Cabot, A. Autonomous soil moisture sensor based on nanostructured thermosensitive resistors powered by an integrated thermoelectric generator. Sens. Actuators A Phys. 2016, 239, 1–7. [Google Scholar] [CrossRef]
  14. Dias, P.C.; Morais, F.O.; França, M.B.; Ferreira, E.; Siqueira Dias, J. Autonomous Multi-sensor System Powered by a Solar Thermoelectric Energy Harvester with Ultra-Low Power Management Circuit. IEEE Trans. Instrum. Meas. 2016, 64, 2918–2925. [Google Scholar] [CrossRef]
  15. Dalola, S.; Ferrari, M.; Ferrari, V.; Guizzetti, M.; Marioli, D.; Taroni, A. Characterization of thermoelectric modules for powering autonomous sensors. IEEE Trans. Instrum. Meas. 2009, 58, 99–107. [Google Scholar] [CrossRef]
  16. Lawrence, E.; Snyder, G. A study of heat sink performance in air and soil for use in a thermoelectric energy harvesting device. In Proceedings of the Twenty-First International Conference on Thermoelectrics, Long Beach, CA, USA, 25–29 August 2002; pp. 446–449. [Google Scholar] [CrossRef]
  17. Carvalhaes-Dias, P.; Morais, F.; Duarte, L.; França, M.; Spengler, A.; Cabot, A. Measurement of the electric energy storage capacity in solar thermoelectric generators’ energy harvesting modules. Int. J. Distrib. Sens. Netw. 2017, 3. [Google Scholar] [CrossRef]
Figure 1. Heat flow in an energy harvesting system flat panel system with buried heat sink: when the temperature of the flat panel is higher than the temperature in the soil, the heat flows from the flat panel to the soil; when the temperature of the soil is higher than the temperature in the flat panel, the heat flows from the soil to the flat panel.
Applsci 08 02641 g001
Figure 2. Sketch and photograph of the flat panel with temperature sensor and data-logger.
Applsci 08 02641 g002
Figure 3. Block diagram of the data-logger for the measurement of the soil profile.
Applsci 08 02641 g003
Figure 4. Measured values of temperature in the seven thermistors, left at room temperature.
Applsci 08 02641 g004
Figure 5. Photographs of the soil temperature profile measurement systems installed in Campinas and Mataró.
Applsci 08 02641 g005
Figure 6. Prototype of the TEG solar flat panel with buried heat sink.
Applsci 08 02641 g006
Figure 7. Measured temperature at various depths, during one sunny day in the winter (21 July 2015) in Campinas.
Applsci 08 02641 g007
Figure 8. Daily integral of temperature difference ( T p l a t e T d e p t h ) with respect to time, for depths of 5 cm and 40 cm, from 23 June 2015 to 13 January 2016 (period of 205 days).
Applsci 08 02641 g008
Figure 9. “Forward” integrals of Δ T 2 with respect to time, at various depths, for 205 days, in Mataró.
Applsci 08 02641 g009
Figure 10. Sum of the “reverse” integrals of Δ T 2 with respect to time, at various depths, for 205 days, in Mataró.
Applsci 08 02641 g010
Figure 11. Sum of the integrals of Δ T 2 with respect to time at various depths, for 205 days (from 23 June 2015 to 13 January 2016), in Mataró.
Applsci 08 02641 g011
Figure 12. Sum of the “forward” and “reverse” integrals of Δ T 2 with respect to time (for | T p l a t e T d e p t h | 1 C), at various depths, for 205 days (from 23 June 2015 to 13 January 2016), in Mataró.
Applsci 08 02641 g012
Figure 13. Sum of the “forward” and “reverse” integrals of Δ T 2 with respect to time (for | T p l a t e T d e p t h | 1 C), at various depths, for 32 days (5 July to 5 August 2015), in Campinas.
Applsci 08 02641 g013
Figure 14. Values of the stored energy in the supercapacitor, measured during 32 days (July 5 to 5 August 2015), in Campinas. The blue bars are the “forward” energy and the red bars are the “reverse” energy.
Applsci 08 02641 g014

