1. Introduction
Thermoelectric generators (TEG) convert heat into electrical energy [
1] without the step of performing mechanical work in between, which makes them a favorable choice for energy harvesting applications in terms of robustness and reliability. The efficiency of thermoelectric (TE) conversion is determined on the material level by the figure of merit
ZT, which is formed by the Seebeck coefficient
S, and the electrical and thermal conductivity
σ and
κ, respectively (
ZT =
S2∙σ∙κ−1∙T). The TE conversion of waste heat has been considered in the past for high power generation in many fields, such as to supply space probes [
2,
3], or for automotive [
4,
5,
6] and stationary applications [
7,
8]. In contrast to this, TE energy harvesting for aviation was taken into account in the past with a focus on low power applications to supply sensor nodes. Many works have been conducted in the context of structural health monitoring [
9,
10,
11], whereby a proof of principle could already been given during flight tests according to a few reported studies [
12,
13].
The performance of today’s aero-engines is already optimized to a high level. Further improvement by means of known concepts seems increasingly difficult and new technologies have to be considered in order to reduce the fuel consumption and environmental pollution of future aircrafts and to move closer to the specified goals by ACARE [
14] and Flightpath 2050 [
15]. This is linked to the fact that the thermal efficiency of gas turbines is mainly determined by the overall pressure ratio and the turbine entry temperature [
16]. The increase of both parameters requires new material solutions that are investigated extensively. Another possibility for improvement is given by the management of heat flow, in order to decrease the amount of waste heat of engines that is lost to the environment. For this reason, focus is put on the recuperation of engine waste heat [
16,
17]. Conducted works on TE high power applications in the hot gas environment have been restricted over the years to basic assessments from estimated temperature differentials and approximated heat flux conditions [
18,
19,
20]. These studies led to restrained conclusions on the resulting performance and the assessment of a lacking technological and economic efficiency of TEG. Although admittedly lower in today’s achievable efficiencies, TEG still avoids additional complex thermodynamic cycles, corresponding installations, and their handling for the jet engine system. This principally corresponds to an easy implementation and lower maintenance effort when compared to other emerging heat engine technologies (e.g., Organic Rankine Cycle).
The occurrence of MW heat losses of turbofan engines [
21], in contrast to the relatively low average electrical power requirements of today’s mid-size aircrafts (180 PAX~45 kVA/engine) offers an attractive fuel saving potential from a direct conversion of engine heat into electrical energy by TEG. As shown in a previous work [
22], the assumption of an efficient heat transfer by heat pipes (κ
eff = 400 Wm
−1K
−1) and conservative TEG material efficiency (
ZTmean = 0.8) yields a specific TEG power output between 1 kWm
−2 to 9 kWm
−2, which becomes attainable from of a first approximation of temperatures and heat fluxes on several sections of the reference engine: high- and low pressure turbine (HPT, LPT), interducts, and nozzle. The theoretically maximum available surface of the turbofan geometry would allow for an installation of approximately 15 kVA TEG power output per engine in total. However, due to the limited space, the installation of TEGs on high temperature sections of the engine (HPT, LPT) seems technically difficult, which favors an implementation at the nozzle.
Thus, the effect of the TEG between the hot core stream and the cool bypass flow was investigated in detail for a location at the engine nozzle. While this site is certainly subjected to fewer design constrains, it poses the drawback of potentially lower temperature difference at the TEG in comparison with a location at other engine sections with higher temperatures and heat flux.
In order to quantify the reduction of the fuel consumption, combined numerical methods have been applied to forward simulation data to a parametric model of the aircraft using the Pacelab Aircraft Preliminary Design (APD) software environment [
23]. As the reference engine, a second generation geared turbofan engine with an unmixed nozzle and design-freeze in 2030 was chosen, together with an appropriate mission profile [
22]. The most influential parameters of today’s civil turbofan engines (bypass ratio, overall pressure ratio, turbine entry temperature, etc.) have been extrapolated to meet the prospective technology level in 2030 [
22]. For definition of the geometry and the engine thrust requirements, the engine was designed with GasTurb [
24] for top of climb as the design point (DP). By this, the resulting geometrical flow paths have been sized, allowing for the study of operational behavior of the engine by variation of engine power settings. As described in a previous work [
25], the heat transfer calculation at the nozzle was accomplished by solving the three-dimensional (3D) Reynolds-averaged Navier–Stokes (RANS) equations using the computational fluid dynamics (CFD) solver TRACE [
26,
27,
28]. The results of the CFD calculation were forwarded to a one-dimensional (1D) MODELICA model including the TEGs for computation of the heat flow from the core to the bypass. Here, the equivalence of the fluidic and thermal boundary layer thickness was assumed for the calculation of the heat transfer coefficients of the boundary layers, corresponding to a Prandtl number = 1. This process was repeated iteratively for the precise calculation of the heat transfer at the nozzle. Based on the results on the heat flux a sensitivity analysis on the thermoelectric figure of merit
ZT was accomplished for the evaluation of the fuel saving potential by means of a mission-based performance modelling of the aircraft using the Pacelab APD environment [
29].
According to the aforementioned works the fuel saving potential of a TEG is based on two effects. First, the generation of electrical energy by the TEG allows a slight mass reduction of the shaft-driven electric generator within the engine (1 kg/kW
TEG). The lowered mechanical power, which is taken by the generator from the driving shaft, translates into an efficiency improvement, and this in turn leads to a reduction of the specific fuel consumption (SFC). According to the APD model of the reference aircraft the maximum saving on SFC equals 1% for a vanishing mechanical power usage by the conventional generator (total replacement by TEG) [
22]. In this case, the TEG must provide the entire average power output of the generator, which equals 45 kVA per engine according to the APD model. Secondly, due to the heat transfer from the hot core stream to the cool bypass flow the bypass boundary layer is accelerated, whereas the core boundary layer is decelerated. For top-of-climb and at cruise conditions, the effect on the bypass flow shows an outweighing impact on the propulsive efficiency of the aircraft with maximum improvement in SFC of approximately 0.1% [
2].
The SFC improvement yields a saving of fuel mass, which can be traded with the additional mass introduced by the TEG. The break-even is reached on the aircraft level if the fuel efficiency improvement outweighs the weight impact of the TEG. According to the mission-based APD evaluation, a fuel efficiency improvement is already given for a gravimetric electrical power density of the TEG > 173 Wkg
−1 (“APD” limit) if one considers only the positive effects that are related to the aircraft generator [
28]. If the additional impact on the propulsive efficiency due to the heat transfer from the core to the bypass flow is taken into account, the requirement on the specific power density of the TEG reduces to 100 Wkg
−1 (“APD + CFD” limit).
Although the implementation of a TEG with the specified power density will improve fuel efficiency, it will reduce the maximum range of the aircraft due to the limitation on the maximum take-off weight (MTOW) of the aircraft. In order to reach a range invariant implementation of TEG, an increased electrical power density > 520 Wkg−1 (“APD range-invariant” limit) is required according to the aircraft model.
Thermal boundary conditions from the CFD model have been transferred to a finite element model (FEM) of a thermoelectric uni-couple in this work. Operational characteristics of this uni-couple have been extrapolated to a full coverage of the nozzle surface with the specified geometry from GasTurb. Parametric studies on the TEG design have been conducted in order to verify the feasibility to satisfy the gravimetric power density requirements and to specify the requirements on TEG design and its resulting performance. The gravimetric power density is optimized by variation of the TE element lengths and the filling factor, which is a known concept for the matching of thermal resistance of a TEG module [
30,
31,
32,
33]. The filling factor is the ratio between the active surface of a TE module that is covered by the TE materials by the total surface of the module, which acts as the thermal coupling face to the heat source and sink, respectively.
2. Materials and Methods
The modelling is done for a thermoelectric uni-couple by a 3D steady state temperature dependent FEM simulation using built-in thermoelectric tetrahedral elements (Type: 226) of ANSYS Workbench
TM. The minimum element length was set to 65 µm. Depending on the length of thermoelectric legs, this resulted in a minimum element count of 813·10
3 for the uni-couple model. The FEM simulation was validated by a comparison to an analytical 1D constant properties model (CPM) of the TE elements stacked with contact and heat exchanger layers. Details on the CPM and governing equations for thermoelectric power generation can be found in [
32]. The results of this comparison, which are summarized in
Table A2 in the appendix, point to a deviation of all relevant operation parameters that are lower than 2% between FEM and CPM simulation.
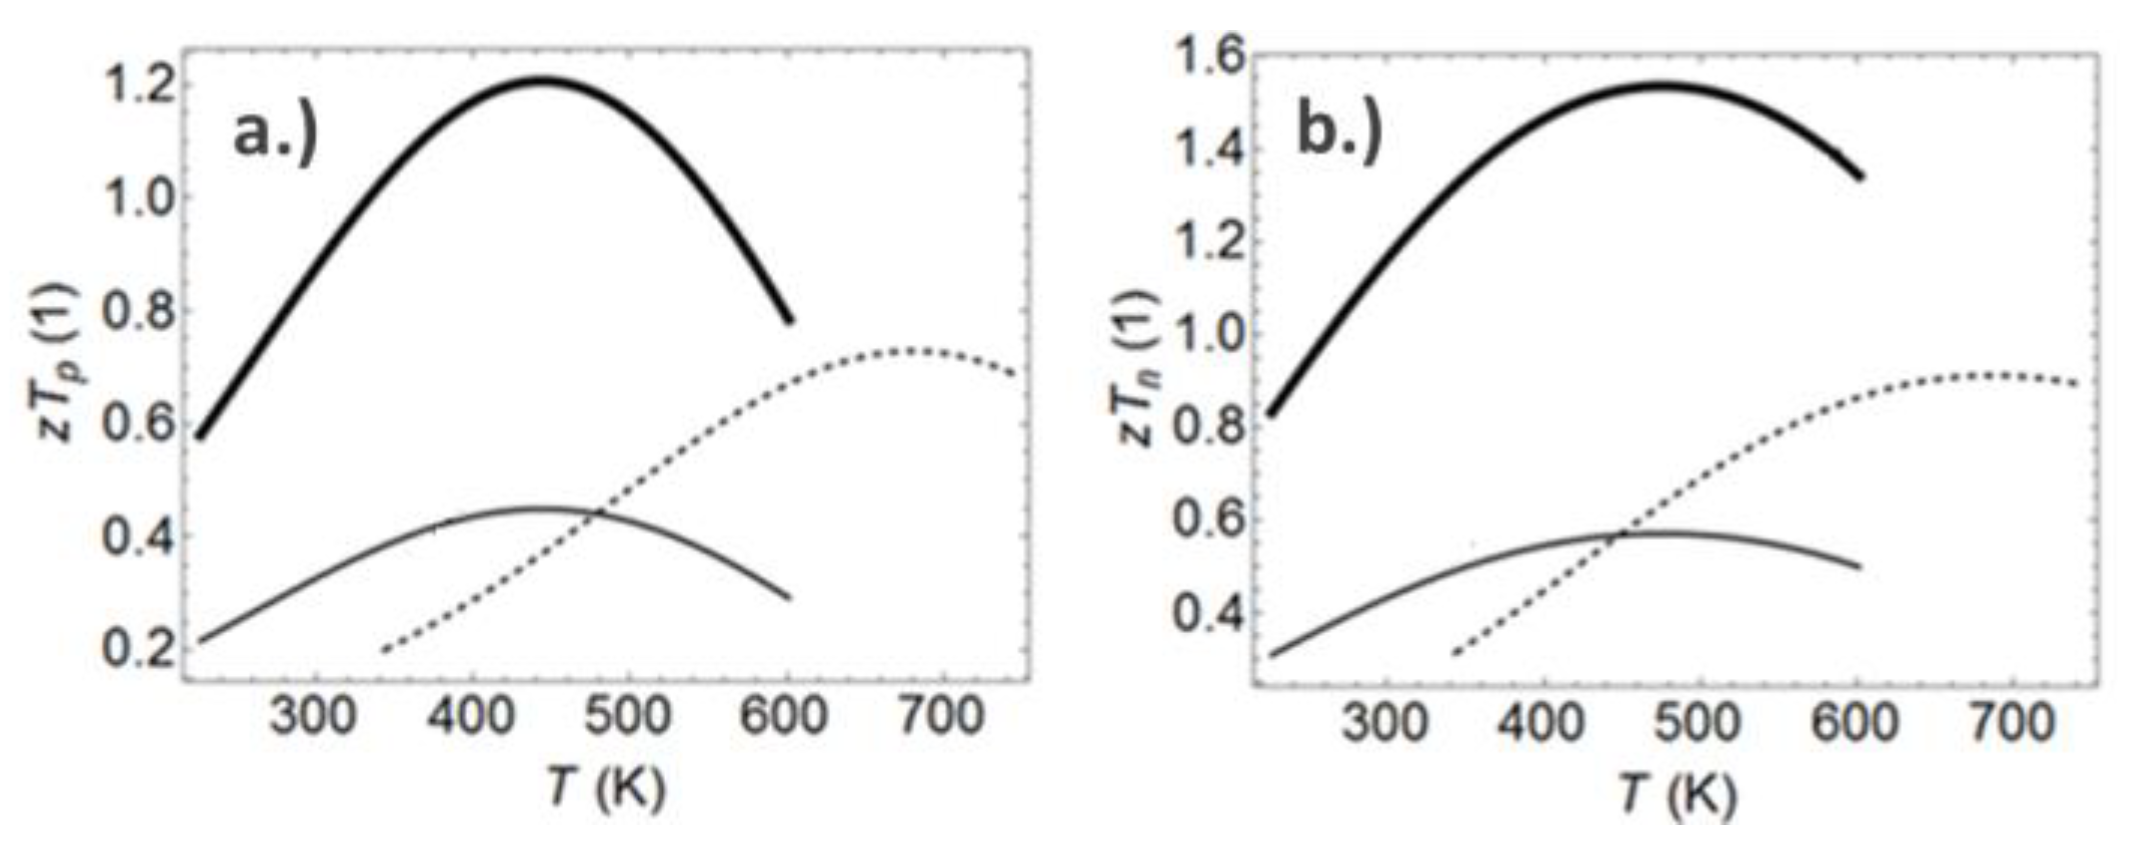
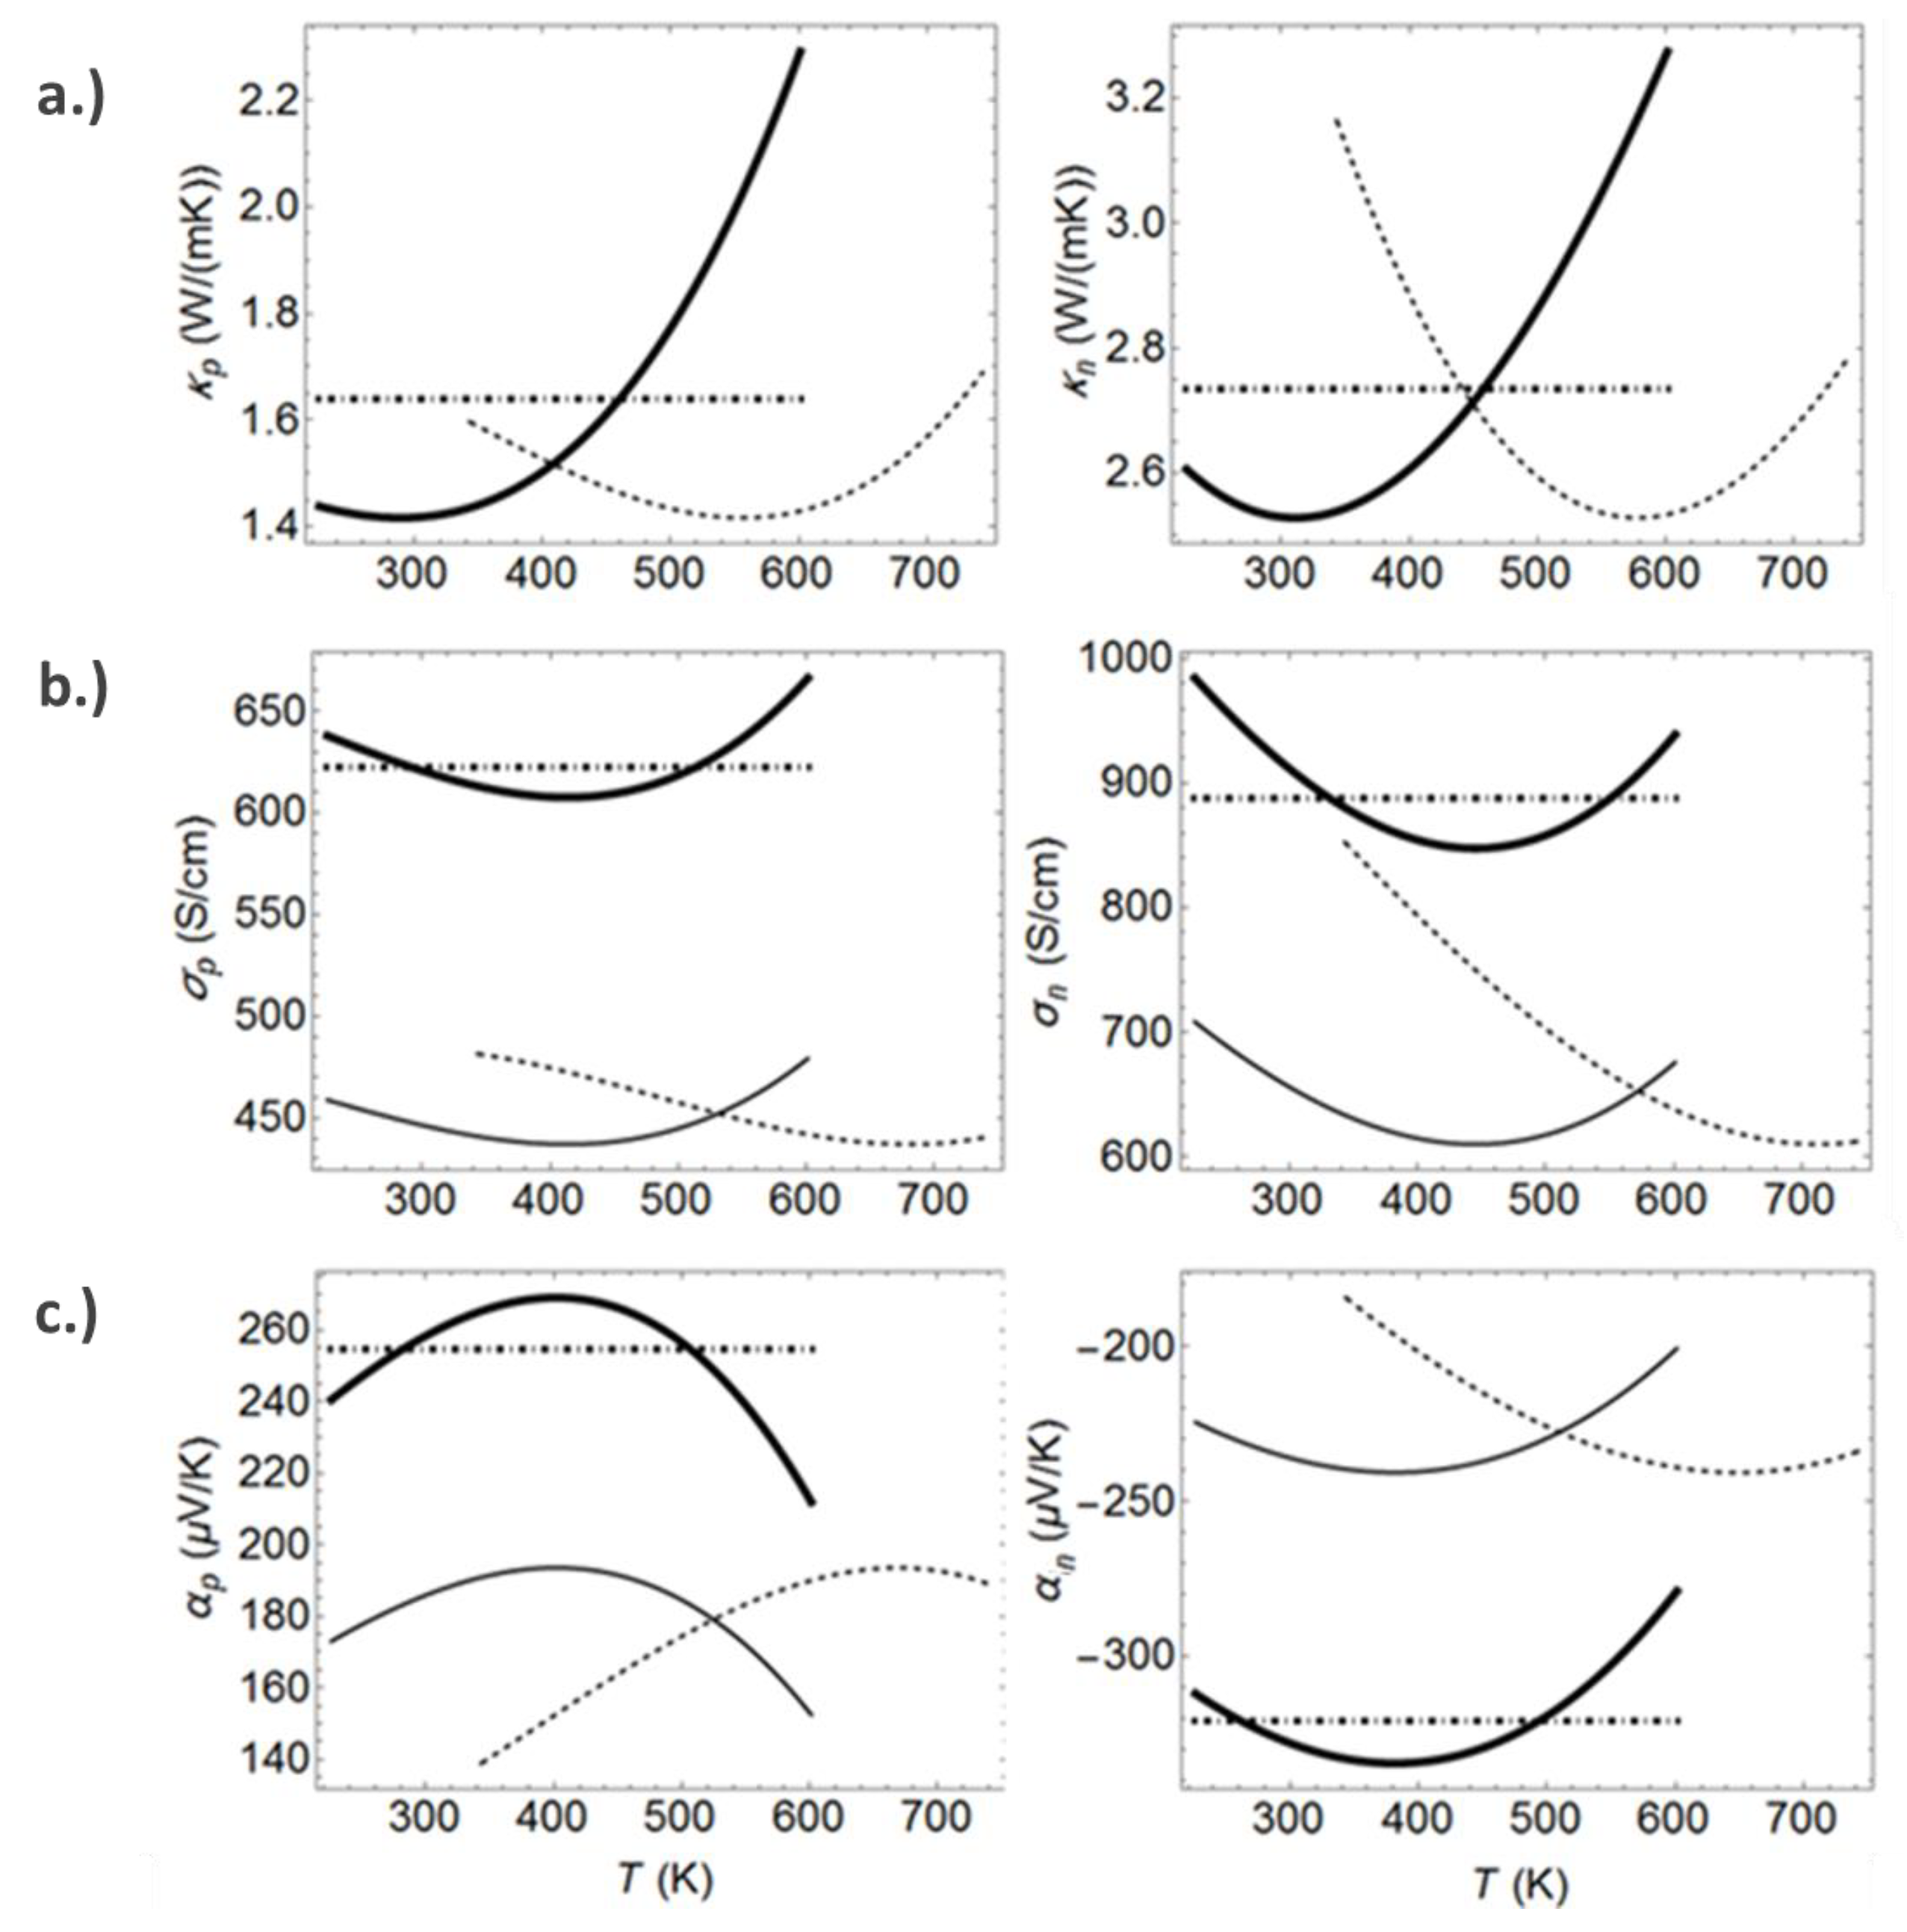
Though simulation was conducted for all flight phases of the chosen mission profile, the geometry optimization and detailed performance calculations have been performed for the cruise phase, which has the highest temporal share (87%) of the total mission time (395 min) for the set flight distance of 2850 nautical miles (NM). Based on material properties, measured on n- and p-type Skutterudite samples, high performance virtual thermoelectric materials (HPVM) are defined by the modification of the temperature characteristics of the real TE transport properties (
Figure 1). More details on the individual TE transport properties can be found in the supporting information within the appendix of this publication (
Figure A1).
First, the temperature curves of the thermal conductivity, the Seebeck coefficient, and the electrical conductivity of the Skutterudite materials are shifted into the temperature range of the nozzle application in order to represent an optimized material. As an effect of the lower mean temperature the resulting ZT values decrease. To consider a reasonable technology level of a future TE material during simulation, the power factor (PF = S2∙σ) of the p- and n-type material is increased by an improvement of the Seebeck coefficient and the electrical conductivity by 40% for each property, whereas the thermal conductivity was kept constant. With that, the HPVM with peak ZT values of 1.2 (p-type) and 1.5 (n-type) are used as input for the simulation. This corresponds to ZTmean = 1.14 for the uni-couple.
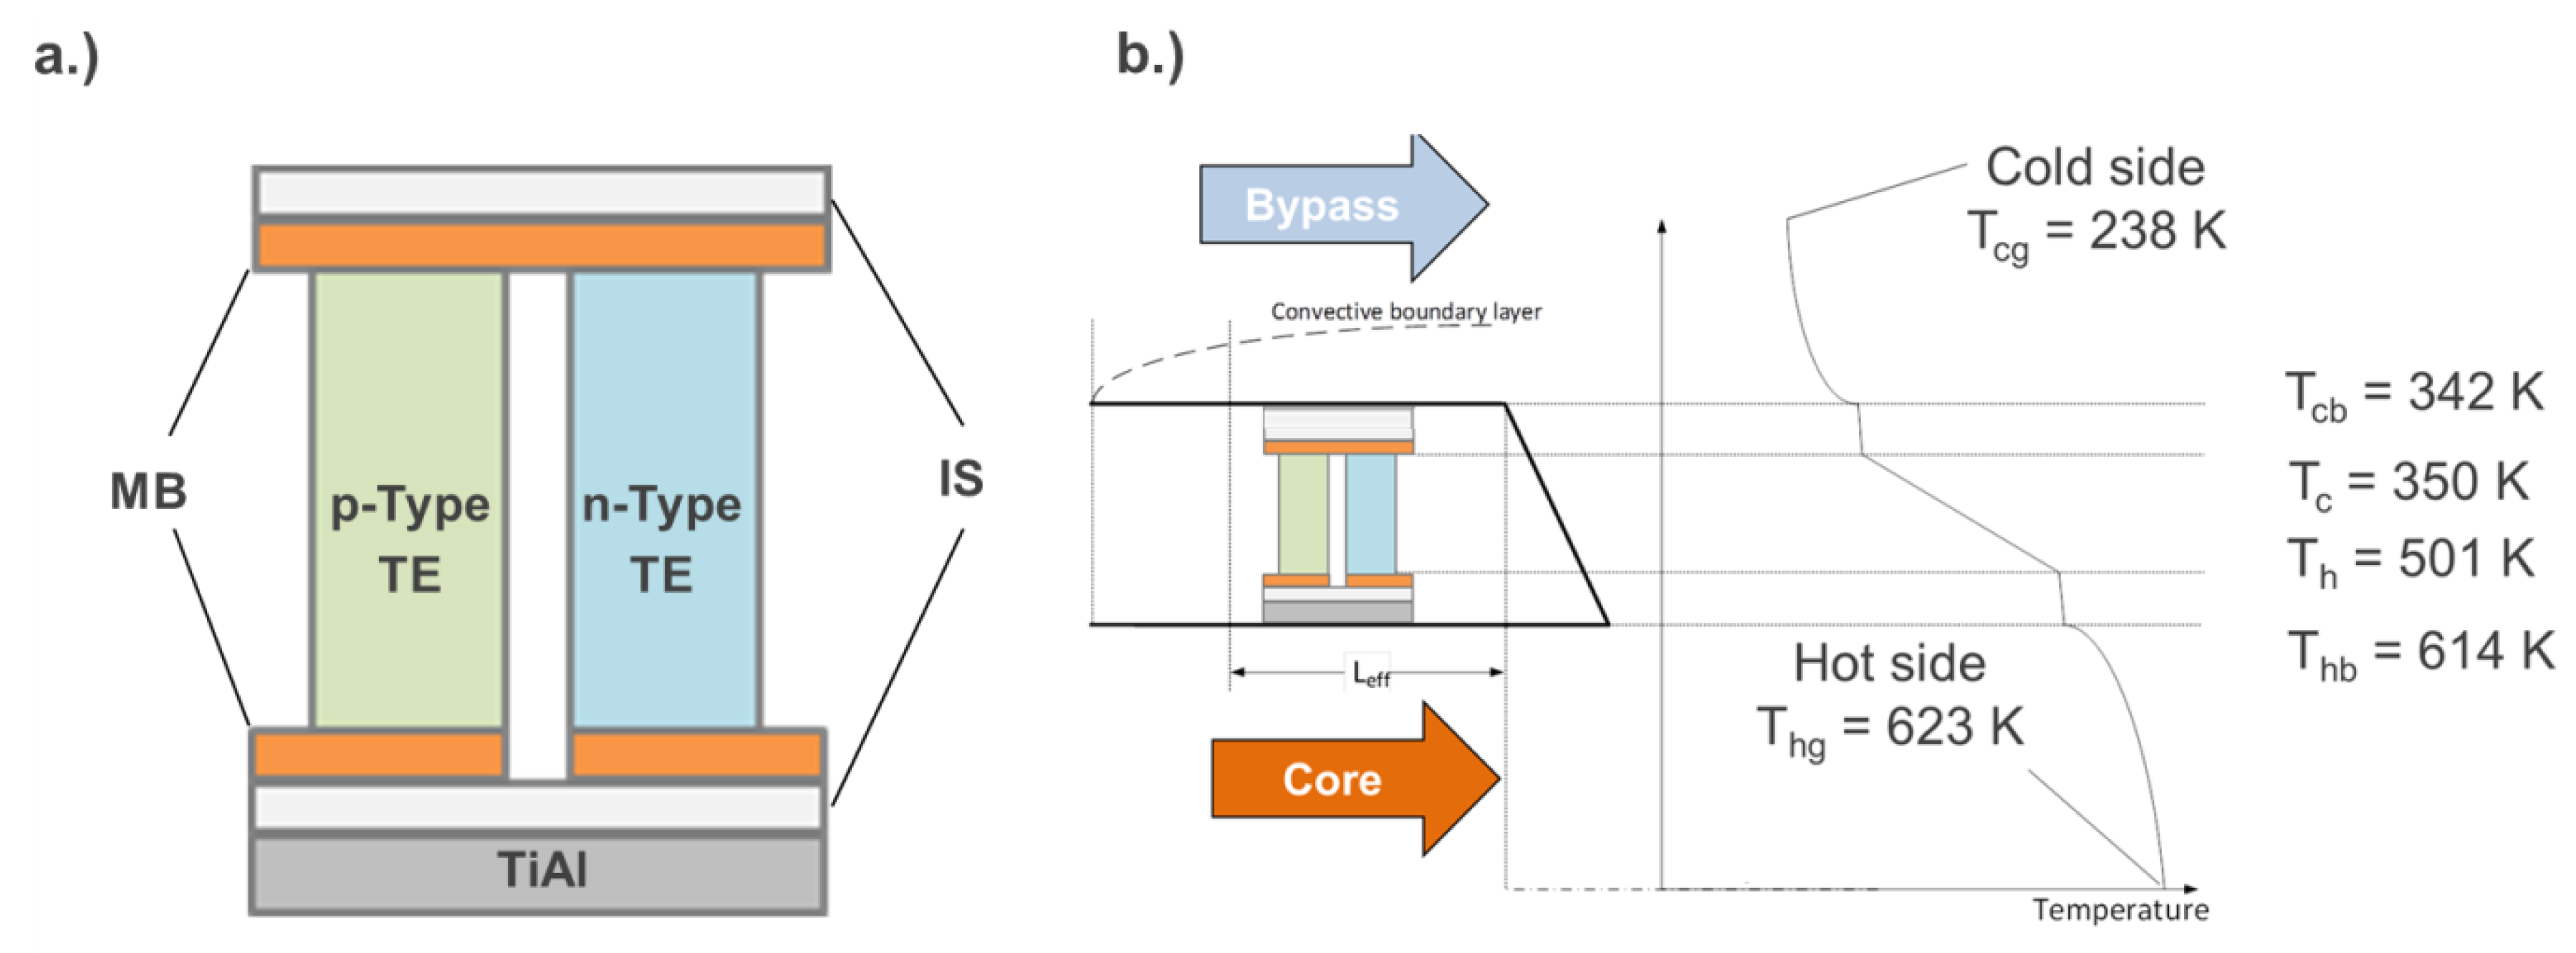
The operational characteristics of the TEG are simulated for a uni-couple configuration (
Figure 2) under consideration of all relevant effects, like Joule heating and the Peltier, Seebeck, and Thomson effects. The nozzle of the aircraft is modelled by a layer on one outer side of the 3D configuration. Due to weight minimization, the nozzle is supposed to be made from TiAl with a temperature dependent thermal conductivity between 20–30 Wm
−1K
−1 [
34]. The thickness of the TiAl is chosen to be 2 mm in accordance to the original design of the nozzle body. Flat surfaces are assumed for external heat exchange with the air flows. Due to the major sensitivity of the propulsive efficiency on the flow condition at the cold bypass boundary layer [
23], the modification of the hot nozzle surface only seems beneficial for any optimization of the convective heat transport. In order to minimize the temperature drop at the cold bypass side, a direct incident flow on the insulation layer of the thermocouple is assumed here. Thus, the nozzle layer was modelled for the hot core stream only. For reduction of parasitic temperature drops a layer of AlN with a high thermal conductivity of 170 Wm
−1K
−1 [
35] is introduced to form an electrical insulation between the TE uni-couple and the metallic nozzle. When considering the dielectric strength of AlN of 20 kVmm
−1 [
36], a minimum thickness of 325 µm is set for this layer on both sides with regard to weight optimization and concurrent electric insulation effect in the presence of high DC voltages generated by the entire TEG at the nozzle. Metallic Cu bridges with a thickness of 200 µm form the electrical interconnects between the TE elements. Square-shaped cross section with a foot print of 1 × 1 mm
2 for each TE leg are assumed. The spacing between the legs is set to 1 mm. The filling factor is varied by the modification of the nozzle and insulation layer surface per TE thermocouple that exchanges heat with the air flows. The length of the legs is adjusted to obtain a match of the thermal resistance of the TE thermocouple to the outside resistances within the heat transfer path. An aerogel filling in the gaps between the legs is assumed as thermal insulation material with a reasonable assumption for its thermal conductivity of 0.03 Wm
−1K
−1 [
37,
38], in order to minimize parasitic heat bypass. Neither radiative nor convective heat transport within the aerogel-filling was considered.
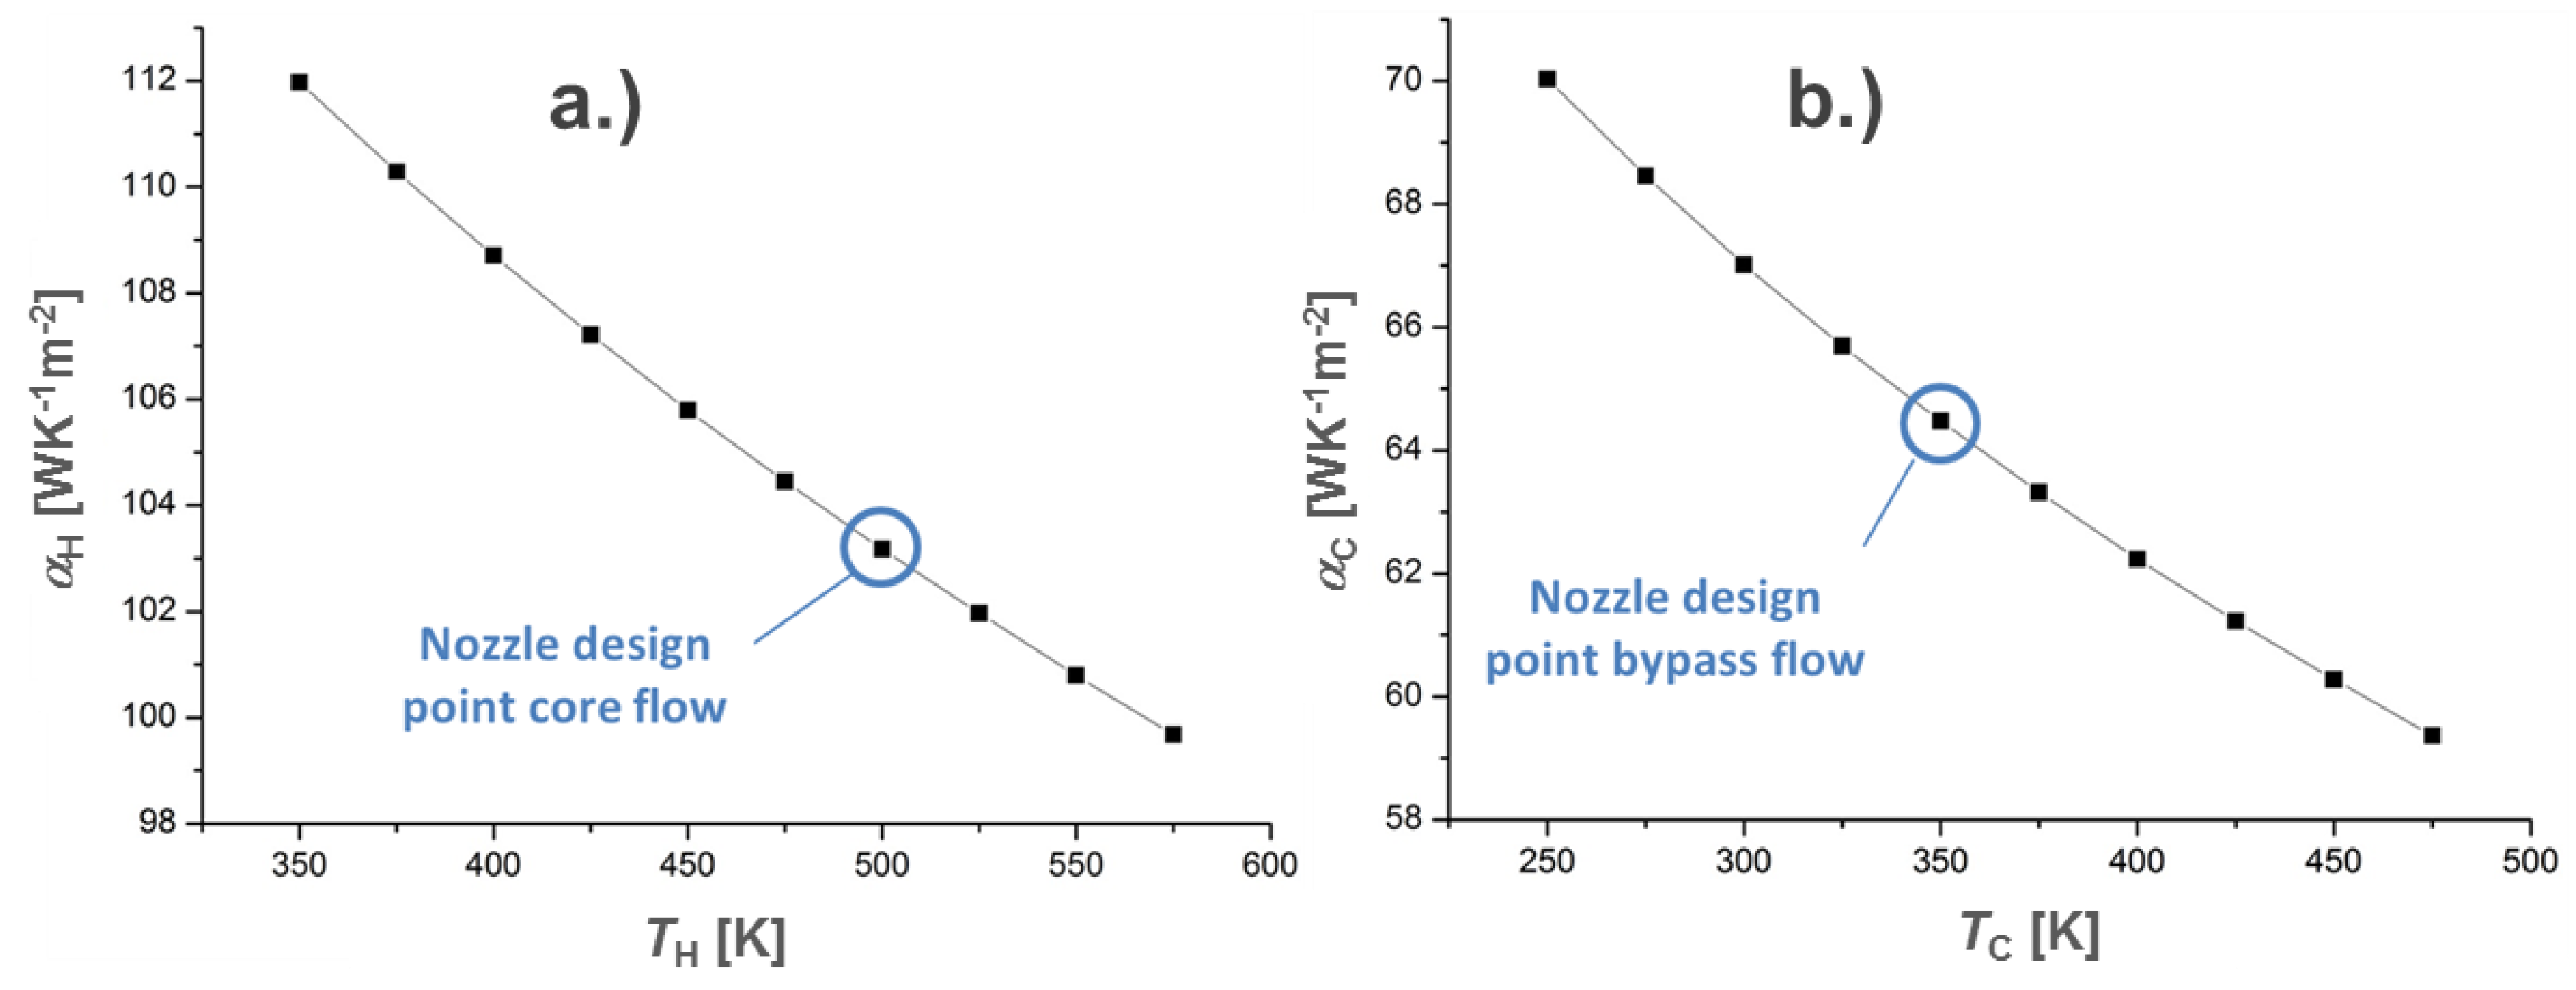
According to the CFD simulation, the gas temperatures of the core and the bypass flow are
Thg = 623 K and
Tcg = 238 K, respectively, during cruise conditions. The simulations revealed considerably low heat transfer coefficients (HTC) of the convective heat exchange between the air flows and the nozzle and insulation surfaces (
Figure 3), respectively. Convective heat transfer is considered at the particular surfaces by the appropriate settings of the calculated HTC and the respective gas temperatures from CFD simulations (derived from [
25]) within the thermocouple model.
For the determination of the electrical power output one terminal is kept at 0V potential, while an electrical DC current, I, through the couple is varied from zero up to the short circuit value. The according terminal voltage, V, is used for the calculation of the output power, Pel = V∙I. The resulting curve of Pel(I) is well approximated by a parabolic fit, the maximum of which gives the maximum electrical power output. No contact resistances have been considered within the model. The efficiency of the uni-couple is calculated from the ratio of maximum power output by the incident heat flow at the given operation point of the electrical current.
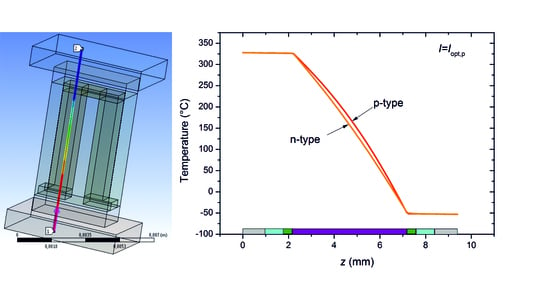
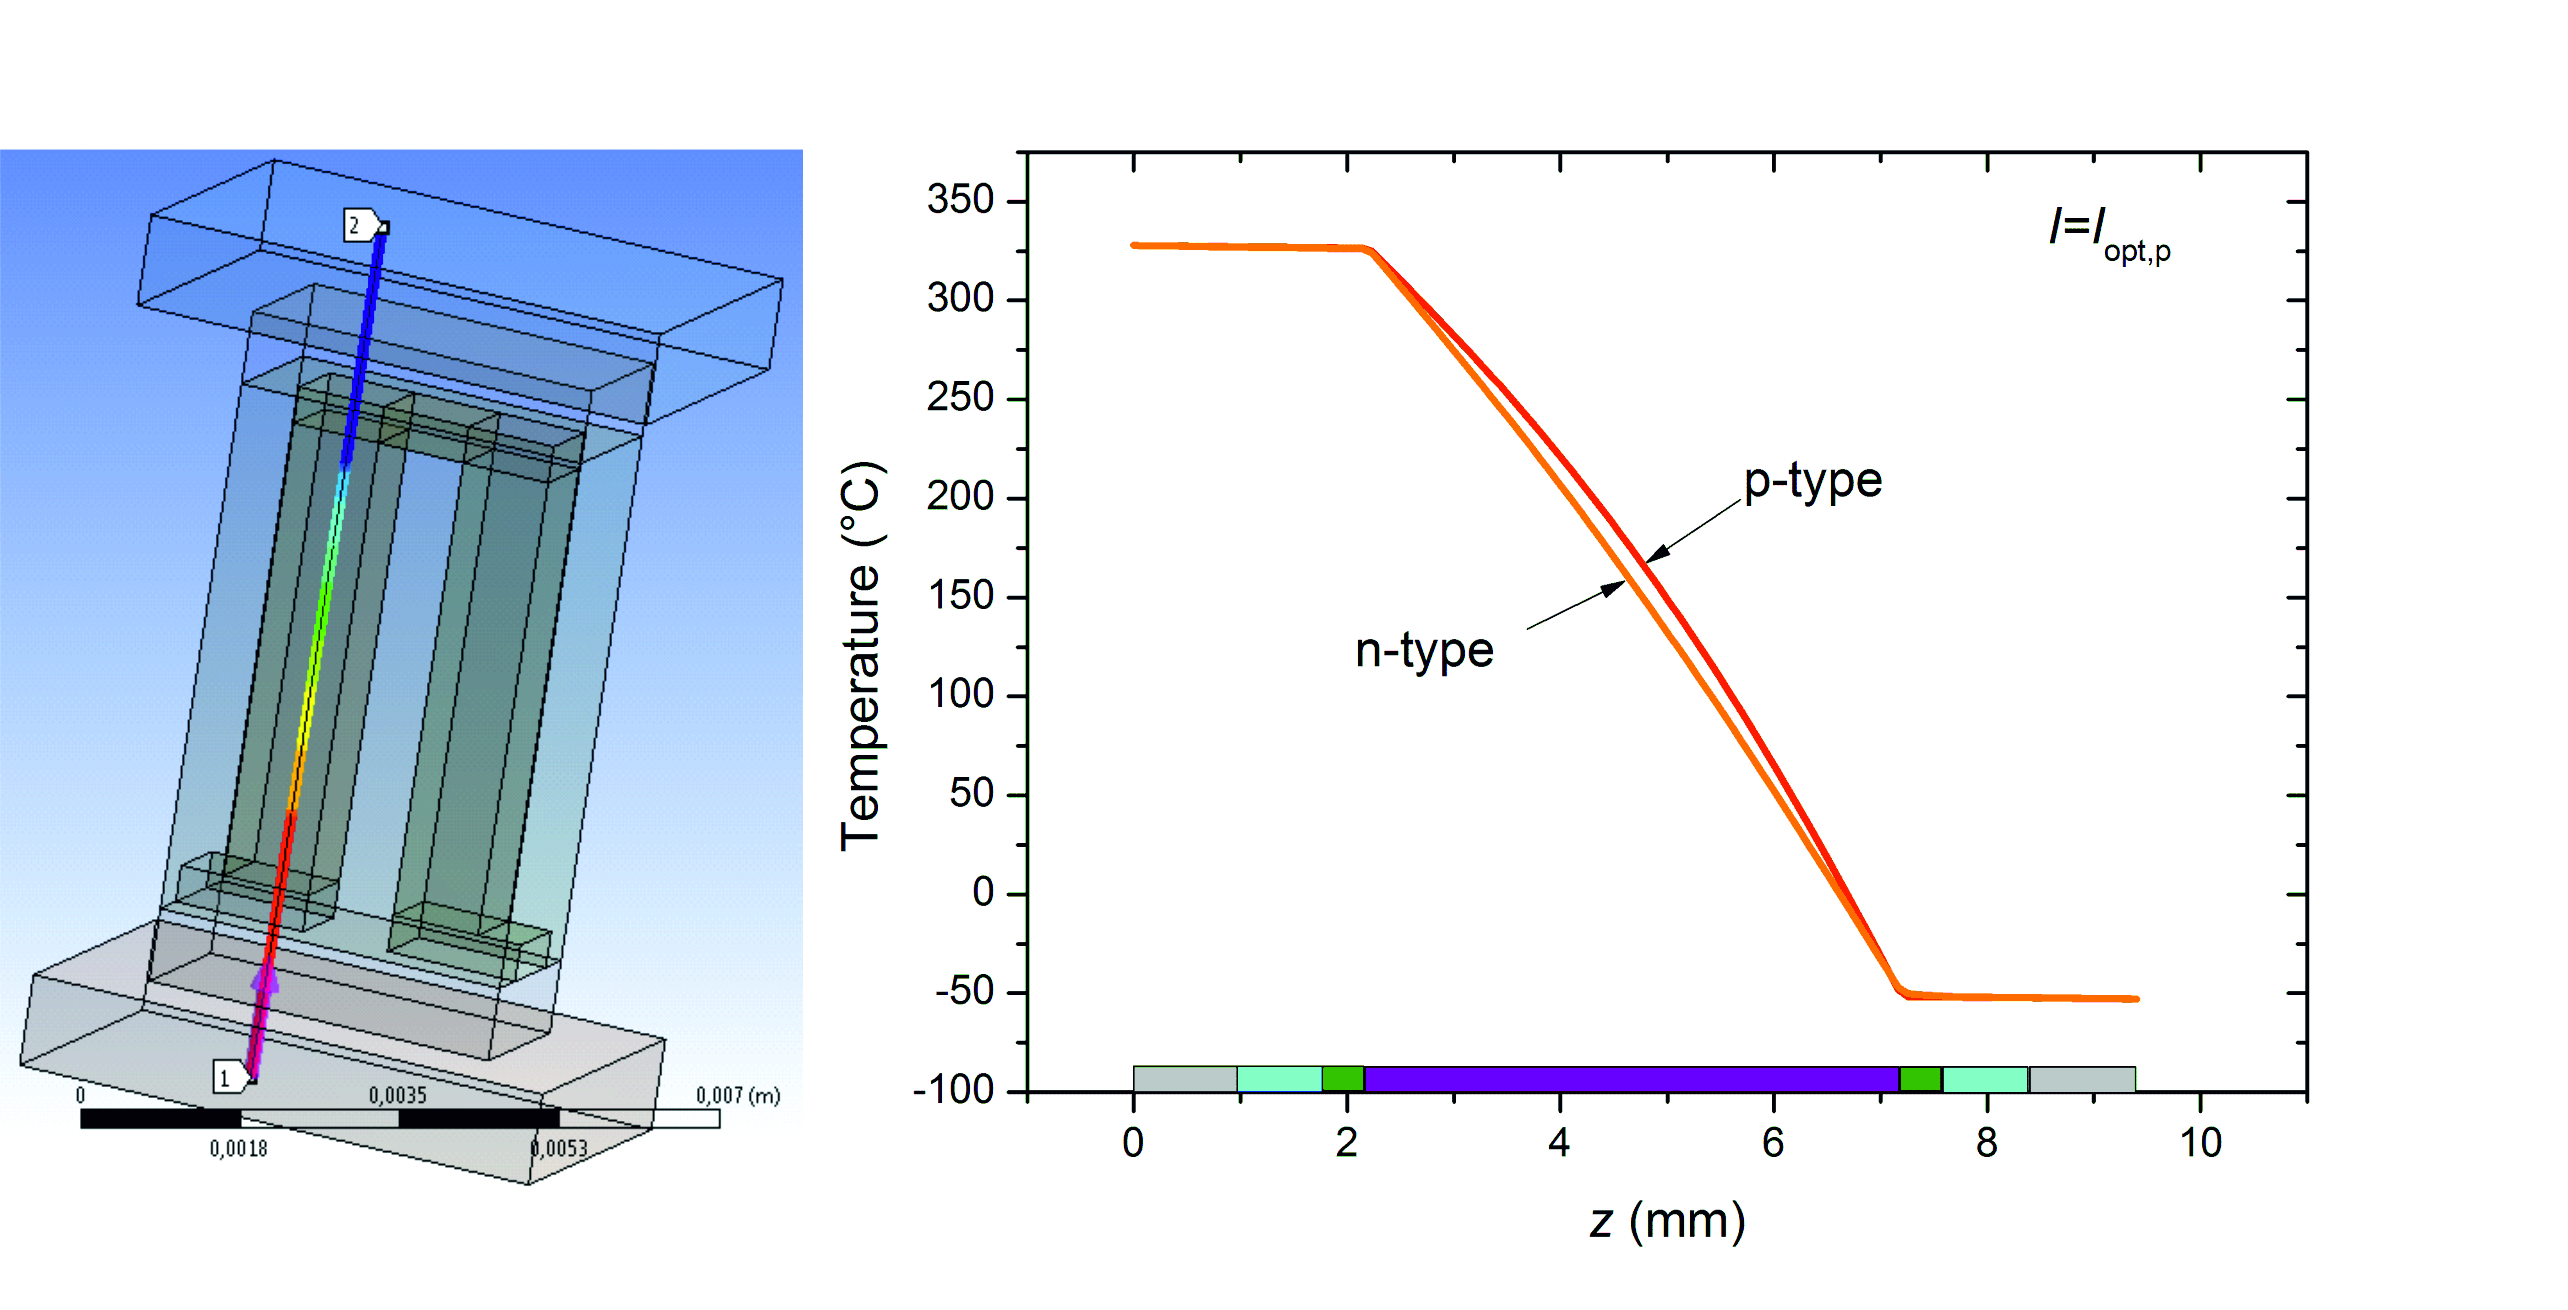
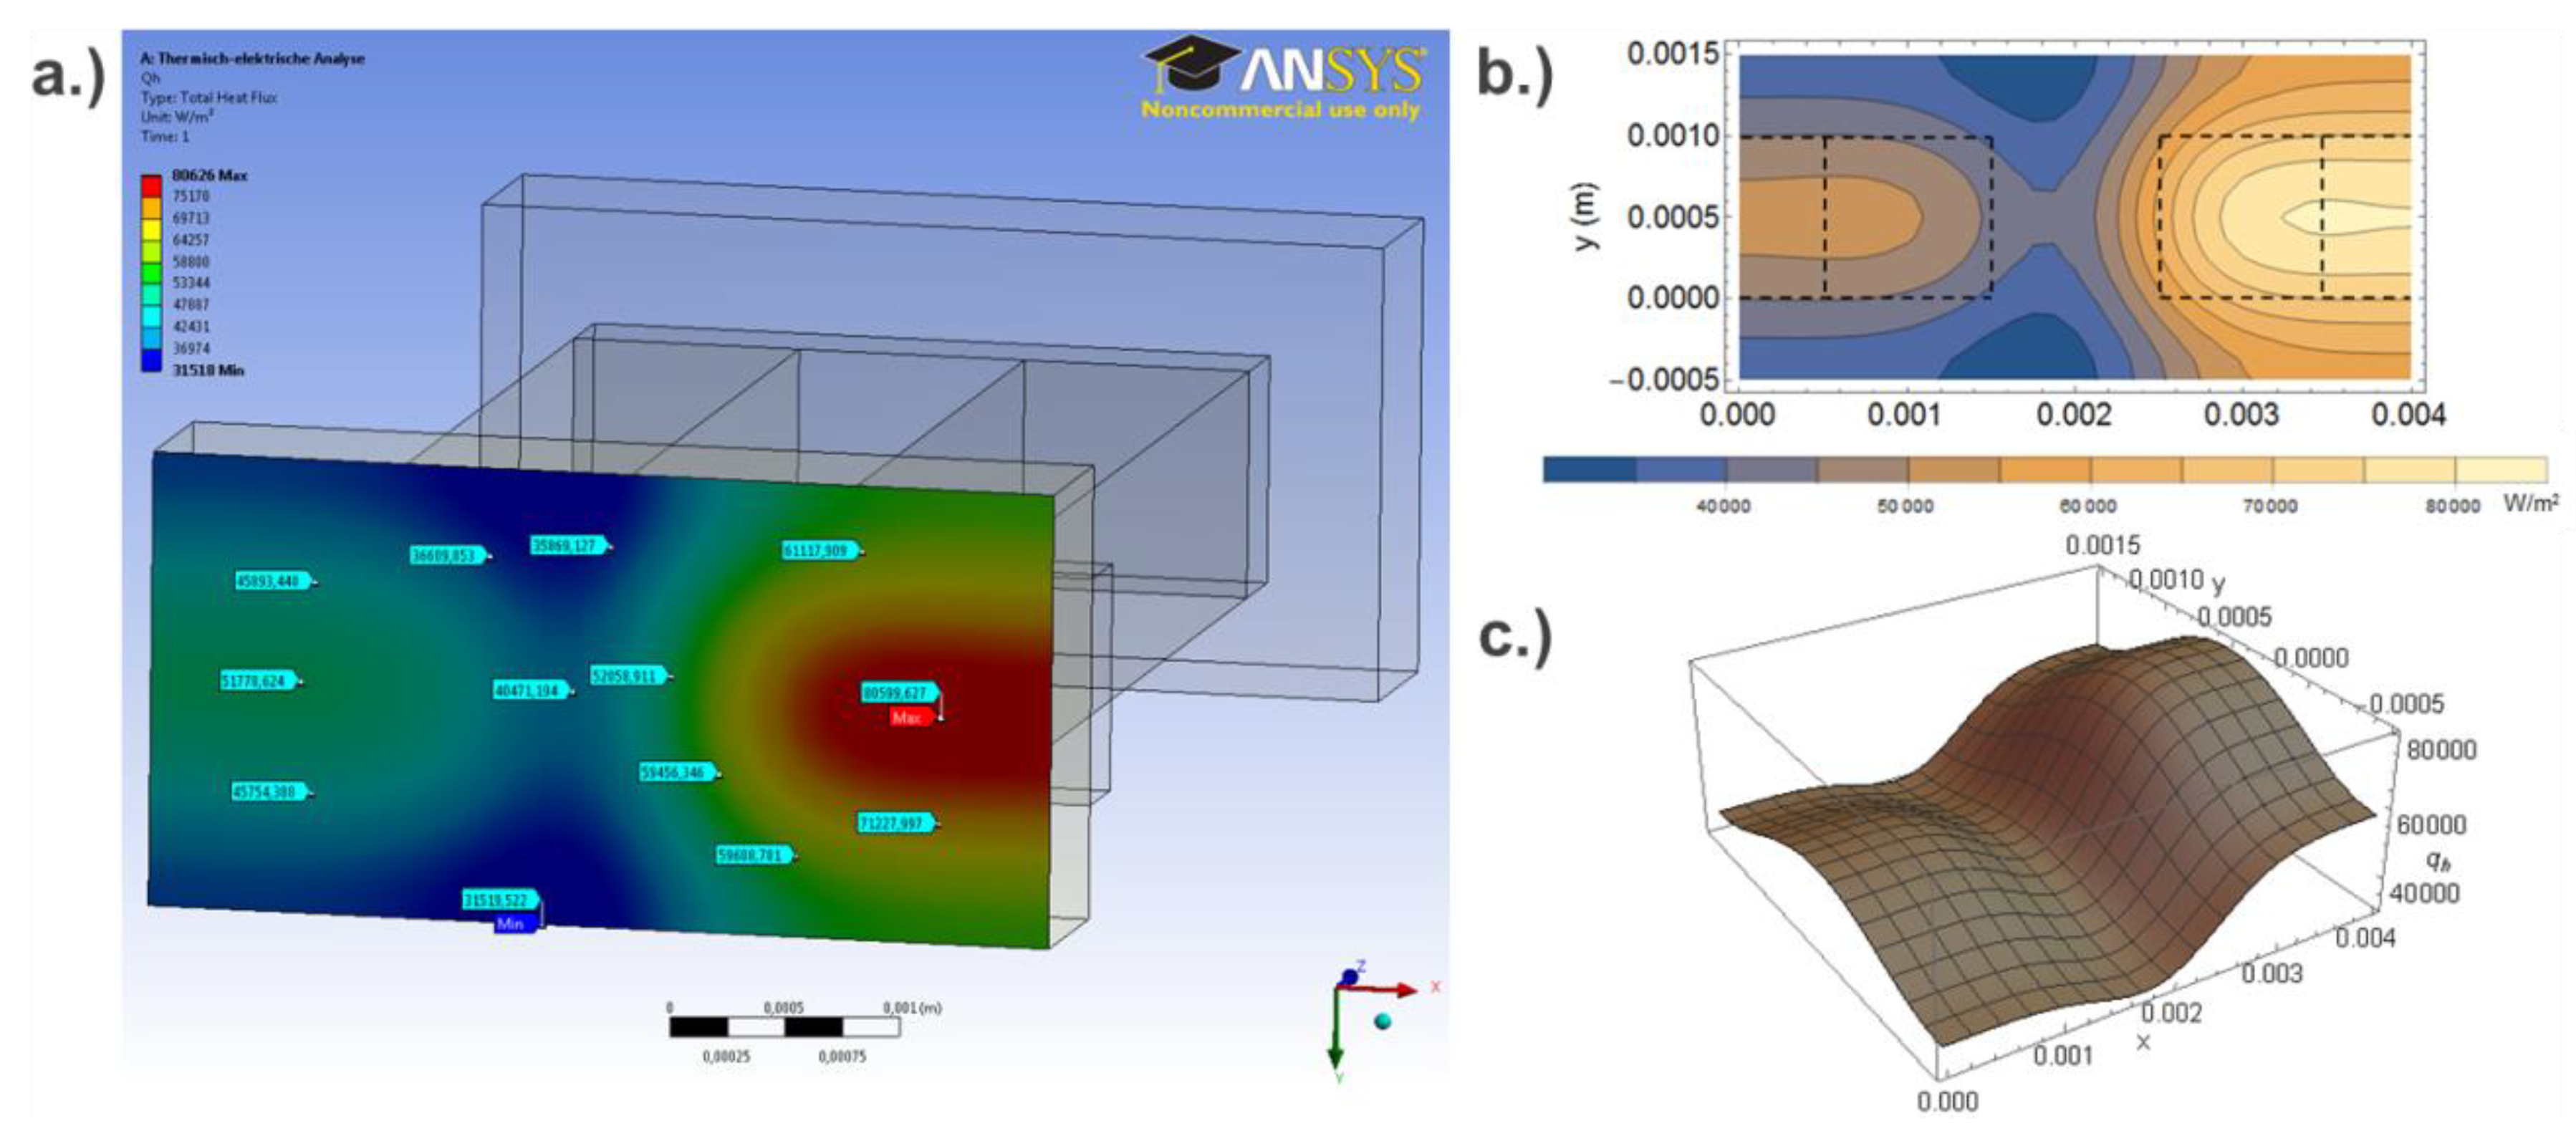
The heat flow on the hot and cold side of the uni-couple configuration reveals a spatial distribution due to different thermal conductivities of the p- and n-type material and the heat spread in the contact bridges and the heat exchanger plates (
Figure 4). Discrete data on the heat flux (normal component of the heat flux vector) is taken at every node of the surface for areal interpolation and subsequent approximation by a continuous area function. The incident heat flow is finally determined by the integration of this function over the entire top surface of the hot side.
With regard to the system level requirements on the gravimetric power density, further assumptions on the mass density of the different components are made (
Table 1). When considering light-weight silicide TE materials and contributions from the other components of the simulated configuration, the mass of the thermocouple is calculated, which equals, for instance, 187 mg for the design case with
F = 25% at its optimal TE leg length of 21.2 mm (
Table 1). Additional weight would be introduced by mounting hardware, cabling, power processing units, and possibly batteries, which was not considered in this study.
For every studied parametric case, the thermal resistance of the thermocouple is matched with the sum of the effective heat resistances by convection plus the minor contributions of the TiAl and AlN layers by variation of the TE leg length in the range between 1 mm and 25 mm. A matching of thermal resistances is necessary for the maximization of electrical power output, since the product of the temperature difference across the TE materials and incident heat flow to the configuration is maximized under these conditions [
30]. First, calculations are conducted for a filling factor of
F = 25% using the HPVM (case 1 in
Table 2). The variation of the power output with TE material performance is studied by increasing the power factor of the HPVM in three steps by 10%, each yielding a
ZTmax of 1.56 and 1.95 for the p- and n-type material, respectively, at the last step (case 2). This is clearly a free parameter variation without any specific optimization strategies for materials performance behind. Anyway, the best known laboratory values for advanced TE materials to date already exceed these assumed
ZT values [
40,
41].
In order to optimize the gravimetric power density apart from an increase of the materials performance, further simulations are carried out on the base of the HPVM but with smaller filling factors
F (case 3), which yields a reduction of the thermal convective resistances on both sides of the thermocouple. Reduction of
F is accomplished within the model by increasing the area of TiAl and AlN surfaces per uni-couple on both sides of the air flows. Additionally, the effect of a presumed improvement of the convective heat transfer on the hot side is studied by choosing a higher HTC
αH as compared to the outcome of the CFD simulations within every simulated parameter configuration of the model. The increase of
αH reflects a hypothetic modification of the nozzle surface for an improved aerodynamic design, which was not optimized concerning its heat transfer in this study at all. However, room for further improvement on the heat exchange at the hot side is indicated by a certain insensitivity of the propulsive efficiency of the engine to the fluidic conditions at the core stream boundary layer [
25]. The situation is significantly different at the cold bypass flow and it seems to give apparently much less space for heat exchange optimization. In order to maintain the detected positive effect on the propulsive efficiency from the acceleration of the bypass boundary layer, the HTC on the cold side is set to
αC = 64 WK
−1m
−2 for all discussed cases in this work. This value represents a flat surface design at the cold bypass flow, as it was assumed in the CFD calculations, which shall not impose a restriction for further optimization of heat exchange by e.g., vortex-generating or lamellar surface structures. Additional studies are needed to quantify the potential of an improved convective heat exchange at the bypass flow of the nozzle with minimal repercussions on the engine operation, but the conservation of positive effects on the propulsive efficiency due to the TEG. For the sake of completeness, further simulation results for a model with higher cold side HTC can be found in the supporting information in the appendix (
Figure A2). Summarizing,
Table 2 gives a survey on the cases and their respective parameter ranges, which will be discussed later on.
For the determination of the TEG performance, the thermocouples are supposed to be connected to TE modules (TEM) with a footprint of 50 × 50 mm
2. With the given cross section of 1 mm
2 of each TE leg the footprint of one thermocouple equals
ATC = 8 mm
2 (1 mm spacing between each leg), according to
F = 25%. With this filling factor, 312 thermocouples can be connected within one TEM, yielding a total area covered by the TE legs of
ATE = 624 mm
2 per TEM (
Table 3).
The coverage by TEM was extrapolated to the full nozzle surface (
Figure 5) by a linear scaling of extensive performance key figures, as calculated for the uni-couple configuration. The relation between operation parameters of a single leg, a uni-couple, TE module, and TEG, respectively, is given in
Table A1. According to the GasTurb engine design, a total surface
Anoz ≅ 1.1 m
2 is available for the TEG installation at the nozzle, which gives space for 442 TEM of 50 × 50 mm
2 per engine. A possible implementation encompasses a TEM alignment within 13 rings around the nozzle body, each with 34 modules. Simulations of the thermal conditions at the nozzle revealed a radial symmetric temperature distribution. However, a minor axial temperature variation along the nozzle, which is confirmed to be <11 K for cruise conditions, was not considered for the simulations on the TEG design and the resulting power of the overall system at the nozzle.
3. Results
Due to the thermal resistance of the convective boundary layers at the core and bypass flow, only a fraction of the gas temperature difference can be used at the TE material, which limits the maximum power output and efficiency of the thermocouples. In presence of external thermal resistances the temperature difference at the TE material is a function of the leg length. For small leg lengths, the reduced thermal resistance of the TE leg yields a high incident heat flow but low temperature difference across the legs. Consequently, the power output and the efficiency also become low. Though high leg lengths provide an increase of the temperature difference, the increasing thermal resistance of the thermocouple lowers the incident heat flow, which yields a reduction of the power output above a certain leg length, likewise. Hence, as explained above, maximum output power is achieved for an optimal intermediate leg length based on matching leg and parasitic thermal resistances [
30].
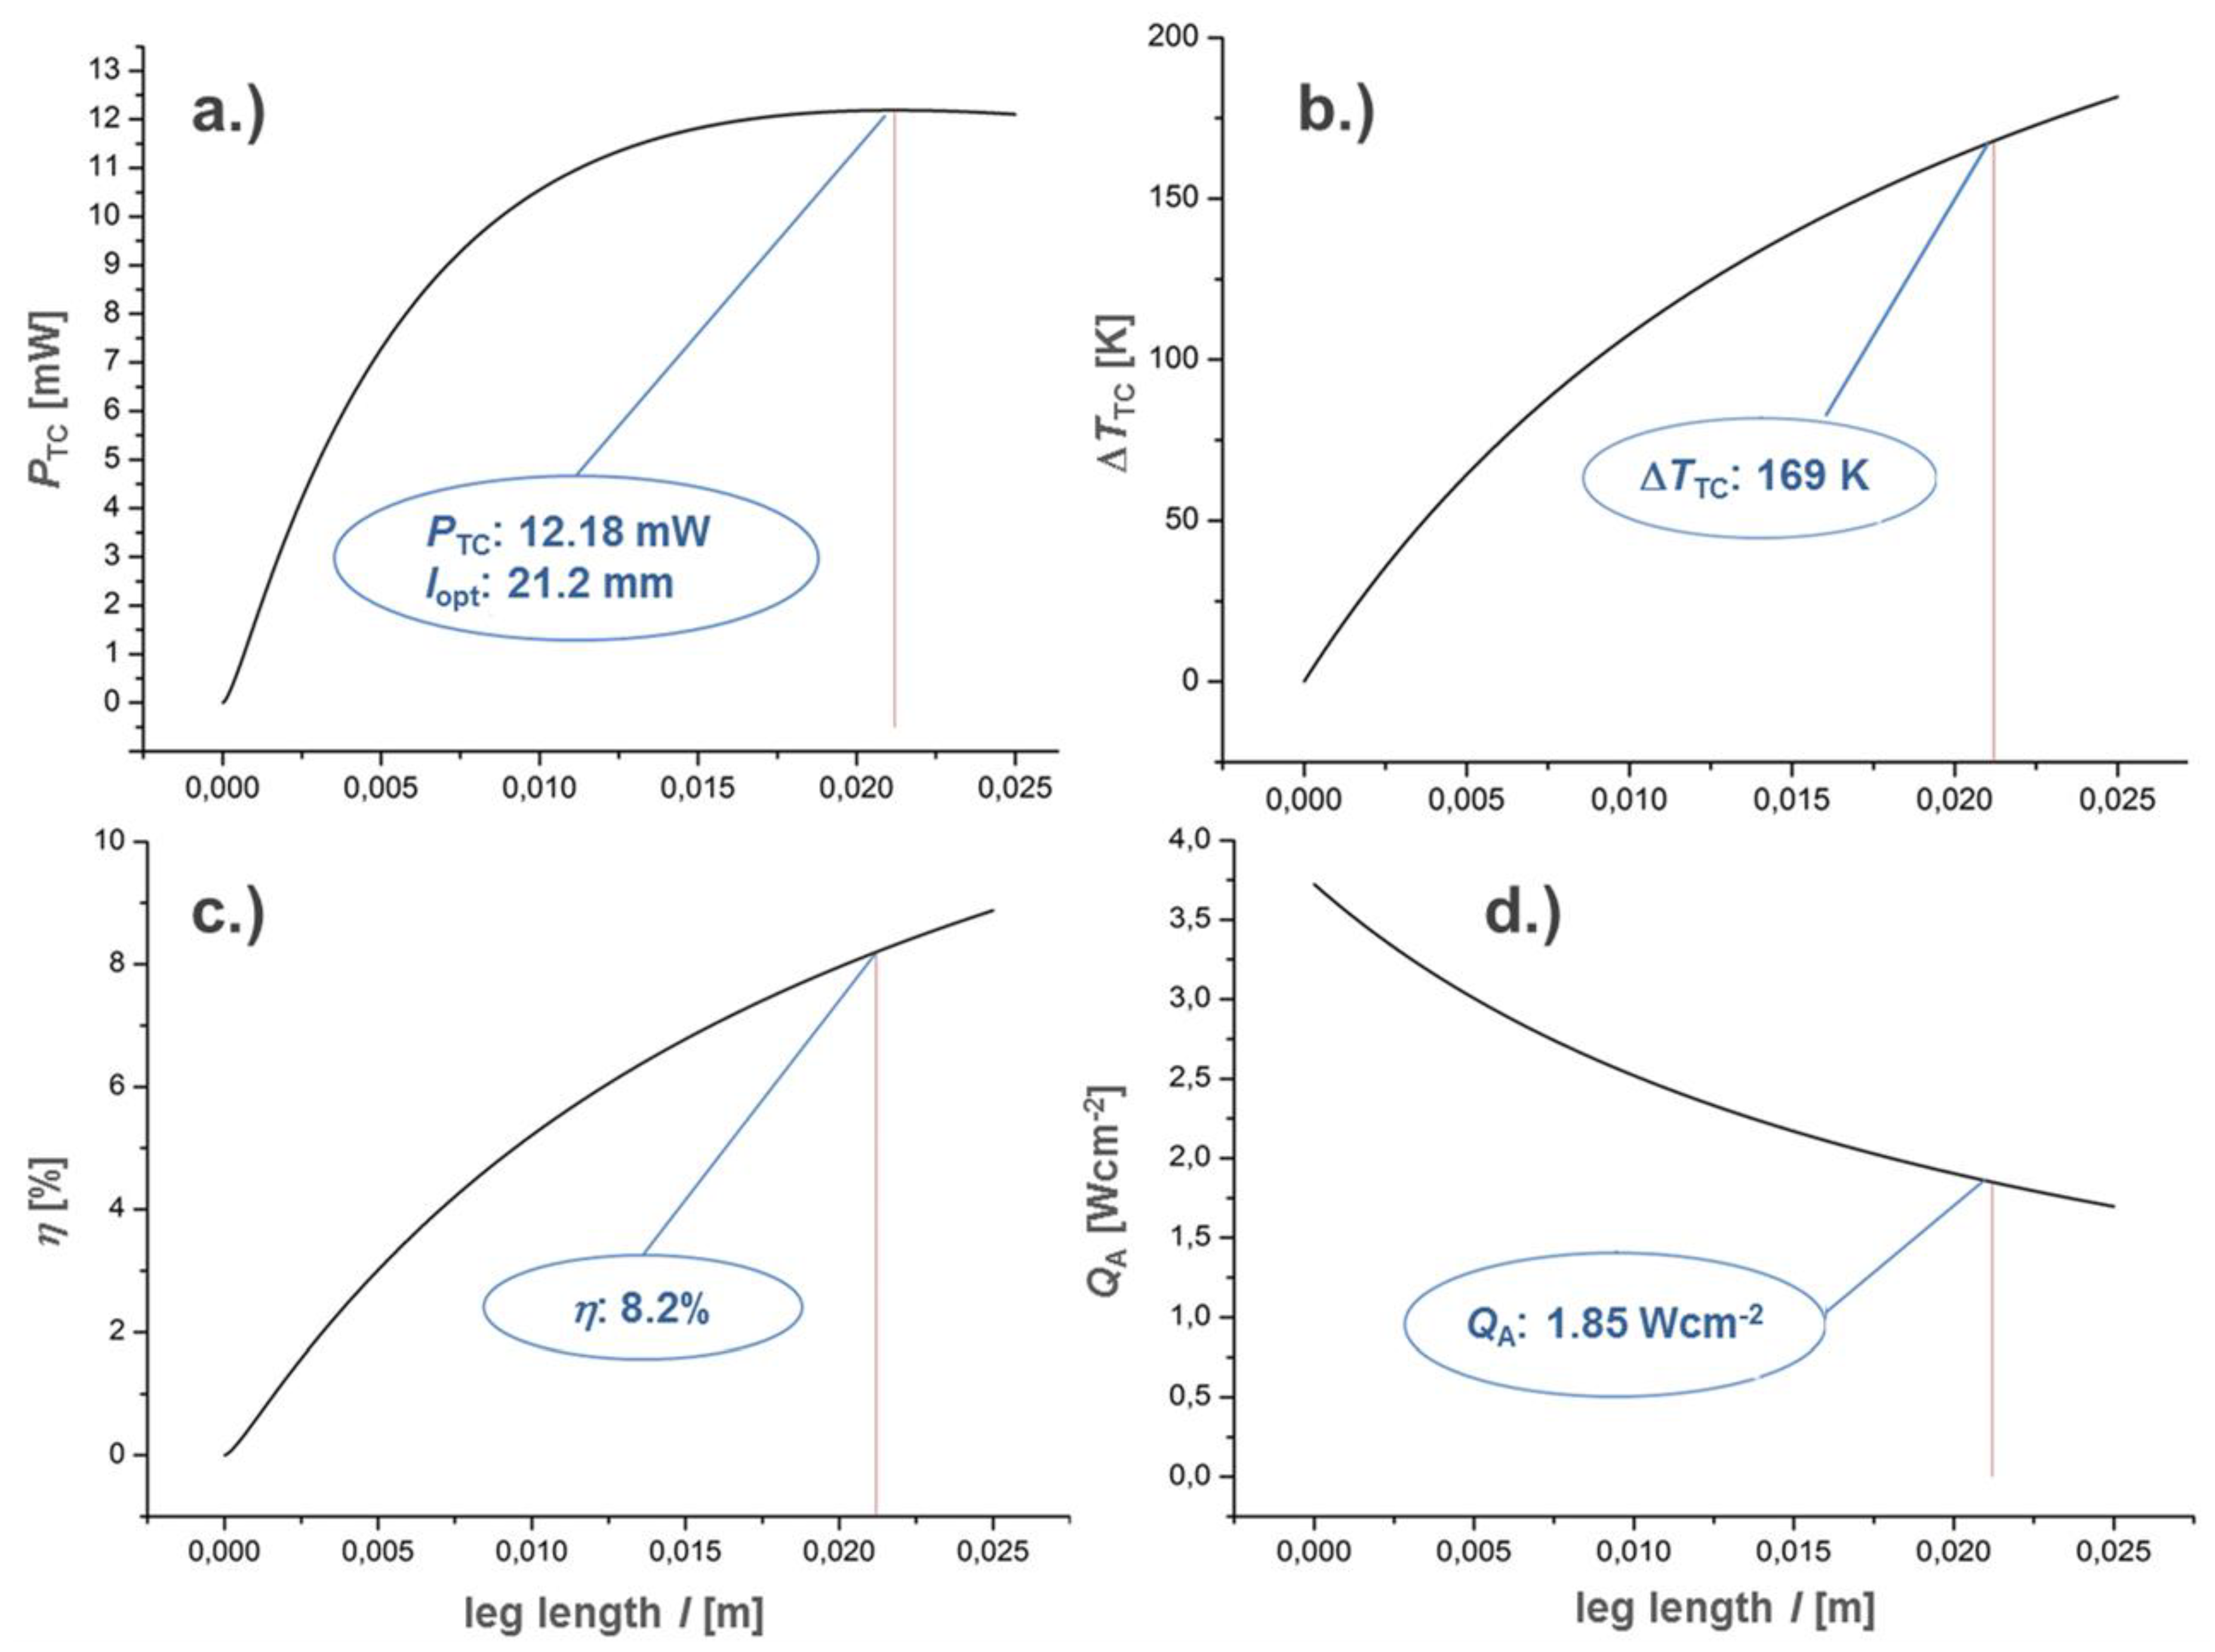
For the set HTC at both boundary layers (
αH = 100 WK
−1m
−2/
αC = 64 WK
−1m
−2), the optimal leg length for maximised power output equals
lopt = 21.2 mm at
F = 25% (
Figure 6). Each thermocouple contributes 12.18 mW to the total power output of the TEM working at a temperature difference of 169 K across the TE legs. When considering the resulting heat flux, the efficiency equals
η = 8.2%, which is a result of the optimized HPVM with its fitted temperature characteristic of transport properties with regard to the application temperature range. With the assumptions made on geometries and chosen material properties, the uni-couple exhibits the following operational characteristics at the nozzle (
Figure 6). Resulting values of the mass, power output, and the power density of the TE module and the entire TEG are summarized in
Table 4.
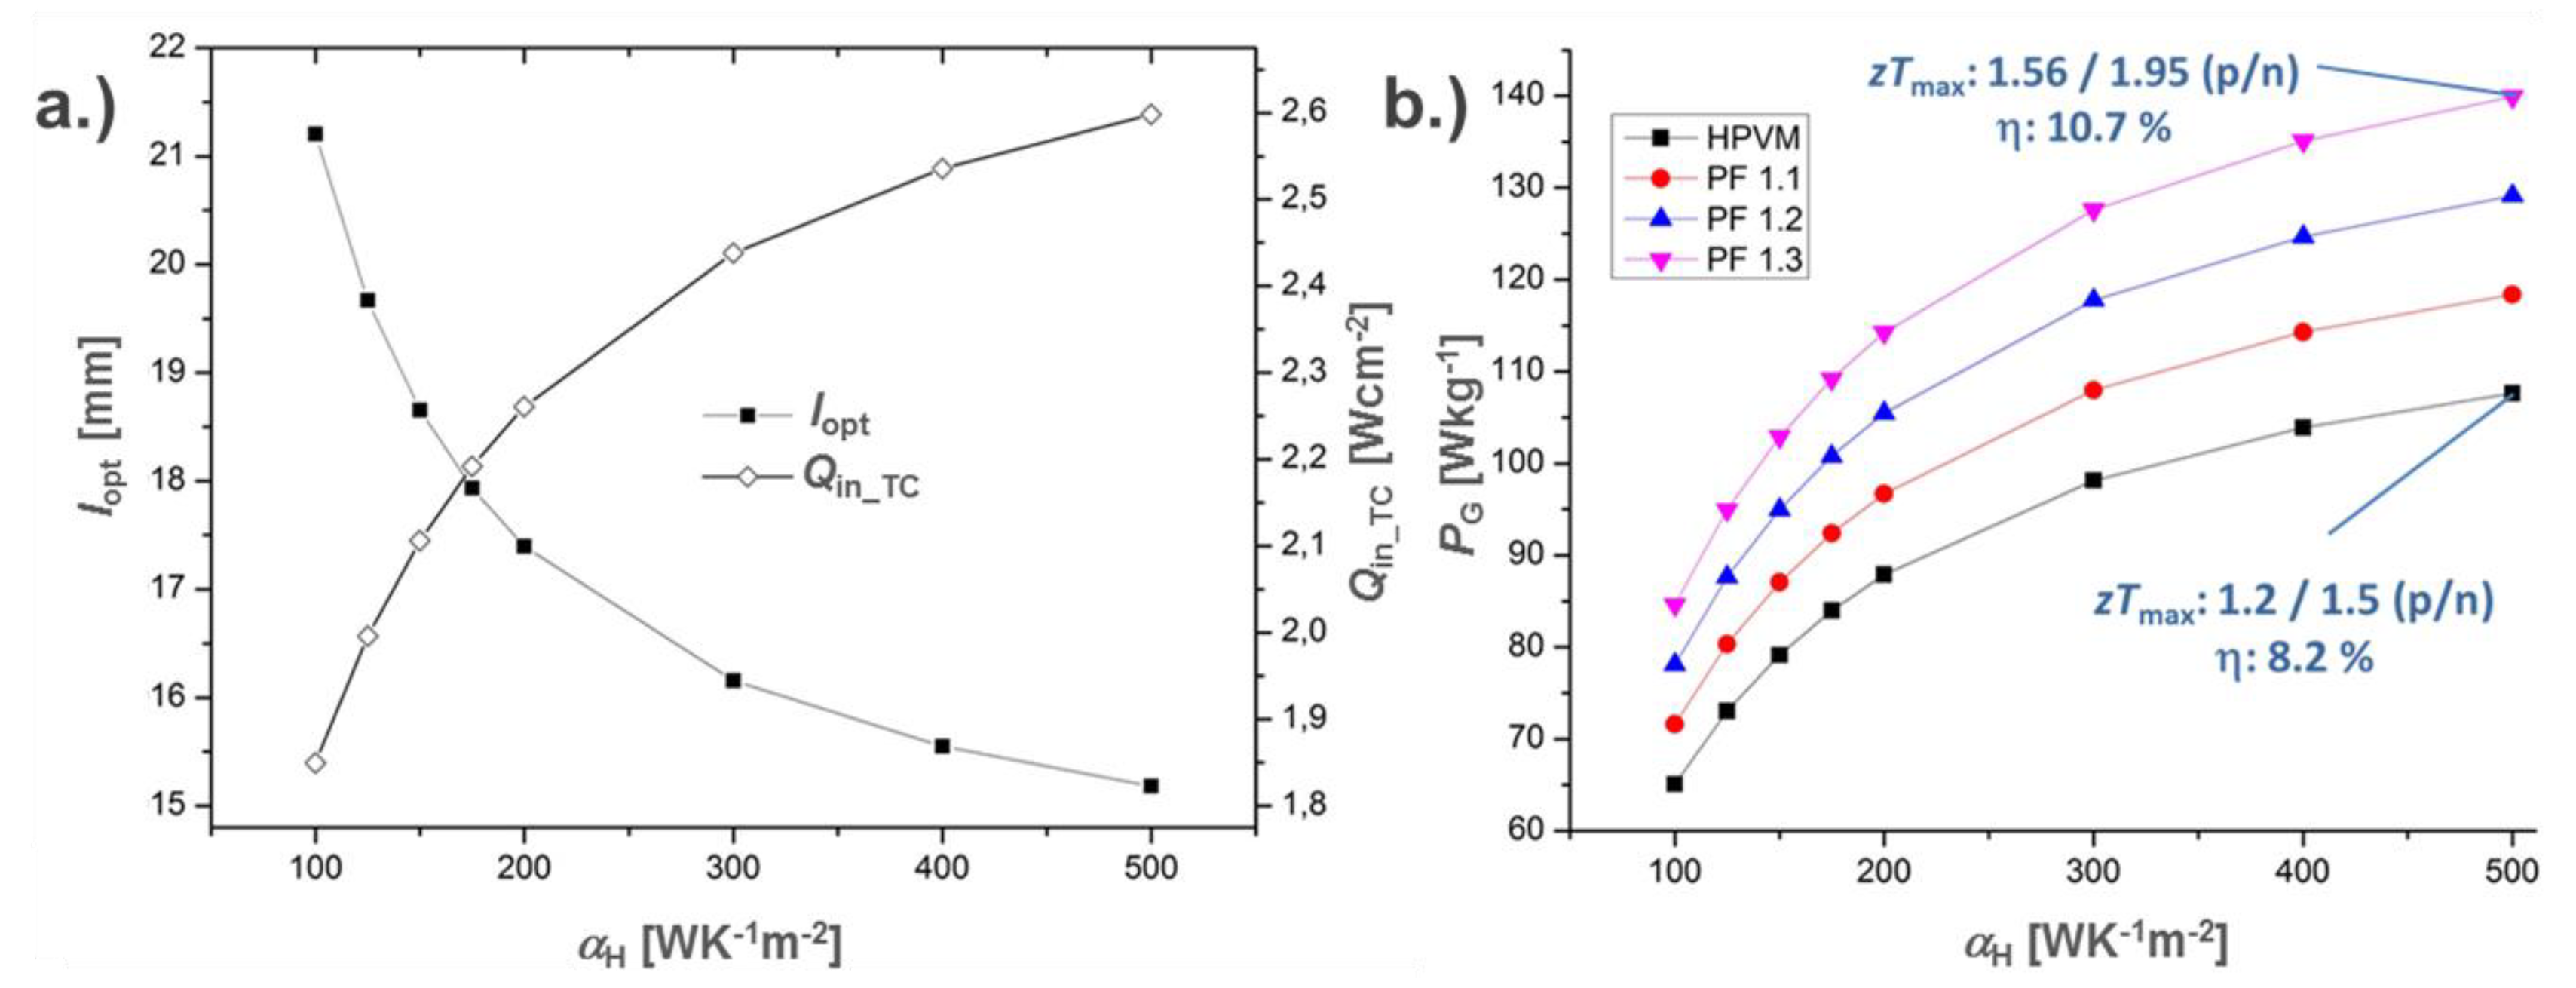
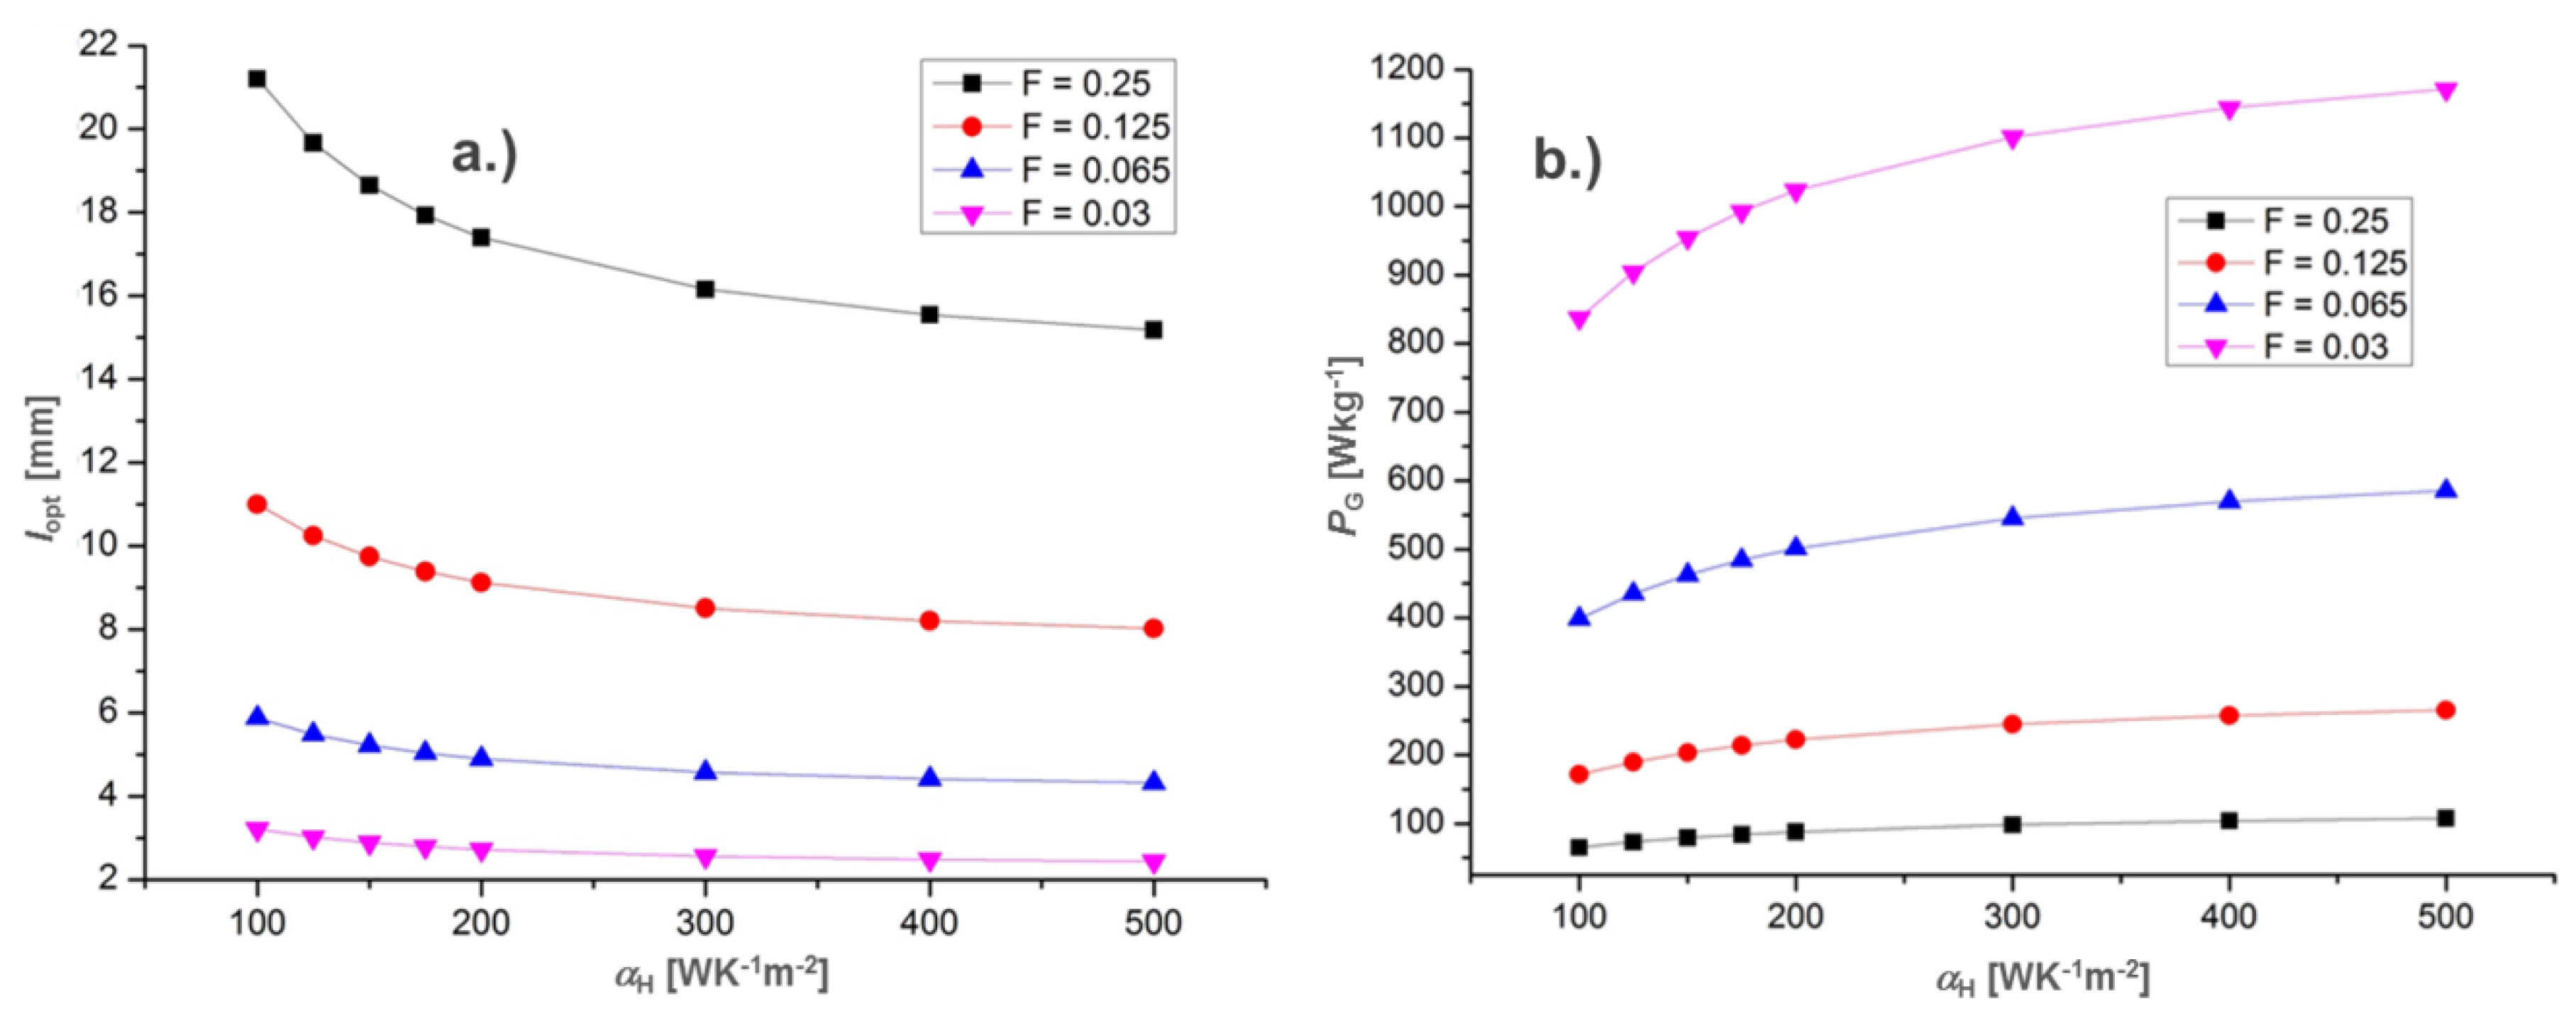
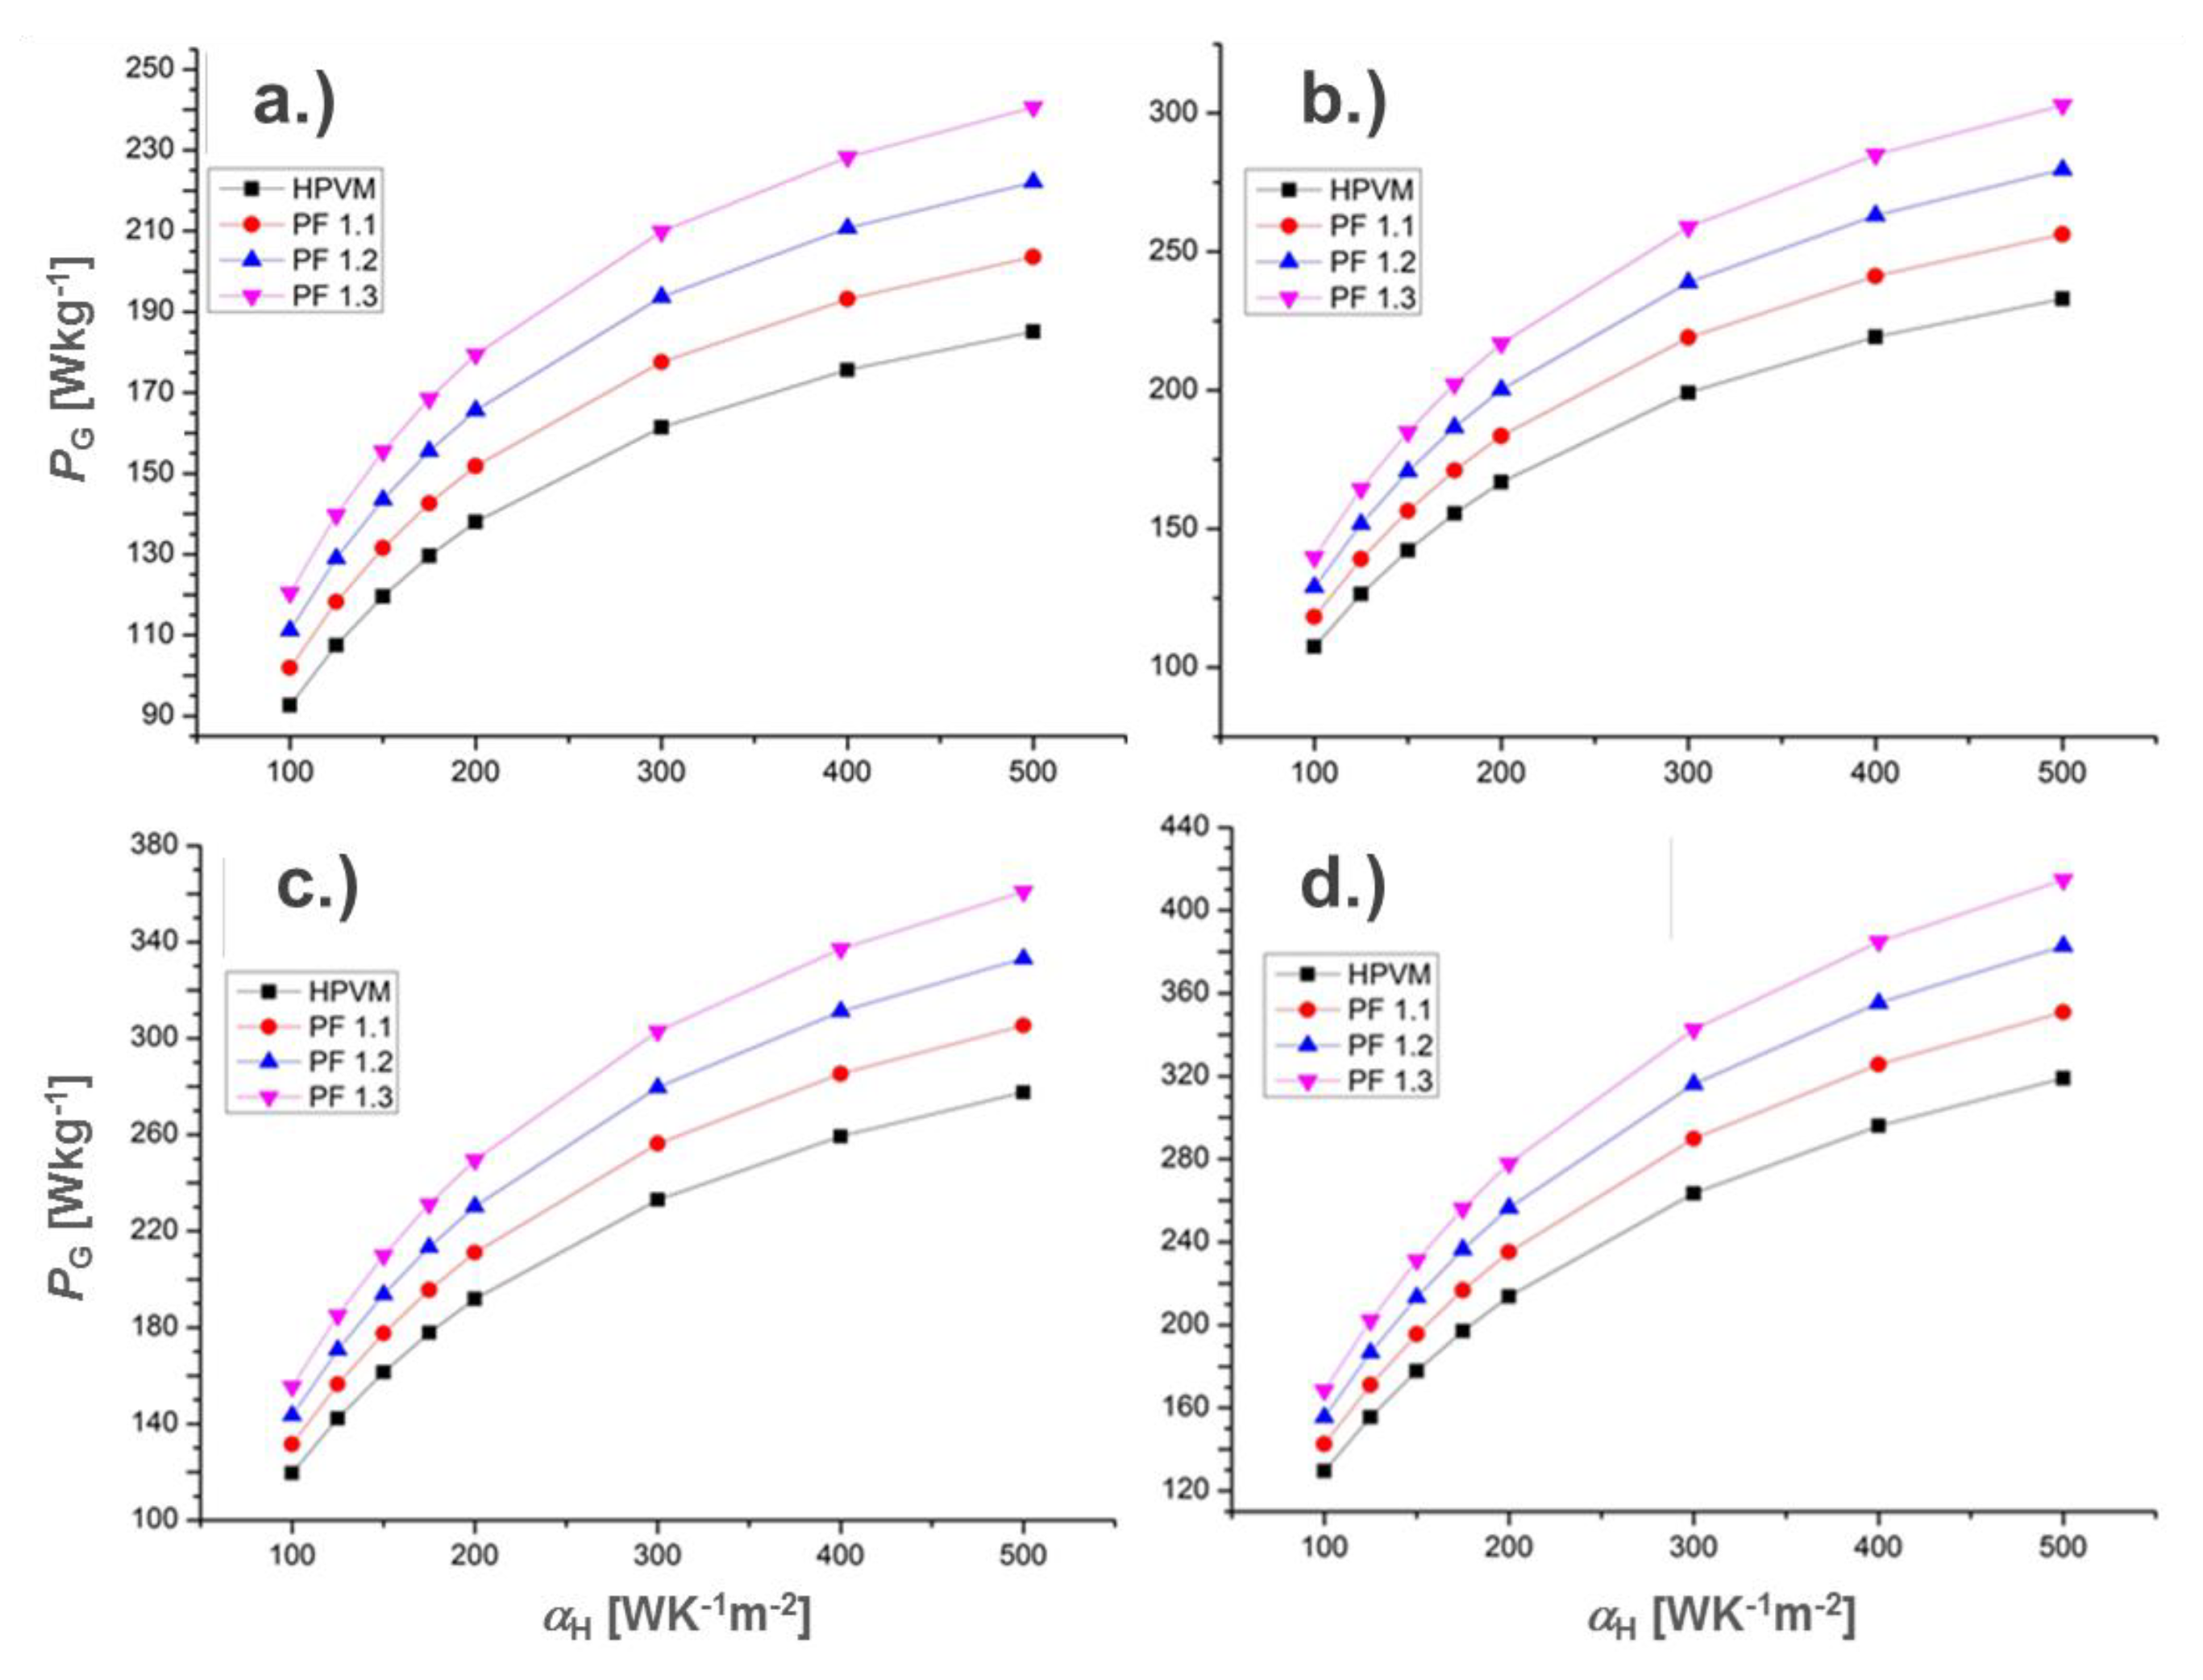
Increasing
αH from 100 WK
−1m
−2 to 500 WK
−1m
−2 at the hot side yields a reduction of the optimal leg length for thermal resistance match, and in turn leads to an increase of the incident heat flux (
Figure 7a). The lower mass translates into a higher gravimetric power density, which is likewise achievable by an assumed increase of the
PF (
Figure 7b).
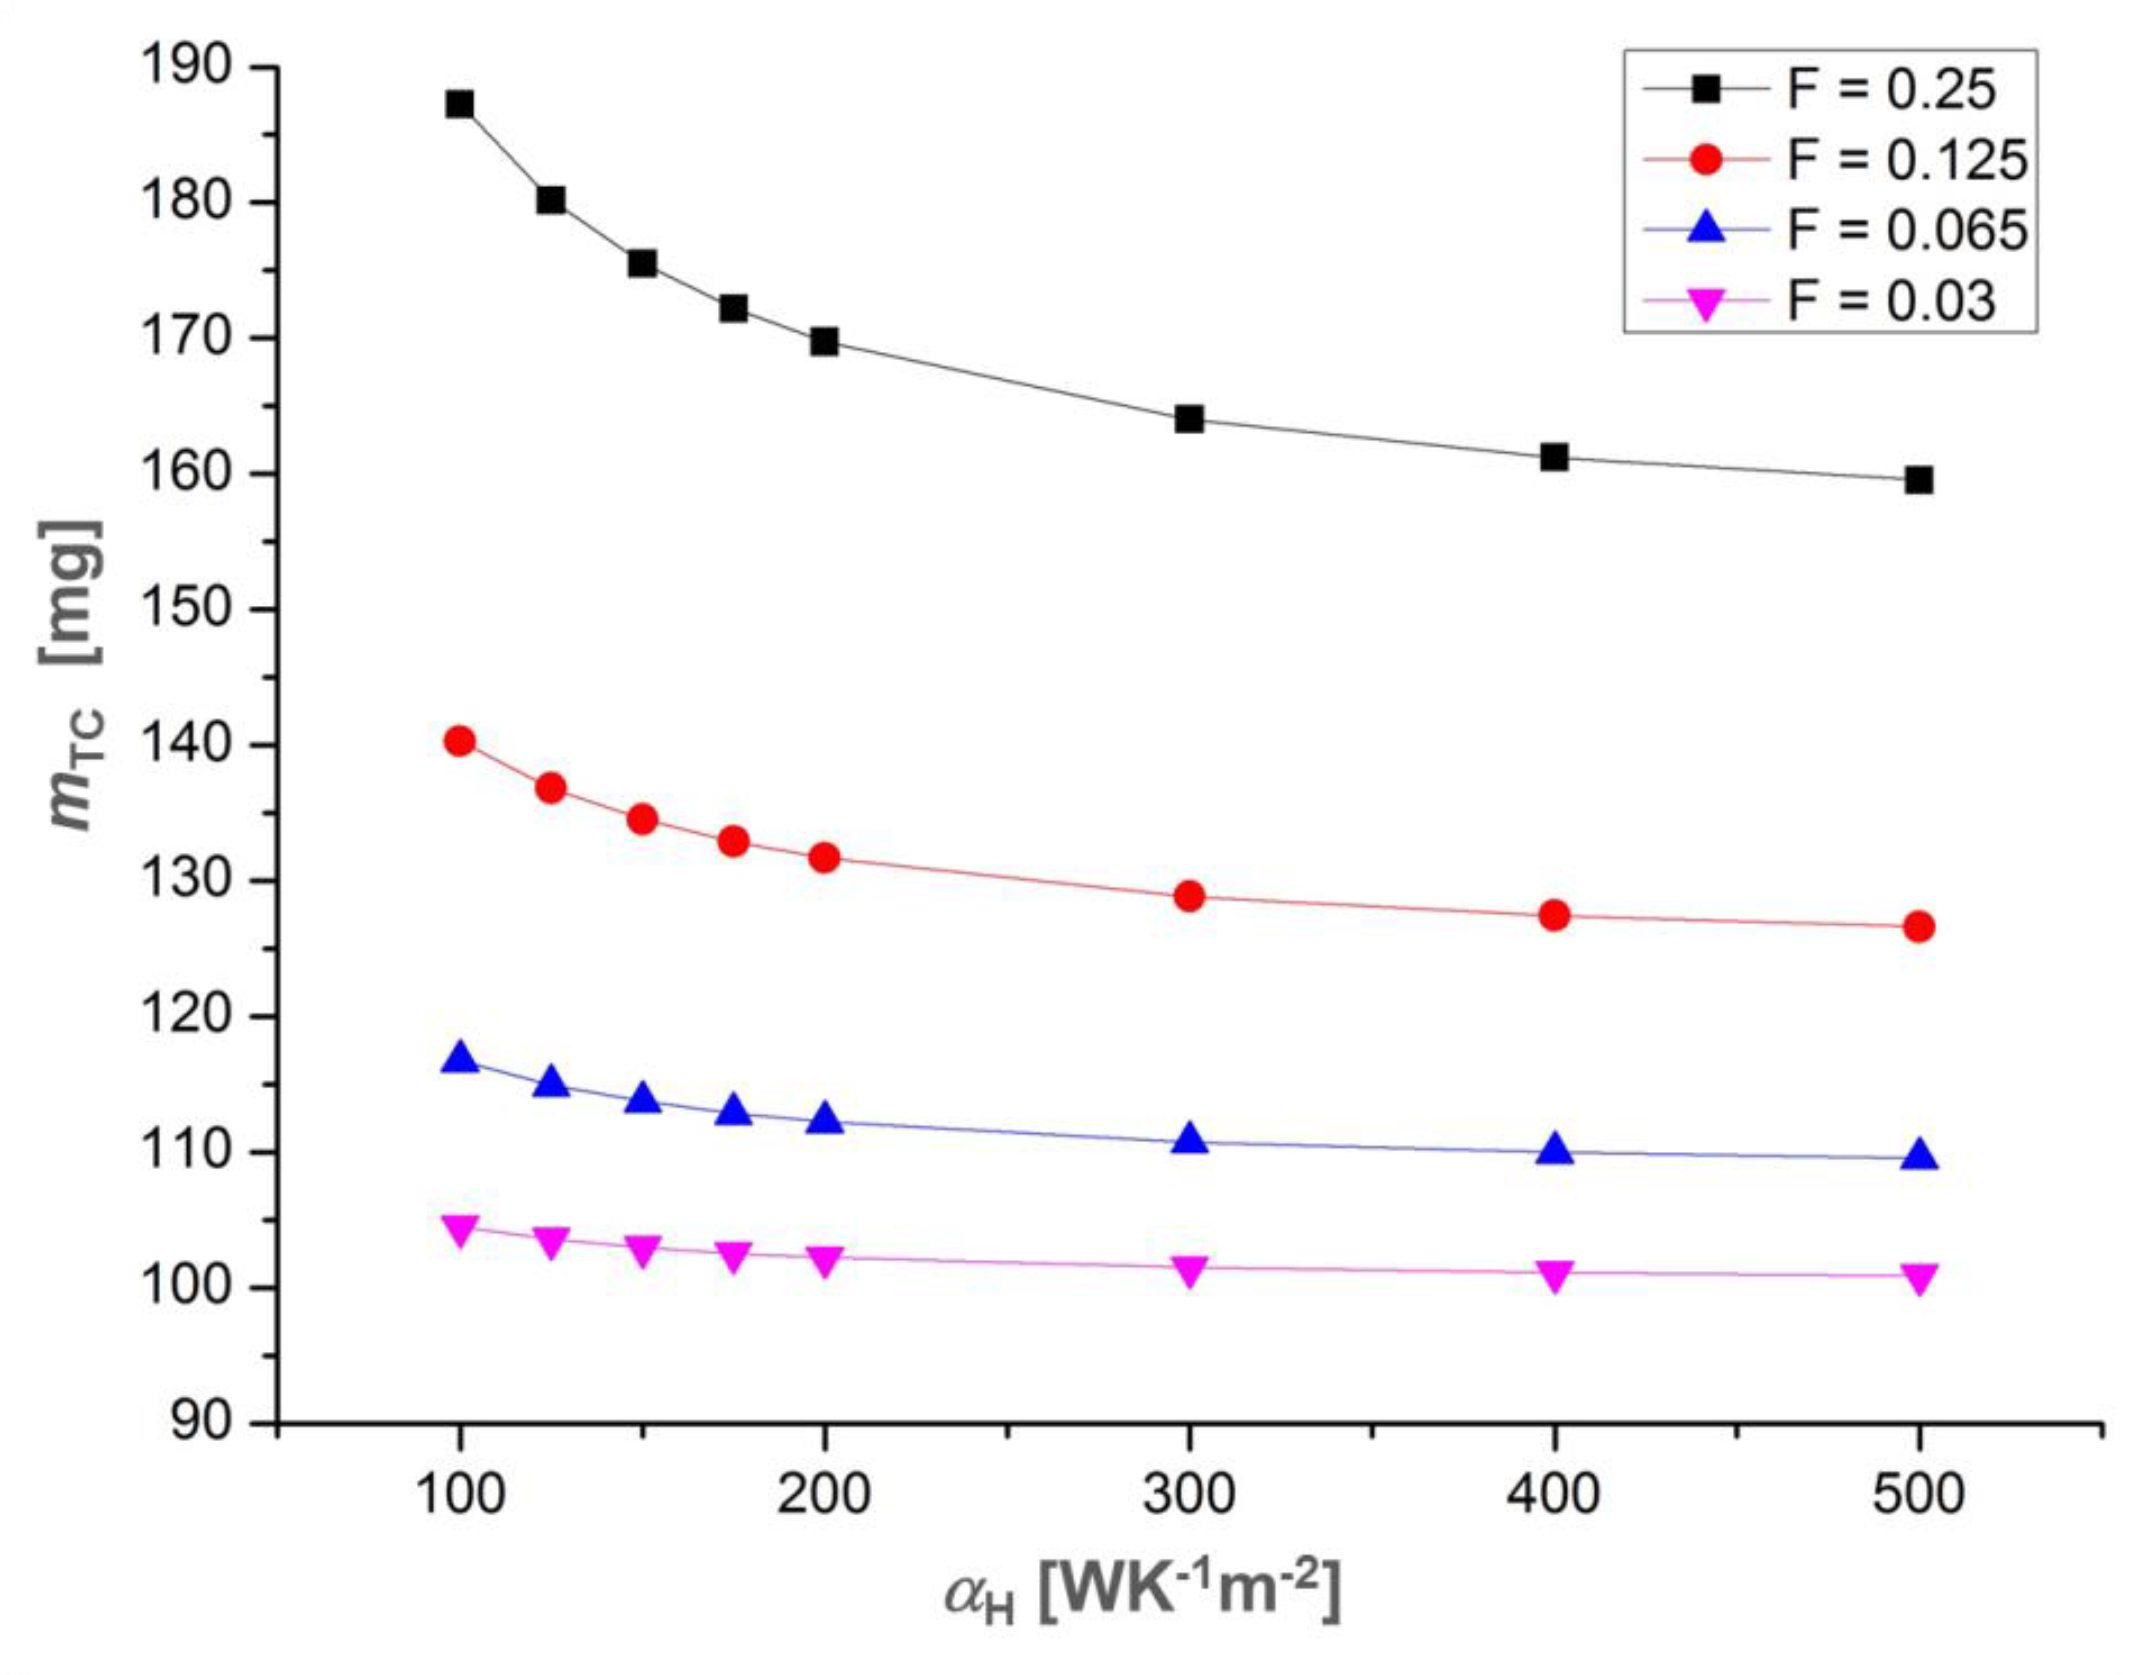
Increasing the surface for the convective heat exchange per thermocouple on both sides effectively decreases the thermal resistance of the convective boundary layers. The lower
F yields the reduction of the optimal leg length for the matching of thermal resistances (
Figure 8a), which allows for a significant mass reduction (
Figure A3).
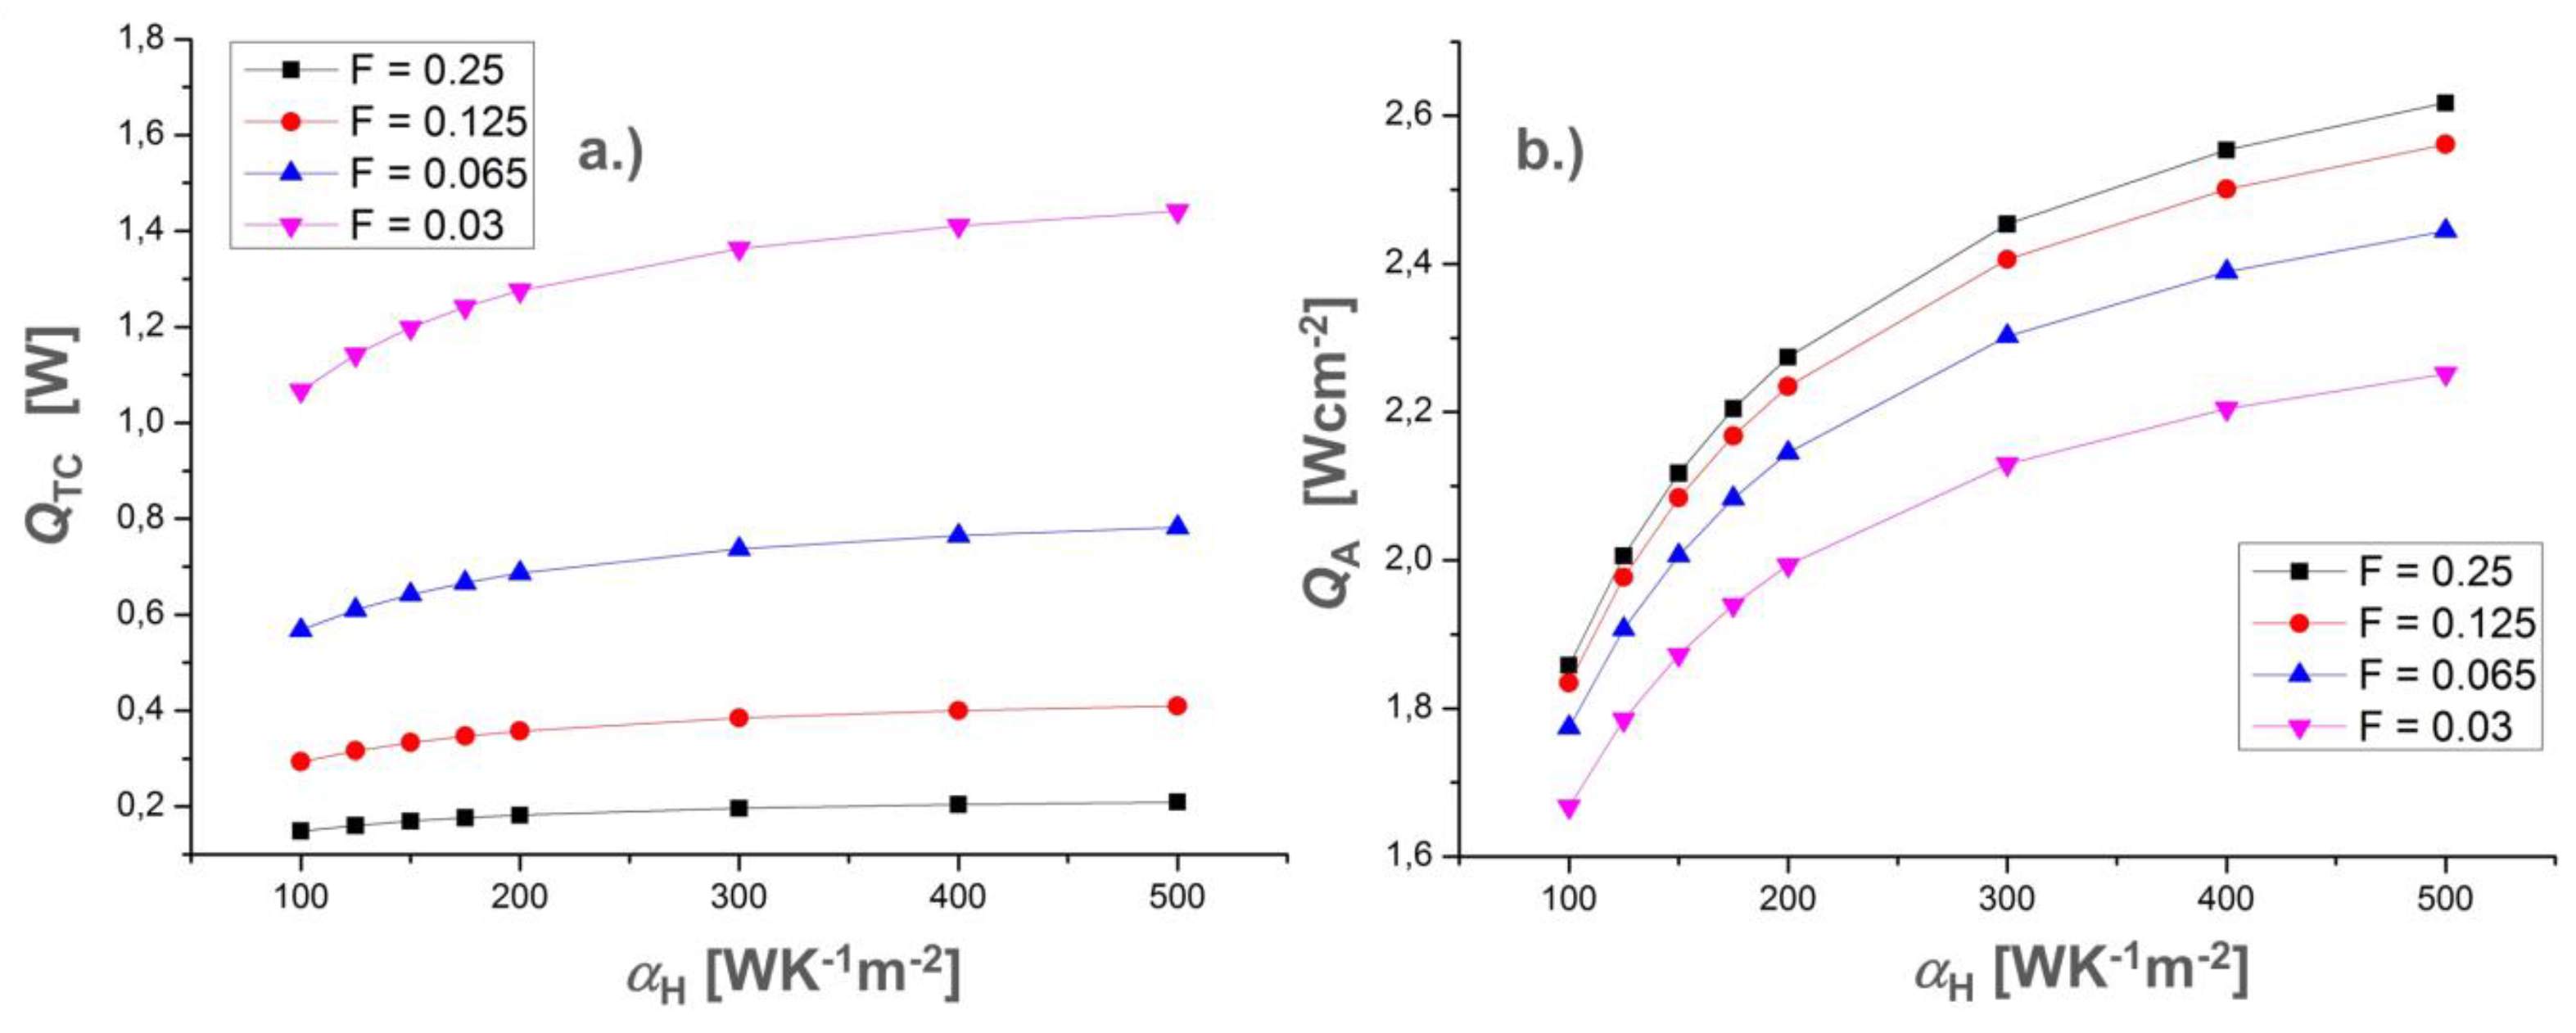
The incident heat per thermocouple grows as a consequence of the reduced thermal resistance of the convective boundary layers and TE legs (
Figure A4). The reduction of
F increases the gravimetric power density significantly (
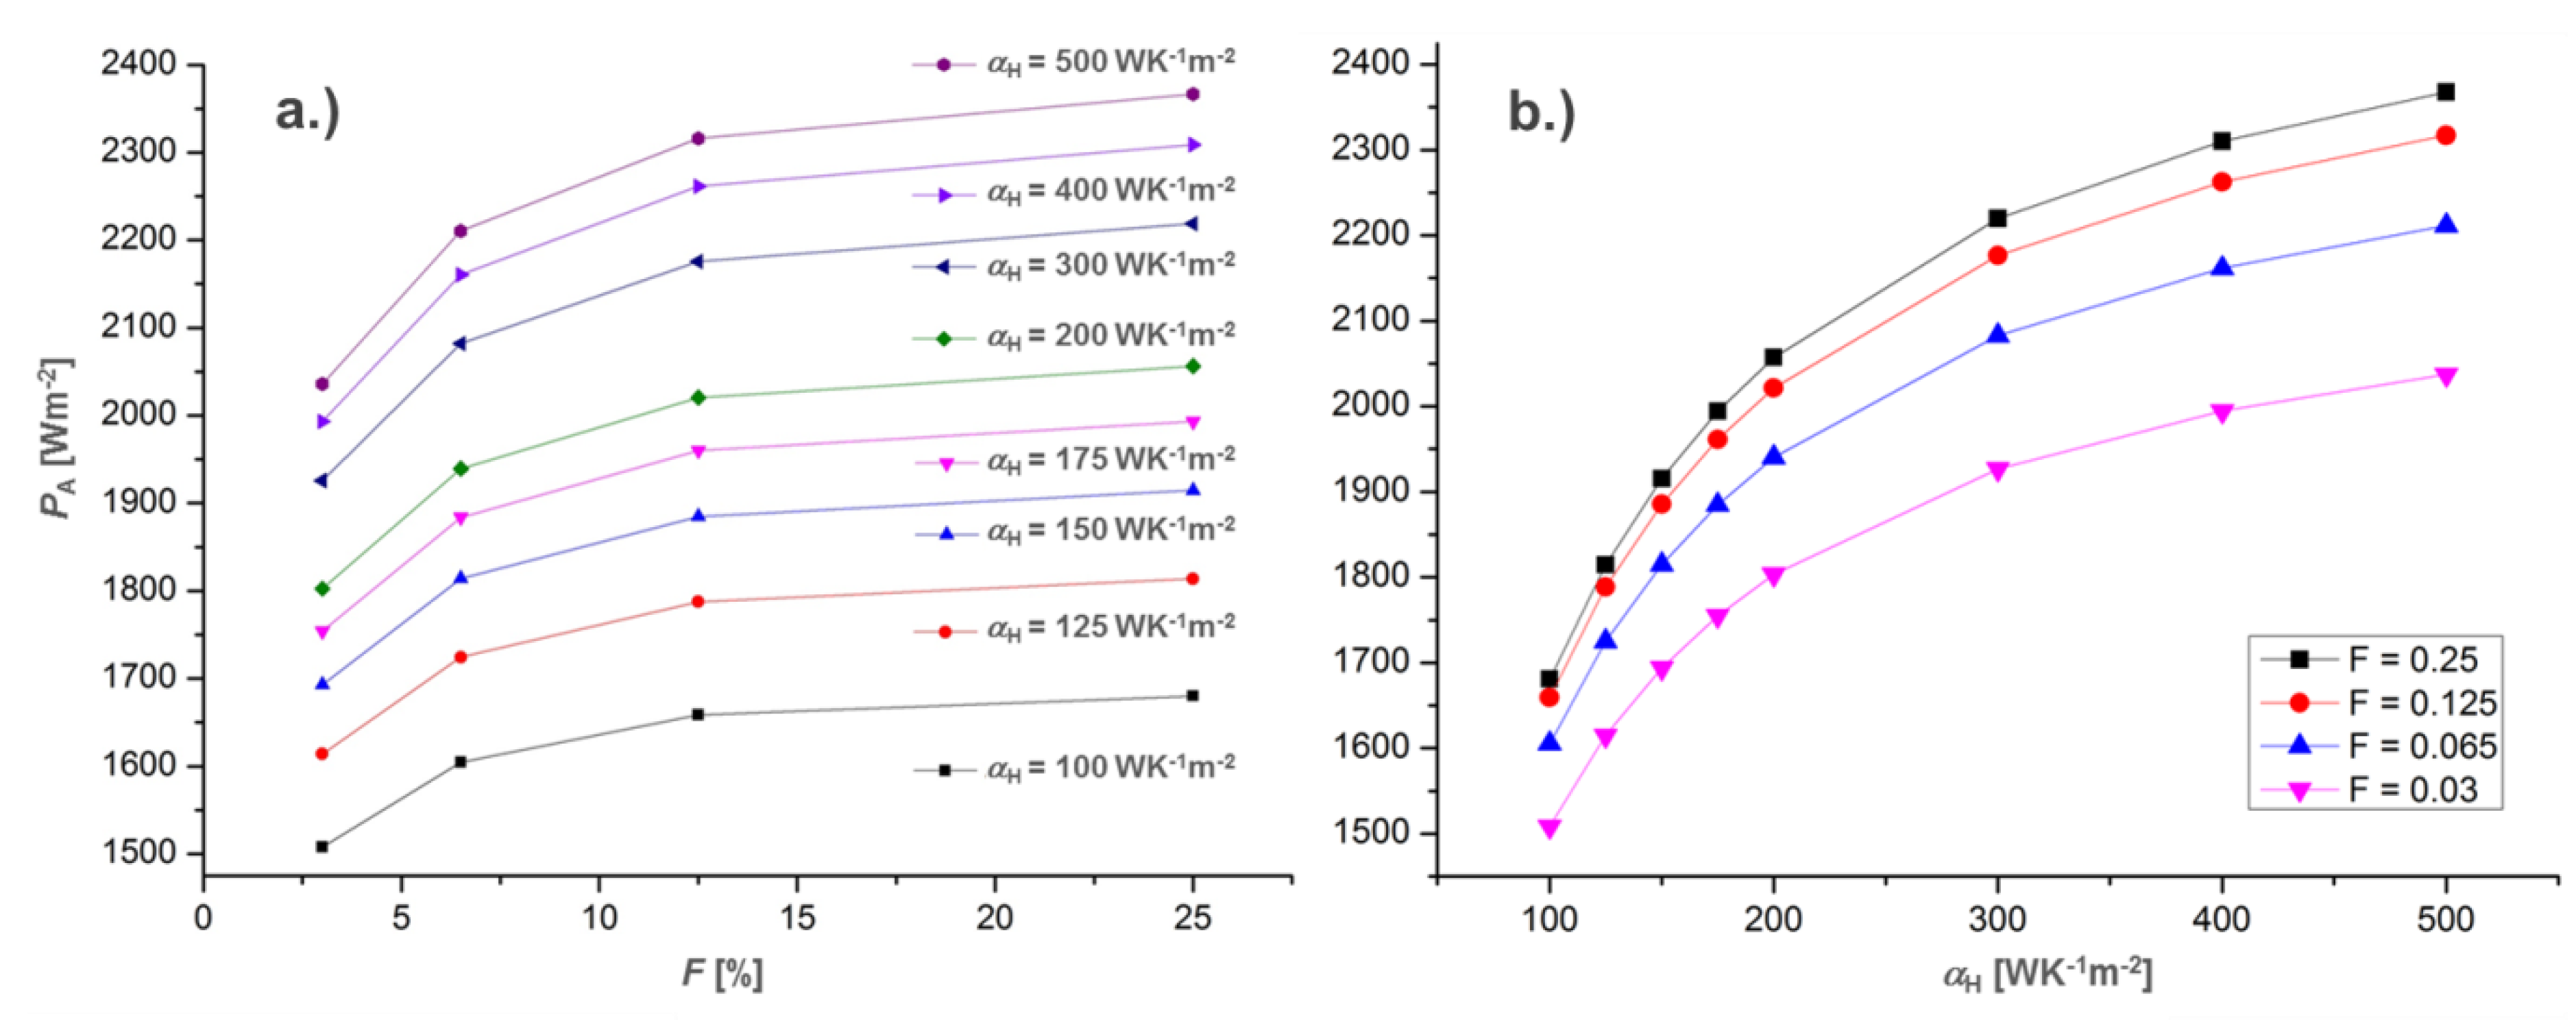
Figure 8b). While the minimum requirement for a positive effect on the SFC is determined by the resulting gravimetric power density
PG of the TEG, the amount of SFC saving scales with the total electrical power output being delivered from thermoelectric recuperation. Due to the limited installation space, the power output is linked to the areal power density
PA of the TEG (
Figure 9).
4. Discussion
Using the HPVM with
F = 25% and optimized leg length, a minimum
αH > 350 WK
−1m
−2 is required to fulfil the “APD + CFD”-limit of 100 Wkg
−1. The requirement of the “APD”-limit (173 Wkg
−1) and the limit for a range invariant TEG installation (520 Wkg
−1) are not achievable at all (
Figure 7b). Neither, increasing the
PF of the HPVM by 30% at
αH = 100 WK
−1m
−2 does fulfil the criteria for a beneficial TEG installation. Generally, the increase of
αH reduces the thermal resistance within the heat transmission path, allowing for a reduced leg length and mass saving for the configuration. Varying
αH from 100 WK
−1m
−2 to 500 WK
−1m
−2 yields a reduction of the optimal leg length by 30%, which translates into lowered thermocouple mass of 14.7%. Due to the matching of thermal resistances, the effective temperature difference at the TE legs remains almost constant, while the heat flux increases significantly for smaller leg lengths. This leads to an increase of gravimetric power density. Due to an unchanged
αC, the mean temperature rises along the thermocouple with increasing
αH. Since the material properties of the HPVM are fixed with regard to their initially set temperature characteristics, a higher mean temperature yields a continuously increasing bipolar contribution due to the approach to the intrinsic temperature domain of the supposed TE properties. In connection with non-vanishing temperature drops at the boundary, nozzle, and insulation layers, this results in a flattening of power density curves at higher
αH, irrespective of the lower optimal leg lengths. Since the minimal gravimetric power requirement of the aircraft system of 100 Wkg
−1 is only satisfied at
F = 25% by an improved convective heat exchange with a concurrent significant increase of materials performance, it is apparently not expedient to apply TE modules with higher filling factors for the application at the aircraft nozzle.
This might take into account that progress towards maximal
ZT-values~2 would represent a significant improvement for future TE materials with technological relevance and high stability from today’s point of view. Against this background and in conjunction with reasonable assumptions on the performance for the convective heat exchange at the nozzle, a beneficial TEG application is attainable only for smaller filling factors. However, the minimum applicable filling factor
Fmin is limited for several reasons. First, the spreading resistance of components for heat conduction within the heat transmission path can lower the effective temperature difference at the TE materials, since heat has increasingly to be provided laterally through substrates or insulation layers to the thermocouple legs at low
F. For instance, the United States National Aeronautics and Space Administration (NASA) demonstrated the feasibility of
F = 3.4% within their GPHS-RTG [
42] and even lower values for
Fmin = 1% have been suggested as a practical limit, once materials with high thermal conductivity are used to connect the thermocouples to external heat exchangers [
43].
Secondly,
Fmin is limited due to the reduction of necessitated leg lengths for matching of thermal resistances. A decreasing leg length puts higher requirements on the electrical contact resistance between bridges and the TE legs in order to maintain a high power output of the TEM at low
F. At typical values for the electrical conductivity of TE materials (~10
3 Scm
−1), contact resistances between 10
−6–10
−5 Ωcm
2 allow for a reduction of the leg length down to 0.1 mm, which was already successfully demonstrated in commercial TE devices for cooling [
44] and generator applications [
45].
Finally, the concurrent reduction of F and lower leg lengths promote a parallel heat flow through the gaps of the thermocouple configuration, which can lead potentially to a significant reduction of the efficiency in case of convection or heat transport by radiation. For open or evacuated TEG, the application of low-emissivity metallization layers has turned out to be an appropriate means to reduce radiative heat exchange within TEMs. Using solid filling of gaps by aerogel material, as considered by the simulation model of this work, effectively prevents parasitic thermal crosstalk between the hot and cold side of the thermocouple by convection. Selective simulations on the impact of the parasitic heat conduction through the aerogel revealed a maximum decrease of power output of 0.67%, which is supposed to be a tolerable value.
Lowering the filling factor
F yields high mass savings due to significantly lowered thermal resistance of the convective boundary layers and reduced optimal leg lengths of the thermocouple. Reducing
F from 25% to 3% reduces the thermocouple mass by 43% (
Figure A3). At the design point of the convection HTC parameters at the nozzle (
αH = 100 WK
−1m
−2,
αC = 64 WK
−1m
−2), the minimal gravimetric power density requirement (“APD + CFD”-limit) is fulfilled for the HPVM for
F < 21% (
Figure 10). When considering only the positive impact on the reduced mass and mechanical power of the engine generator (“APD”-limits), a beneficial installation of TEG becomes attainable for
F < 12.4%, while access to a range-invariant TEG implementation is given for
F < 5.5%, respectively. Improving the hot side convective HTC to
αH = 200 WK
−1m
−2 the power density requirements are fulfilled for slightly higher
F.
PG = 100 Wkg
−1 is attainable for
F < 23.8%, while the range-invariant installation requires
F < 6.3%. According to the simulation results, the range for maximum gravimetric power density at
F = 3% is given between 800 Wkg
−1 and 1200 Wkg
−1 in dependence on
αH.
The decrease of mechanical power taken from the turbine shaft by the generator scales with the electrical power output of the TEG, while the positive impact on the propulsive efficiency by acceleration of the bypass flow is linked to the heat flow dissipated by the TEG, which is likewise connected over the thermocouple efficiency to the power output of the TEG. Thus, the quantitative determination of the SFC saving requires the determination of the amount of electrical power provided by thermoelectric recuperation. When considering the limitation on the installation space, the power output is determined by the achievable areal power density
PA of the thermocouple. At
αH = 100 WK
−1m
−2 and
αC = 64 WK
−1m
−2,
PA stays below 1680 Wm
−2, independently from the filling factor applied. Reducing the filling factor from 25% to 3% yields a reduction of the areal power density in the range of 10% for a particular
αH (
Figure 9b). This is connected to the finite thermal conductivity of the components within the heat transmission path and the corresponding spreading resistances on both sides of the thermocouple configuration. Due to the low thicknesses of the nozzle and insulation layers, which are minimized in order to receive a maximized gravimetric power density, the components set a considerably thermal resistance for the lateral heat transport, which lowers the effective temperature difference at the TE materials. As a consequence, the heat flux density decreases for a particular set of HTC by approximately 10% when
F is reduced from 25% to 3% (
Figure A4).
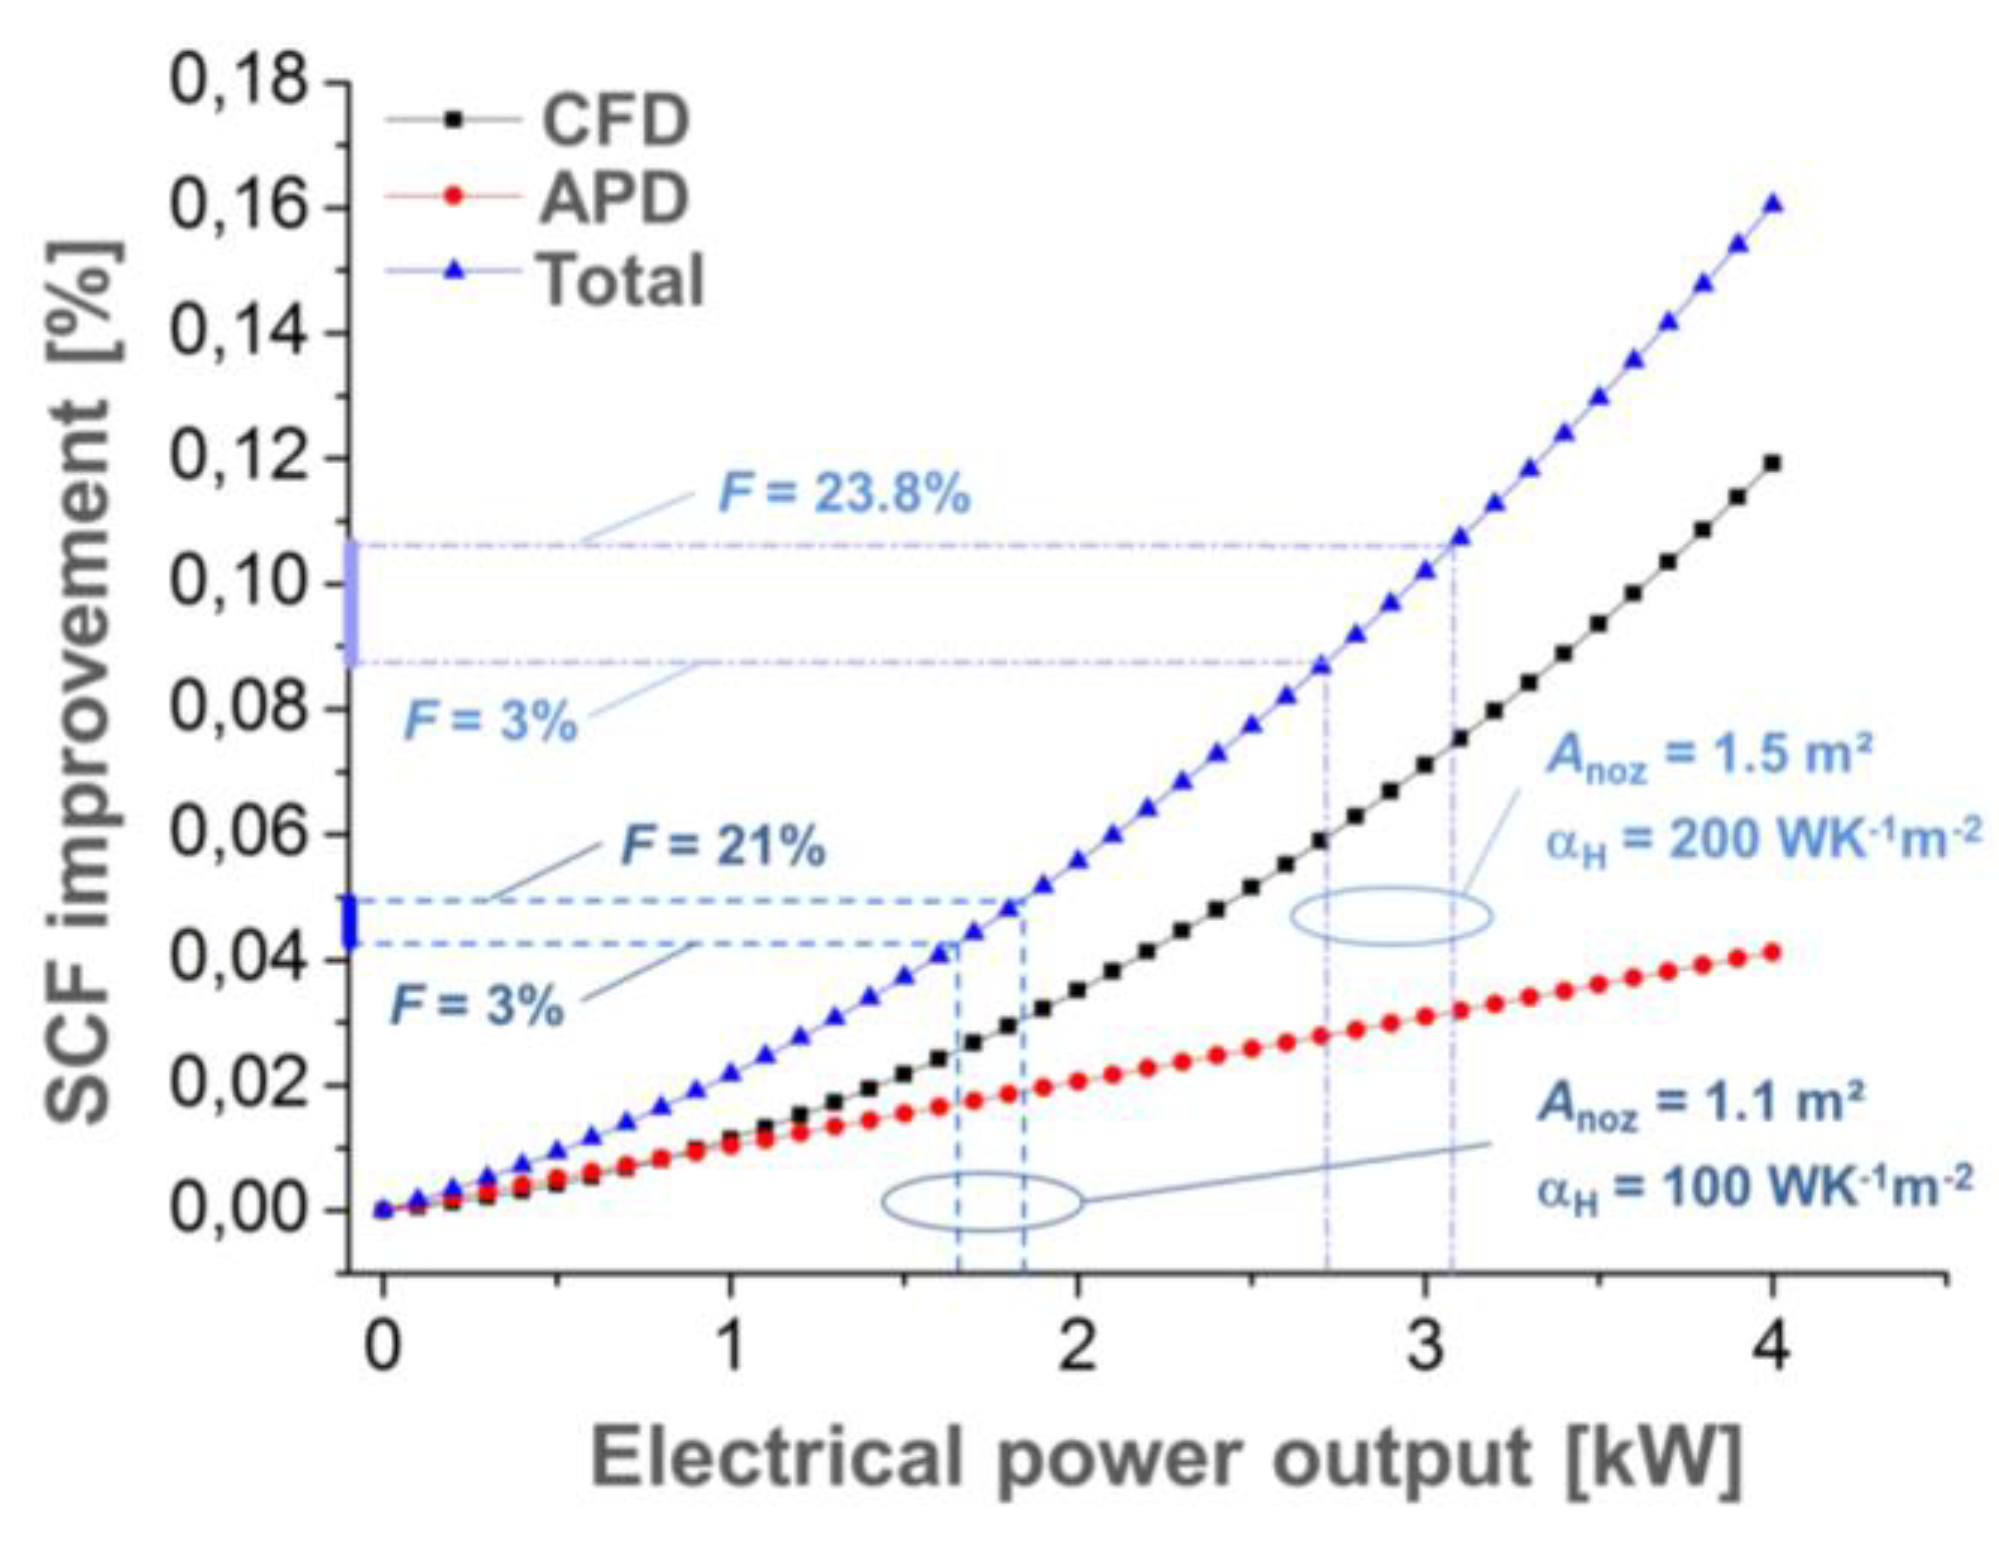
For the design points of the HTC (αH = 100 WK−1m−2, αH = 64 WK−1m−2) and the set total surface (Anoz = 1.1 m2), which is offered for TEG occupation, a total power output between 1.65 kW and 1.85 kW can be expected from the thermoelectric recuperation at the nozzle for F = 3% and F = 21%, respectively. This corresponds to 3.6% to 4.1% of the average electrical power output of the shaft-driven electric generator within each engine of the reference aircraft.
The power output for
F = 21% of 1.85 kW offers a total SFC improvement of 0.05% (
Figure 11). A slightly lower SFC reduction of 0.045% is achieved at
F = 5.5%, but with the advantage of a range invariant installation of the TEG, as the gravimetric power density exceeds 520 Wkg
−1. A possibility to improve the SFC saving is given by an increase of the installation space, which is calculated for an additional higher value of
Anoz = 1.5 m
2. Increasing simultaneously the performance of the convective heat transfer to
αH = 200 WK
−1m
−2 the corresponding areal power density offered by the TEG could allow for a SFC improvement of 0.11% at
F = 23.8%. Again, slightly lower SFC reduction of 0.096% is achieved at
F = 6.3% for a range invariant installation of the TEG at the geometrically extended nozzle. A further but not yet investigated means to increase the power density is given by exchanging the TiAl by electrically insulating SiC. Due to higher thermal conductivity and simultaneously lower density, SiC could decrease the mass and the spreading resistance of the nozzle, while making the use of the AlN layer unnecessary, which would allow for an additional reduction of mass.
However, according to the simulation results a SFC saving between 0.05% and 0.1% seems plausible for the TE recuperation of waste heat at the engine nozzle. Though the nominal values might seem small, a considerable economic impact can be estimated from the beneficial impact on the operational costs. According to estimations from Boeing [
18], a SFC improvement of 0.1% translates into a cost saving of 2.4 Mio
$/month for the entire US civil aviation sector. Our own estimations [
46] on the base of a 0.1% SFC improvement yield a potential saving of 144 k
$ per airplane over a typical life time of 28 years. Consequently, a return of investment during five years could be attainable for a 2 kW TEG system within the cost limit of <16
$/W. According to recent studies, the sum of material and heat exchanger costs for modern TE materials can be estimated below 10
$/W for
F < 10% and at operating temperatures between
TH = 700 K and Tc = 300 K [
47], which might be relevant for a progressive approach of a high performant heat transport system at the nozzle with the use of heat pipes. When considering the total TE system costs (including manufacturing, heat exchanger, and material costs for thermoelectrics and ceramics) values < 20
$/W are offered by a certain number of today’s TE materials at the temperature range between
TH = 523 K and
TC = 293 K [
48]. This opens a realistic window for an economically efficient installation of TEG in the future, especially under consideration of further optimization potential concerning particular assumptions that were made within this simulation study.
5. Conclusions
The application of thermoelectric generators (TEG) on the nozzle of an aviation jet engine was studied by finite element modelling. Temperatures of the core stream and the bypass flow are derived from CFD results [
25] and are applied as boundary conditions to the FEM simulation of various thermocouple configurations. In conjunction with effective heat transfer coefficients (HTC) between the flat surfaces of the nozzle and the core (
αH = 100 WK
−1m
−2) and the bypass (
αC = 64 WK
−1m
−2) air flow, respectively, the performance of different thermocouple designs is simulated on the basis of a virtual material with a
ZTmean = 1.1. Focus is placed on the identification of the appropriate filling factor
F and TE element length in order to maintain a positive impact on the specific fuel consumption (SFC) of a reference aircraft [
22]. The maximal gravimetric and areal power density of the TEG is simulated for 3% <
F < 25%, with a concurrent determination of the optimal leg lengths for the matching of thermal resistances.
The requirement on the gravimetric power density, which was determined from of a parametric aircraft model [
28], cannot be fulfilled for a thermocouple design with
F = 25%, neither by an increase of the HTC nor by a reasonable improvement of materials performance. The minimum break-even point of gravimetric power density (100 Wkg
−1) for TEG implementation with a positive impact on the SFC but with the drawback of a reduced flight range of the aircraft is attainable for
F < 21%. The low HTC (
αH = 100 WK
−1m
−2,
αC = 64 WK
−1m
−2) of the convection heat exchange at the flat nozzle surface turned out to be the bottleneck for the maximization of the TEG performance. Consequently, the requirement for a range-invariant installation (520 Wkg
−1) only becomes attainable for
F < 5.5%.
For Anoz = 1.1 m2 of occupation surface at the nozzle a power output between 1.65 kW and 1.85 kW is expectable from the TEG per engine within the design domain with a positive SFC impact. Under reasonable assumptions of an increased occupation surface (Anoz = 1.5 m2) and improved heat exchange by convection (αH = 200 WK−1m−2, αC = 64 WK−1m−2), the power output of the TEG increases to 2.72 kW to 3.07 kW within the design range (F < 23.8%), which shows sufficiently high gravimetric power density in order to maintain a positive SFC impact.
The resulting savings on the SFC is in the range between 0.05% and 0.1%, which translates into a considerable reduction of operation cost for the aircraft. This cost reduction opens a window for an economically efficient TEG installation. A return of invest during approximately five years is estimated, if the total costs of the thermoelectric recuperation system stay below 16 $/W, which is a reasonable value for high performance TE materials from today’s point of view.
Further improvement of the power output and the resulting SFC saving seems realistic by the increase of the nozzle surface, exchange of particular materials for more performant heat transfer, and by optimization of the convective heat exchange by the modification of surface structures. Though, the installation of TEG in engine sections with higher temperature levels was not investigated in detail yet, it offers a significantly higher power output and SFC improvement capability when compared to the nozzle installation [
22]. Further studies have to verify the entire optimization potential and to clarify the possibilities for more progressive integration concepts for TEG in aviation engines. Although the limitation on the convective heat transport clearly represents the major bottleneck for a performant application at the aviation nozzle, future materials must still offer an attractively high
ZTmean with regard to the application temperature range, in order to maximize the absolute power output and SFC saving. However, the thermoelectric recuperation of waste heat of aviation jet engines provides beneficial effects to the aircraft system, due to a lowered mechanical power by the engine generator and the acceleration of the bypass flow. Consequently, robust and performant TEGs could contribute to improve the fuel consumption of future aircrafts, which makes them a favorable choice, particularly with regard to other unexplored installation locations or additional positive side-effects on the system level (e.g., de-icing of engine components).


