Article

A Lithology Recognition Network Based on Attention and Feature Brownian Distance Covariance

School of Computer and Information Engineering, Tianjin Chengjian University, Tianjin 300384, China
*
Author to whom correspondence should be addressed.
Appl. Sci. 2024, 14(4), 1501; https://doi.org/10.3390/app14041501
Submission received: 4 January 2024 / Revised: 7 February 2024 / Accepted: 10 February 2024 / Published: 12 February 2024

Abstract

:
In the context of mountain tunnel mining through the drilling and blasting method, the recognition of lithology from palm face images is crucial for the comprehensive analysis of geological conditions and the prevention of geological risks. However, the complexity of the background in the acquired palm face images, coupled with an insufficient data sample size, poses challenges. While the incorporation of deep learning technology has enhanced lithology recognition accuracy, issues persist, including inadequate feature extraction and suboptimal recognition accuracy. To address these challenges, this paper proposes a lithology recognition network integrating attention mechanisms and a feature Brownian distance covariance approach. Drawing inspiration from the Brownian distance covariance concept, a feature Brownian distance covariance module is devised to enhance the network’s attention to rock sample features and improve classification accuracy. Furthermore, an enhanced lightweight Convolutional Block Attention Module is introduced, with upgrades to the multilayer perceptron in the channel attention module. These improvements emphasize attention to lithological features while mitigating interference from background information. The proposed method is evaluated on a palm face image dataset collected in the field. The proposed method was evaluated on a dataset comprising field-collected images of a tunnel rock face. The results illustrate a significant enhancement in the improved model’s ability to recognize rock images, as evidenced by improvements across all objective evaluation metrics. The achieved accuracy rate of 97.60% surpasses that of the current mainstream lithology recognition neural network.

1. Introduction

Lithology identification stands as a critical research domain within geology, resource exploration, and the mitigation of adverse geological conditions for tunnels and underground engineering [1,2,3]. In mountain tunnel mining utilizing the drilling and blasting method, encountering safety hazards, such as unstable rock layers or internal fissures, is inevitable. Therefore, the lithology identification of palm face images holds paramount significance for preventing potential geological risks. Traditional lithology identification methods, including visual analysis, electromagnetic techniques, and rock sheet analysis, predominantly rely on expert experience and necessitate sophisticated experimental instruments and controlled working environments [4]. These factors collectively impede the swift and accurate execution of lithology identification. Accurate identification of the physical and mechanical properties of geotechnical materials, coupled with precise selection, constitutes the foundational and core aspects of geotechnical engineering construction. Within this domain, lithology identification and parameterization emerge as pivotal elements, where the precision of results significantly impacts the safety and economy of engineering endeavors [5]. In the context of highway tunnel projects, the construction process contends with dynamic geological conditions, especially the intricate lithological complexities introduced by adverse effects. The complexity of highway tunnel construction, with its myriad technological intricacies and challenging labor environments, is compounded when faced with adverse geological and topographical features, such as karst formations, high-stress zones, fault fracture areas, and rock bursts. The excavation of highway tunnels, typically characterized by expansive spans and flattened shapes, necessitates stringent drainage requirements throughout the digging process. Presently, the predominant method for highway tunnel excavation involves drilling and blasting. While effective, this method can disrupt the surrounding rock significantly, increasing the risk of tunnel collapse incidents. The associated challenges in tunnel construction, particularly when dealing with adverse geological features, pose elevated demands on the design, construction, and management of highway tunnels. Despite advancements in tunnel excavation methods, some professional skills pertinent to highway tunnel construction remain underutilized. The prevalent use of the New Austrian Method, encompassing surface blasting technology, spray anchor support technology, and perimeter rock deformation measurement technology, underscores the need for practical expertise and comprehensive research within tunnel construction teams. The absence of a practical mastery of these techniques, coupled with a lack of understanding of the underlying principles, can result in unnecessary waste during tunnel excavation, ultimately inflating project costs and diminishing economic benefits [6].
Deep learning-based recognition methods have demonstrated the potential to enhance result objectivity and alleviate the workload of analyzers compared to traditional methods [7]. Over the years, the continuous evolution of deep learning technology has notably elevated the accuracy of rock properties recognition [8,9]. Zhang Ye et al. [10] successfully employed a convolutional neural network algorithm to classify three rock properties—granite, kilomagnet, and breccia—with a recognition accuracy of 90%. Ren Wei et al. [11] utilized a self-learning intelligent algorithm for the automatic classification of nine rock sample images. Bai Lin et al. [12] developed a rock recognition model based on convolutional neural networks, achieving a recognition accuracy of 63% for 15 common rock sample images. Xu Zhenhao et al. [13] established an intelligent recognition method for rock properties using transfer learning of rock images, recognizing 30 rock types with an accuracy rate of 90.21% and demonstrating robustness and generalization. Ma Zedong et al. [14] proposed a multi-scale lithology recognition method based on deep learning of rock images, achieving a recognition accuracy exceeding 85%. Despite these advancements, current deep learning-based rock properties recognition methods face challenges [15,16,17], including (1) insufficient data sample sizes affecting feature learning during model training and (2) complexities in the background of tunnel rock face images, including illumination and shadows, hindering accurate recognition of rock properties.
This paper addresses the challenges associated with lithology recognition by proposing a Feature Convolutional Attention Residual (FC-Res) network. The network employs ResNet18 as the backbone network, integrating a feature Brownian distance covariance (FBDC) module and an improved Convolutional Block Attention Module (CBAM). The key contributions of this paper are outlined as follows:
  • Design of the feature Brownian distance covariance module: We propose a FBDC module inspired by the concept of depth Brownian motion distance covariance. This module is designed to quantify the disparity between the joint eigenfunctions of embedded features and the edge product, aiming to enhance the attention to sample features.
  • Improvements to the CBAM: An improved CBAM is proposed, which mitigates the interference of background information by a multilayer perceptron (MLP) in the rising channel attention module.
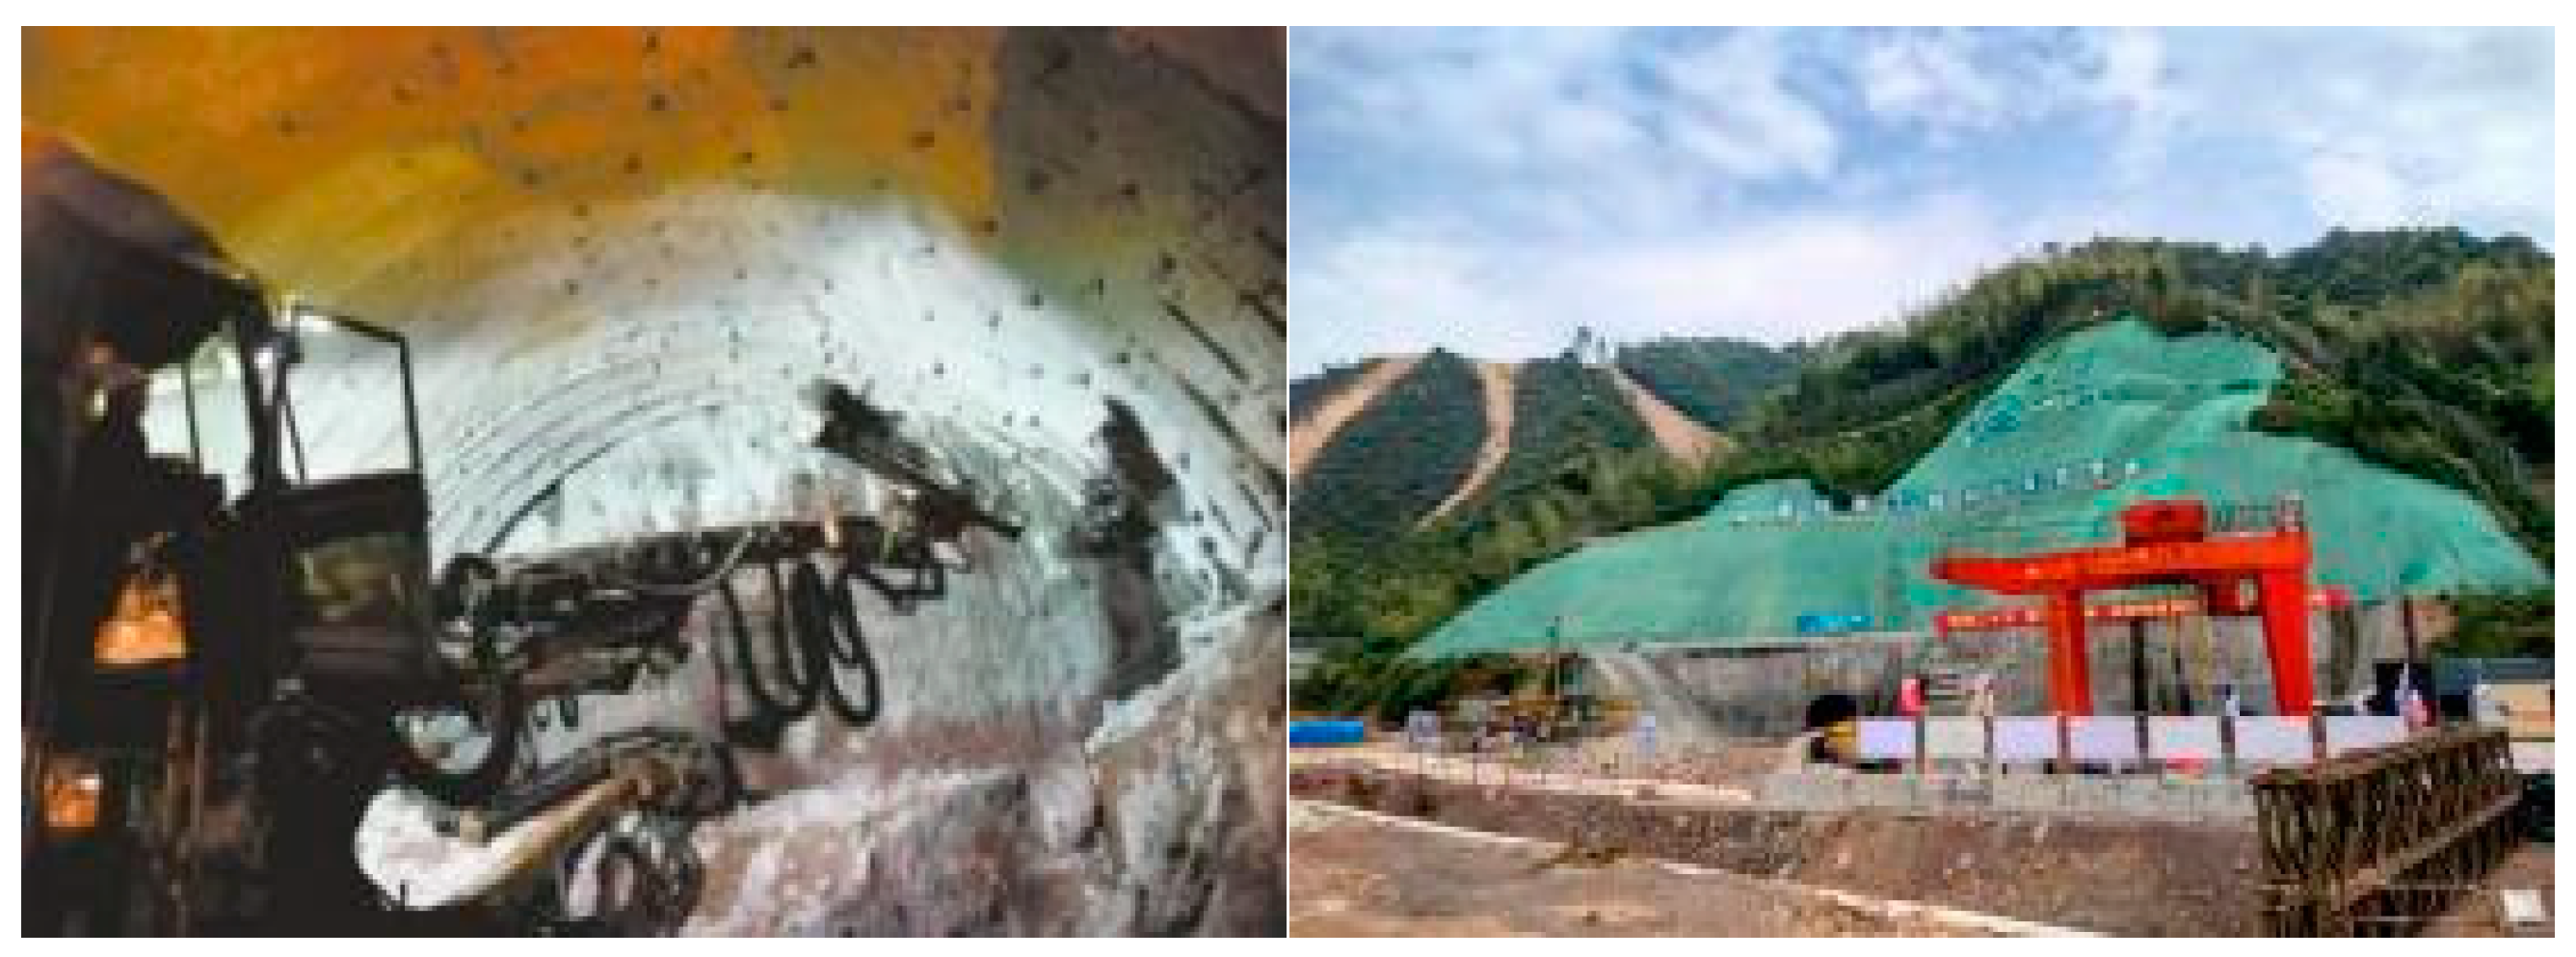
  • Application of FC-Res network: The proposed FC-Res network was employed for the identification of rock properties at construction sites, specifically in the Kangding, Laolinggang, Xingdongshan, and Yigong tunnels. This application can greatly solve the problem of poor prediction results due to insufficient training samples at construction sites.

2. Methodology

This paper introduces the FC-Res network as a novel approach for rock properties recognition. Leveraging ResNet18 as its backbone network, the FC-Res network incorporates the feature Brownian distance covariance (FBDC) module and an improved Convolutional Block Attention Module (CBAM), both integrated into the ResNet18 architecture. The network structure of FC-Res is illustrated in Figure 1.
The input rock image pixels are 256 × 256 × 3. After the initial degradation and feature extraction of the rock image by convolutional and pooling layers, a rock feature map of size 64 × 64 × 64 is obtained. Then, through a module consisting of four layers of residual modules and attention modules, an improved CBAM attention mechanism is inserted after each of the first three residual modules, i.e., an elevated multilayer perceptual machine structure is designed in the channel attention module, which has a more powerful ability to capture the important features in the image and gives the model a better expressive ability and generalization ability. After passing through the fourth layer of residual blocks, a feature map of size 512 × 8 × 8 is output. Next, it passes through the FBDC module, which calculates the similarity of each type of test set by calculating the inner product of the BDC matrix of the input image and the average BDC matrix of the test set. Finally, the rock feature maps extracted by the network are input into the Softmax classifier to output the corresponding classifications of the rock images, and, finally, complete the rock lithology analysis and prediction of the rocks. The parameters of the FC-Res network structure are shown in Table 1.

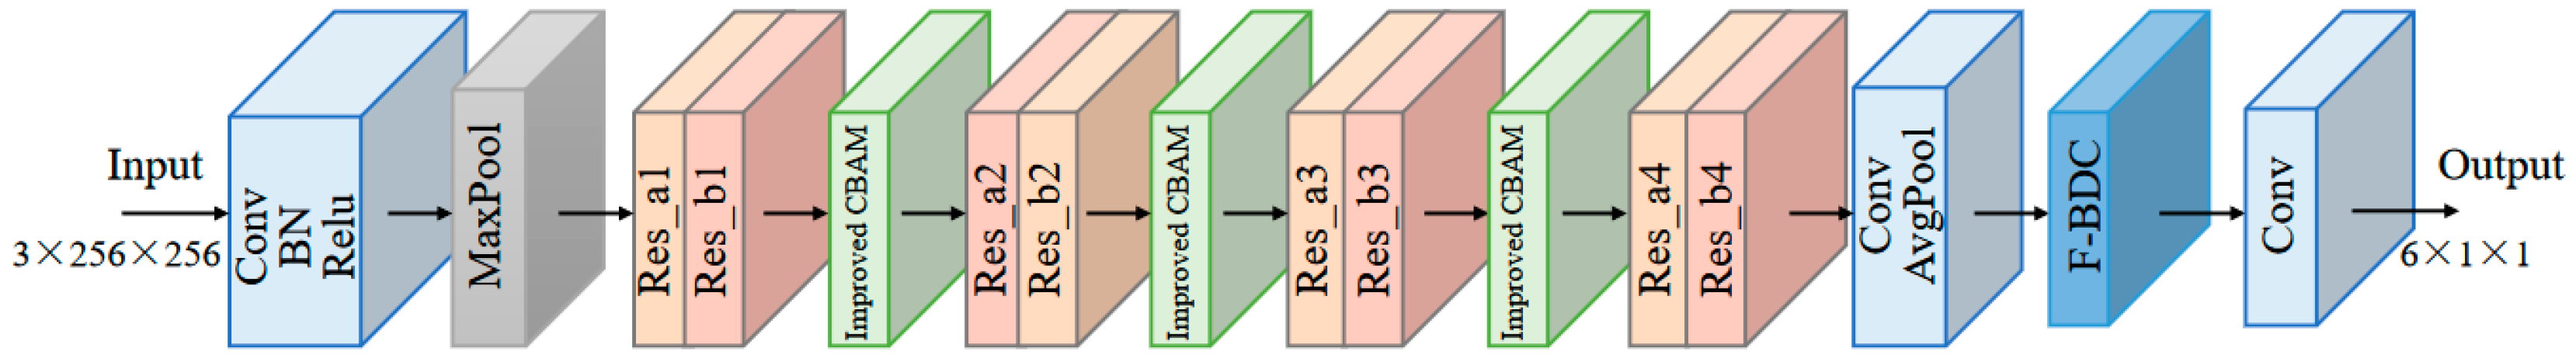
2.1. ResNet18 Backbone

ResNet18 has gained extensive utilization within the domain of computer vision, particularly excelling in tasks such as image classification, target detection, and image segmentation [18]. Its exceptional performance stems from its adept utilization of residual connections, a feature that effectively optimizes the gradient flow during training and mitigates the risk of overfitting [19]. Moreover, the ResNet18 architecture boasts a moderate number of layers and exhibits rapid convergence, making it a well-suited choice for applications demanding real-time processing and high accuracy, such as lithology recognition tasks. Hence, ResNet18 has been selected as the backbone network for this study, with the network structure depicted in Figure 2.
The main structure of the ResNet18 network is four stacked residual blocks, and the residual block structure is shown in Figure 2, which connects the input feature information to the output of the residual block through a 1 × 1 convolution, which mitigates the gradient disappearance and explosion of the deep network during training. The input network is a 256 × 256 three-channel RGB image, which outputs six rock categories after a series of residual blocks as well as pooling operations. The input rock image is feature-extracted and downsampled by a convolutional layer to obtain a feature map of size N × 6 × 8 × 8 (N is a mini-batch size), which is then continued to be downsampled by an 8 × 8 adaptive average pooling layer, continuing sampling to obtain an N × 6 × 1 × 1 size feature map, and, finally, the extracted rock features are input into a Softmax classifier to calculate the rock category prediction probability.

2.2. Improvements to the CBAM

To enhance the classification accuracy of the model, mitigate the extraction of irrelevant features, and bolster the network’s capacity to discern rock features, we propose an enhanced Convolutional Block Attention Module (CBAM) attention mechanism.
The conventional CBAM attention mechanism employs two modules, namely channel and spatial, to jointly regulate feature mapping. In the original Channel Attention Module (CAM) [20], input feature maps undergo extraction through two parallel branches involving global maximum pooling and global average pooling. These processes compress the feature maps into a 1 × 1 × C format. Subsequently, the number of channels is compressed to the original 1 × 1 × C/p through a multi-perceptual layer mechanism. The channels are then expanded back to their original count, and the outputs from the two parallel branches undergo summation, ultimately yielding the CAM output through the Sigmoid activation function. Finally, this result is multiplied with the input feature map. Within the shared neural network, the dimensionality reduction multilayer perceptron (MLP) operates as follows: firstly, the 1 × 1 × C feature map undergoes dimensionality reduction to a 1 × 1 × C/p feature map, and subsequently, it is upgraded to a 1 × 1 × C size. While this dimensionality reduction operation effectively reduces computational load and model parameters, it introduces a significant loss of detail information from the feature map. This loss interferes with the generation of channel attention feature weights, rendering the mechanism incapable of attenuating interference from background information.
For the intricate lithology recognition task, the nuances of rocks, including their shape, color, and texture, are intricately linked to their lithological composition. Thus, the extraction of detailed features holds paramount importance in lithology recognition. The ascending MLP demonstrates superior capability in retaining and extracting intricate image details, thereby augmenting classification accuracy by mapping low-dimensional features to high-dimensional space. To bolster the extraction of detailed features from rock surface imagery, this study proposes an enhancement to the CBAM channel attention module. This enhancement entails transforming the original CBAM’s reduced-dimensional MLP into an ascending multilayer perceptron structure. The structure of the enhanced CBAM is illustrated in Figure 3.
Initially, the feature map F, characterized by dimensions H × W × C, serves as the input. As the feature map traverses the improved channel attention module, the ascending multilayer perceptron operation transforms the 1 × 1 × C feature map into 1 × 1 × pC, followed by a reduction to the original 1 × 1 × C feature map through a descending operation. This dimensionality-raising multilayer perceptron adeptly preserves and extracts detailed image information by mapping low-dimensional features to high-dimensional space, thereby enhancing the accuracy of lithology recognition.
Subsequently, the output feature map from the channel attention module becomes the input for the Spatial Attention Module (SAM). Through maximum pooling and mean pooling operations on the channel, the input feature map undergoes extraction of global and local information in the spatial dimensions, yielding two two-dimensional feature maps: the mean-pooled feature and the maximally pooled feature. These features are concatenated, followed by transformation into a 1-channel feature map through convolution operations. Application of the Sigmoid activation function produces the final output result of SAM. Finally, this result undergoes element-wise multiplication with the input feature map, extracting crucial image feature information and yielding the output F’ of the improved CBAM. The dimension of F’ aligns with that of the input feature map.

2.3. Design of the FBDC Modules

To enhance the accuracy of rock identification models, this study introduces the Feature Brownian distance covariance (FBDC) algorithm, drawing inspiration from the concept of Brownian distance covariance (BDC) [21,22]. This algorithm precisely assesses the similarity among rock features by computing the inner product between respective BDC matrices [23]. These BDC matrices effectively capture the nonlinear relationships between channels, representing these relationships through the Euclidean distance nonlinear correlation. The FBDC module is integrated into the network as a pooling layer, strategically employed to sharpen the focus on features within rock sample images.
For the lithology recognition task, the network receives a color rock image z = R3 as input, embedded into the feature space as a tensor of dimensions h × w × d, where h and w denote the height and width of the feature map, and d represents the number of feature channels. Subsequently, the tensor undergoes reshaping into a matrix X R h w × d , wherein each column xk R h w or row xj R d can be interpreted as an observation of X [24,25,26].
Considering xk as an instance of a casual observation, the process involves three main steps. Initially, the computation of the squared Euclidean distance matrix A ˜ takes place. Subsequently, the computation of the Euclidean distance matrix A ^ follows. Finally, the BDC matrix A is derived by A ^ subtracting its row mean, column mean, and the mean of all its elements, as illustrated in Equation (1).
A ˜ = 2 ( 1 ( X T X I ) ) sym 2 X T X A ^ = ( a ˜ k l ) A = A ^ 2 d ( 1 A ^ ) sym + 2 d 2 1 A ^ 1
where a ˜ k l is the squared Euclidean distance from the kth column to the lth column of the matrix X. Furthermore, 1 denotes a matrix with 1 in each row and column, and I denotes the unit matrix, which denotes the Hadamard product. sym is expressed as shown in Equation (2).
( U ) s y m = 1 2 ( U + U T )
In this study, the rockiness recognition task comprises six classes of test sets denoted as Sk, k ( 1 , 6 ) , each containing j images. The BDC averaging matrix Pk, corresponding to each class of test set Sk, is calculated sequentially as illustrated in Equation (3).
P k = 1 K ( z j ) S k A ( Z j )
Here, Z j represents the set of images within a specific class of test sets.
The BDC matrix of the input image undergoes an inner product with the BDC average matrix Pk of the corresponding test set to derive the similarity, as outlined in Equation (4).
ρ ( X , Y ) = < A , P k > = A T P k
Following Equation (4), similarity values are computed for each type of test set. Subsequently, the prototype distance Softmax classifier outputs the classification corresponding to the rock image. Specific matrix calculation parameters are compared to Table 2.

3. Experimental Results and Analysis

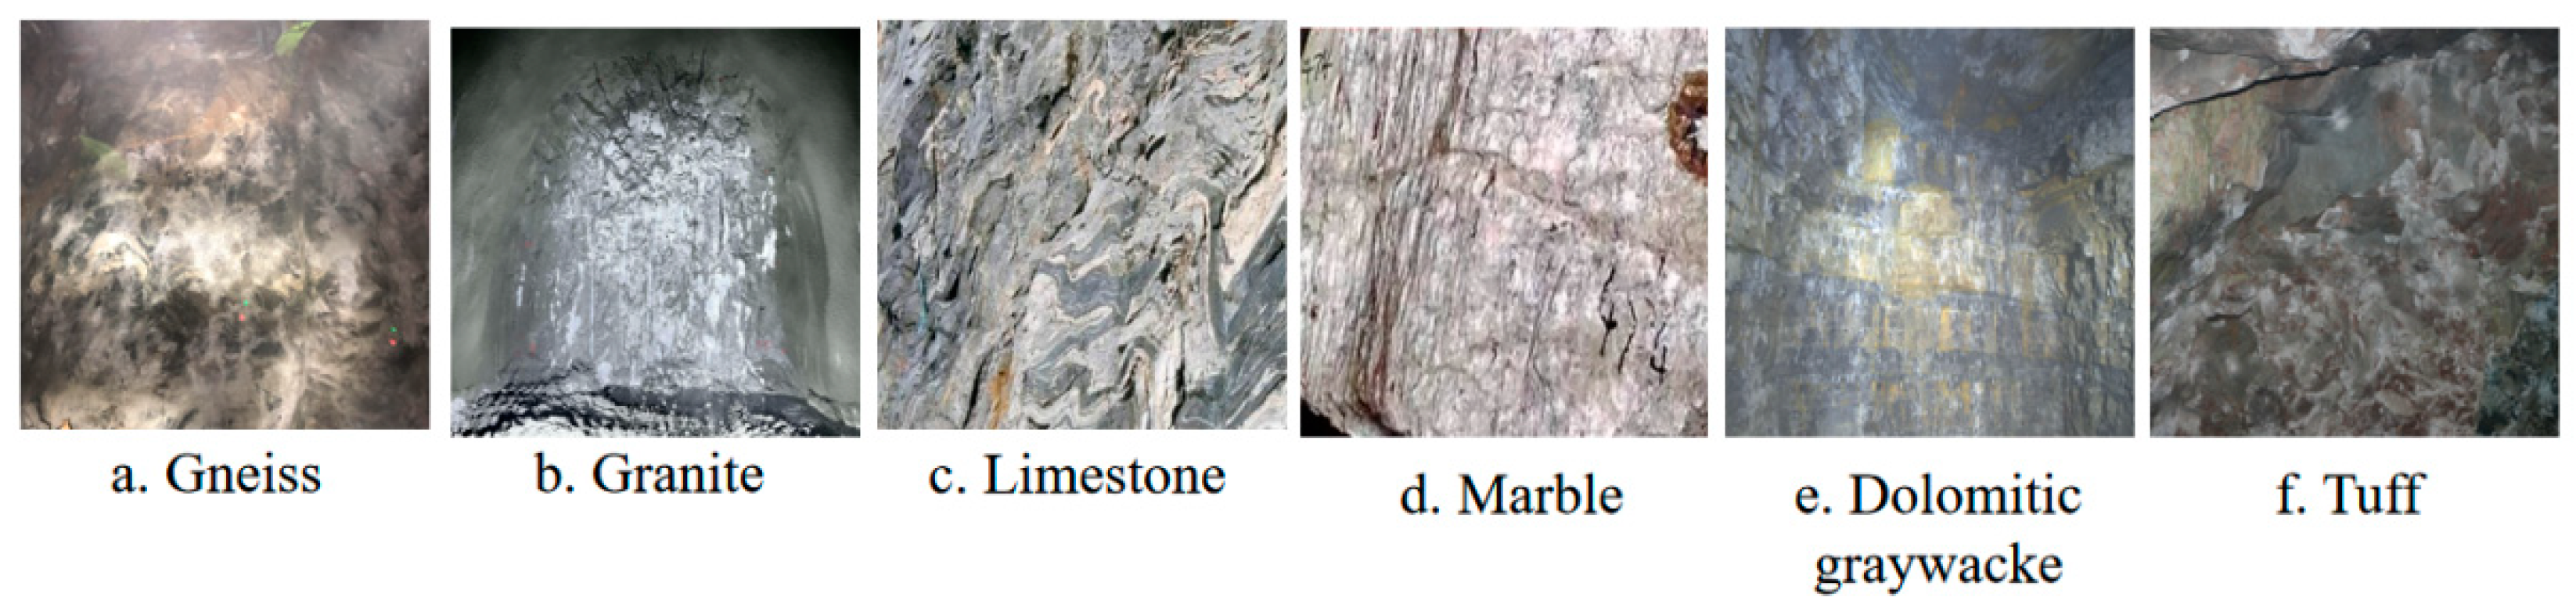
3.1. Experimental Dataset and Pre-Processing

The data utilized for model training in this study were gathered from the construction sites of four drill-and-blast tunneling projects in China, namely Kangding, Laolingang, Xingshandong, and Yigong Tunneling Districts. The geological profiles of the tunnel construction sites are illustrated in Figure 4. The dataset comprises six categories of rock image samples representing different lithologies, encompassing gneiss, granite, limestone, marble, dolomitic tuff, and tuff, amounting to a total of 632 images. The number of rock images in each category in the original dataset varies; for example, in this paper, data enhancement can not only expand the dataset, but also make the number of images in the six categories more evenly distributed. In this paper, random translation, random rotation, changing brightness, mirror flip, and other methods are used to enhance the rock images, and after enhancement, each category is expanded to 197 images (with the TUFF category, which has the largest amount of data, as the benchmark), totaling 1182 images. The detailed information of each category of rock images is shown in Table 3. The rock sample photos collected at the construction sites were randomly cropped to 256 × 256 pixels for consistent model training and testing [27]. Subsequently, the images were randomly partitioned into a training set, testing set, and validation set with a ratio of 7:2:1. Figure 5 exemplifies a rock sample image collected in the field.

3.2. Experimental Setup and Evaluation Metrics

The hardware platform used for model training is Intel (R) CoreTM i7-12700H@2.30GHz for CPU, 32 GB of RAM, and Nvidia RTX 3070Ti Laptop GPU for GPU. The software platform is Windows 11 operating system, the development language is Python, and the deep learning framework is Pytorch. The resolution of input image is 256 × 256, the batch size is 16, the total number of model iterations is 100 rounds, the initial learning rate is set to 0.001, the label smoothing [28] cross-entropy loss function is used to suppress overfitting, and the momentum stochastic gradient descent (SGD) optimizer is selected to update the weight parameters of the network. Cross-entropy loss (CEL) is used for the loss values.
The terms in the equation are defined as follows: TP represents the count of samples correctly identified as positive. FP signifies the count of negative samples incorrectly identified as positive. TN indicates the count of samples correctly identified as negative. FN denotes the count of positive samples incorrectly identified as negative. The relevant parameters of the base indicator are defined as shown in Table 4.
In this paper, four kinds of indexes, accuracy (ACC), precision (P), recall (R), and F1 score (F1), are chosen to evaluate the effect of rockiness recognition. The ACC is computed according to the formula presented in Equation (5).
A C C = T P + T N T P + T N + F P + F N
The precision rate P is calculated as Equation (6).
P = T P T P + F P
The recall rate R is calculated as Equation (7).
R = T P T P + F N
The F1 score represents the weighted average of P and R, and the formula is provided in Equation (8).
F 1 = 2 P × R P + R
The F1 score ranges from 0 to 1, where a value of 1 signifies the optimal model output, and 0 indicates the poorest model performance.

3.3. Ablation Experiments

This section aims to validate the efficacy of the proposed method. Ablation experiments are conducted to ascertain the enhancement brought by the improved CBAM and the FBDC module in the rockiness recognition task.

3.3.1. Ablation Experiment of Improved CBAM

To assess the optimization impact of the improved CBAM attention mechanism on network performance and determine the optimal CAM upscaling strategy, this study conducted five experiments with varied MLP settings. All experiments were based on the ResNet18 network and were cross-validated using different strategies. Model 2 integrates the CBAM into the original ResNet18 network. In experiments denoted as Models 3 to 5, the CBAM attention mechanism was upscaled to feature maps of sizes 1 × 1 × 3C, 1 × 1 × 4C, and 1 × 1 × 6C, respectively. Subsequently, the feature maps from different upscaling strategies were downscaled back to the size of 1 × 1 × C. The experiments employed the same rock dataset for both training and testing. The corresponding experimental results are presented in Table 5.
Analysis of the results presented in Table 2 reveals that Model 4 demonstrates the most effective upscaling of the feature map to a size of 1 × 1 × 4C. The classification accuracy exhibits notable improvements, with gains of 4.09%, 0.67%, 1.65%, and 0.65% compared to Model 1, Model 2, Model 3, and Model 5, respectively. The operation of upgrading the feature map proves beneficial in extracting detailed information from the rock images. However, excessively high upgrading dimensions may amplify background noise in the rock images, leading to a reduction in image recognition accuracy. In conclusion, the enhanced attention mechanism featuring shared neural network dimension upgrading to 1 × 1 × 4C is deemed optimal.

3.3.2. Ablation Experiments on the FBDC Module

To assess the feasibility and effectiveness of the FBDC module in the context of rockiness recognition, the following ablation experiments were conducted. Model 1 comprises only the backbone network without the inclusion of the improved CBAM and FBDC module. Building upon Model 1, Model 2 incorporates the improved CBAM. Subsequently, Model 3 enhances Model 2 by adding the FBDC module. All experiments were conducted and tested using the field collection dataset, and the corresponding experimental results are presented in Table 6. Lithology recognition visualizations are depicted in Figure 6.
Table 5 showcases the performance metrics, revealing that the highest accuracy achieved by the model in this study is 97.60%. This marks a significant improvement, with a 5.9% increase compared to Model 1 and a 1.61% increase compared to Model 2. The results indicate that both the improved CBAM and the FBDC module effectively enhance the network’s performance. Moreover, there is no exclusion or compatibility issue between the two modules. Their combined integration yields the network’s optimal performance. Additionally, the lithology identification visualization in Figure 6 illustrates that the FC-Res model proposed in this paper provides superior prediction results.

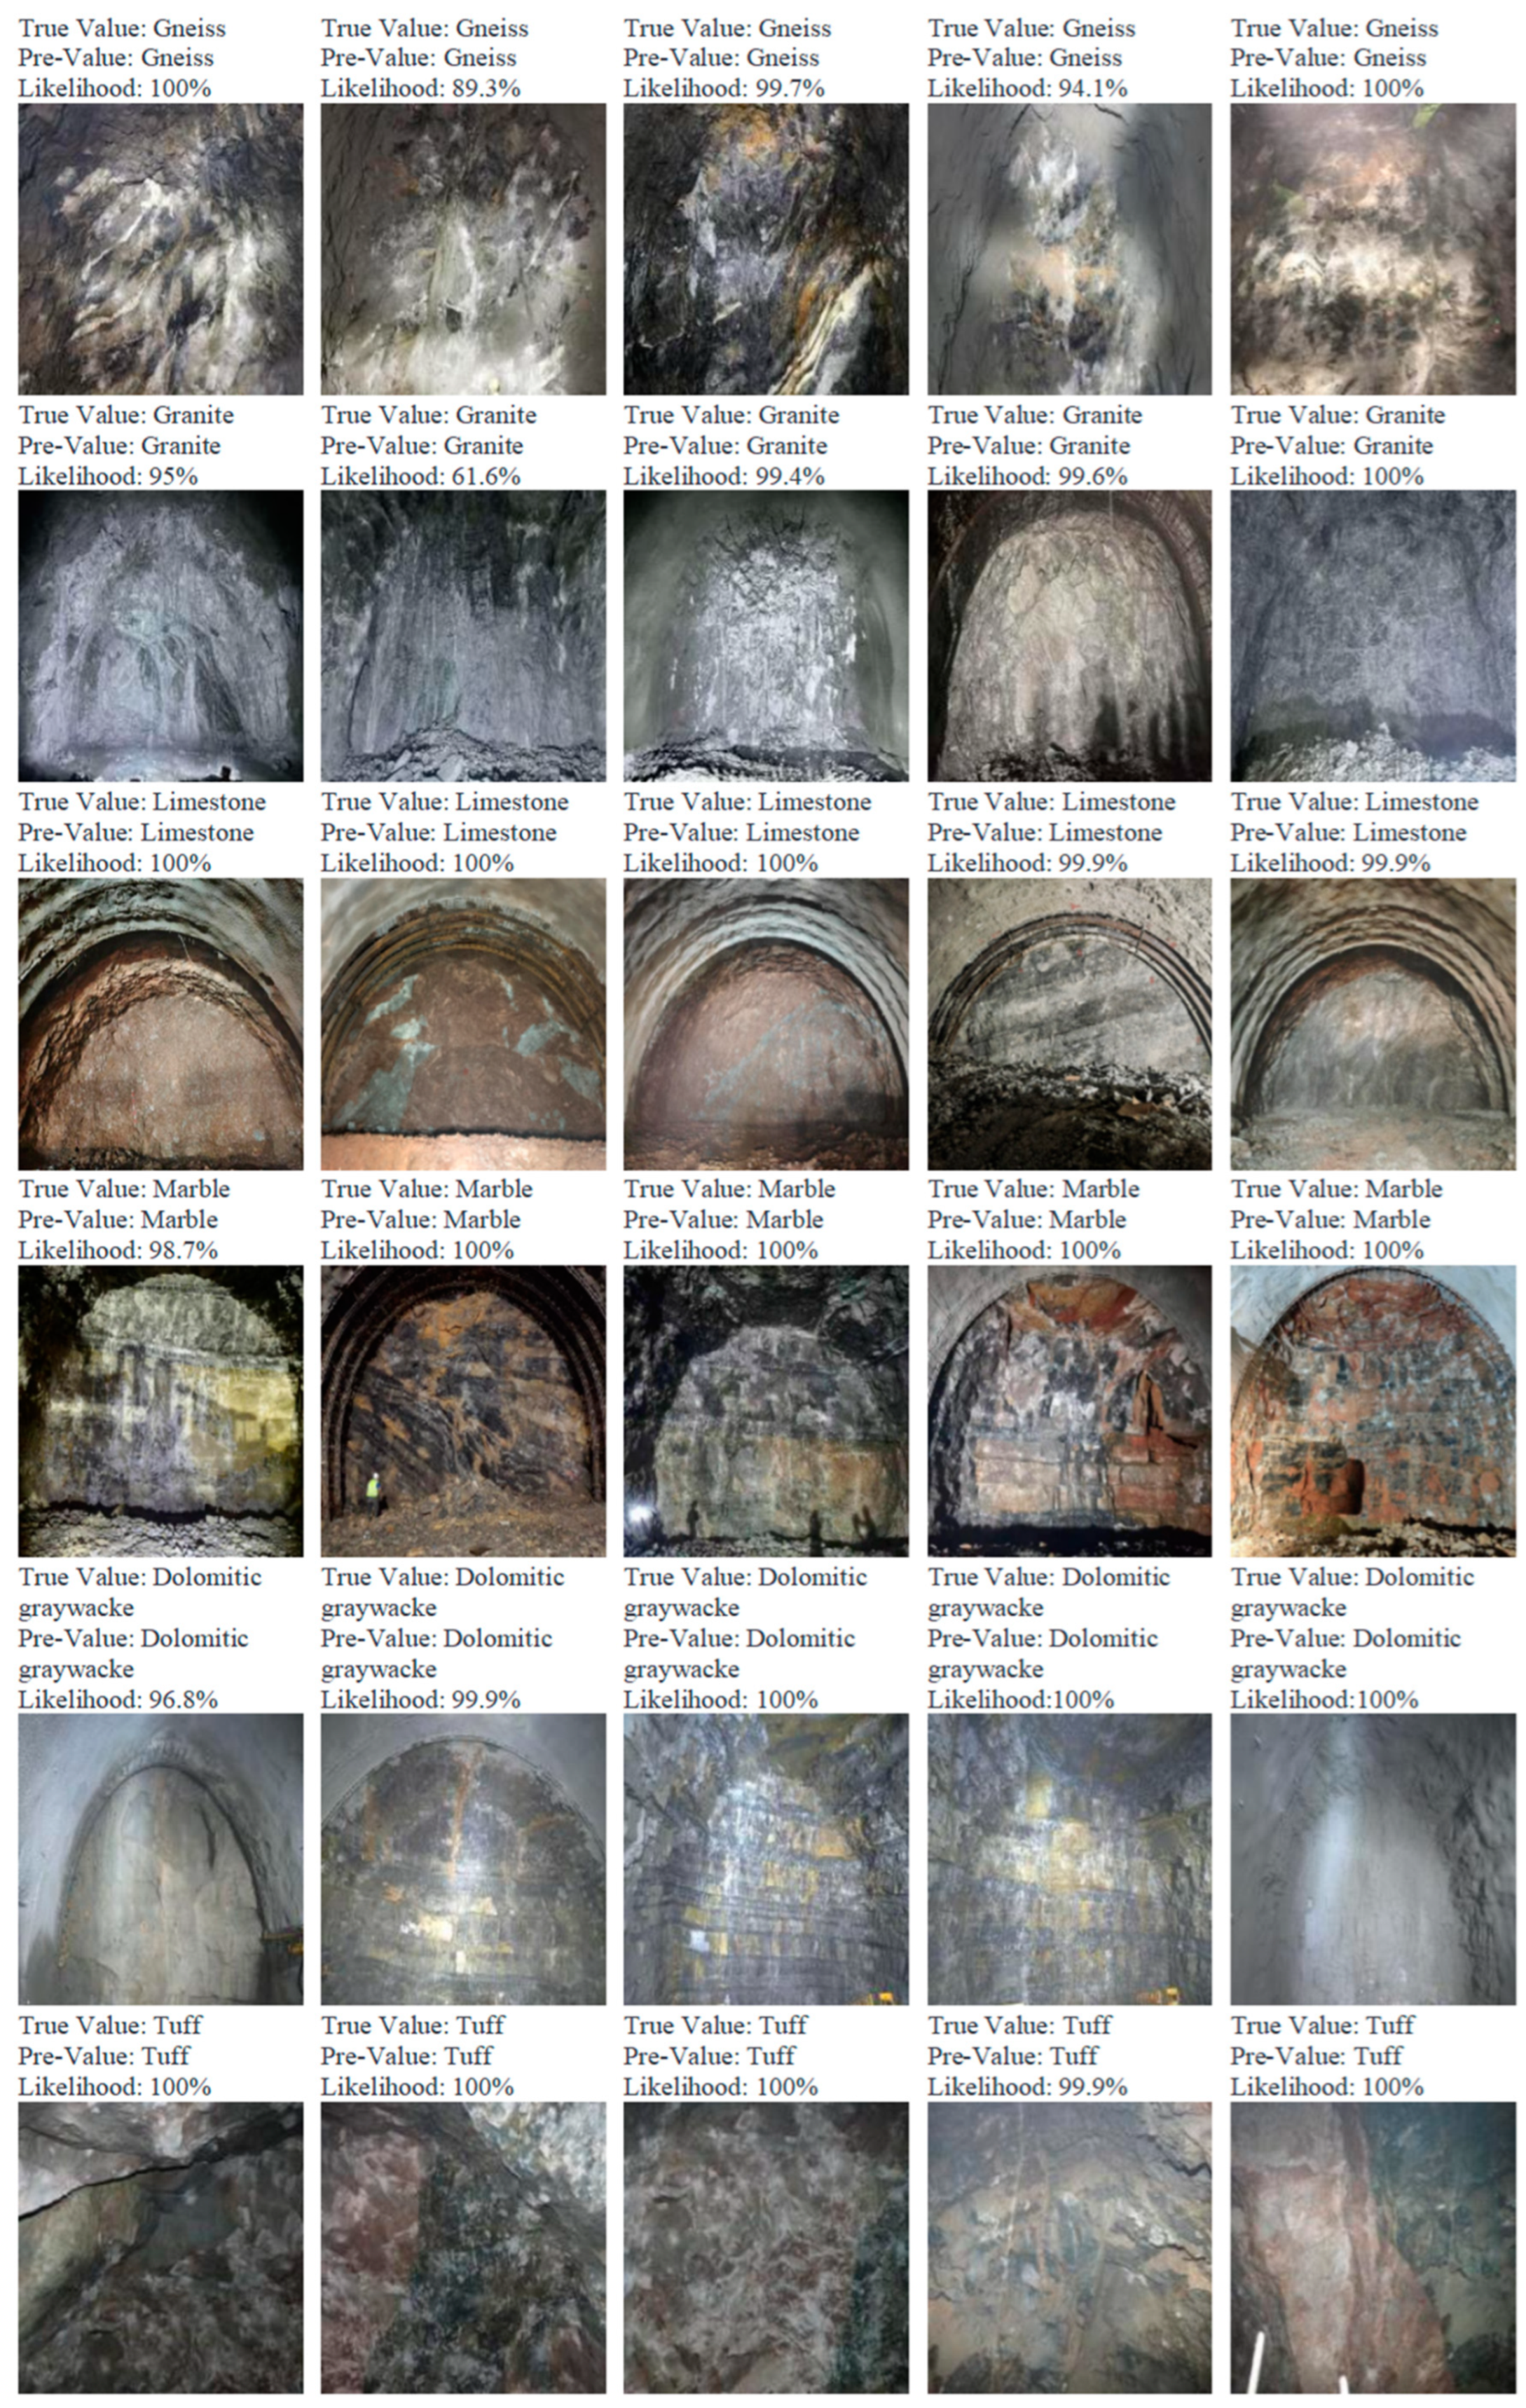
3.4. Model Performance Comparison and Analysis

In the realm of lithology analysis, the demand for robust and efficient models is imperative to precisely differentiate various rock types. Presently, mainstream lithology analysis algorithms encompass the ResNet series, which addresses the challenge of gradient vanishing during deep neural network training by introducing residual blocks. ResNet18 within the ResNet series exhibits a shallower network structure, rendering it suitable for resource-limited environments. In contrast, ResNet50 features a deeper network structure [29], demanding higher computational resources. The EfficientNet-B0 algorithm stands out for its heightened computational efficiency [30]. SENet [31], akin to ResNet in its fundamental structure, introduces an attention mechanism to enhance the network’s sensitivity to vital features. MobileNet-V3 [32], on the other hand, stands as a lightweight convolutional neural network tailored for mobile devices.
To gauge the efficacy of the proposed FC-Res model in rockiness recognition, this paper compares its algorithm against the original algorithms ResNet18, ResNet50, EfficientNet-B0, SENet, and MobileNet-V3, utilizing the same dataset for training. A comprehensive evaluation of model performance was conducted, considering Parameters, ACC, P, R, and F1. The experimental results are detailed in Table 7.
As indicated in Table 7, ResNet50 and SENet exhibit larger parameter quantities, whereas the FC-Res model has a parameter count of 135.15M, which is merely 49.8% and 43.8% of that of ResNet50 and SENet, respectively. Despite this reduction, the FC-Res model demonstrates an improvement in accuracy by 4.03% and 4.97% compared to ResNet50 and SENet, respectively. Conversely, ResNet18, EfficientNet-B0, and MobileNet-V3 models possess fewer parameters but exhibit lower classification accuracy. Notably, the FC-Res model outperforms EfficientNet-B0 and MobileNet-V3 models, showcasing an accuracy improvement of 8.44% and 8.37%, respectively.

4. Conclusions

Addressing the challenges posed by the insufficient tunnel rock face image samples and the limited accuracy of lithology recognition networks, this study enhances the efficiency and precision of rock recognition. Our approach involves the design of an improved Brownian distance covariance module to augment the attention to sample features and the mitigation of background interference through an enhanced CBAM attention mechanism. Numerous comparative experiments conducted on a rock tunnel rock face dataset collected from the field reveal that the FC-Res network yields the most favorable results in lithology recognition tasks. The proposed FC-Res lithology recognition network significantly enhances accuracy, precision, recall, and F1 score, surpassing the performance of current mainstream lithology recognition neural networks.
In future research endeavors, we aim to integrate the structural characteristics of rocks in various types of tunnel rock face images into the lithology recognition network design. This integration, coupled with an extensive dataset, will facilitate a more profound exploration of lithology recognition models that strike a balance between efficiency and precision.

Author Contributions

Conceptualization, D.Z., B.G. and S.L.; methodology, B.G. and D.Z.; software, B.G.; validation, D.Z. and Y.C.; formal analysis, S.L. and Y.C.; investigation, D.Z.; resources, B.G.; data curation, B.G.; writing—original draft preparation, D.Z.; writing—review and editing, D.Z., Y.C. and B.G.; visualization, S.L. and B.G.; supervision, B.G.; project administration, D.Z.; funding acquisition, S.L. All authors have read and agreed to the published version of the manuscript.

Funding

This research received no external funding.

Data Availability Statement

The data obtained in this study are openly available in https://pan.baidu.com/s/1BdT-K-N1CXPRKAeCYpEzcQ?pwd=tofh (accessed on 9 February 2024).

Conflicts of Interest

The authors declare no conflicts of interest.

References

  1. Li, S.C.; Xu, Z.H.; Huang, X.; Lin, P.; Zhao, X.C.; Zhang, Q.S.; Yang, L.; Zhang, X.; Sun, H.F.; Pan, D.D. Classification, geological identification, hazard mode and typical case studies of hazard-causing structures for water and mud inrush in tunnels. Chin. J. Rock Mech. Eng. 2018, 37, 1041–1069. [Google Scholar]
  2. Xu, Z.H.; Li, S.C.; Li, L.P.; Hou, J.G.; Sui, B.; Shi, S.S. Risk assessment of water or mud inrush of karst tunnels based on analytic hierarchy process. Rock Soil Mech. 2011, 32, 1757–1766. [Google Scholar]
  3. Huang, X.; Xu, Z.H.; Lin, P.; Liu, B.; Nie, L.C.; Liu, T.H.; Su, M.X. Identification method of water and mud inrush hazard-causing structures intunnel and its application. J. Basic Sci. Eng. 2020, 28, 103–122. [Google Scholar]
  4. Saporetti, C.M.; Fonseca, L.G.; Pereira, E.A. Lithology identification approach based on machine learning with evolutionary parameter tuning. IEEE Geosci. Remote Sens. Lett. 2019, 16, 1819–1823. [Google Scholar] [CrossRef]
  5. Xiong, Y.H. Research and Engineering Application of Intelligent Identification of Physical and Mechanical Properties of Geotechnical Materials; Chongqing University: Chongqing, China, 2022. [Google Scholar]
  6. Wang, Y. ; Research on Highway Engineering Tunnel Surrounding Rock Dynamic classification Based on Analysis of Rock’s Quality; Changsha University of Science &Technology: Changsha, China, 2017. [Google Scholar]
  7. Xu, S.T.; Zhou, Y.Z. Artificial intelligence identification of ore minerals under microscope based on deeplearning algorithm. Acta Petrol. Sin. 2018, 34, 3244–3252. [Google Scholar]
  8. Zhang, C.F.; Yu, J.; Hao, L.N.; Wang, S.J. Lithology extraction from synergies muti-scale texture and mutipectra images. Geol. Sci. Technol. Inf. 2017, 36, 236–243. [Google Scholar]
  9. Horrocks, T.; Holden, E.J.; Wedge, D. Evaluation of automated lithology classification architectures using highly-sampled wireline logs for coal exploration. Comput. Geosci. 2015, 83, 209–218. [Google Scholar] [CrossRef]
  10. Zhang, Y.; Li, M.C.; Han, S. Automatic Identification and Classification in Lithology Based on Deep Learning in Rock Images. Acta Petrol. Sin. 2018, 34, 333–342. [Google Scholar]
  11. Ren, W.; Zhang, S.; Qing, J.H.; Huang, J.M. The rock and mineral intelligence identification method based on deep learning. Geol. Rev. 2021, 67, 281–282. [Google Scholar]
  12. Bai, L.; Yao, Y.; Li, S.; Xu, D.; Wei, X. Mineral composition analysis of rock image based on deep learning feature extraction. China Min. Mag. 2018, 27, 178–182. [Google Scholar]
  13. Xu, Z.; Ma, W.; Lin, P.; Shi, H.; Liu, T.; Pan, D. Intelligent lithology identification based on transfer learning of rock images. J. Basic Sci. Eng. 2021, 29, 1075–1092. [Google Scholar]
  14. Zedong, M.; Lei, M.; Ke, L.; Wei, Y.; Peiding, W.; Xinyu, W. Multi-scale lithology recognition based on deep learning of rock images. Bull. Geol. Sci. Technol. 2022, 41, 316–322. [Google Scholar]
  15. Sun, C.; Xu, R.; Wang, C.; Ma, T.; Chen, J. Coal rock image recognition method based on improved clbp and receptive field theory. Deep. Undergr. Sci. Eng. 2022, 1, 165–173. [Google Scholar] [CrossRef]
  16. Qiu, D.H.; Fu, K.; Xue, Y.G.; Tao, Y.F.; Kong, F.M.; Bai, C.H. Tbm tunnel surrounding rock classification method and real-time identification model based on tunneling performance. Int. J. Geomech. 2022, 22, 04022070. [Google Scholar] [CrossRef]
  17. Liu, B.; Wang, J.; Yang, S.; Xu, X.; Ren, Y. Forward prediction for tunnel geology and classification of surrounding rock based on seismic wave velocity layered tomography. J. Rock Mech. Geotech. Eng. 2023, 15, 179–190. [Google Scholar] [CrossRef]
  18. Krizhevsky, A.; Sutskever, I.; Hinton, G.E. ImageNet classification with deep convolutional neural networks. Commun. ACM 2017, 60, 84–90. [Google Scholar] [CrossRef]
  19. Ioffe, S.; Szegedy, C. Batch normalization: Accelerating deep network training by reducing internal covariate shift. In Proceedings of the 32nd International Conference on Machine Learning, Lille, France, 6–11 July 2015; pp. 448–456. [Google Scholar]
  20. Woo, S.; Park, J.; Lee, J.Y.; Kweon, I.S. CBAM: Convolutional Block Attention Module; Computer Vision ECCV 2018; Springer International Publishing: Cham, Switzerland, 2018; pp. 3–19. [Google Scholar]
  21. Liu, C.; Wang, W.; Wang, M.; Lv, F.; Konan, M. An efficient instance selection algorithm to reconstruct training set for support vector machine. Knowl. Based Syst. 2017, 116, 58–73. [Google Scholar] [CrossRef]
  22. Szekely, G.J.; Rizzo, M.L.; Bakirov, N.K. Measuring and testing dependence by correlation of distances. Ann. Stat. 2007, 35, 2769–2794. [Google Scholar] [CrossRef]
  23. Zhang, J.J.; Wang, L.; Zhou, L.; Li, W. Beyond Covariance: SICE and Kernel based Visual Feature Representation. Int. J. Comput. Vis. 2020, 129, 300–320. [Google Scholar] [CrossRef]
  24. Chen, Y.; Liu, Z.; Xu, H.; Darrell, T.; Wang, X. Meta-baseline: Exploring simple meta-learning for few-shot learning. In Proceedings of the IEEE/CVF International Conference on Computer Vision, Montreal, BC, Canada, 11–17 October 2021; pp. 3–7. [Google Scholar]
  25. Davis, W.; Tang, L.M.; Bharath, H. Few-shot classification with feature map reconstruction networks. In Proceedings of the IEEE/CVF Conference on Computer Vision and Pattern Recognition, Nashville, TN, USA, 20–25 June 2021; pp. 1–8. [Google Scholar]
  26. Ye, H.J.; Hu, H.; Zhan, D.C.; Sha, F. Few-shot learning via embedding adaptation with set-to-set functions. In Proceedings of the IEEE/CVF Conference on Computer Vision and Pattern Recognition, Seattle, WA, USA, 13–19 June 2020; pp. 2–7. [Google Scholar]
  27. Hoyer, L.; Dai, D.; Wang, Q.; Chen, Y.; Gool, L.V. Improving semi-supervised and domain-adaptive semantic segmentation with self-supervised depth estimation. Int. J. Comput. Vis. 2023, 131, 2070–2096. [Google Scholar] [CrossRef]
  28. Wei, Y.; Liu, Q.; Zhang, G.; Peng, Y.; Shen, C. Label smoothing technique for ordinal classification in cloud assessment. In Proceedings of the 2020 IEEE International Geoscience and Remote Sensing Symposium (IGARSS), Waikoloa, HI, USA, 26 September–2 October 2020; pp. 2264–2267. [Google Scholar]
  29. Perry, K.; Campos, C. Panel segmentation: A python package for automated solar array metadata extraction using satellite imagery. IEEE J. Photovolt. 2023, 13, 208–212. [Google Scholar] [CrossRef]
  30. Tadepalli, Y.; Kollati, M.; Kuraparthi, S.; Kora, P. Efficientnet-b0 based monocular dense-depth map estimation. Trait. Du Signal 2021, 38, 1485–1493. [Google Scholar] [CrossRef]
  31. Luo, H.Y.; Li, Y.; Liu, H.; Ding, P.J.; Yu, Y.; Luo, L.Y. SENet: A deep learning framework for discriminating superand typical enhancers by sequence information. Comput. Biol. Chem. 2023, 105, 107905. [Google Scholar] [CrossRef] [PubMed]
  32. Li, Y.D.; Ma, X.H.; Wang, J. Pineapple Maturity Analysis in Natural Environment Based on MobileNet V3-YOLOV4. Smart Agric. 2023, 5, 35–44. [Google Scholar]
Figure 1. The overall architecture diagram of the FC-Res network model.
Applsci 14 01501 g001
Figure 2. ResNet18 backbone network.
Applsci 14 01501 g002
Figure 3. Improved CBAM.
Applsci 14 01501 g003
Figure 4. Images of the excavation of the construction tunnel site.
Applsci 14 01501 g004
Figure 5. Image example of a rock sample.
Applsci 14 01501 g005
Figure 6. Visualization results of lithology identification.
Applsci 14 01501 g006
Table 1. RImprove network structure parameters.
Layer TypeOutput SizeLayer TypeOutput Size
Conv64 × 128 × 128Res_a3256 × 16 × 16
MaxPool64 × 64 × 64Res_b3256 × 16 × 16
Res_a164 × 64 × 64Improved CBAM256 × 16 × 16
Res_b164 × 64 × 64Res_a4512 × 8 × 8
Improved CBAM64 × 64 × 64Res_b4512 × 8 × 8
Res_a2128 × 32 × 32ConvAvgPool512 × 1 × 1
Res_b2128 × 32 × 32FBDC512 × 1 × 1
Improved CBAM128 × 32 × 32Conv6 × 1 × 1
Table 2. Comparison table of matrix calculation parameters.
ParametersSignificance
hHigh
wWide
dNumber of feature channels
A ˜ Square Euclidean distance matrix
A ^ Euclidean distance matrix
ABDC matrix
IUnit matrix
Hadamard product
kCategorical quantity
Table 3. Distribution of the number of rock images.
Rock TypeNumber of Pictures
Gneiss94
Granite123
Limestone91
Marble85
Dolomitic graywacke42
Tuff197
Table 4. Basic indicator definition.
Confusion MatrixPrediction Value
PositiveNegative
True valuePrediction correctTPFN
Prediction incorrectFPTN
Table 5. Performance analysis of CBAM model under different dimension-increasing strategies.
ModelStrategy of UpgradingFeature Map SizeTraining
ACC/%
Testing ACC/%
1No CBAM added——92.6391.70
2CBAM1 × 1 × C/295.3795.12
31 × 1 × 31 × 1 × 3C95.5494.14
41 × 1 × 41 × 1 × 4C96.6095.79
51 × 1 × 61 × 1 × 6C95.3395.14
Text in bold indicates optimal indicators.
Table 6. Results of FBDC module ablation experiments.
ModelResnet18Improved CBAMFBDCTraining
ACC/%
Testing
ACC/%
1 92.6391.70
2 96.6095.79
FC-Res97.9697.60
Text in bold indicates optimal indicators.
Table 7. Comparison of rock recognition performance of different network models.
ModelParameters/MACC/%P/%R/%F1/%
ResNet18117.4591.7089.9488.7189.32
ResNet50235.4793.5793.7593.3393.54
EfficientNet-B078.2889.1687.2888.2387.75
SENet267.9192.6392.8692.1692.51
MobileNet-V334.8289.2386.8986.1186.50
Ours135.1597.6097.4397.4697.44
Text in bold indicates optimal indicators.
Disclaimer/Publisher’s Note: The statements, opinions and data contained in all publications are solely those of the individual author(s) and contributor(s) and not of MDPI and/or the editor(s). MDPI and/or the editor(s) disclaim responsibility for any injury to people or property resulting from any ideas, methods, instructions or products referred to in the content.

