Article

Quasi-Static Test and Lateral Load-Bearing Capacity of a New Grid Pile Foundation for Long-Span Bridges

1
Faculty of Engineering, China University of Geosciences (Wuhan), Wuhan 430074, China
2
China Railway Construction Investment Group Co., Ltd., Beijing 100855, China
3
Anhui Construction Engineering Investment Group Co., Ltd., Hefei 230000, China
*
Authors to whom correspondence should be addressed.
Appl. Sci. 2024, 14(3), 1209; https://doi.org/10.3390/app14031209
Submission received: 16 November 2023 / Revised: 11 January 2024 / Accepted: 29 January 2024 / Published: 31 January 2024
(This article belongs to the Special Issue Recent Advances in Tunneling and Underground Space Technology)

Abstract

:
This study proposes a new form of underground diaphragm wall foundation with hexagonal sections, called the grid pile foundation (GPF), which is used for long-span bridges. To investigate the lateral bearing capacity characteristics of the integrated pile foundation, the quasi-static test as well as numerical simulations were conducted. Firstly, the quasi-static test was conducted to obtain the lateral load–displacement curve, the soil pressure distribution, and the deformation and stress distribution of the pile foundation and the surrounding soil. Then, the finite element model of the proposed GPF foundation was built, which was verified and calibrated based on the test data. Finally, the parametric analysis was performed to investigate the effects of soil friction angle, pile foundation Young’s modulus, and pile length on the lateral bearing capacity characteristics of the proposed GPF. It is concluded that the GPF would transition from the stiffness stage to the plastic strain stage under lateral load, and deformation occurred simultaneously. The stress in the soil around the pile foundation is high in the upper portion and low in the lower portion, and the active and passive failure zones of the soil are formed under the action of the GPF. Both experimental and numerical simulations indicate that the GPF has a good lateral load capacity, and the lateral load capacity is most affected by the length of the piles. The GPF is expected to provide a new solution to the construction of large-span bridges with diaphragm wall foundations.

1. Introduction

The concept of an underground continuous wall foundation refers to the utilization of interconnected rigid walls to form a closed-frame structure, with a top slab cast as the supporting platform [1]. The underground continuous wall foundation offers advantages such as high load-bearing capacity, excellent integrity, cost-effectiveness, and good compatibility with the foundation [2,3,4]. It has been successfully employed in the construction of large-span bridges, including the Pearl River Huangpu Bridge, Nanjing Fourth Bridge, Wuhan Yingwuzhou Bridge, and Wuhan Yangsigang Bridge [5].
With the increasing application of underground continuous wall foundations in practical engineering, numerous scholars have conducted in-depth research on the load-bearing characteristics of such foundations [6,7,8,9,10,11,12,13]. Wu et al. [14] conducted scaled-down model tests with a similarity ratio of 1:30 to investigate the vertical load-bearing capacity of different underground continuous wall foundations in soft soil. The results indicated that the ultimate bearing capacity of the grid-type continuous wall increases with the number of cells. Tang et al. [15] studied the load-bearing performance of honeycomb piles under different geological conditions using finite element analysis software ABAQUS and the Monte Carlo algorithm. The results showed that the internal frictional resistance of the honeycomb pile foundation followed an exponential distribution along the depth, while the external frictional resistance approximately followed a triangular distribution along the depth. Wen et al. [16] conducted vertical load model tests on rectangular closed-loop underground continuous walls to study the load distribution of the foundation slab. It is found that the maximum soil reaction is located at the corners of the slab. Dai et al. [17] performed lateral static load tests on single-hole closed-loop walls with different cross-sectional sizes to study the lateral load-bearing characteristics of closed underground continuous wall foundations.
Although significant progress has been made in the research on the load-bearing characteristics of underground continuous wall foundations, the current studies mainly focus on the vertical load-bearing capacity of rectangular grid-type foundations [18,19,20,21,22,23]. There is relatively less research on the lateral load-bearing characteristics of underground continuous wall foundations with irregular cross-sections. Irregular cross-section underground continuous wall foundations possess advantages such as high overall stiffness and uniformity and offer convenient construction. Furthermore, they can be adjusted and combined to form composite sections with enhanced applicability, as shown in Figure 1, meeting practical engineering requirements for large-span bridges [24].
In light of this, this paper presents a novel underground continuous wall foundation with a hexagonal cross-section called the grid pile foundation (GPF). The objective is to investigate the lateral load-bearing characteristics of the GPF by conducting quasi-static tests to analyze the force–displacement curves, distribution, and variation of soil pressure on the foundation soil under lateral loading. Subsequently, the accuracy of the finite element model is validated using experimental data. Furthermore, a parametric analysis is performed to study the influence of variations in soil friction angle, pile modulus of elasticity, and pile length on the lateral load-bearing characteristics of the GPF. The lateral stiffness of the proposed GPF was compared with widely used pile foundations. The theoretical foundation and data support provided in this study are essential for the practical implementation of the GPF in engineering applications.

2. Experimental Study

To investigate the lateral load-bearing characteristics of the GPF, a scaled-down model of a single-cell GPF was designed and fabricated based on the geometric scale ratio of 1:30. After scaling, the GPF in the model has a hexagonal shape with a side length of 20 cm and a total length of 90 cm, derived from a prototype GPF with dimensions of 6 m in side length and 30 m in overall length. The dimensions of the model were chosen to ensure the rationality of the indoor testing setup. The load and deformation characteristics of the GPF and the surrounding soil under lateral static loads are investigated by conducting the quasi-static test on the scaled-down model [25]. This analysis aims to explore the lateral loading mechanisms of the GPF.

2.1. Model Setup

The soil chosen for the study is the typical Wuhan sand, with composition percentages of 70% sand, 25% silt, and 5% clay. The soil was meticulously layered and compacted in a sealed test pit measuring 200 cm × 200 cm × 160 cm, enclosed by sealing panels. Rigorous control was exercised over the compaction density of each soil layer to guarantee the desired strength and deformation characteristics of the soil. This meticulous approach aimed to achieve uniformity across the entire soil mass. During the filling process, the compaction density of each soil layer was measured using the ring knife method, while the moisture content of the soil was determined using the oven-drying method. To ensure the quality and uniformity of the filling process, static cone penetration tests (CPT) were conducted on the soil before and after saturation [26]. The test results indicated good overall uniformity of the soil, with an average density of 1.78 g/cm3. The experimental model of the GPF utilized in this study was constructed from organic glass with a consistent thickness of 40 mm. The pile cap employed a steel adjustable pile diameter assembly model for the footing, as illustrated in Figure 2. During the experiment, the GPF was fixed to the footing using bolts, while the pile cap had high strength and could be considered rigid for this experiment [27].
As shown in Figure 3, the soil was layered and filled within a steel test pit with a dimension of 200 cm × 200 cm × 160 cm. The test pit was partitioned into four evenly sized zones, where the soil was meticulously layered and compressed to guarantee a consistent distribution across each zone. The total height of the soil box is 150 cm, with the GPF embedded at a depth of 80 cm. After installing the GPF, the pile cap is securely connected to the GPF using slots and bolts, ensuring a stable foundation connection.
The loading system used in the experiment employs the MTS Large-Scale Servo Static Loading System, located in the Structural Building of China University of Geosciences (Wuhan). The loading system consists of a 25-ton actuator, reaction steel beam, hydraulic pump, and MTS specialized control software. To monitor the variation of lateral stress in the soil, a certain number of soil pressure cells are installed within the soil. These cells are designed to measure real-time lateral stress parameters during the experiment.
The displacement sensor in the MTS loading system’s actuator enables real-time monitoring of the displacement at the top of the pile throughout the entire loading process. These data are recorded for subsequent analysis. For the measurement of lateral stress in the soil, DYMH-106 miniature soil pressure cells are used. Before the experiment, these pressure cells are calibrated and then placed and compacted in each soil layer to ensure good compaction and prevent any issues with poor compaction [28]. The depths at which the soil pressure cells are installed are 20 cm, 40 cm, 70 cm, 90 cm, and 110 cm. The soil pressure cells inside the pile are placed at the center position of the pile foundation, while the cells outside the pile are placed at lateral distances of 5 cm, 17 cm, and 39 cm from the pile body. Additionally, to consider the edge effect, one soil pressure cell is placed at a distance of 5 cm from the side of the model box, at a depth consistent with the distribution of the soil pressure cells near the pile foundation.
The experimental setup involves lateral static loading, where the GPF is subjected to both vertical and lateral loads. The arrangement of the MTS actuator and data acquisition system is shown in Figure 4. A vertical actuator applies a constant vertical force of 5 kN at the top of the GPF to simulate the axial loading of the superstructure on the pile foundation. The lateral actuator applies a lateral load on top of the steel footing, simulating the lateral load. The lateral load is applied in a unidirectional and linear manner through displacement control. To represent the low-frequency nature of practical loads such as wind, waves, and currents, the loading frequency is set to 0.033 Hz to avoid dynamic effects [29]. The total amplitude of lateral displacement is set at 60 mm. Table 1 and Figure 5 delineate the loading protocol based on displacement control, comprising three cycles for each designated target displacement. At each level of loading, the load is applied until the readings from the vibrating sensor stabilize. The experiment utilizes the real-time data acquisition capabilities of the MTS system, with a sampling frequency of 4 Hz, to collect data from various sensors throughout the entire experimental process.

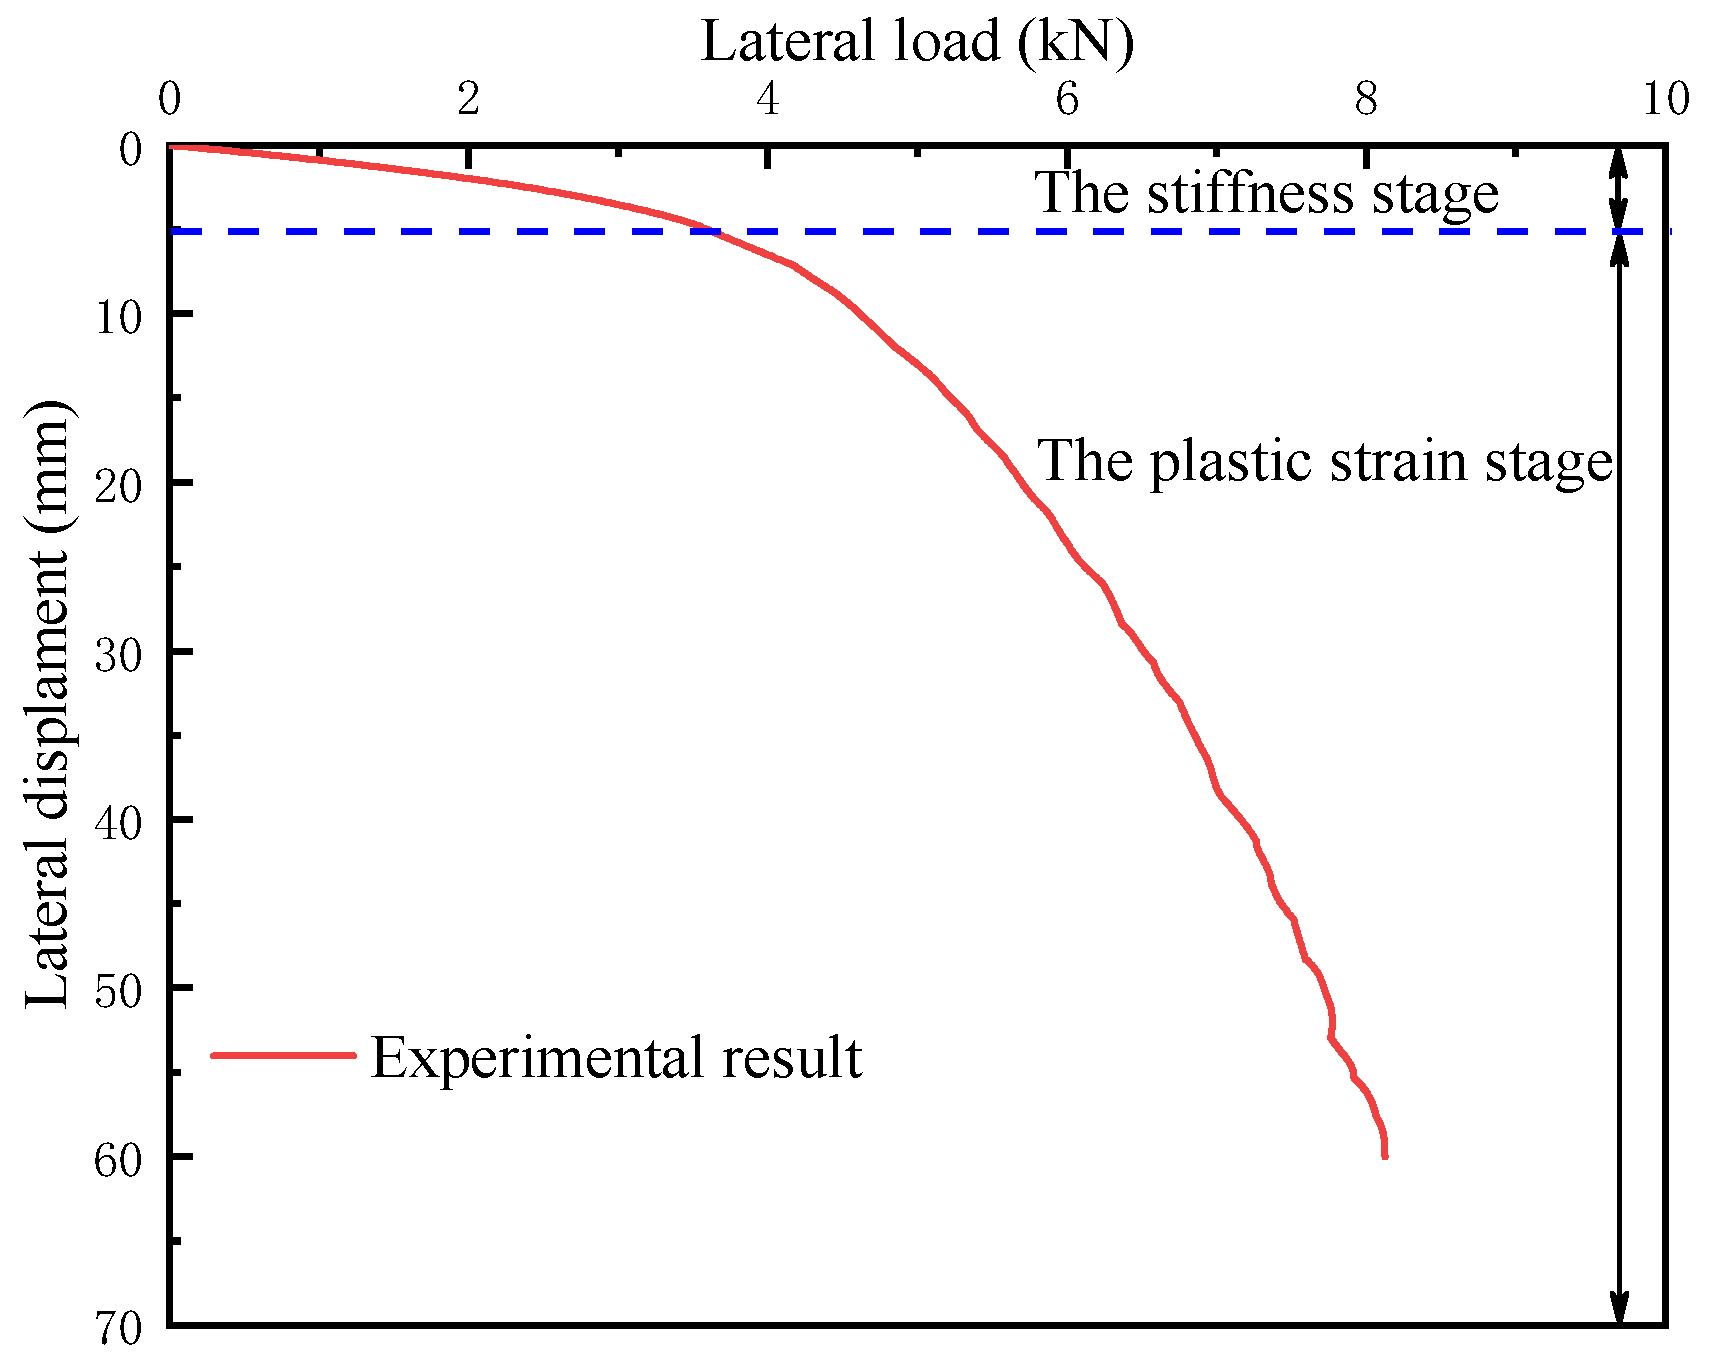
2.2. Load Displacement Response

The load–displacement curve is a graphical representation of the relationship between the displacement of a structure and the corresponding applied load. It provides a visual depiction of the effects of the load on the structure [30]. In the case of the lateral static loading test, the load–displacement curve for the lateral load is shown in Figure 5. The linear displacement load generated by the lateral actuator starts from 0 mm and increases gradually by 10 mm at each level of loading until reaching 60 mm, at which point the loading is stopped. The loading curve displays nonlinearity, with an overall trend characterized by a steep drop. When the lateral displacement reaches 60 mm, the magnitude of the lateral load is approximately 8 kN. The loading curve can be roughly divided into two stages: the stiffness stage from 0 mm to 5 mm displacement and the plastic strain stage from 5 mm to 60 mm displacement. In the stiffness stage, the lateral displacement of the GPF shows a linear relationship with the lateral load, increasing from 0 mm to around 5 mm, while the lateral load increases from 0 kN to approximately 3.7 kN in a uniform manner. During this stage, the GPF undergoes slight deformation, and the soil in front of the pile slightly bulges, with no significant separation observed between the GPF and the soil. In the plastic strain stage, the displacement load increases from 5 mm to 60 mm, and the lateral load continues to increase but at a reduced rate. In the later stage of loading, the curve reaches a plateau. During this stage, relative sliding is observed between the GPF and the soil, cracks emerge at the rear in the loading direction, and the front end of the soil bulges, with a portion of the GPF being embedded in the soil.
It is also shown in Figure 6 that at the end of the stiffness stage, the soil surrounding the GPF has reached the plastic yield critical state, while the GPF itself remains in the elastic stage. In the plastic strain stage, the soil enters the plastic yield stage and undergoes deformation, while the GPF continues to deform, either in the elastic stage or transitioning into the plastic stage. Throughout the loading process, the GPF exhibits superior lateral bearing performance.

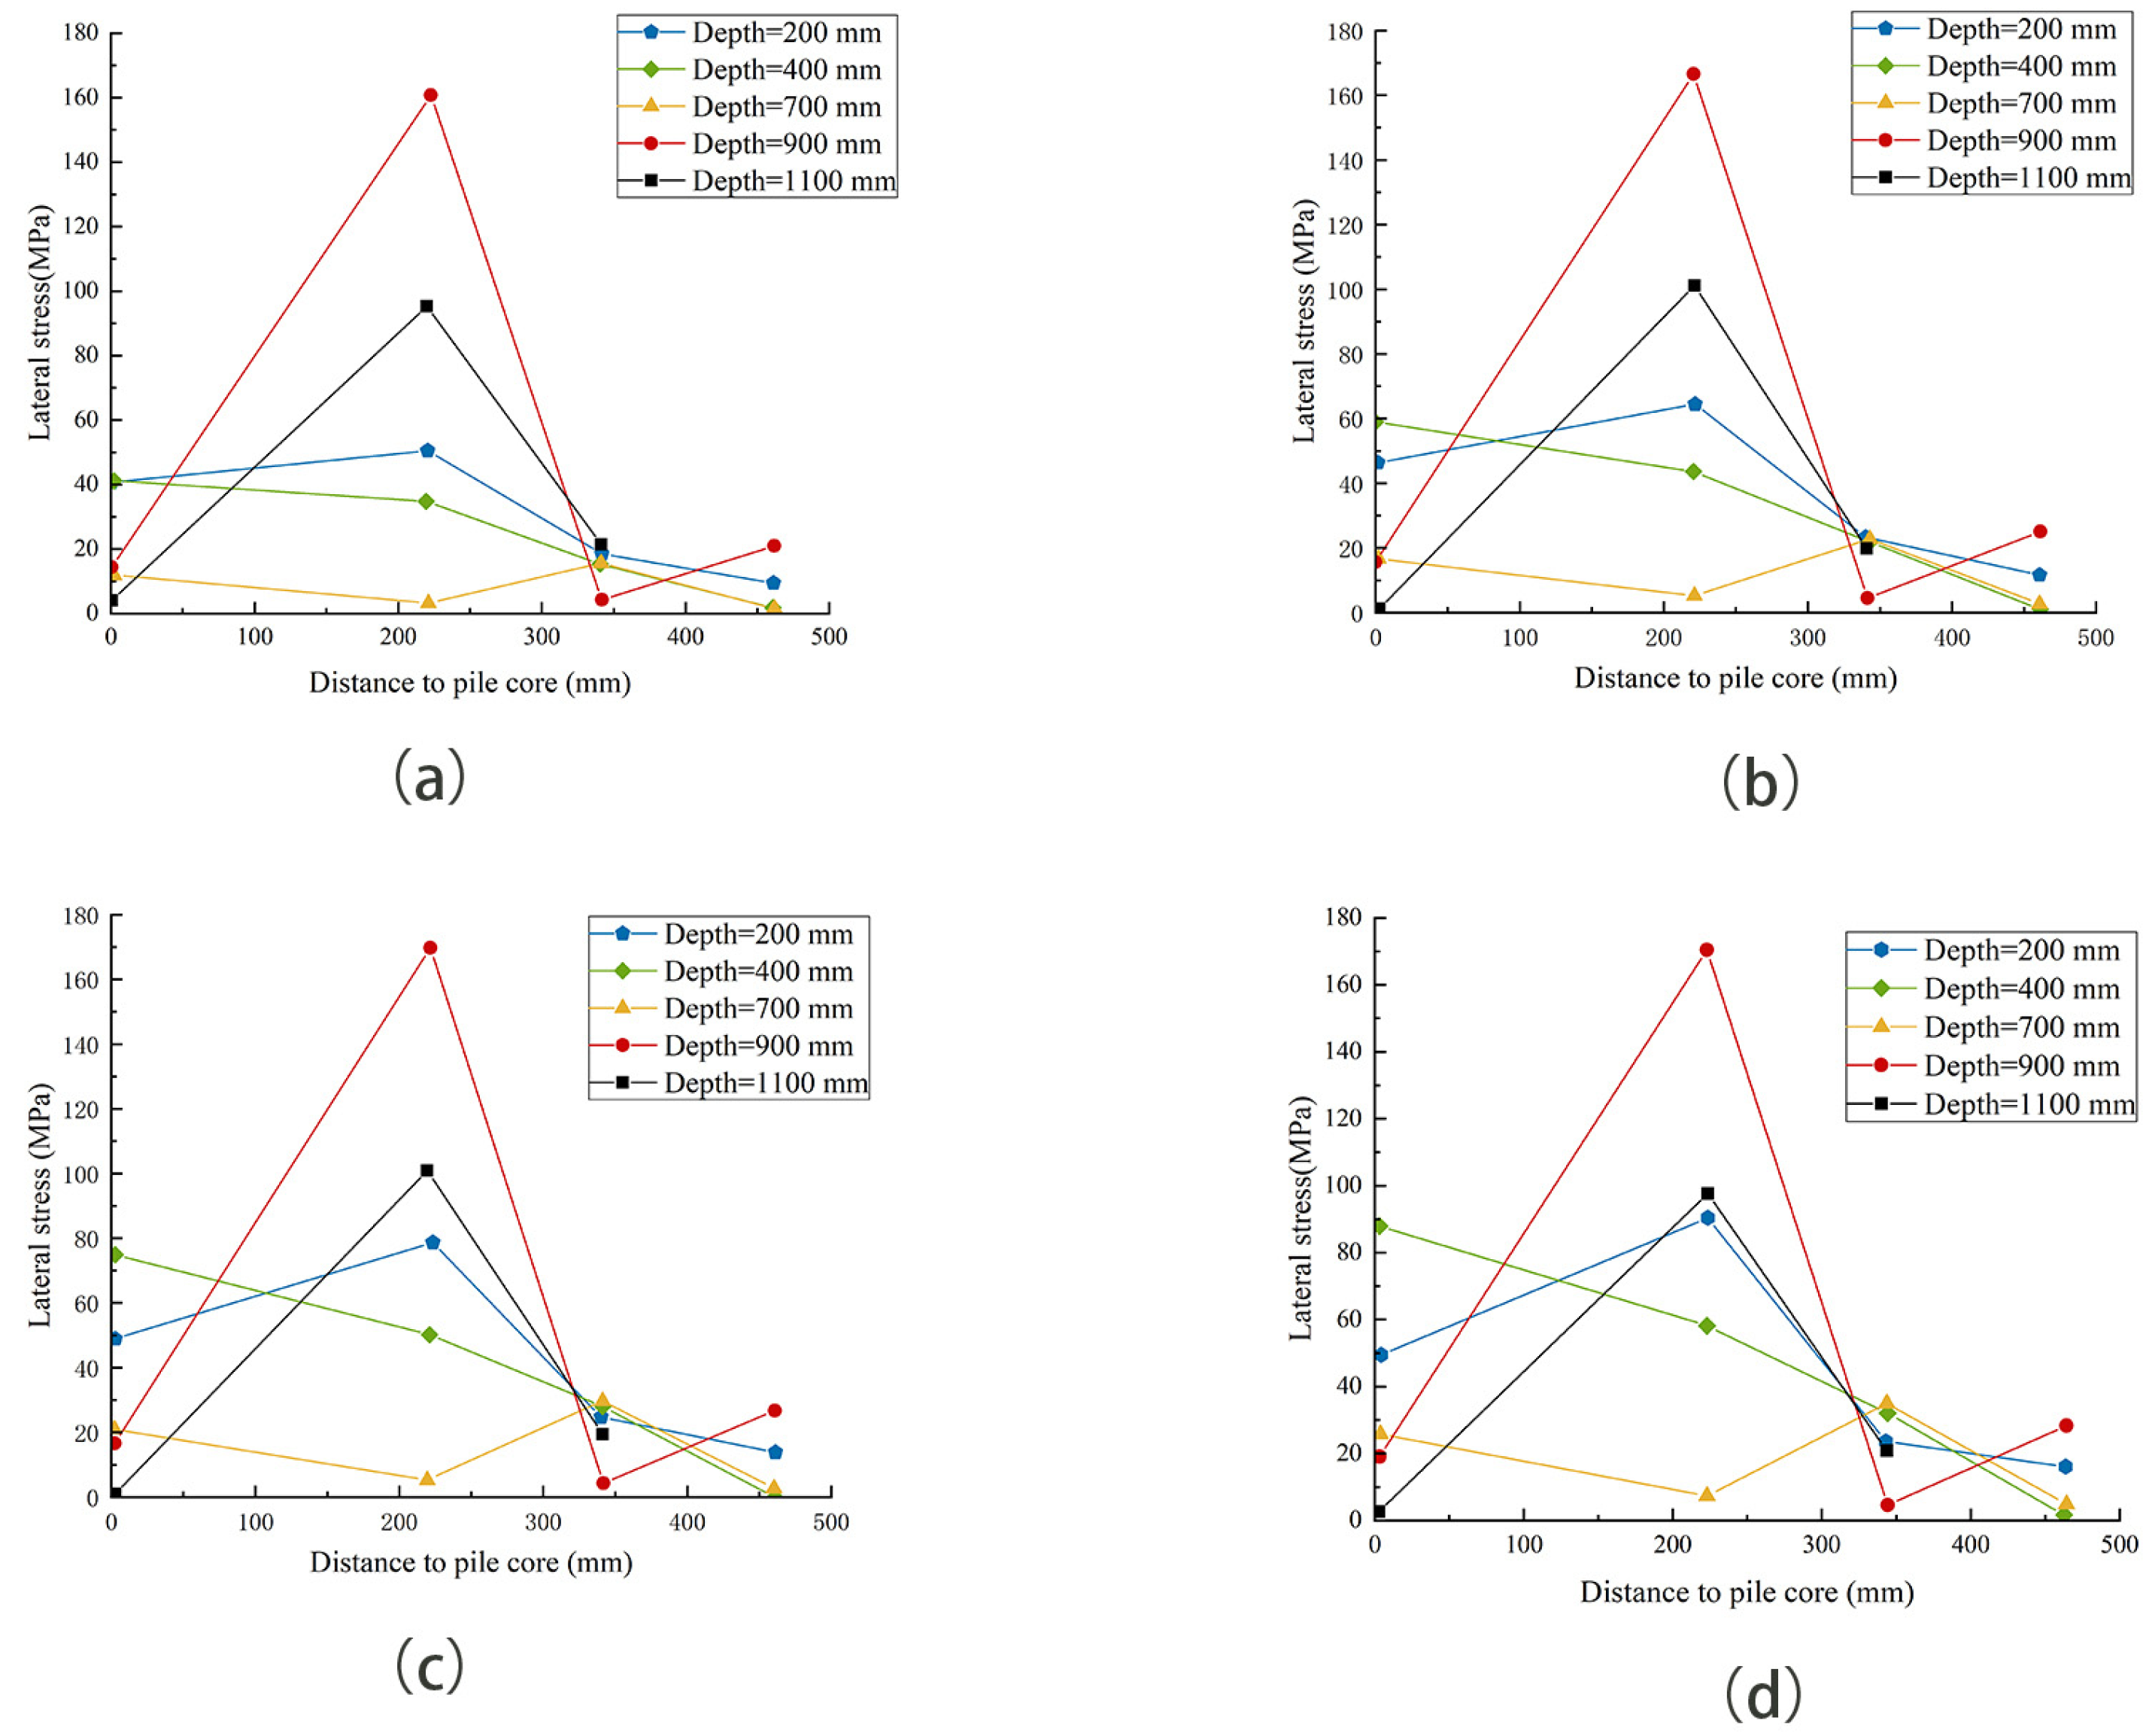
2.3. Soil Pressure Pattern

The failure mechanisms of the soil around the pile are closely related to the interaction between the pile and the soil [31]. To investigate the variation of lateral stresses in the soil during the loading process, lateral stresses at different depths and distances from the pile axis were measured at lateral displacements of 15 mm, 30 mm, 45 mm, and 60 mm from the loading point. The lateral stress values were plotted against depth to study the stress variation in the soil at different locations and depths during the loading process [32].
Figure 7 illustrates the lateral stresses of the soil at four different loading stages during the loading process. The lateral distance from the pile axis is represented on the x-axis, while the lateral stress is represented on the y-axis. Different colors of the curves indicate different depths. The position of 0 mm represents the pile core, and the position of 20 mm represents the pile shaft. Distances greater than 20 mm from the pile axis indicate the soil outside the pile. The analysis reveals that the stress in the pile core soil is higher at the top and lower at the bottom under the same load conditions. The stress in the middle portion of the pile core remains consistently high, while the stress at the pile base remains nearly unchanged. This indicates that during the loading process, the upper part of the pile experiences bending deformation, resulting in higher stress in the upper pile core due to compression from the pile shaft. On the other hand, the lower part of the pile undergoes smaller deformation due to deeper embedment, resulting in lower stress in the middle and lower portions of the surrounding soil. The lateral stresses in the soil near the pile shaft exhibit a higher value at the bottom and a lower value at the top. After a lateral displacement of 15 mm, the stress at the pile base remains almost constant, indicating that the soil at the pile base has already yielded. However, the lateral stresses in the surface soil do not show significant yielding as the displacement increases. This is because as the displacement at the top of the pile increases, the internal soil experiences significant disturbance and damage, following the movement of the pile. The soil located 35 mm away from the pile axis and at the lower portion of the pile base can be considered as representing the soil at a greater distance from the actual pile foundation. During the loading process, the stress variation in this part of the soil is not significant, which is consistent with the actual conditions.
At the same position and loading stage in the soil, the area with the greatest variation in lateral stress with depth is located at a distance of 22 cm from the pile axis. This area represents the soil surrounding the pile foundation that is most affected by the presence of the cellular structure of the pile. On the other hand, the soil at the pile core and slightly farther from the pile base, towards the outer side, undergoes comparatively smaller changes in lateral stress. Meanwhile, the soil pressure near the steel test pit is approximately 0.5 MPa and remains almost unchanged, suggesting that the lateral load-bearing capacity of the GPF is not affected by the boundary.

3. Numerical Study

The previously mentioned experiment investigated the correlation between lateral force and displacement in the context of cellular structure piles subjected to lateral loads. It also studied the bearing characteristics of the cellular structure piles under lateral loading through the soil stress curves. To further investigate the lateral bearing mechanism of the cellular structure piles and explore the influence of soil friction angle, pile shaft Young’s modulus, and pile length on the lateral bearing characteristics, this section establishes a numerical model that is proportionally scaled to the experimental piles for verification analysis. Additionally, finite element models are established with different soil friction angles, Young’s moduli of the pile shaft, and pile lengths to analyze the effects of these parameters on the lateral bearing performance [33].

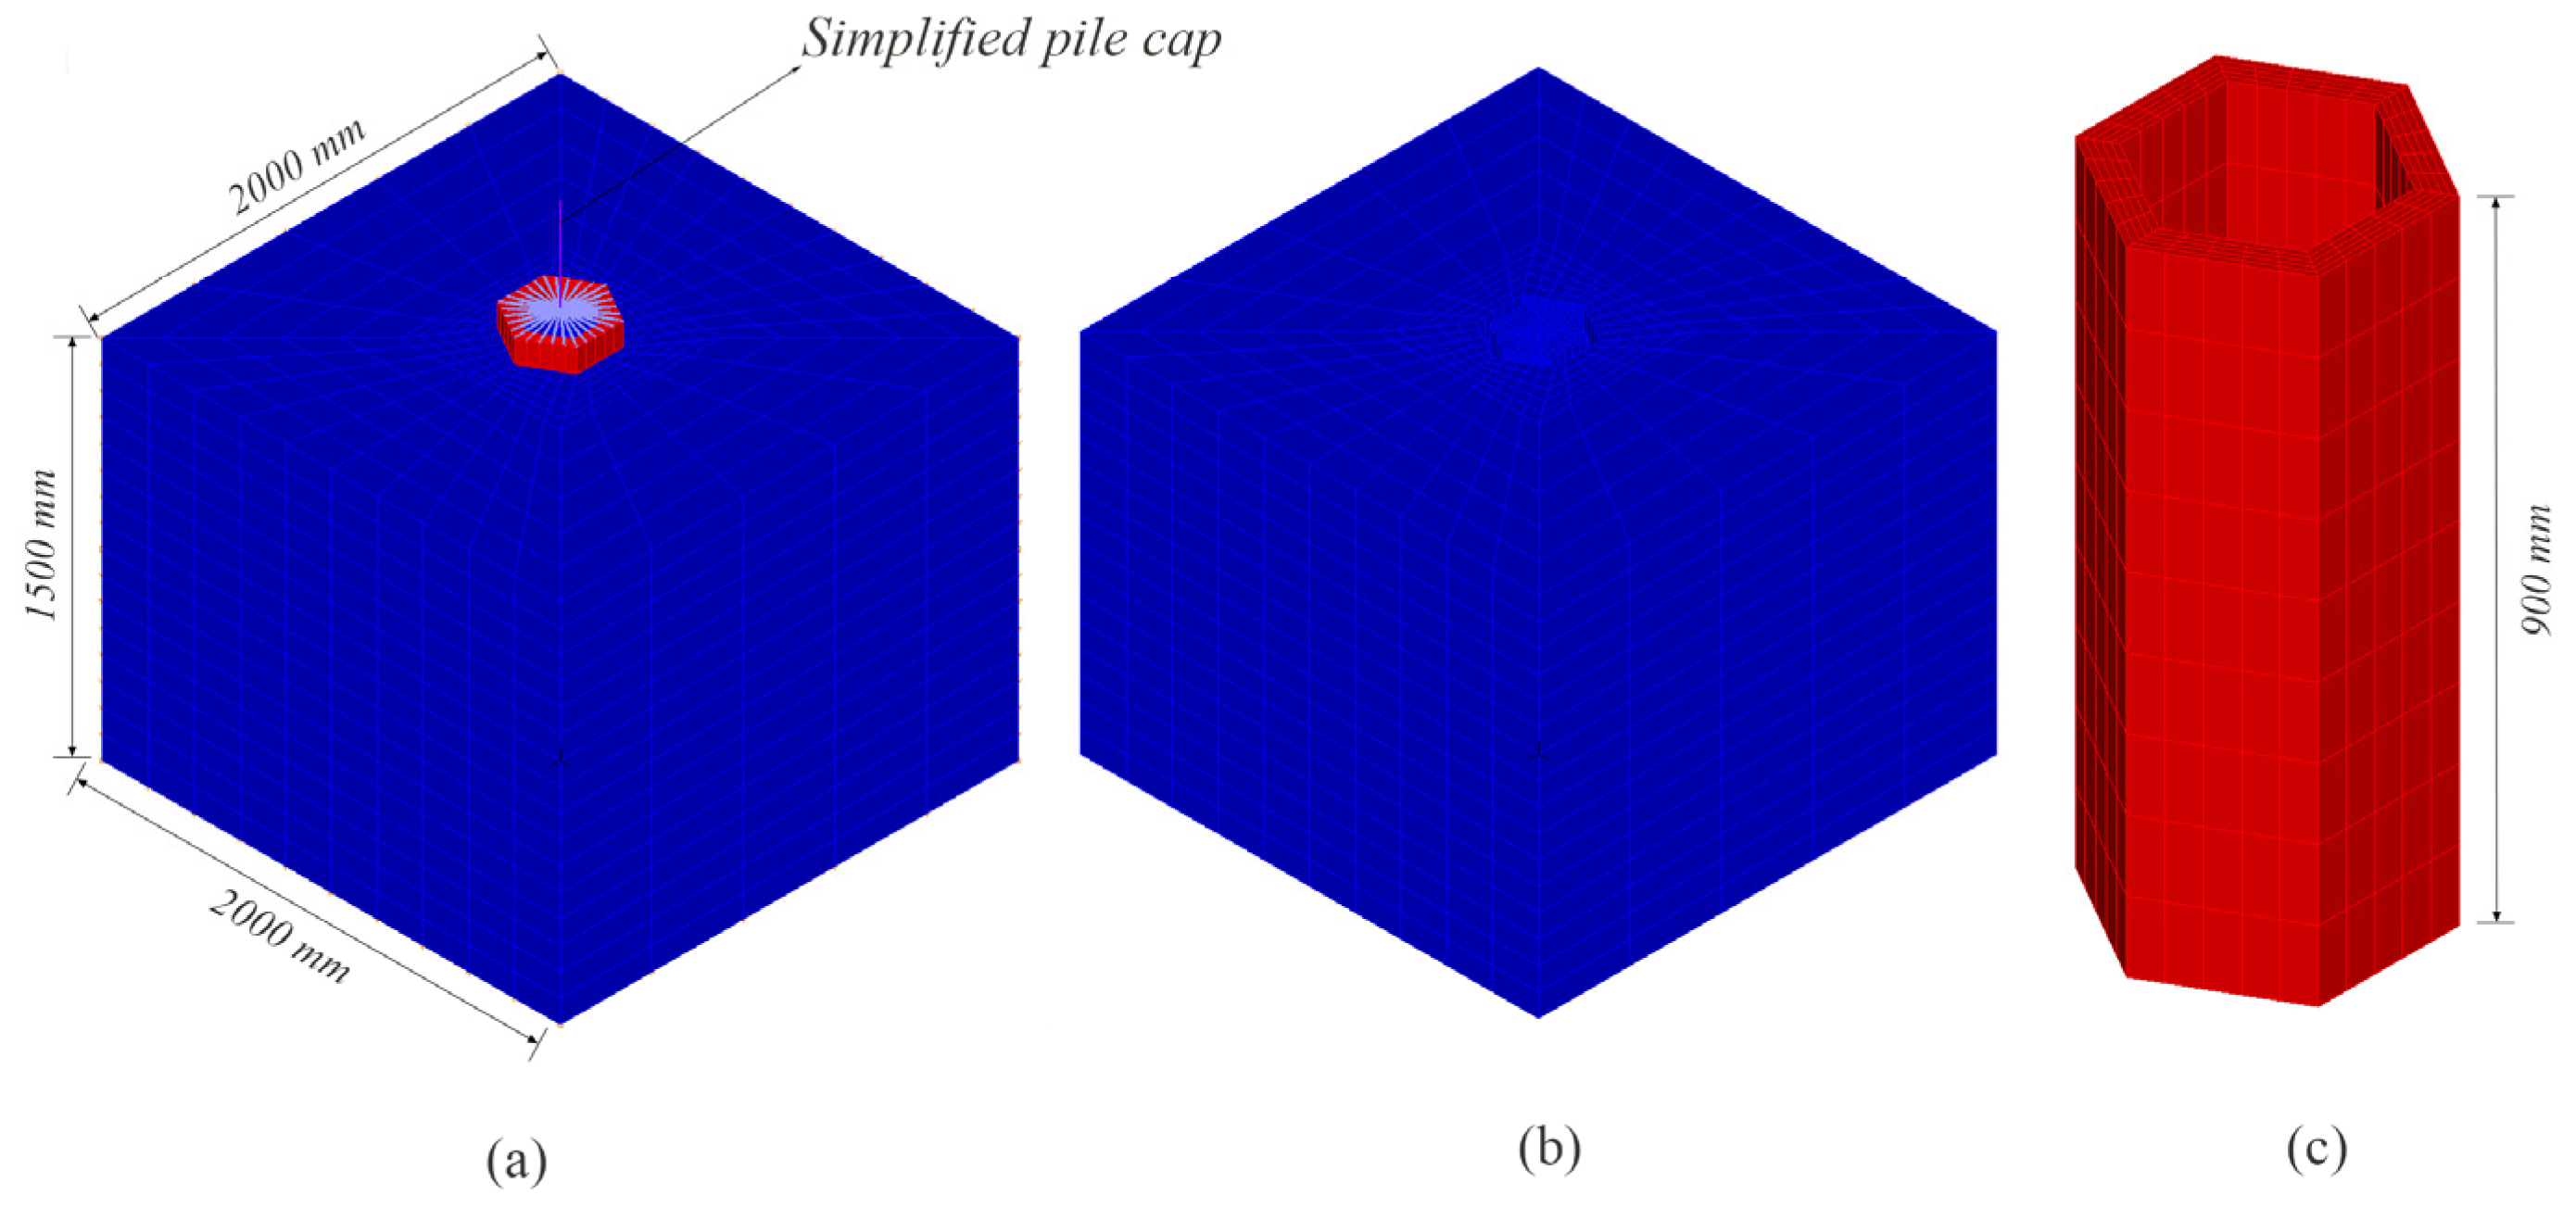
3.1. Numerical Model

The numerical model consists of two parts: the soil and the GPF, as indicated by the laboratory experiment in Section 2.1; the soil material is fine sand, while the GPF is constructed from organic glass. To facilitate loading, a steel footing is placed on top of the pile foundation. The parameters of the model are shown in Table 2. The cross-section of the GPF is a regular hexagon with a thickness of 4 cm and a side length of 20 cm. The pile length is 90 cm, and it is embedded to a depth of 80 cm. The total depth of the soil is 150 cm.
The soil is considered a linear elastic material and is characterized by the Mohr–Coulomb elastoplastic constitutive model. To simplify the calculation, the soil layer is considered a single layer of soil. The organic glass is treated as an isotropic material, and its behavior is simulated using the Isotropic Linear Elastic constitutive model. The steel components are considered isotropic materials, and to simulate potential rigid body rotations that may arise in pile foundations, a Bilinear Elastic–Plastic constitutive model has been utilized [34]. The numerical model is divided into grids starting from the pile core and extending outward. The grid density gradually decreases along the model boundaries to ensure a continuous state of the overall grid and prevent issues with stress transmission. In the vertical direction, a stretching method is employed from the bottom surface upward to ensure the continuity of the grid throughout the model, avoiding stress discontinuities [35]. Based on the experimental parameters and dimensions, a numerical model of the GPF is established as shown in Figure 8.
During the indoor experiment, the GPF and the soil were placed in a test pit with dimensions of 200 cm × 200 cm × 160 cm, and the GPF was positioned at the center of the soil. In the experimental study, the press imposed by the walls of the test pit on the soil was considered a rigid constraint. In the numerical study, the model boundary condition was set so that six degrees of freedom of the bottom and four sides of the soil model were fixed. In the experiment, a unidirectional, linear loading was applied using displacement control. In the numerical simulation, the loading point was located at the top of the pile cap. The static pushover analysis with 100 steps was performed to reach a total displacement of 0.06 m.

3.2. Load Displacement Response

The comparison of the lateral load–displacement curve between the numerical and the experimental results is shown in Figure 9. In the initial loading stage, the numerical simulation and experimental load–displacement curves show good consistency, indicating the stiffness phase. Once the lateral displacement reaches 5 mm, the model enters the plastic strain phase. However, the lateral load generated by the numerical model in this phase is smaller than the experimental value. The relationship between lateral load and displacement shows a linear trend in the numerical model, whereas it exhibits a nonlinear behavior in the actual experiment. Under the same displacement conditions, the numerical model predicts lower lateral load values compared to the experimental results. The overall curve still shows a marked decline, especially during the stiffness phase, demonstrating a satisfactory level of conformity. The discrepancy observed during the plastic strain phase is due to the detachment between the pile cap and the GPF connection in the quasi-static loading of the experiment, resulting in rotation between the pile cap and the GPF and leading to a higher experimental lateral load than the simulated value. The high consistency between the load–displacement curves obtained from the numerical model and the experimental results demonstrates the accuracy of the model calculations.
Figure 10 illustrates the overall schematic diagram of the model after the lateral displacement loading is completed. It can be observed that the top part of the pile foundation enters the underlying soil, causing the soil to bulge. Behind the loading direction, the GPF and the underlying soil experience separation, resulting in a crack. This phenomenon is consistent with the experimental observation. The load–displacement curve, along with the schematic diagram of pile foundation deformation shown in Figure 11, verifies that the GPF did not undergo plastic yielding under the lateral load, further indicating its excellent lateral bearing capacity characteristics. It also confirms that the calculation results of the numerical model are accurate.

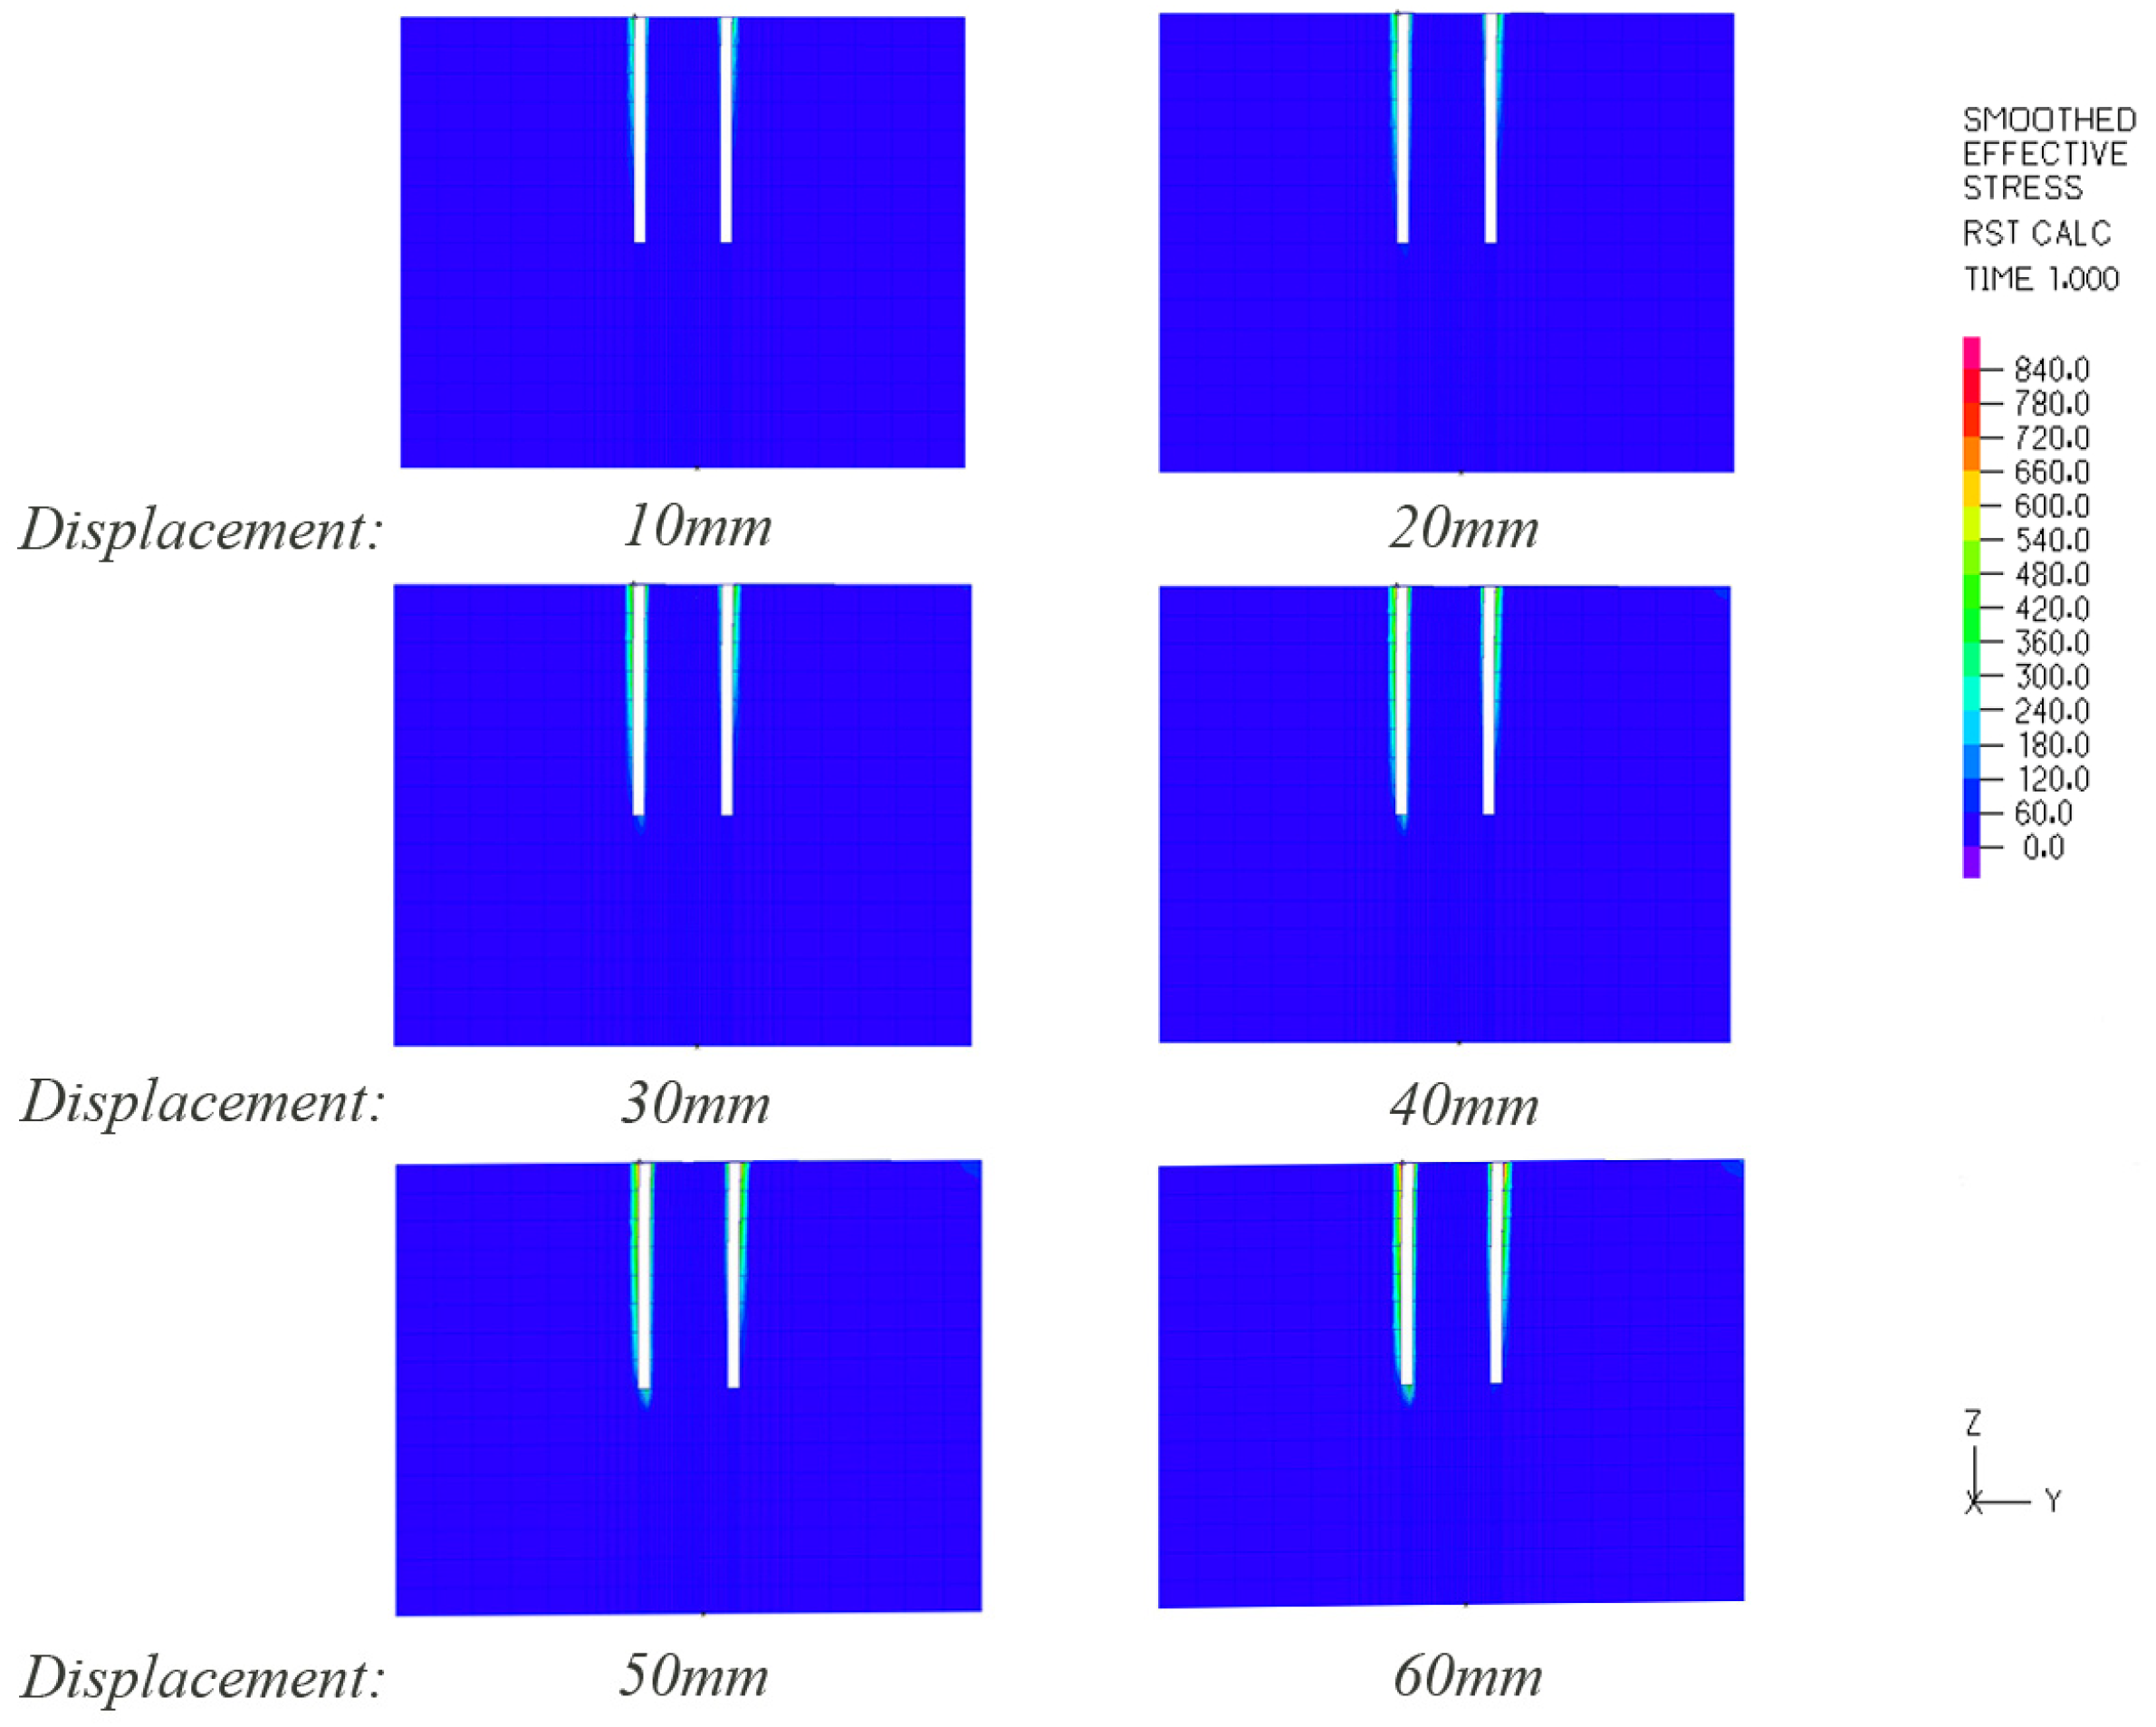
3.3. Pile Foundation Stress Pattern

Figure 12 represents a schematic diagram of the stress variation during the loading of the GPF. In the initial stage of loading, the top of the GPF experiences stresses due to the applied displacement load. The stress region propagates downward as the loading progresses, causing displacement at the top of the pile. With the increase in displacement load, the affected region spreads downward, reaching the middle part of the pile. Based on the displacement pattern observed during this stage, the pile exhibits the characteristics of a flexible pile. After the loading is completed, the stress region expands to the bottom of the pile. The upper section of the pile experiences bending deformation, whereas the deformation in the lower part is relatively less pronounced. During this stage, the pile gradually transitions from a flexible pile to a rigid pile. The most significant stress variation occurs in the loading direction, with the maximum stress located at the pile top. The stress contour plot during the loading process shows a horseshoe-shaped pattern, indicating good agreement between the numerical simulation results and the actual conditions [36].
This indicates that the GPF did not undergo plastic yielding during the loading process, and the stiffness of the pile increased with increasing deformation, transitioning from a flexible pile to a rigid pile.

3.4. Soil Stress Pattern

Figure 13 illustrates the schematic diagram of stress variation in the soil during the loading process. The displacement of soil is mainly concentrated in the shallow region. After the commencement of loading, stresses due to the pile foundation’s compression affect the uppermost soil around the GPF. The stress region propagates downward as the loading progresses. The shallow soil forms a strip-shaped active failure zone and a passive failure zone under the compression of the GPF. With increasing lateral displacement, the stress spreads outwards and the maximum stress always occurs in the active failure zone. As the displacement load increases, the stress-affected area expands in depth and eventually reaches the lower region beneath the pile foundation. During the loading process, the soil stress exhibits a pattern of higher stress in the upper part and lower stress in the lower part. The stress is higher in the outer soil compared to the inner soil, and the far-field soil experiences negligible stress, indicating that the cellular structure pile has a relatively small disturbance effect on the distant soil [37].

3.5. Parametric Analysis

To investigate the influence of variations in soil friction angle, pile material Young’s modulus, and pile length on the lateral bearing characteristics of the GPF, this section conducts a parametric analysis based on the calibrated numerical model in Section 3.1. The ranges of variation for each parameter are presented in Table 3.
In Table 3, the experimental parameters include a soil friction angle of 22°, a pile material Young’s modulus of 2000 MPa, and a pile length of 0.9 m. To enhance the credibility of the analysis results, during the parameter variations, the remaining parameters are kept the same as the experimental parameters, with only one parameter being modified for comparative analysis and calculation.
To visually demonstrate the influence of parameter variations on the lateral bearing performance of the GPF, this study utilizes characteristic values of lateral bearing capacity to represent the effects of parameter changes. According to the "Technical Specification for Building Foundation Piles" (JGJ94-2008), for reinforced concrete precast piles, steel piles, and cast-in-place piles with a reinforcement ratio not less than 0.65%, the characteristic value of the lateral bearing capacity for a single pile can be obtained by taking 75% of the load corresponding to a lateral displacement of 10 mm at ground level (or 6 mm for buildings sensitive to lateral displacement) from the static load test results. The numerical model is a scaled-down model based on the experimental cellular raft foundation, with a scale ratio of 1:30. Therefore, according to the specification, taking the load value at 1/3 mm and multiplying it by 75% will yield the characteristic value of the lateral bearing capacity for the numerical model of the GPF under different parameter variations [38].

3.5.1. Influence of the Soil Friction Angle

The numerical results for the models with different values of the soil friction angle (19°, 22°, and 25°) under the same lateral load conditions are shown in Figure 14. It can be observed that the characteristic values of lateral bearing capacity for the models with soil friction angles of 19° and 25° are slightly smaller than that of the model with a 22° soil friction angle. However, the differences among the three cases are minimal, and it can be concluded that the variation in soil friction angle does not significantly affect the lateral bearing performance of the GPF. This indicates that the GPF can be used in bridge construction projects under complex geological conditions, and even in soft soil conditions, its lateral bearing capacity can still be effectively utilized.

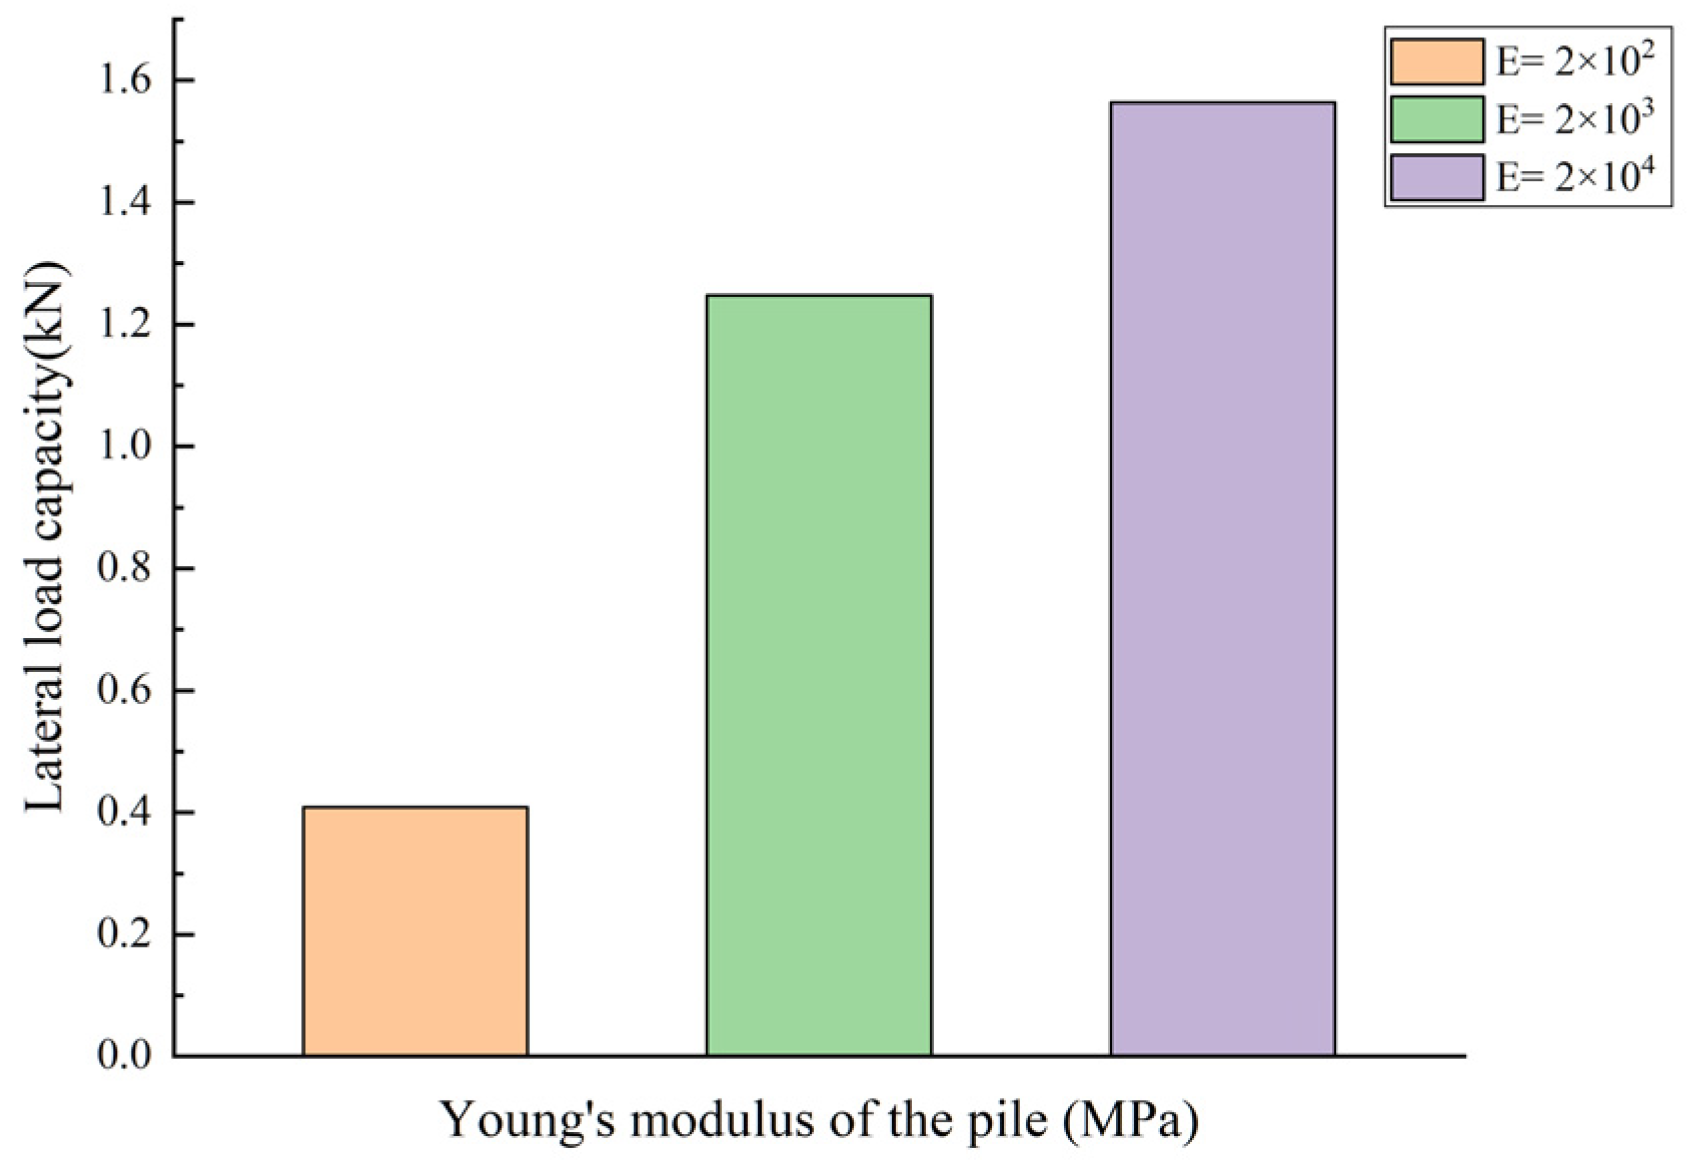
3.5.2. Influence of the Pile Young’s Modulus

The results of the calculations for the variation in Young’s modulus of the GPF from 2 × 10⁵ MPa to 2 × 10⁷ MPa are shown in Figure 15. When Young’s modulus is 2 × 10⁵ MPa, the characteristic value of the lateral bearing capacity for GPF is 0.4 kN. As Young’s modulus increases to 2 × 10⁶ MPa, the lateral bearing capacity increases to 1.2 kN, and further increasing Young’s modulus to 2 × 10⁷ MPa results in a capacity of 1.6 kN. The increase in capacity is 0.8 kN and 0.4 kN, respectively. This indicates that the material properties of the foundation are an important factor influencing the lateral bearing performance of the GPF, and a higher Young’s modulus of the foundation can provide a higher lateral bearing capacity. However, beyond a certain range, further increasing Young’s modulus does not significantly improve the lateral bearing capacity of the GPF.

3.5.3. Influence of the Pile Foundation Length

Figure 16 illustrates the lateral bearing capacity characteristics of the GPF for different lengths, specifically 0.8 m, 0.9 m, and 1.0 m. In the case of the GPF with a length of 0.8 m, the characteristic value of lateral load-bearing capacity is 0.31 kN. When the length of the GPF is increased to 0.9 m, the corresponding characteristic value of lateral load-bearing capacity increases to 0.4 kN. Furthermore, at a length of 1.0 m, the GPF exhibits a further increase in the characteristic value of lateral load-bearing capacity, reaching 0.71 kN. The observed trend suggests that the lateral load-bearing capacity of the GPF grows proportionally with its length. This implies a correlation between the lateral load-bearing capacity and the depth of embedment into the soil. As the embedment depth increases, the lateral load-bearing performance improves. However, it is important to note that this variation is not uniform.
The analysis of parameters shows that Young’s modulus significantly influences the GPF, along with the depth of its embedment into the foundation. Therefore, when undertaking engineering projects, it is crucial to choose construction materials that match project requirements and determine the ideal depth for embedding the GPF. This ensures that its lateral load-bearing capacity can be effectively maximized.

4. Comparative Study between Pile Group Foundation and the GPF

To better illustrate the performance of the proposed GPF, the widely-used pile foundation in the practical bridge structures was adopted here for comparison. The pile foundation was designed based on the same concrete usage of the GPF as shown in Section 2, which has four piles with a diameter of 0.75 m, and the distance between the pile center is 3.5 m. Both foundations have a length of 30 m and have the same soil conditions. By using the numerical simulations, the stiffness of the pile group foundation and GPF in six degrees of freedom can be obtained, as presented in Table 4. It is shown in Table 4 that the translation stiffness of the pile group foundation in the x and y directions is 0.8494 × 10⁶ N/m, while the translation stiffness of GPF is 0.1831 × 10⁷ N/m. The translation stiffness of the GPF increased by 116% compared to that of the pile group foundation. It is also found in Table 4 that the rotational stiffness in the x and y directions of the GPF is 0.8296 × 10⁸ N/m, which is greater than that of the pile group foundation, resulting in a 25% increase in rotation stiffness. Additionally, the GPF showed a 45% increase in vertical translation stiffness and a 75% increase in vertical rotational stiffness compared to the pile group foundation. These results indicate that the GPF has greater lateral load-bearing capacity than the pile group foundation.

5. Conclusions

In this paper, a hexagonal section foundation named the grid pile foundation (GPF) was proposed. The lateral load–displacement relationship of the GPF is investigated using a quasi-static test, while the soil stress characteristics are analyzed using numerical simulations. In addition, this paper analyzes the influence of the lateral load capacity characteristics of the GPF by examining parameters such as soil friction angle, pile Young’s modulus, and pile length. A comparative analysis between the pile group foundation and the GPF is applied to a bridge construction project. The main conclusions are as follows:
  • For the GPF, both the load–displacement curves obtained from the quasi-static test and the numerical simulation demonstrate an outstanding ability to withstand lateral loads. The load–displacement curves for the GPF under lateral loading show a rapid transition from the stiffness stage to the plastic strain stage without reaching the damage stage. In the stiffness stage, the pile behaves flexibly, while in the plastic strain stage, it transforms into a rigid pile.
  • The soil pressure curve indicates that soil stress in the pile core is high at the top and low at the bottom under the same load, and the soil in the head of the pile core is affected by the deformation disturbance of the GPF to produce damage when the lateral displacement reaches 15 mm. In contrast, the stress in the external soil is high at the bottom and low at the top, and the soil at the bottom of the pile core reaches the yield state. The GPF stress pattern shows lateral loading effects, and the soil displacement and stress patterns indicate the active and passive damage zones around the pile.
  • The results of parameter analysis reveal that Young’s modulus and pile length have a very strong influence on its lateral performance, while the influence of soil friction angle is relatively slight, which indicates that the GPF is suitable for the construction of large-span bridges. The results of the parameter analysis can provide some theoretical basis for the design and actual engineering construction of the GPF.
  • The GPF has a much higher lateral translational and rotation stiffness than the pile group foundation, which indicates that the GPF has good load-bearing capacity.
Although the above study shows the good lateral load-bearing capacity of the GPF and provides valuable theoretical guidance for designers, the GPF still needs some future work before real-world application in practical engineering. For example, the advantages and drawbacks of the GPF should be discussed compared to the pile group foundations. During the construction process of the GPF, the detailed construction method of the wall joint should be proposed to ensure the whole performance of the proposed GPF.

Author Contributions

Conceptualization, W.Z. and Y.P.; methodology, J.Z.; software, W.Z., H.A. and Y.P.; validation, Y.P. and J.Z.; investigation, H.A.; resources, H.A., C.Z. and J.R.; data curation, J.C. and C.Z.; writing—original draft preparation, W.Z.; writing—review and editing, W.Z. and J.C.; supervision, J.Z. and C.Z.; funding acquisition, J.Z. All authors have read and agreed to the published version of the manuscript.

Funding

This research was funded by the state key international cooperation research project of the National Natural Science Foundation of China, grant number 41920104007.

Institutional Review Board Statement

Not applicable.

Informed Consent Statement

Not applicable.

Data Availability Statement

The original contributions presented in the study are included in the article, further inquiries can be directed to the corresponding authors.

Conflicts of Interest

Author Hongbin An was employed by the China Railway Construction Investment Group Co., Ltd. Author Jie Ren was employed by Anhui Construction Engineering Investment Group Co., Ltd. The remaining authors declare that the research was conducted in the absence of any commercial or financial relationships that could be construed as a potential conflict of interest.

References

  1. Wen, H.; Cheng, Q.; Meng, F.; Chen, X. Diaphragm wall-soil-cap interaction in rectangular-closed diaphragm-wall bridge foundations. Front. Archit. Civ. Eng. China 2009, 3, 93–100. [Google Scholar] [CrossRef]
  2. Zhao, C.; Feng, Y.; Wang, W.; Niu, Z. Mechanical properties and numerical analysis of Underground Continuous Wall in Underground Grain Silo Foundation Pit. Buildings 2023, 13, 293. [Google Scholar] [CrossRef]
  3. Wang, J.; Hu, L.; Wu, L.; Tang, Y.; Zhu, Y.; Yang, P. Hydraulic barrier function of the underground continuous concrete wall in the pit of subway station and its optimization. Environ. Geol. 2009, 57, 447–453. [Google Scholar] [CrossRef]
  4. Zhang, L.; Zhang, J.; Hou, S. A New Reinforcement Scheme of Plate-Rib Underground Continuous Wall Based on the Soft Foundation in Meizoseismal Area. In Earth and Space 2010: Engineering, Science, Construction, and Operations in Challenging Environments, Proceedings of the 12th Biennial International Conference on Engineering, Construction, and Operations in Challenging Environments; and Fourth NASA/ARO/ASCE Workshop on Granular Materials in Lunar and Martian Exploration, Honolulu, HI, USA, 14–17 March 2010; American Society of Civil Engineers: Reston, VA, USA, 2010; pp. 276–284. [Google Scholar]
  5. Liu, M. Development and prospect of bridge underground diaphragm wall foundation. J. Chongqing Jiaotong Univ. 2021, 40, 41–51. [Google Scholar]
  6. Li, G.; Zhou, S.; Zhou, J.; Li, Y. Vertical bearing test of the diaphragm wall. J. Tongji Univ. 1993, 21, 575–580. [Google Scholar]
  7. Wang, W. The method to calculate the settlement of the diaphragm wall. Chin. J. Geotech. Eng. 1999, 21, 122–125. [Google Scholar]
  8. Tang, M. Research on High-Rise Buding-Diaphragm Wall-Pile-Raft Interaction; Tongji University: Shanghai, China, 1996. [Google Scholar]
  9. Cheng, Q.; Wu, J.; Song, Z.; Wen, H. The behavior of a rectangular closed diaphragm wall when used as a bridge foundation. Front. Struct. Civ. Eng. 2012, 6, 398–420. [Google Scholar] [CrossRef]
  10. Hou, Y. Study on Retaining Structure Behavior of Lattice Diaphragm Wall in Soft Soil Stratum. Ph.D. Thesis, Shanghai Jiaotong University, Shanghai, China, 2010. [Google Scholar]
  11. Ding, X.; Zhang, T.; Li, P.; Cheng, K. A theoretical analysis of the bearing performance of vertically loaded large-diameter pipe pile groups. J. Ocean Univ. China 2016, 15, 57–68. [Google Scholar] [CrossRef]
  12. Zhe, W.; Zhuang, Y. Analytical analysis of vertical load-transfer of large-diameter cast-in-situ concrete tubular piles. Chin. J. Geotech. Eng. 2007, 29, 1488–1492. [Google Scholar]
  13. Li, L.; Liu, X.; Liu, H.; Wu, W.; Lehane, B.M.; Jiang, G.; Xu, M. Experimental and numerical study on the static lateral performance of monopile and hybrid pile foundation. Ocean Eng. 2022, 255, 111461. [Google Scholar] [CrossRef]
  14. Wu, J.; Cheng, Q.; Wen, H.; Cao, J. Vertical bearing behaviors of lattice shaped diaphragm walls and group piles as bridge foundations in soft soils. Chin. J. Geotech. Eng. 2014, 36, 1733–1744. [Google Scholar]
  15. Tang, R.; Wang, Y.; Zhang, W.; Jiao, Y. Load-Bearing Performance and Safety Assessment of Grid Pile Foundation. Sustainability 2022, 14, 9477. [Google Scholar] [CrossRef]
  16. Wen, H.; Cheng, Q.; Chen, X.; Meng, F. Study on bearing performance of rectangular closed diaphragm walls as bridge foundation under vertical loading. Chin. J. Geotech. Eng. 2007, 29, 1823–1830. [Google Scholar]
  17. Dai, G.; Zhou, X.; Liu, Y.; Liu, L. Model test research on horizontal bearing capacity of closed diaphragm wall. Rock and Soil Mechanics 2011, 32, 32–185+189. [Google Scholar]
  18. Michel, P.; Butenweg, C.; Klinkel, S. Pile-grid foundations of onshore wind turbines considering soil-structure-interaction under seismic loading. Soil Dyn. Earthq. Eng. 2018, 109, 299–311. [Google Scholar] [CrossRef]
  19. Belash, T.A.; Mitrofanova, M.N. Pile Foundations for Areas with a Joint Manifestation of Permafrost and High Seismic Activity. Mater. Sci. Eng. IOP Publ. 2018, 463, 022076. [Google Scholar] [CrossRef]
  20. Yamashita, K.; Hamada, J.; Tanikawa, T. Static and seismic performance of a friction piled raft combined with grid-form deep mixing walls in soft ground. Soils Found. 2016, 56, 559–573. [Google Scholar] [CrossRef]
  21. Yamashita, K.; Wakai, S.; Hamada, J. Large-scale piled raft with grid-form deep mixing walls on soft ground. In Proceedings of the 18th International Conference on Soil Mechanics and Geotechnical Engineering, Paris, France, 2–6 September 2013; pp. 2637–2640. [Google Scholar]
  22. Wang, M.C.; Badie, A. Effect of underground void on foundation stability. J. Geotech. Eng. 1985, 111, 1008–1019. [Google Scholar] [CrossRef]
  23. Zhang, J.; Cheng, Q.; Li, Y.; Qiu, Y.; Wang, Y.; Wu, J. Performance of rectangular closed diaphragm walls in gently sloping liquefiable deposits subjected to different earthquake ground motions. Earthq. Eng. Eng. Vib. 2021, 20, 905–923. [Google Scholar] [CrossRef]
  24. Wu, J.; Wang, L.; Cheng, Q. Soil arching effect of Lattice-Shaped Diaphragm Wall as bridge foundation. Front. Struct. Civ. Eng. 2017, 11, 446–454. [Google Scholar] [CrossRef]
  25. Qiu, F.; Li, W.; Pan, P.; Qian, J. Experimental tests on reinforced concrete columns under biaxial quasi-static loading. Eng. Struct. 2002, 24, 419–428. [Google Scholar] [CrossRef]
  26. Teh, C.I.; Houlsby, G.T. An analytical study of the cone penetration test in clay. Geotechnique 1991, 41, 17–34. [Google Scholar] [CrossRef]
  27. Li, L.; Zheng, M.; Liu, X.; Wu, W.; Liu, H.; El Naggar, M.H.; Jiang, G. Numerical analysis of the cyclic loading behavior of monopile and hybrid pile foundation. Comput. Geotech. 2022, 144, 104635. [Google Scholar] [CrossRef]
  28. Stone, K.J.L.; Arshi, H.S.; Zdravkovic, L. Use of a bearing plate to enhance the lateral capacity of monopiles in sand. J. Geotech. Geoenviron. Eng. 2018, 144, 04018051. [Google Scholar] [CrossRef]
  29. Wang, H.; Bransby, M.F.; Lehane, B.M.; Wang, L.; Hong, Y. Numerical investigation of the monotonic drained lateral behaviour of large-diameter rigid piles in medium-dense uniform sand. Géotechnique 2023, 73, 689–700. [Google Scholar] [CrossRef]
  30. Zhang, Y.; Wu, W.; Zhang, H.; El Naggar, M.H.; Wang, K.; Jiang, G.; Mei, G. A novel soil-pile interaction model for vertical pile settlement prediction. Appl. Math. Model. 2021, 99, 478–496. [Google Scholar] [CrossRef]
  31. Murff, J.D.; Hamilton, J.M. P-ultimate for undrained analysis of laterally loaded piles. J. Geotech. Eng. 1993, 119, 91–107. [Google Scholar] [CrossRef]
  32. Liu, H.; Fei, K.; Zhou, Y. Numerical simulation of inner frictional resistance of cast-in-situ concrete thin-wall pipe pile. Rock Soil Mech. 2004, 25, 211–216. [Google Scholar]
  33. Pang, Y.; Wang, X. Enhanced endurance-time-method (EETM) for efficient seismic fragility, risk and resilience assessment of structures. Soil Dyn. Earthq. Eng. 2021, 147, 106731. [Google Scholar] [CrossRef]
  34. Pang, Y.; Cai, L.; He, W.; Wu, L. Seismic assessment of deep water bridges in reservoir considering hydrodynamic effects using endurance time analysis. Ocean Eng. 2020, 198, 106846. [Google Scholar] [CrossRef]
  35. Pang, Y.; Kai, W.; Yuan, W.; Shen, G. Effects of dynamic fluid-structure interaction on seismic response of multi-span deep water bridges using fragility function method. Adv. Struct. Eng. 2015, 18, 525–541. [Google Scholar] [CrossRef]
  36. Chen, D.; Gao, P.; Huang, S.; Li, C.; Yu, X. Static and dynamic loading behavior of a hybrid foundation for offshore wind turbines. Mar. Struct. 2020, 71, 102727. [Google Scholar] [CrossRef]
  37. Haiderali, A.; Madabhushi, G. Improving the lateral capacity of monopiles in submarine clay. Proc. Inst. Civ. Eng.-Ground Improv. 2016, 169, 239–252. [Google Scholar] [CrossRef]
  38. China Building Industry Press. Technical Code for Building Pile Foundations (JGJ94-2008); China Building Industry Press: Beijing, China, 2008. [Google Scholar]
Figure 1. Diaphragm wall foundations with different sections and combinations.
Applsci 14 01209 g001
Figure 2. Proposed hydrostatic test model: (a) GPF, (b) pile cap.
Applsci 14 01209 g002
Figure 3. Experimental layout.
Applsci 14 01209 g003
Figure 4. Hydrostatic test layout diagram: (a) MTS actuators, (b) data acquisition system.
Applsci 14 01209 g004
Figure 5. Loading protocol.
Applsci 14 01209 g005
Figure 6. Lateral load and displacement curve.
Applsci 14 01209 g006
Figure 7. Soil lateral stress: (a) soil lateral stress at a lateral displacement of 15 mm, (b) soil lateral stress at a lateral displacement of 30 mm, (c) soil lateral stress at a lateral displacement of 45 mm, (d) soil lateral stress at a lateral displacement of 60 mm.
Applsci 14 01209 g007
Figure 8. Numerical model of GPF: (a) the numerical model, (b) soil, (c) the GPF.
Applsci 14 01209 g008
Figure 9. Experimental and simulated load–displacement curves.
Applsci 14 01209 g009
Figure 10. Diagram of the end of model loading.
Applsci 14 01209 g010
Figure 11. Diagram of deformation at the end of loading of the GPF.
Applsci 14 01209 g011
Figure 12. Grid pile foundation stress diagram.
Applsci 14 01209 g012
Figure 13. Soil stress diagram.
Applsci 14 01209 g013
Figure 14. Influence of soil friction angle.
Applsci 14 01209 g014
Figure 15. Influence of pile Young’s modulus.
Applsci 14 01209 g015
Figure 16. Effect of length of the pile.
Applsci 14 01209 g016
Table 1. Lateral loading scheme.
Displacement Amplitude (mm)Number of Cycles
±103
±203
±303
±403
±503
±603
Table 2. Parameters for foundation, soil, and pile cap.
MaterialModulus of Elasticity
E/MPa
Cohesion
c/kPa
Internal Friction Angle
φ/(°)
Density
ρ/kg.m−3
Poisson Ratio
V
GPF2000--25000.18
Soil60102218600.54
Pile cap210,000--78500.30
Table 3. The adopted parameters of the GPF in parametric analysis.
ParameterFriction Angle of the Soil
φ/(°)
Young’s Modulus of the Pile
E/MPa
Length of Pile
L/m
Value192000.8
2220000.9
2520,0001.0
Table 4. Pile group foundation and the GPF stiffness.
Stiffness
(N/m)
Pile Group FoundationThe GPFStiffness Increase Rate
(%)
X translation stiffness0.8494 × 1060.1831 × 107116%
Y translation stiffness0.8494 × 1060.1831 × 107116%
Z translation stiffness0.1472 × 1080.2138 × 10845%
X rotation stiffness0.6655 × 1080.8296 × 10825%
Y rotation stiffness0.6655 × 1080.8296 × 10825%
Z rotation stiffness0.9499 × 1070.1661 × 10775%
Disclaimer/Publisher’s Note: The statements, opinions and data contained in all publications are solely those of the individual author(s) and contributor(s) and not of MDPI and/or the editor(s). MDPI and/or the editor(s) disclaim responsibility for any injury to people or property resulting from any ideas, methods, instructions or products referred to in the content.

