Article

Study on the Nonlinear Permeability Mechanism and Pore Structure Characteristics of Deep Confined Aquifers

1
Anhui Provincial Key Laboratory of Building Structure and Underground Engineering, Anhui Jianzhu University, Hefei 230601, China
2
School of Civil Engineering, Anhui Jianzhu University, Hefei 230601, China
3
Engineering Research Center of Underground Mine Construction, Ministry of Education, Anhui University of Science and Technology, Huainan 232001, China
*
Author to whom correspondence should be addressed.
Appl. Sci. 2023, 13(20), 11599; https://doi.org/10.3390/app132011599
Submission received: 12 August 2023 / Revised: 12 October 2023 / Accepted: 16 October 2023 / Published: 23 October 2023
(This article belongs to the Special Issue Recent Advances in Tunneling and Underground Space Technology)

Abstract

:
The study of deep soil mechanics is the basis of deep shaft construction. Exploring the nonlinear permeability mechanism of deep confined aquifers in depth is the prerequisite and foundation for carrying out calculations of the hydrophobic consolidation settlement of thick alluviums and preventing and controlling deep-well-damage disasters. Against the background of shaft damage caused by hydrophobic consolidation settlement of the bottom aquifer of thick alluviums, a joint HPLTC-HPPNP (high-pressure long-term consolidation and high-pore-pressure nonlinear permeability) test was carried out on the bottom aquifer of thick alluviums based on the ETAS test system. This paper studied the evolution law of the permeability coefficient ( k v ) of bottom aquifers under different heads of confined water, confining pressures ( σ r ), permeability hydraulic gradients (i) and loading–unloading methods. The internal pore structure characteristics of clayey sand were obtained by using low-field nuclear magnetic resonance (NMR) technology to explore the clayey sand’s nonlinear permeability micro-mechanism. The research results showed that the bottom aquifer seepage volume ( Δ Q i ) under high stress is affected by the head pressure difference and pore water dissipation, and k v decreases with an increasing σ r according to the power function relationship. The influence of the hydraulic gradient ( i ) on k v is significantly influenced by σ r . When σ r   < 4 MPa, k v decreased with an increasing i , and when σ r   > 4 MPa, k v increased with an increasing i first, then decreased, before then tending to be stable. Under different stress states, the T2 spectrum of clayey sand showed a bispectrum peak type, and the adsorbed water content decreased linearly with an increasing σ r , while the capillary water decreased according to the power function. The content of capillary water in the permeable pores plays a key role in the permeability of clayey sand, and it has a power function relationship with σ r . The research results of this paper provide a good experimental method for the study of deep soil permeability characteristics and parameter determination, provide a theoretical basis for deep alluvial hydrophobic consolidation and settlement, and further make up for the shortcomings of existing deep soil mechanics in permeability characteristics.

1. Introduction

There are large areas of thick alluvium ranging from 400 to 600 m (or even over 700 m) distributed in parts of East, Central, North, and Northeast China, the lower part of which is rich in mineral resources. In order to develop the above resources, large-scale construction of deep shafts has been carried out in China since 2002. Therefore, China’s coal resources have gradually entered into deep mining; for example, the thickness of the alluvium in the main shaft of Wanfu Coal Mine has reached 753.95 m. With the development of large-scale deep shaft construction, the safety of shaft lining structure design in deep shafts has encountered unprecedented challenges, and the study of deep soil mechanics has become a fundamental topic. The safety of the shaft lining structure in deep alluviums ultimately depends on the interaction between the shaft lining and geotechnical medium. This is the premise and key to carrying out shaft lining design and safety analysis in deep shafts to study the mechanical properties of deep soil under high stress [1].
In recent years, several shaft lining fractures have occurred in coal mine shafts built in deep alluviums in China [2,3,4,5]. The main reason for the damage of most of the above-mentioned shafts is that the bottom gravel layer (hereafter referred to as the “bottom aquifer”) of the thick alluvium that the damaged coal mine shaft passes through is mostly directly covered on the coal measure strata. Coal mine production leads to bottom aquifer hydrophobicity, which causes secondary consolidation and settlement of the soil around the shaft, resulting in additional vertical forces acting on outer edge of the shaft and ultimately causing shaft damage. The bottom aquifer of thick alluviums has obvious mechanical characteristics of high overlying total stress and a high water pressure (confined water). Furthermore, the problems of additional surface subsidence and shaft deviation caused by the bottom aquifer hydrophobicity of thick alluviums are also gradually becoming prominent [2,6,7], seriously threatening the production safety of mines and causing significant economic losses. Therefore, there is an urgent need for deep soil mechanics research to guide the prevention and control of related deep shaft hazards.
The permeability of soil is one of the basic mechanical properties that characterizes the infiltration capacity of soil [8,9]. The permeability coefficient ( k v ) is a parameter that directly reflects the strength of soil permeability. The k v of deep soil under high stress is an important parameter for calculating the hydrophobic settlement deformation of thick alluviums. More importantly, it forms the basis for revealing the evolution law of the vertical additional force of deep shafts under the effect of hydrophobic consolidation of the bottom aquifer of thick alluviums. At the same time, revealing the permeability law of the bottom aquifer is the basis for studying many coal mine engineering and geological safety issues [10]. For example, the use of bottom aquifer hydrophobicity depressurization to prevent water and sand surges in near-thick alluvium mining and grouting to control mine sand disasters. All of these situations require knowledge of the permeability characteristics of the aquifer in advance.
Accordingly, many scholars at home and abroad have carried out a vast amount of research from different perspectives. In pore media permeability research, the variation of permeability with stress levels has always been of concern [11,12]. Research on different samples shows that the confining pressure ( σ r ) has an obvious influence on the k v of the medium. Guo Hong [13] and Li Ping [14] conducted triaxial permeability tests on saturated undisturbed loess and reshaped loess, with an σ r ranging from 0.1 to 0.4 MPa, and found that their k v decreased with increasing consolidation pressure, controlled dry density, and consolidation degree. The k v under single loading was significantly lower than that under step-by-step loading. Zoback [15] and Terzaghi [16] found, through tests, that with an increase in the σ r , the stress shared by the solid skeleton of the sample is obviously greater than that borne by the pore water, leading to compaction of the sample pores and a decrease in the k v . Ameta [17] and Sällfors [18] studied the permeability of bentonite under different pressures and found that the coefficient of permeability also decreases with an increasing σ r . Wei Linyi [19] found through permeability tests of compacted clay under different axial strains that the relative magnitude of the current confining pressure and preconsolidation pressure of the sample determined the deformation patterns as well as the permeability change. Different pore structures and particle gradations have a great influence on the k v [20,21,22]. Clement [23] investigated the relationship between the type of pore distribution and the k v under different consolidation stresses by means of mercury injection testing. The study of Kong Lingwei [24] also found that the k v does not change much when the content of fine particles in the sandy soil is less than 5%. When the fine particle content is between 5% and 10%, the k v sharply decreases with an increasing fine particle content. In contrast, the coefficient of permeability of sandy soils tends to be relatively stable when the fine particle content is greater than 25%. Hazen [25] proposed an empirical formula for the coefficient of permeability of soils: k = C d 10 2 . In regard to the deep soil mechanics test, domestic scholars such as Wang Yansen [26,27], Chen Guoqing [1], Li Wenping [28] and Ma Jinrong [29] have carried out quite effective research on the mechanical characteristics of the consolidation of deep clay under high stress, but research on the nonlinear permeability characteristics of soil under high stress is still in its initial stage [30]. There are few reports on deep soil mechanics in foreign countries because of the energy policy and natural endowment of coal seam. Because of the characteristics of high total stress and high water pressure, the bottom aquifers of thick alluviums with a permeable path have been subjected to long geological sedimentation during their formation. A high σ r causes soil particles to break, thus changing the gradation of soil and changing its k v .
To sum up, studying the nonlinear permeability characteristics of bottom aquifers of thick alluviums under high stress provide an indispensable theoretical basis for revealing the deformation mechanism of hydrophobic settlement in deep alluviums and the mechanism and prevention of indirect shaft mining fractures after mines are put into production. In view of the above, in this paper, against the background of shaft damage caused by the hydrophobic consolidation and settlement of high-confined aquifers at the bottom of thick alluviums, a joint HPLTC-HPPNP experimental study was carried out using an environmental triaxial automated system (hereafter referred to as “ETAS”). After high-pressure consolidation, the k v under a constant σ r was directly measured, and the nonlinear permeability characteristics of deep clayey sand were analyzed by determining the relationships amongst the consolidation pressure, hydraulic gradient, loading–unloading methods and permeability coefficient. Additionally, the pore structure characteristics of clayey sand were explored by low-field NMR technology, and the nonlinear permeability mechanism of deep clayey sand is discussed. The research results are expected to be beneficial for the study of the hydrophobic consolidation characteristics of confined aquifers and to make up for the shortcomings of deep soil mechanics in the study of permeability characteristics.

2. Long-Term Consolidation Permeability Test of Bottom Aquifers under High Stress

2.1. Sample Preparation

The test materials were selected from the bottom of deep strata of the same depth of approximately 540~580 m underground near the Guotun Coal Mine shaft in Yuncheng, Shandong Province, as shown in Figure 1. The bottom aquifer soil sample was identified as clayey sand, and its natural physical indexes are shown in Table 1.
The mineral constituents of the clayey sand were quantitatively analyzed based on the K-value method using an X-ray diffractometer. The analysis showed that the mineral composition of the clayey sand at the bottom of Guotun Coal Mine contained more quartz, followed by montmorillonite (accounting for 15.38%), with some illite, kaolin, an illite/smectite mixed layer, calcite and small amounts of chlorite, feldspar, gypsum and other minerals. The basic physical indexes and mineral compositions obtained above are similar to the existing geological data of the deep loose layers in East China and the Huanghuai area of China.
The preparation of clayey sand samples followed China’s national standard geotechnical test method [31]. First, the initial wet weight of the original soil samples was measured by taking representative samples from the coal mine coring site, and the initial moisture content of the original soil samples was determined after drying in the laboratory. According to the requirement of a 10% water content, the test soil was evenly mixed, and after standing in a sealed container for 24 h to ensure that the water content in the soil was uniform, according to the test scheme, five consolidation pressures (1, 2, 4, 6 and 8 MPa) were used to prepare reshaped clayey sand samples with a standard cylindrical sample size of 𝜙50 · 100 mm. In order to show that undisturbed soil samples have a certain structure after long-term consolidation [26], reshaped clayey sand samples were consolidated for 15 days under five consolidation pressures, and the samples formed by long-term consolidation under high stress are shown in Figure 2.

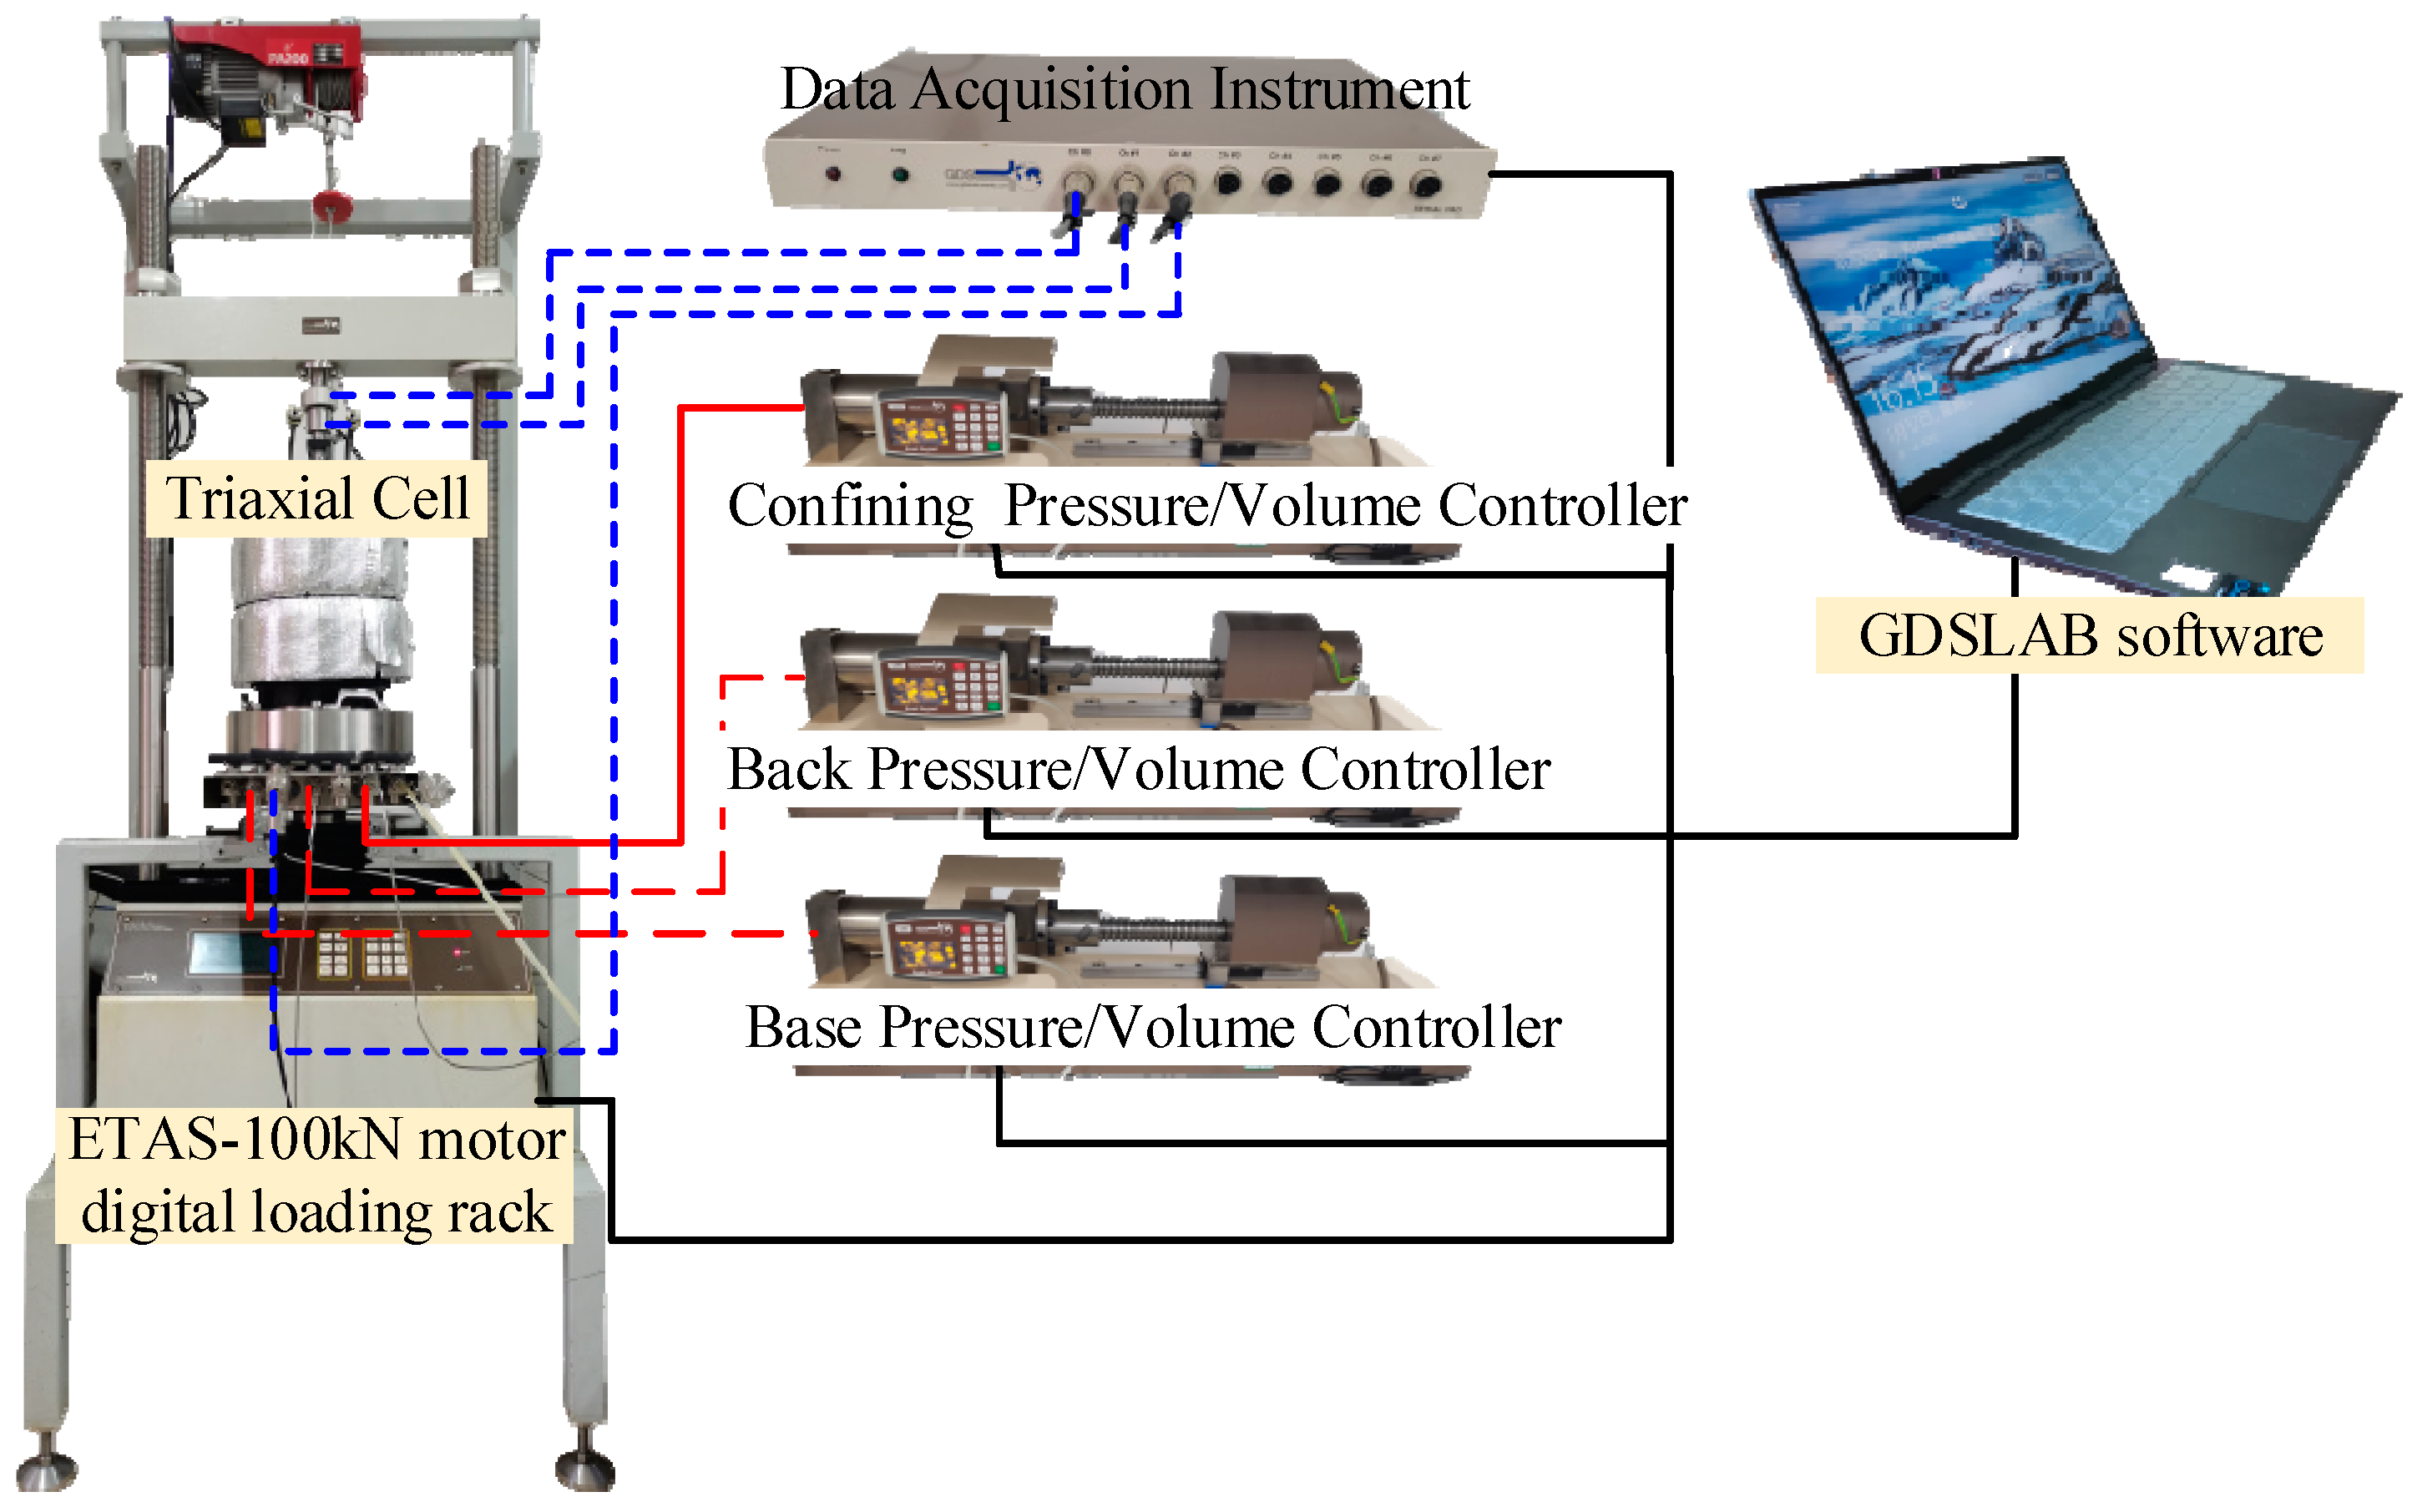
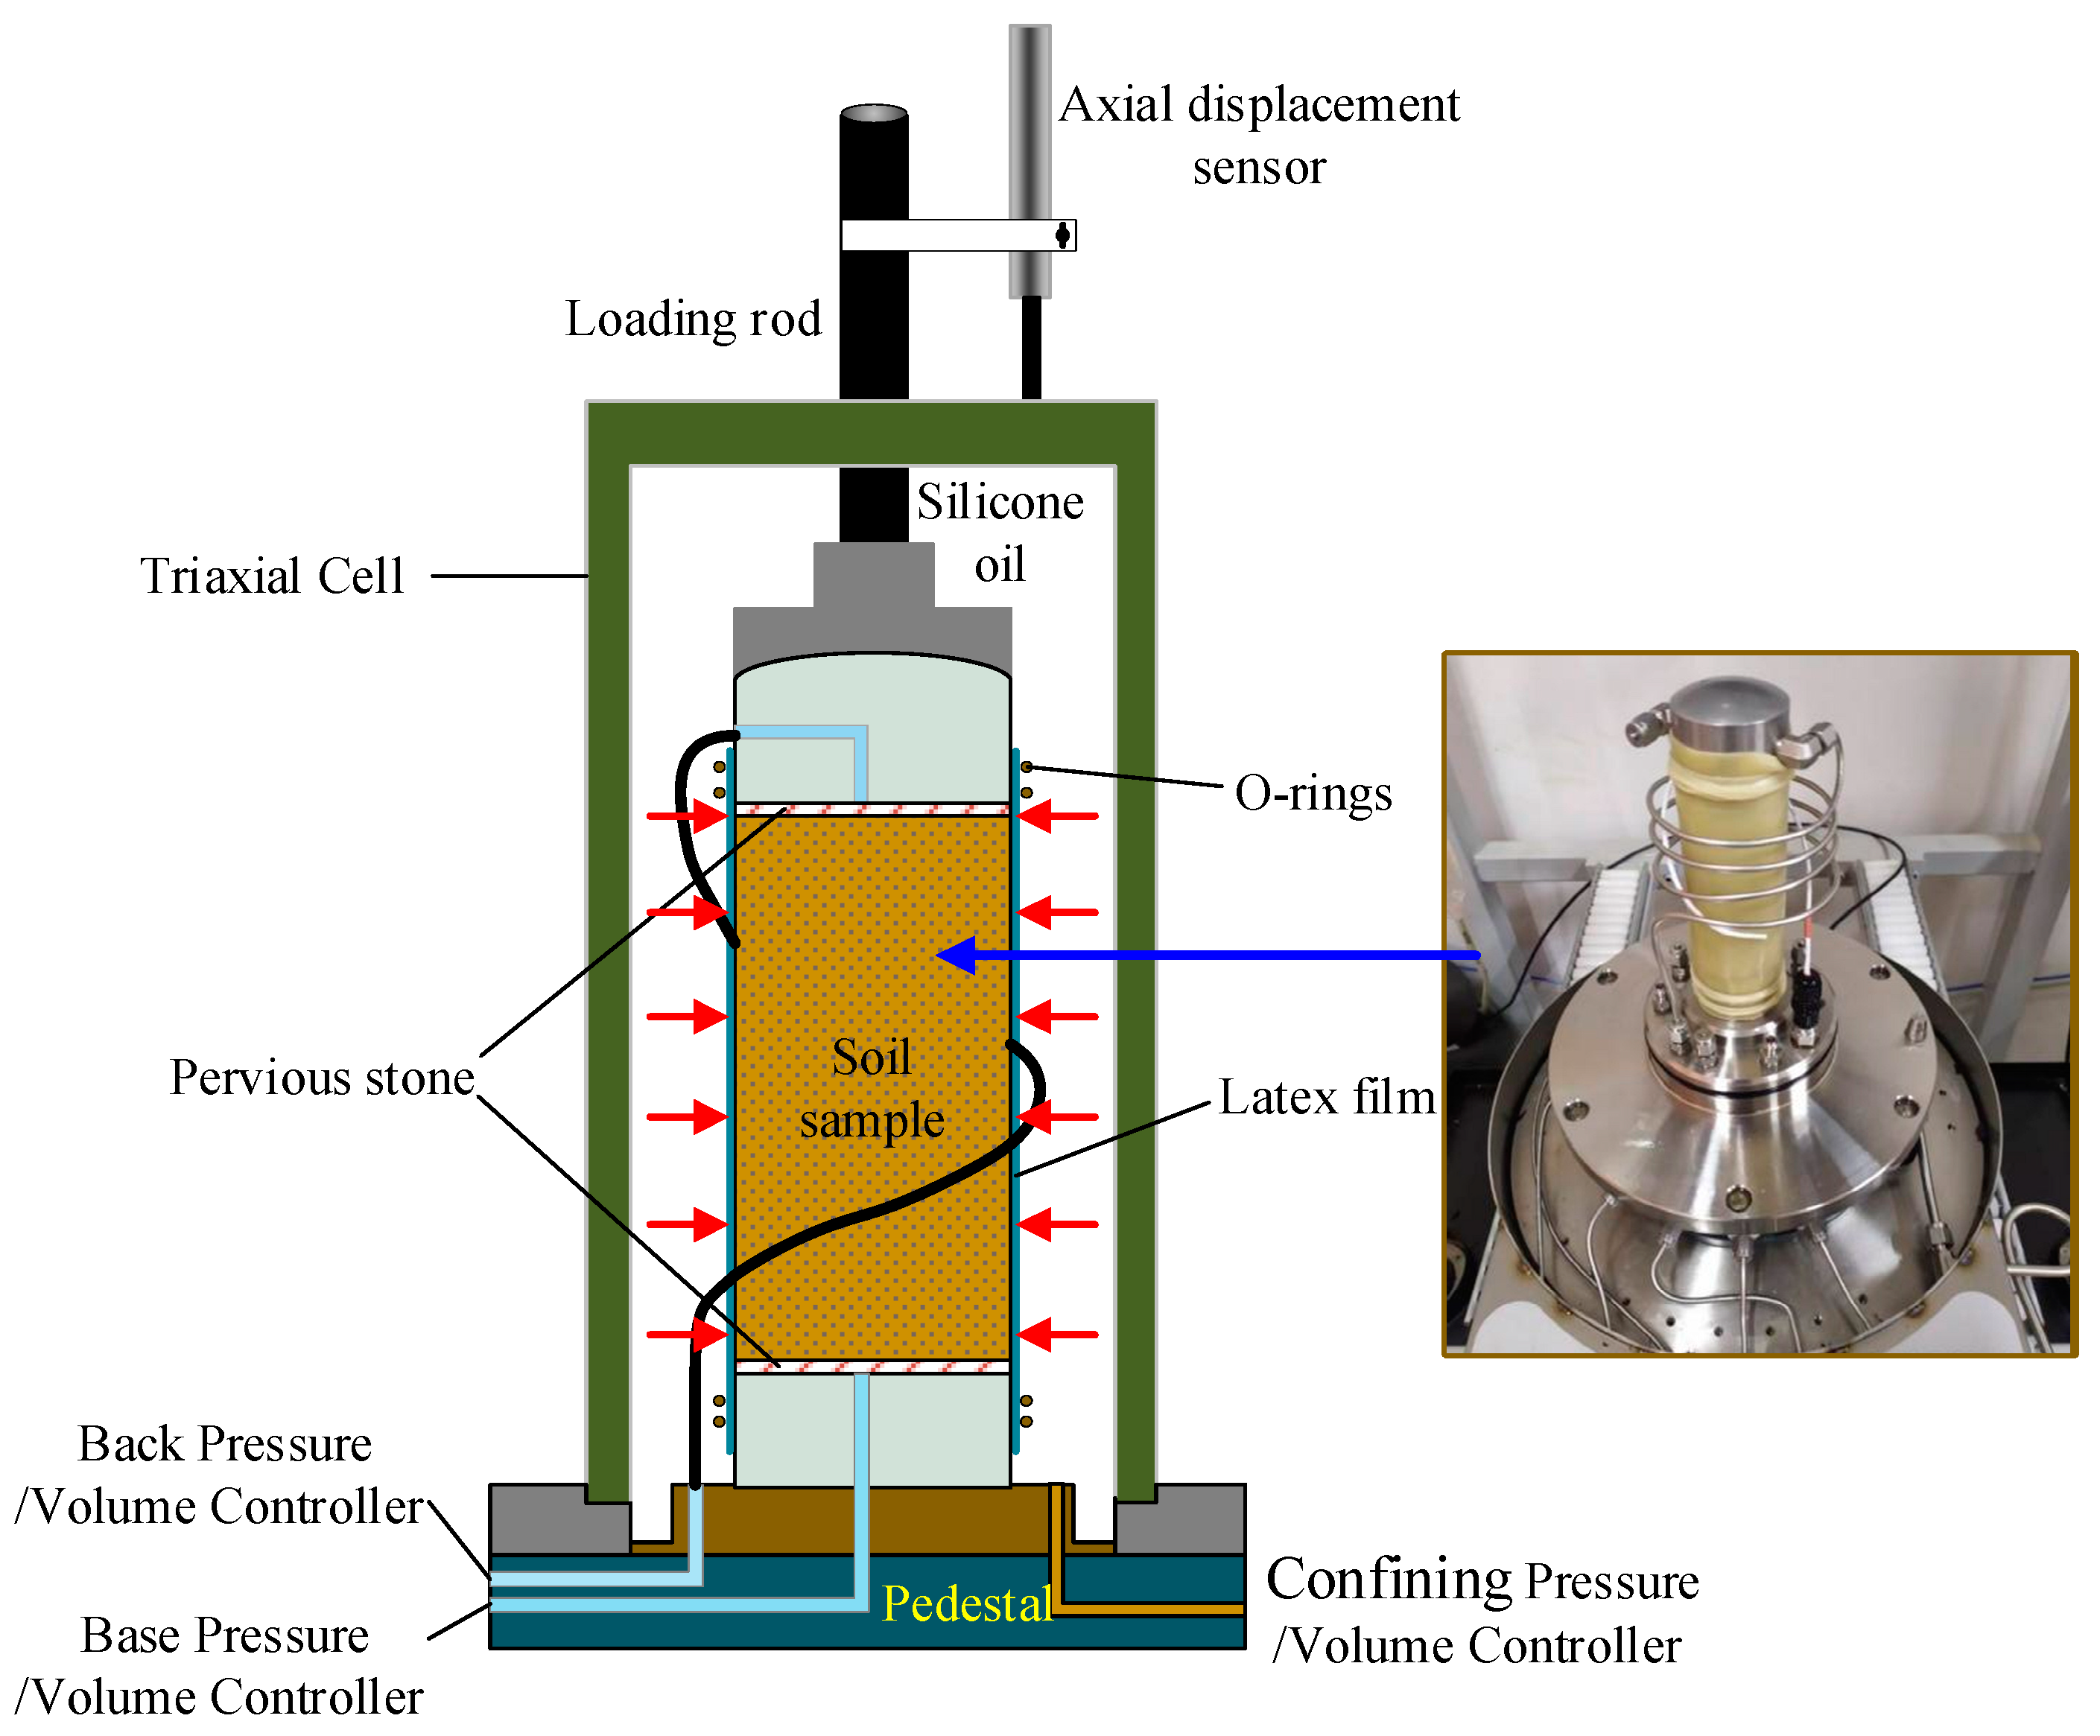
2.2. Experimental Test System

Aiming at the mechanical characteristics of high overlying total stress and a high water pressure in the permeability path of the bottom aquifer of thick alluviums, in order to study the nonlinear seepage law of bottom aquifers under different stress levels, the ETAS customized by Anhui Jianzhu University in the GDS Company of the United Kingdom was selected to design high-stress and high-water-pressure permeability tests. The ETAS meets the triaxial and permeability test requirements of deep soil under high-stress conditions, and it can provide a maximum σ r of 32 MPa. As shown in Figure 3, the system can realize back pressure saturation, B-value detection, standard triaxial test, stress path tests, K0 consolidation tests and other user-defined test schemes. The axial stepper motor realizes the control of axial displacement. The pressure–volume controller realizes the control of confining and back pressure and the measurement of drainage volume. The axial load sensor measures the axial load. The pore pressure sensor realizes the measurement of pore water pressure at the bottom of the sample.
The ETAS can accurately control drainage, measure pore pressure and determine the volume change in samples in the test according to the test requirements. Through the closed-loop feedback calculation and control of PC, accurate automatic pressure compensation and depressurization functions were realized. The experiment was controlled by GDSLAB software (V2.6.0) to display real-time graphics and realize the visualization of the test control and measurement parameters.

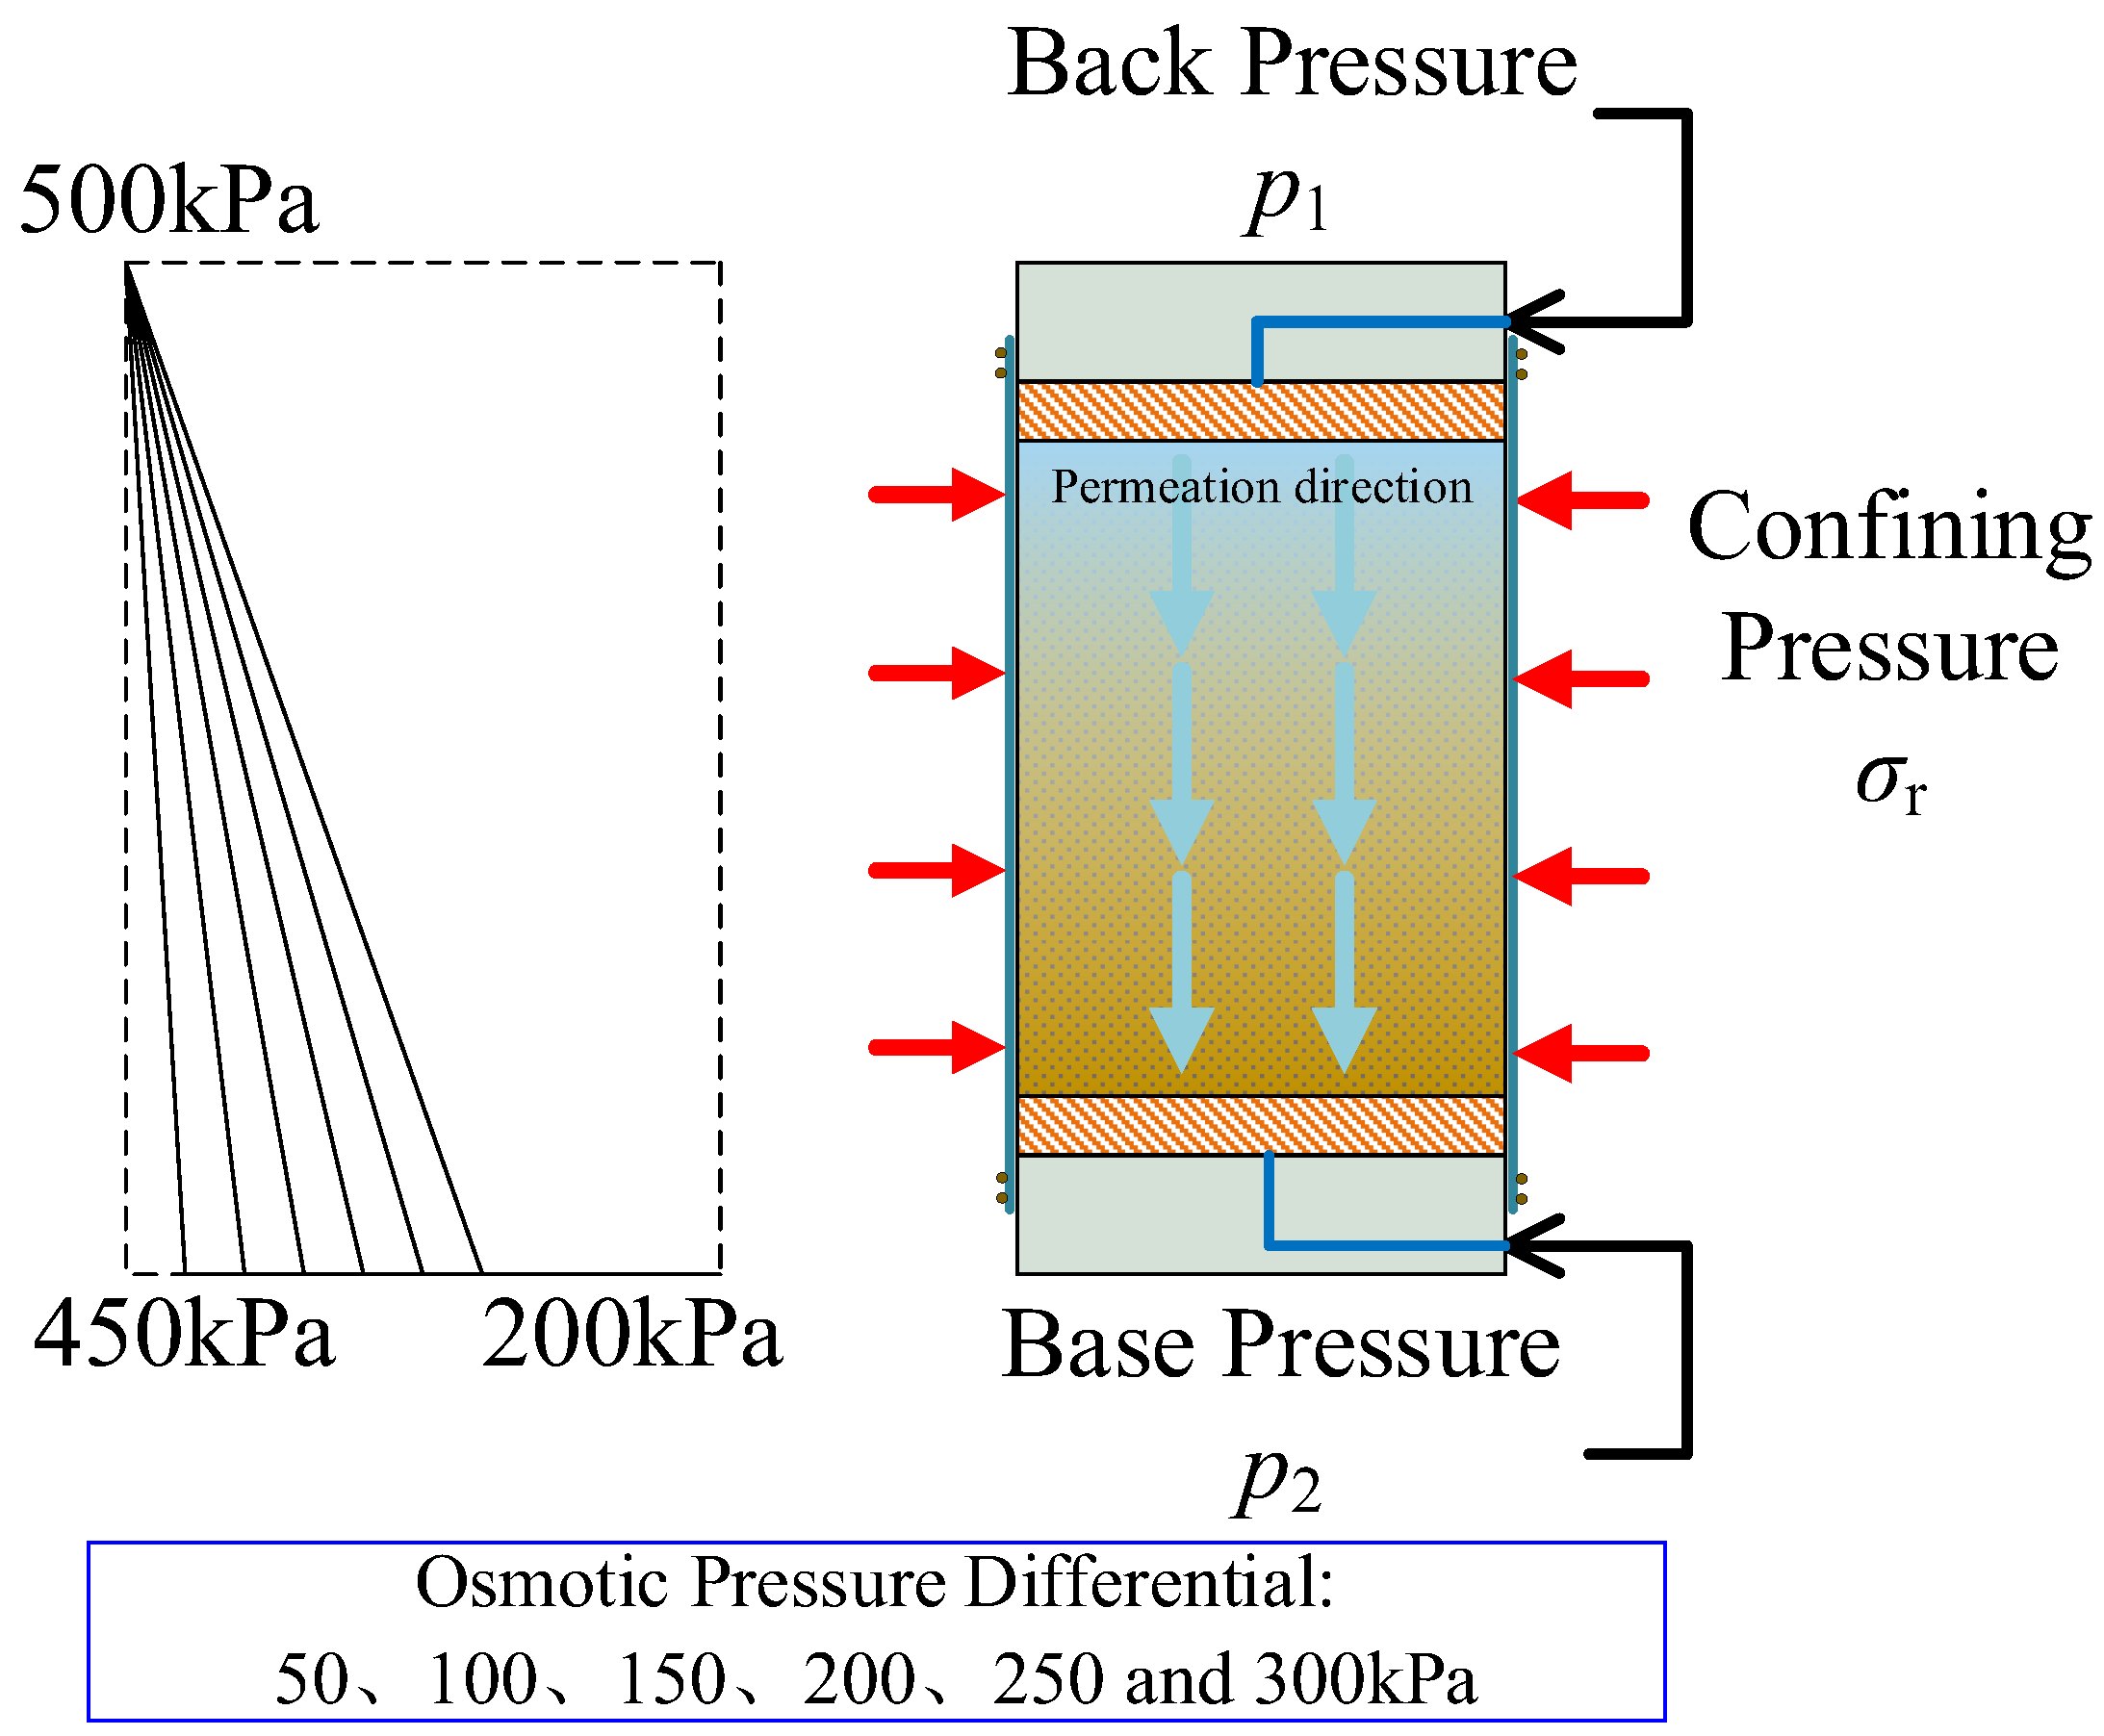
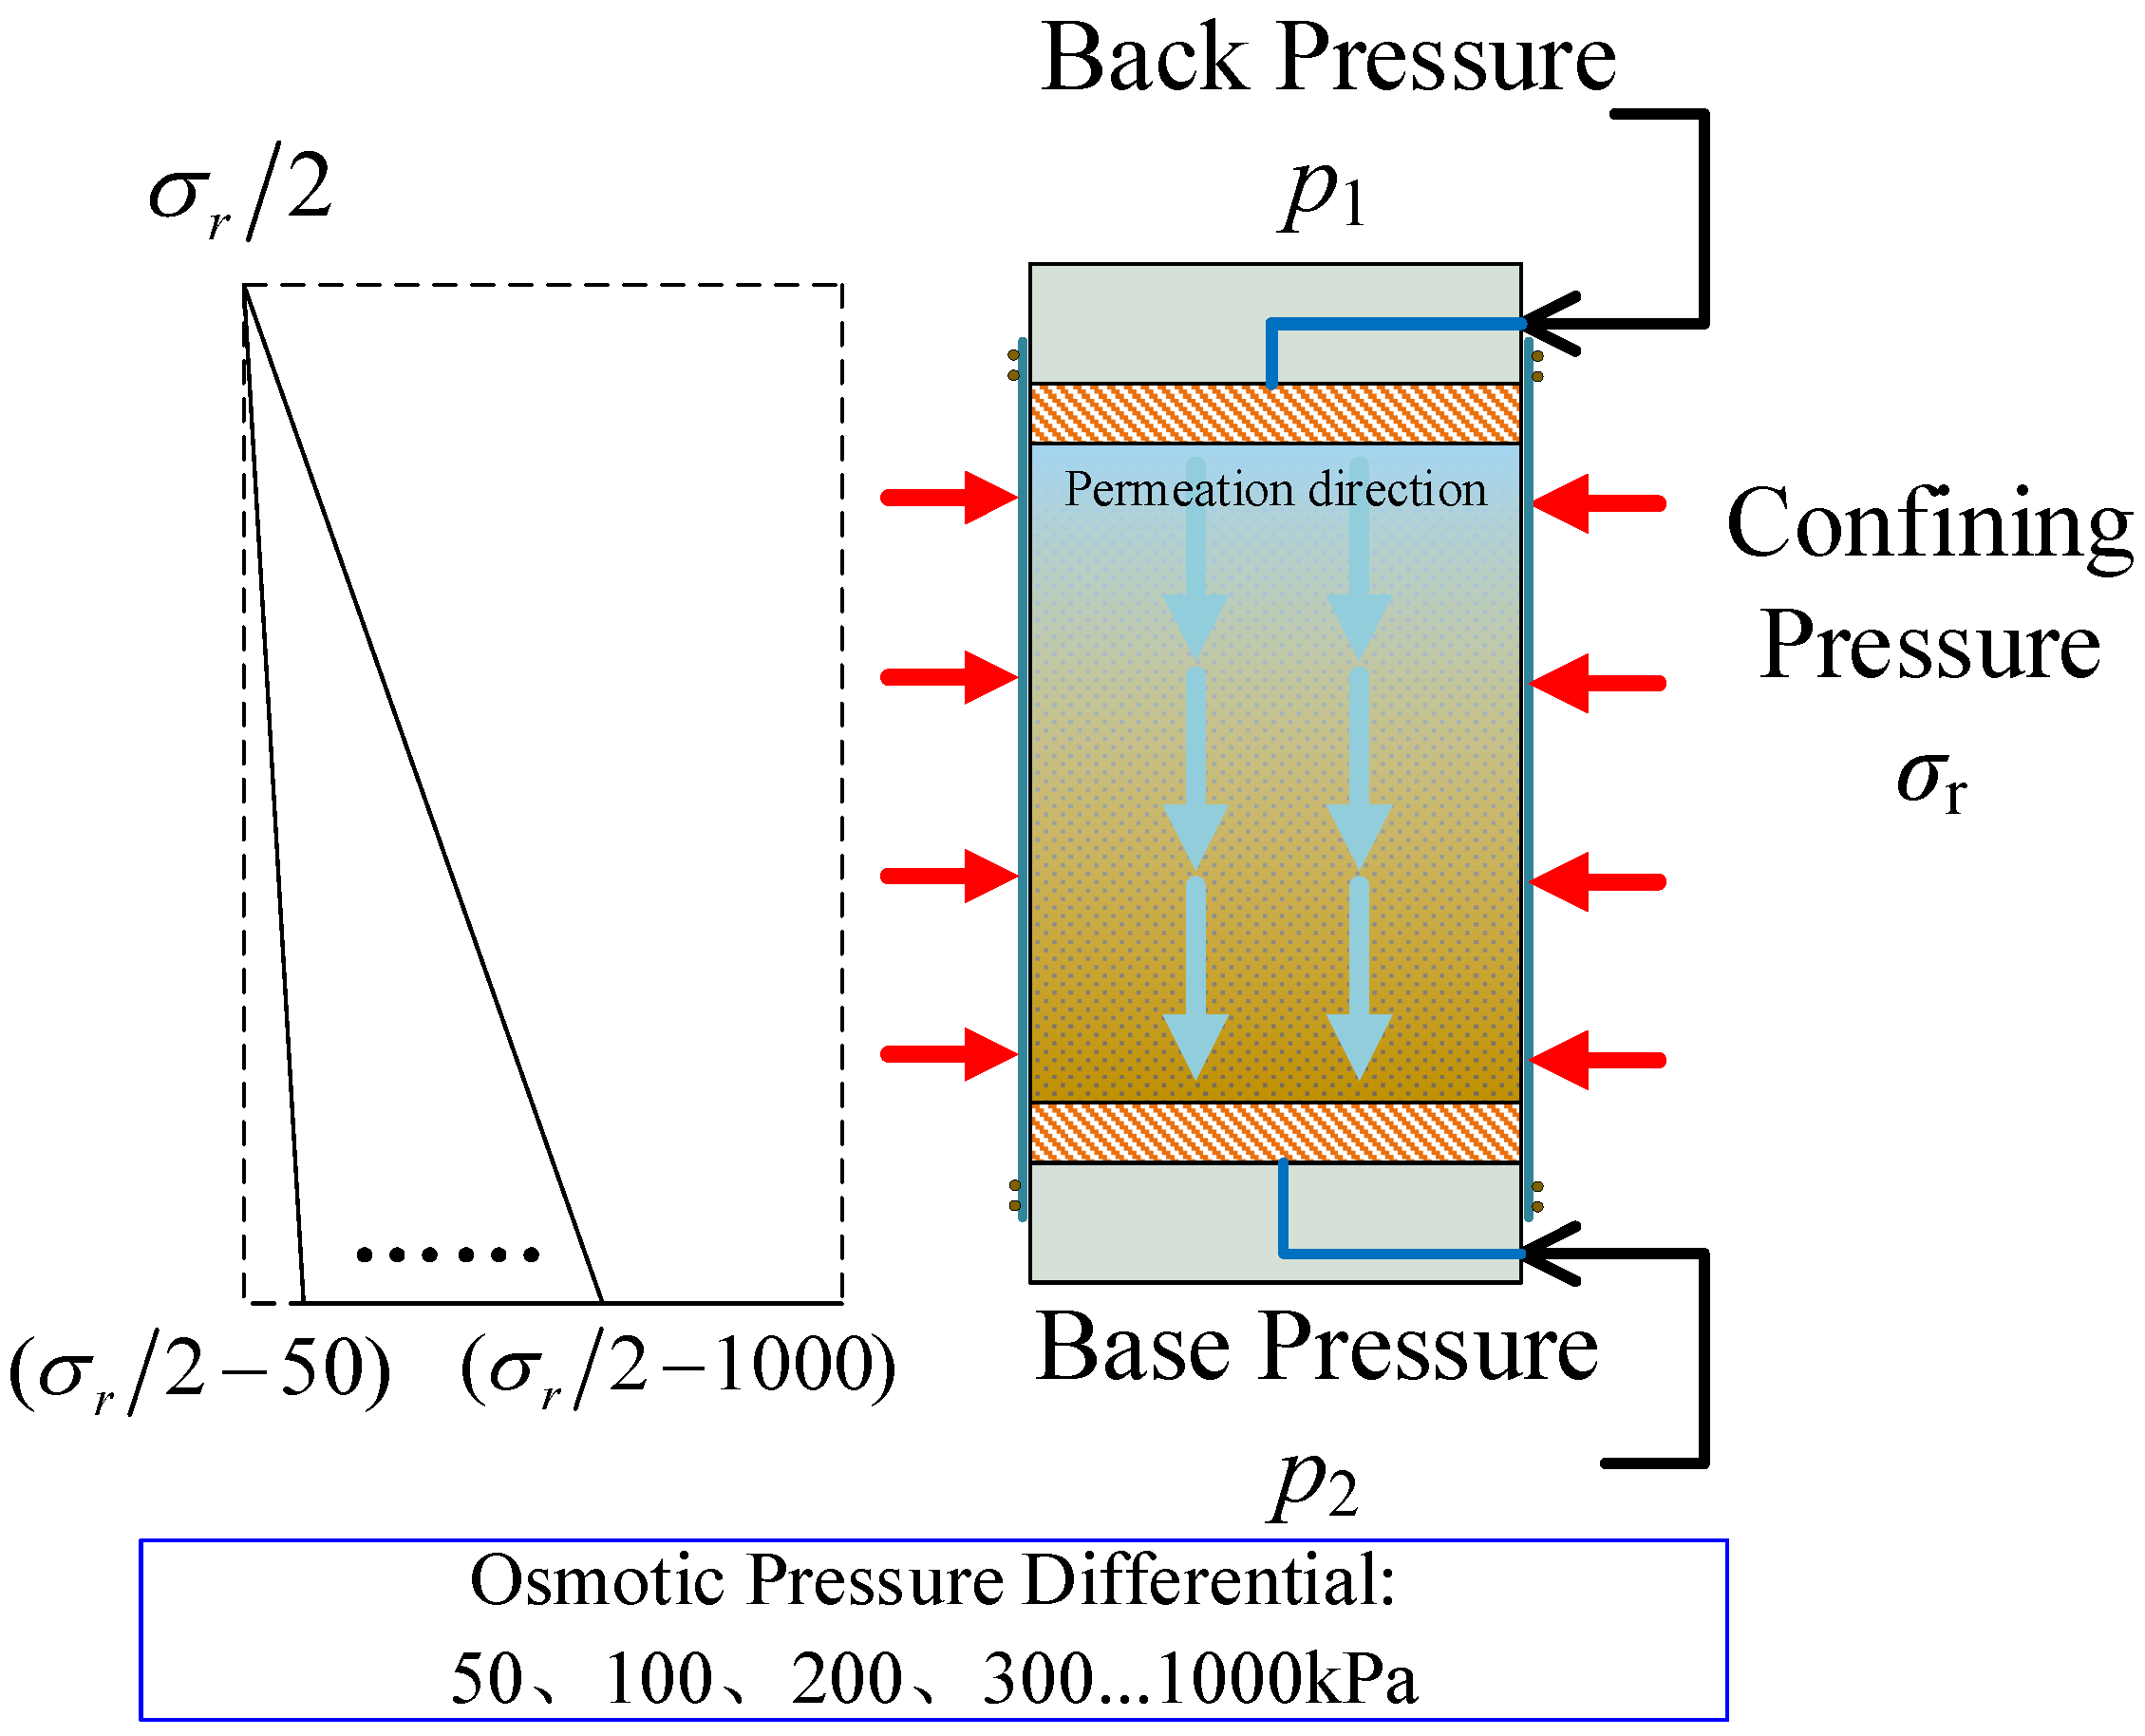
2.3. Experimental Program

In order to study the evolution law of the k v of the clayey sand in the bottom aquifer of thick alluviums under different heads of confined water, σ r , i and loading–unloading methods, four sets of test schemes were formulated in this paper. To simulate the permeability path characteristics of groundwater in the bottom aquifer draining towards the goaf below it, downward permeability was adopted in the seepage test, and the σ r of the test adopted isotropic isobaric loading:
  • Direct loading permeability test of clayey sand with low-confined water.
  • Direct loading permeability test of clayey sand with high-confined water.
  • Fractional loading–unloading permeability test of clayey sand with low-confined water.
  • Fractional loading–unloading permeability test of clayey sand with high-confined water.
A nonlinear permeability test of clayey sand in the bottom aquifer of thick alluviums was carried out by ETAS. The permeability test adopted the steady-state constant water head method. During the test, the confining pressure ( σ r ) and back pressure (water pressure at the upper end of the sample, p1) of the test were controlled so as to remain unchanged, and permeability tests with different osmotic pressures were conducted by adjusting the base pressure (water pressure at the lower end of the sample, p2). During the test, the axial load, axial strain, back volume, base volume and other data were measured by the sensing system, and the test curve was recorded and drawn. The installation of the permeability sample and the testing principles are shown in Figure 4.
A direct loading permeability test of clayey sand with low- and high-confined water was conducted at five σ r levels, namely, 1, 2, 4, 6 and 8 MPa, with 2–4 samples at each σ r level. Schematic diagrams of the permeability test of low- and high-confined water are shown in Figure 5 and Figure 6, respectively.
In the low-confined water seepage test, the p1 was 500 kPa and the p2 was 450, 400, 350, 300, 250 and 200 kPa in turn (that is, the Δ p was 50, 100, 150, 200, 250 and 300 kPa in turn).
In the permeability test of high-confined water, the p1 was σ r / 2 and the p2 was, in turn, σ r / 2 50   kPa , σ r / 2 100   kPa , σ r / 2 200   kPa , σ r / 2 300   kPa , σ r / 2 400   kPa , σ r / 2 500   kPa , σ r / 2 600   kPa , σ r / 2 700   kPa , σ r / 2 800   kPa , σ r / 2 900   kPa and σ r / 2 1000   kPa (that is, the Δ p was 50, 100, 200, 300, 400, 500, 600, 700, 800, 900 and 1000 kPa in turn).
In the process of the graded loading–unloading permeability test of clayey sand with low- and high-confined water, a constant i was set for the same sample, while the σ r was increased step by step first and then reduced step by step according to the original path after reaching the target σ r . The initial σ r of the sample was 1 MPa, with the maximum σ r being 8 MPa and the loading–unloading path of the sample σ r being 1 MPa → 2 MPa → 4 MPa → 6 MPa → 8 MPa → 6 MPa → 4 MPa → 2 MPa → 1 MPa.
Before officially starting the permeability test, the sample was saturated with a clay saturator outside the ETAS triaxial cell, and then it was transferred to the triaxial cell of the ETAS for vacuum saturation, carbon dioxide saturation, head saturation and back pressure saturation in turn. After the B-value detection, it was ensured that the B-value of the sample reached more than 0.95 (that is, the saturation reached more than 95%), and then a permeable test was carried out after being loaded into the target σ r for 24 h.

3. Analysis of the Penetration Test Results

In the process of the ETAS permeability test, by measuring the volume changes of the fluid in the back pressure/volume controller and the base pressure/volume controller, the total amount of pore water seepage, Δ Q i , through the upper and lower ends of the sample during the infiltration time, t , was calculated (i = 1, 2, where 1 represents the upper end and 2 represents the lower end). Then, the average seepage discharge, q i = Δ Q i / t , and seepage velocity, v i = q i / A , in time t could be obtained, where A is the cross-sectional area of the sample.

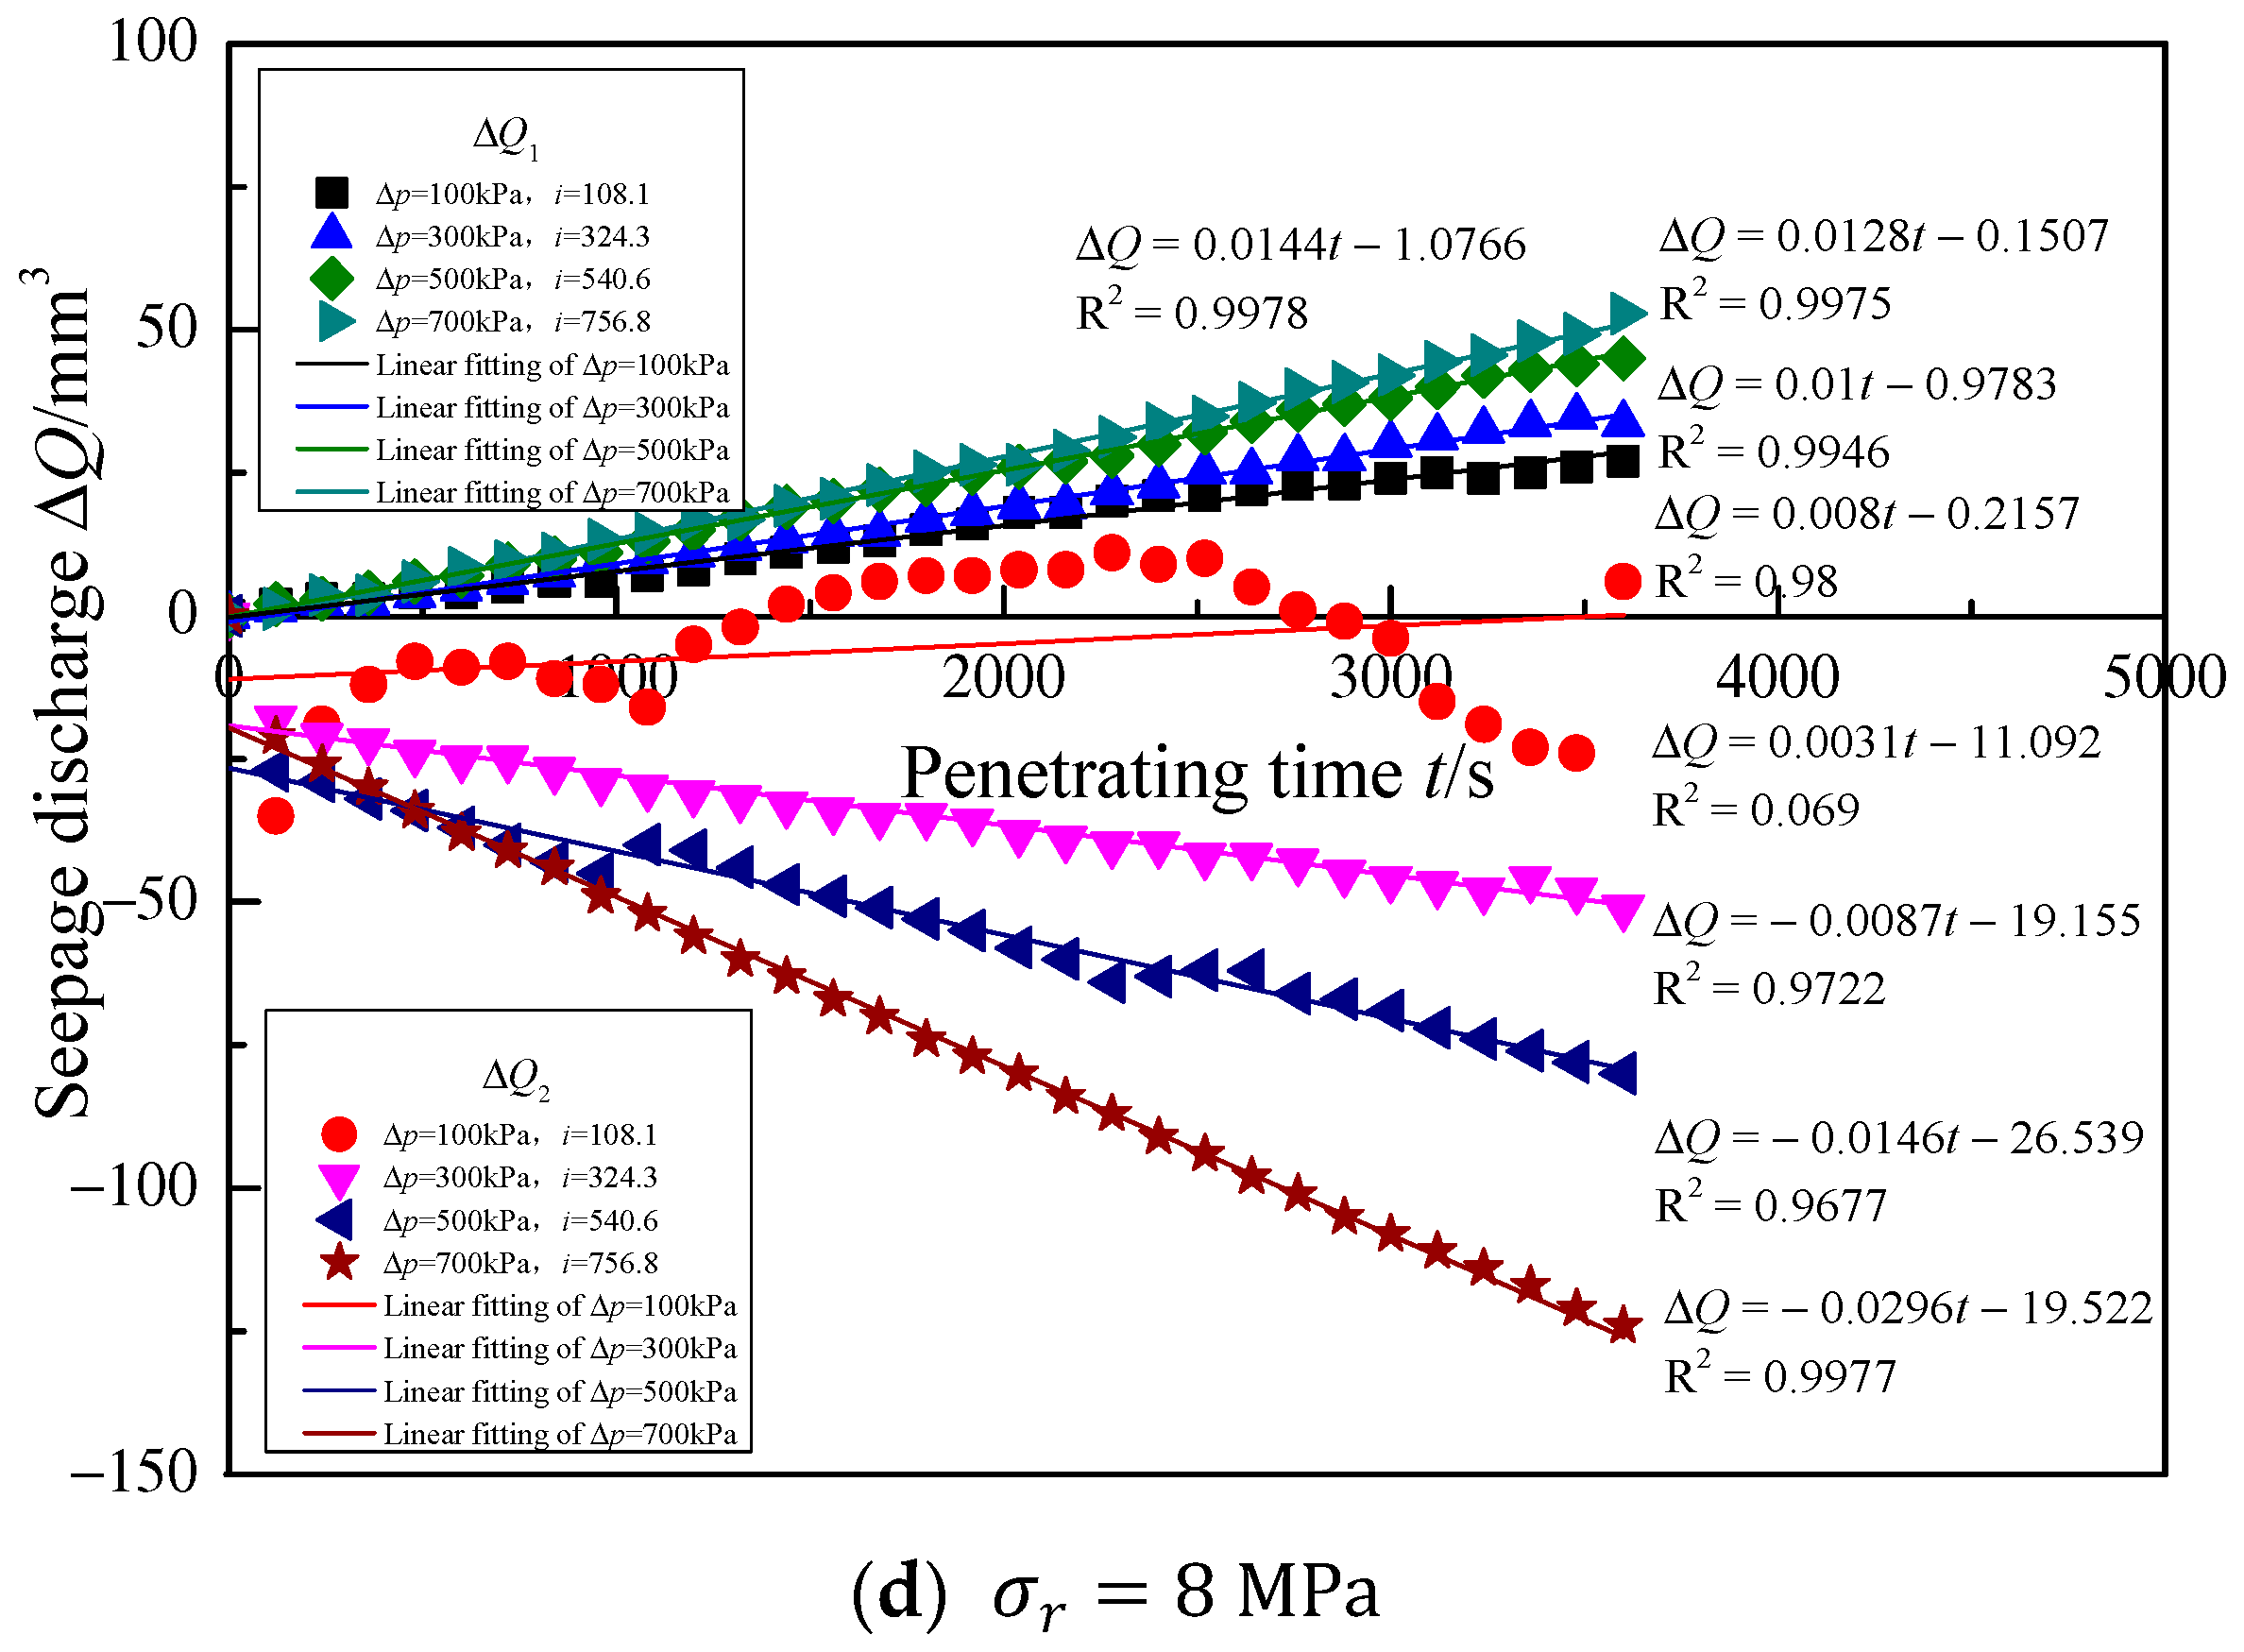
3.1. Analysis of Seepage Discharge Time Course Curves

The frequency of data acquisition was set to once every 10 s by GDSLAB software, and the time–history curves of the seepage discharge of samples under a constant σ r and different Δ p levels are shown in Figure 7 and Figure 8.
In Figure 7 and Figure 8, it can be seen that when the σ r was low, the time–history curves of the seepage discharge of low- and high-confined water showed good linear correlation under different Δ p values. Among them, the linear fitting degree of the seepage discharge time–history curves of low-confined water seepage σ r = 1   MPa and high-confined water seepage σ r 4   MPa were noted, with an σ r above 0.99. When the σ r was high, the linearity of the time–history curve of the seepage discharge of low-confined water decreased, and seepage did not occur gradually; however, the time–history curve of the seepage discharge of high-confined water still had a good linear correlation. Because this seepage test adopted the steady-state seepage method with a constant head, the p1 was constant during the test, and the p2 was adjusted to a constant value at the beginning of the test, resulting in a slight change in the volume of the base pressure/volume controller at the beginning of the seepage test. Therefore, for the same seepage test, the absolute values of the intercept of the time–history fitting curve of the Δ Q 2 were all greater than the absolute values of the intercept of the time–history fitting curve of the Δ Q 1 .
At the beginning of the permeability test, the back pressure/volume controller filled water into the sample, and the back pressure/volume controller received the drainage from the sample. The time–history curve of the Δ Q 1 had a certain lag compared to that of the Δ Q 2 . When the σ r was low, the Δ Q 1 and Δ Q 2 changed almost simultaneously, and the time–history curves all showed a good linear relationship, while the time–history curve of the Δ Q 1 had a small lag. With an increase in the σ r , the time–history curves of the seepage discharge of low- and high-confined water gradually fluctuated, and the Δ Q 1 was less than the Δ Q 2 , with the time–history curve of the Δ Q 1 obviously lagging behind. The reason is that the internal seepage discharge of the sample came from the joint action of the head pressure difference and internal pore water dissipation. With permeability under a low σ r , the Δ Q 1 and Δ Q 2 were mainly affected by the head pressure difference, and the influence of the internal pore water dissipation was negligible compared to the head pressure difference. As the σ r increased, the sample became compacted and the permeability decreased. The changes in the head pressure difference and internal pore water dissipation on the Δ Q 1 and Δ Q 2 cannot be ignored. Among them, the Δ Q 1 was mainly caused by the head pressure difference that resulted from a drop of the p2, while the change in the Δ Q 2 came from the dissipation of the internal pore water near the lower end of the sample caused by a sudden drop in the water head in the early stage. As the influence of the internal pore water dissipation spread to the upper end of the sample, the change in the Δ Q 2 was gradually influenced by the head pressure difference.

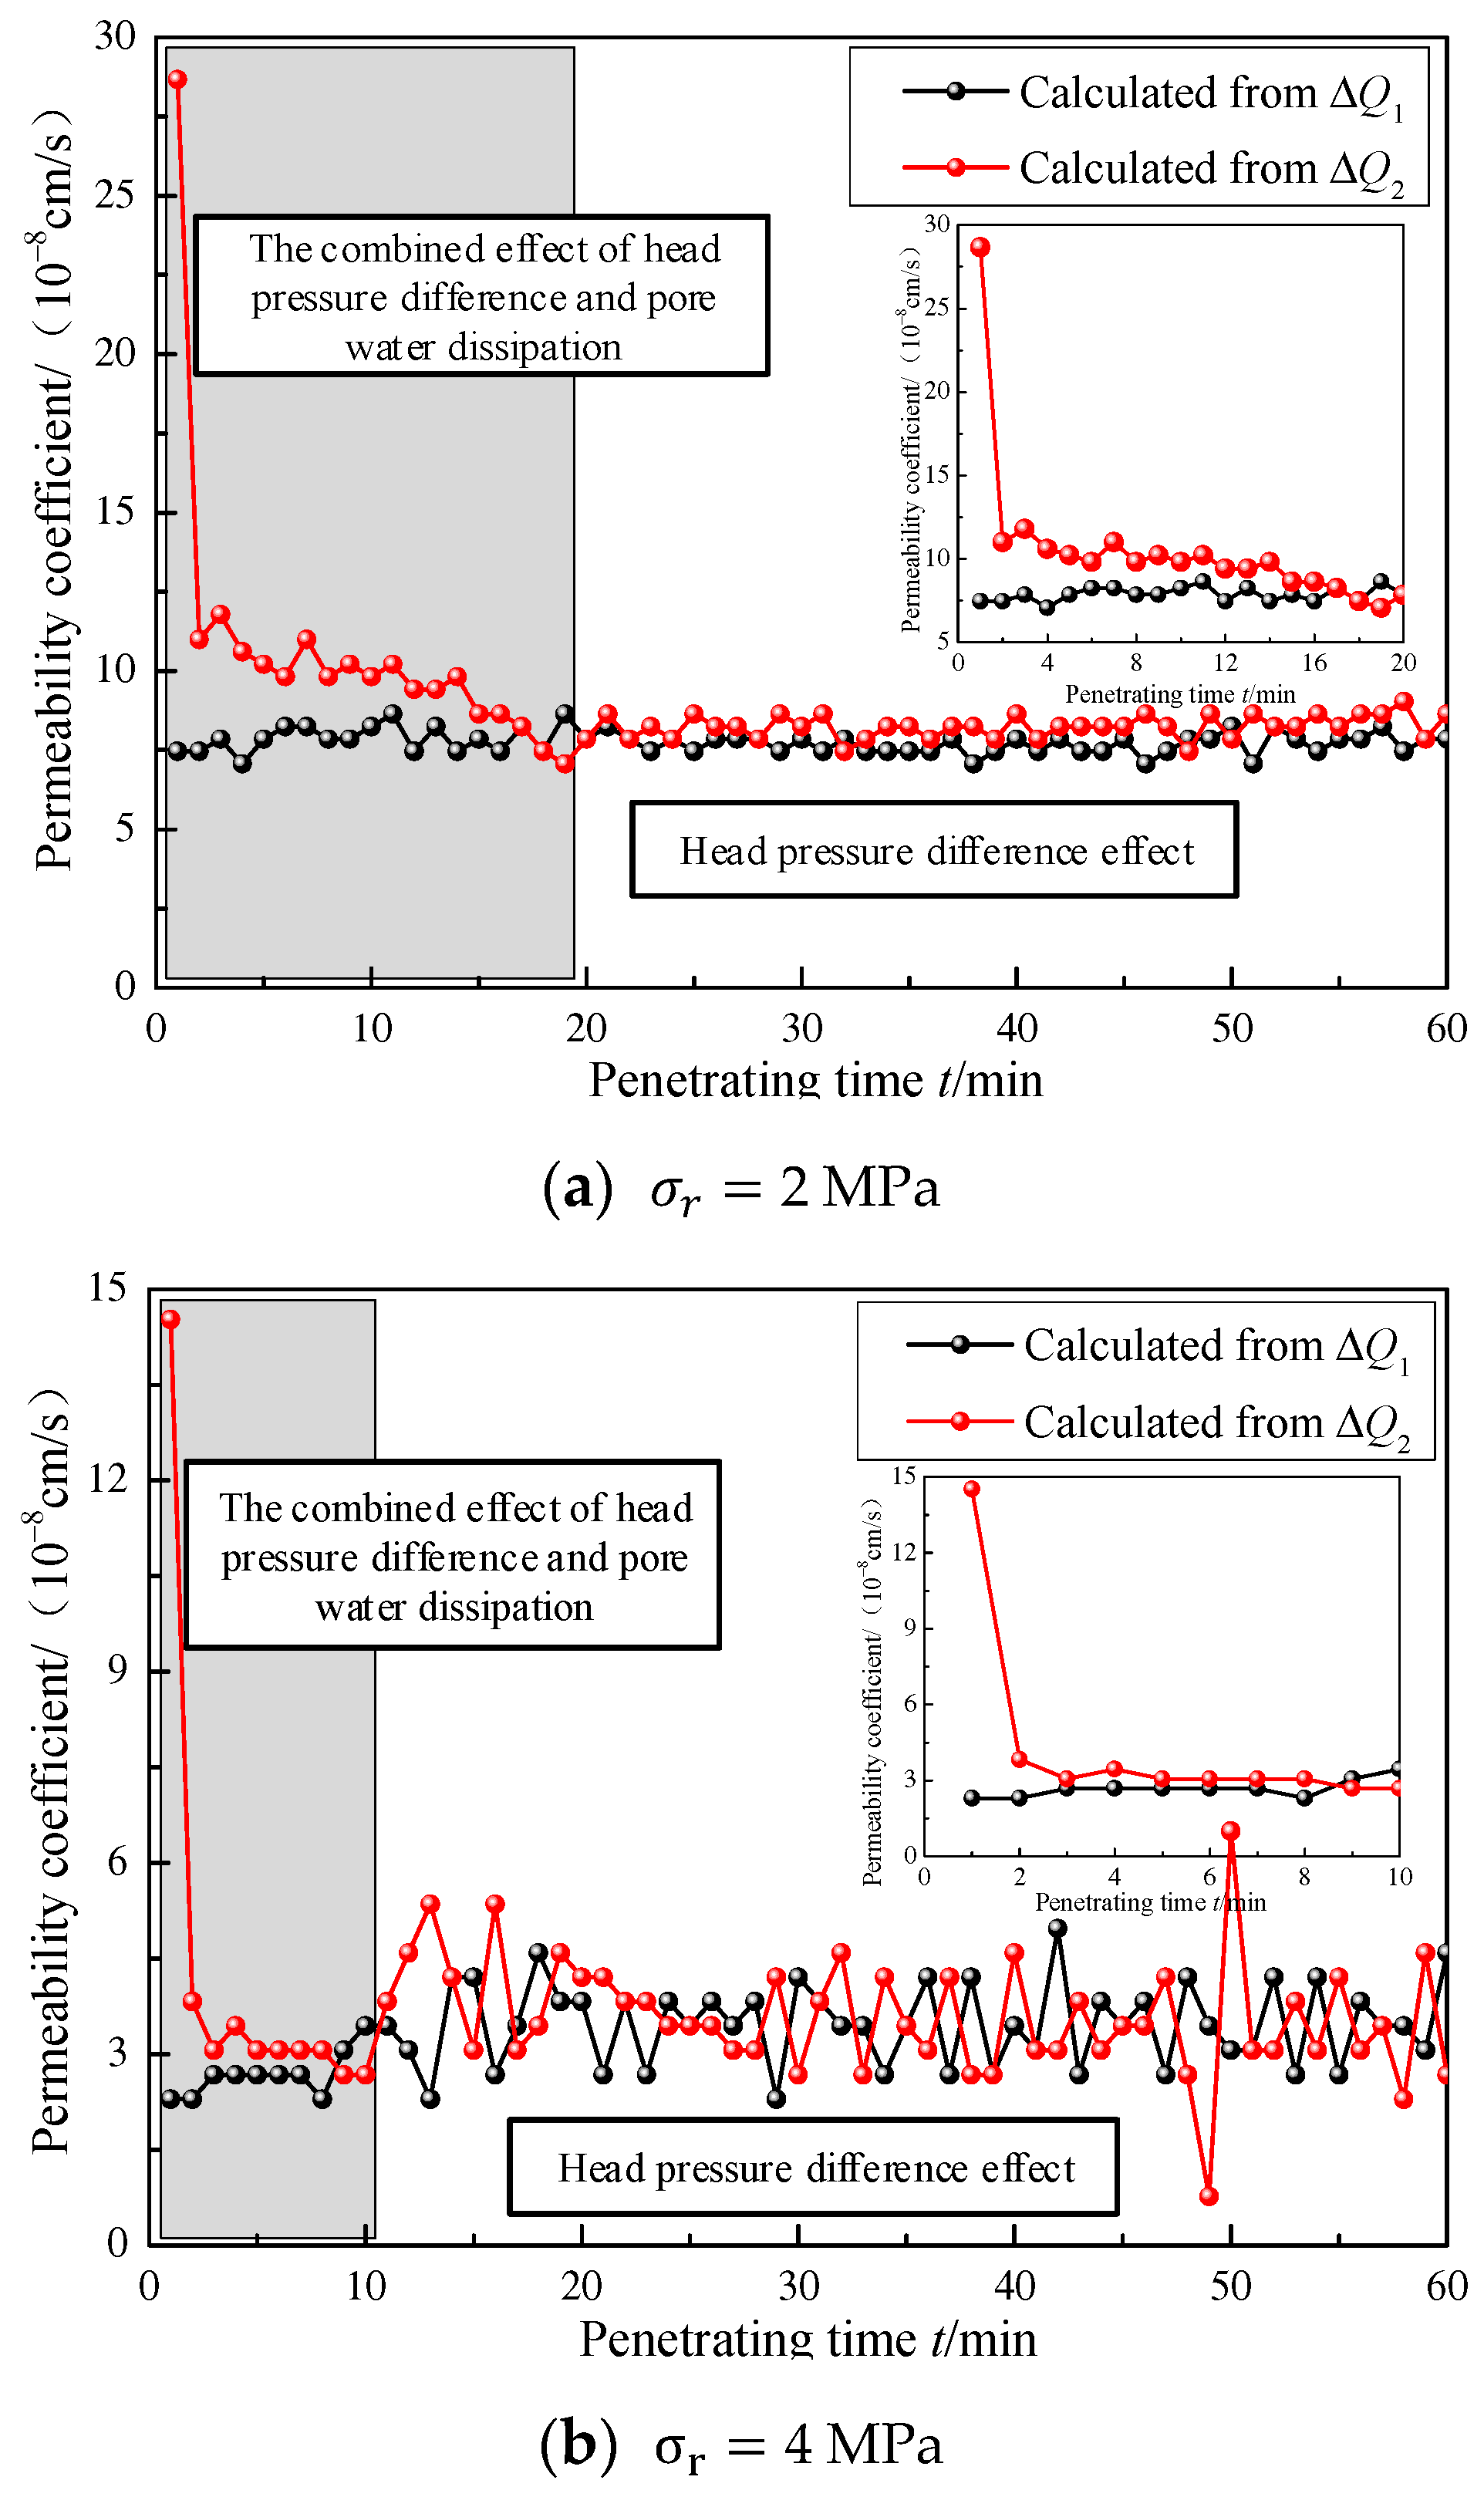
3.2. Analysis of the Evolution Pattern of the Permeability Coefficient ( k v ) with Time

The k v can be calculated according to the following steps [32]: After the consolidation test was completed, several groups of permeability tests with different osmotic pressure differences ( Δ p i ) ( i = 1, 2, …) were set under the condition of keeping a certain σ r unchanged. Then, the test data under a certain Δ p i were divided into N sections according to 10 min, and the seepage discharge increment, Δ Q , and corresponding seepage velocity, v , in this time period were calculated. According to the Δ p i of this stage and the height of the soil sample, H , the hydraulic gradient was calculated as Δ p i / ( γ w H ) , where γ w is the bulk density of water. Then, Darcy’s law was used to calculate the permeability coefficient, k v i , j = γ w H Δ Q / A t Δ p i , in the j - th period of N periods under a certain Δ p i . Following this, the obtained k v i , j was analyzed. The principle is as follows: Write the calculated values of k v i , j in N time periods in the form of k v i , j = B × 10 n , select more than four results whose difference between the maximum and minimum B -values of the same power n is not more than 2.0, take the average value as the k v i , j under the Δ p i of this level, and then take the average value of k v i , j under the Δ p i of all levels as the k v i , j corresponding to the stable porosity ratio when the σ r of a certain level is constant.
The clayey sand was subjected to permeability tests at a certain σ r for 1~3 h. The osmotic pressure differences ( Δ p ) were uniformly 200 kPa, and the relevant test parameters and results after the seepage stability are shown in Table 2.
The variation of the permeability coefficient with time for clayey sand during the permeability of low- and high-confined water is shown in Figure 9 and Figure 10, respectively.
Comparing the curves of the permeability coefficient of low- or high-confined water of clayey sand with time under different σ r values, it can be found that the permeability coefficient k v 2 calculated from the Δ Q 2 decreased gradually with increasing time under different σ r values. However, the permeability coefficient k v 1 calculated by the Δ Q 1 gradually increased and tended to become stable with increasing time under different σ r values. It is inferred that the hydrophobic effect of the sample in the early stage of the permeability test was greater than that of osmotic pressure differences, and the hydrophobic effect was almost over in the middle and late stages of the test, only affected by the osmotic pressure differences.
The Δ Q 2 was first influenced by the hydrophobic effect, and when the hydrophobic effect and osmotic pressure differences gradually affected the Δ Q 1 , the seepage path of the whole sample gradually opened, while the k v 1 kept increasing and tended to be stable, which could also be obtained from the seepage discharge time–history curve. Because the clayey sand in the bottom aquifer had a fine and clay particle content of 6.6% with a particle size of less than 0.075 mm, the k v 1 could not be rapidly increased to the maximum value, but gradually increased and then stabilized under the dynamic balance of the hydrophobic effect and osmotic pressure difference.

3.3. Analysis of the Influence of Confining Pressure on the Permeability Coefficient, k v

3.3.1. Direct Loading to Constant Confining Pressure

The fitting curve between the k v of low- and high-confined water and the σ r , after the clayey sand was stabilized under different σ r values and the same osmotic pressure differences, is shown in Figure 11. From the diagram analysis, it can be seen that the k v of clayey sand decreased nonlinearly with an increasing σ r , regardless of whether in a low- or high-confined water state. When the σ r was 1 MPa, the k v was obviously greater than that under a high σ r . According to preliminary analysis, this phenomenon is related to the structural characteristics of the internal permeability pores of the sample, and this phenomenon will be analyzed and discussed by using the low-field NMR testing system later, so it will not be repeated here.
With an increase in the σ r , the pore structure in the sample changed, and the seepage pore gradually narrowed and closed, leading to a decrease in its permeability coefficient. In order to show the nonlinear decreasing relationship of the permeability coefficient of the clayey sand sample with an increasing σ r , the power function was used to fit the test results:
k v = k 0 σ r α
where k 0 is the initial permeability coefficient, α is the coefficient, and σ r is the confining pressure.
According to the test data and Formula (1), the fitting curves and equations of the relationship between the σ r and permeability coefficient of low- and high-confined water, as shown in Figure 11, could be obtained, and the fitting correlation coefficients, R 2 , were all above 0.9, which shows that the power function reliably fits the relationship between the σ r and permeability coefficient of clayey sand.

3.3.2. Loading and Unloading of the σ r Step by Step

When the osmotic pressure difference of the clayey sand sample was constant at 200 kPa, the same sample was subjected to progressive loading and unloading permeability tests, and the fitting curves of the permeability coefficients of the unloading path and the unloading path changing with the σ r during the loading–unloading permeability test were obtained, as shown in Figure 12, while the corresponding test parameters and results are shown in Table 3.
As can be seen from Figure 12 and Table 3, when the σ r increased from 1 to 8 MPa, the permeability coefficient first continuously decreased and then continuously increased when the σ r was gradually unloaded from 8 to 1 MPa, but its permeability coefficient could not be restored to the initial value. That is, under the same σ r , the permeability coefficient during loading was greater than that during unloading. The reason is that the clayey sand sample underwent shrinkage deformation with an increasing σ r , one part of which could be recovered and the other part could not. The recoverable shrinkage deformation was mainly caused by the change in pore volume between sand particles. The pores were compressed with an increase in the σ r and restored with a decrease in the σ r . Meanwhile, the irrecoverable shrinkage deformation was caused by breakage of the structural strength formed by sand particles and clay particle rearrangement.
Through the power function fitting curve in Figure 12, it can be found that the loading–unloading permeability coefficient of clayey sand was basically consistent with the fitting curve of the σ r in low- and high-confined water permeability, but under the same σ r , the recovery degree of the two confined conditions was different. In view of this phenomenon, Zhang Gailing [30] defined the recovery ratio of the loading–unloading permeability coefficient under different σ r values: Recovery ratio = k unload / k load , and the calculation results are shown in Table 4.
It can be seen from Table 4 that the recovery ratio of the permeability coefficient of high-confined water was greater than that of low-confined water, and the recovery ratio of the permeability coefficient increased with an increasing σ r .

3.4. The Influence Analysis of Hydraulic Gradient “i” on the Permeability Coefficient, k v

When σ r values of 2 and 4 MPa were applied to the clayey sand samples, respectively, permeability tests with different hydraulic gradients were performed while keeping their σ r constant, and the relationship curve between k v and i under the same σ r could be obtained, as shown in Figure 13. The curve shows that the variation law of low- and high- σ r permeability coefficients with an increasing i was completely different.
The permeability of clayey sand is different from that of sandy and clayey soil, and its k v is simultaneously affected by the seepage characteristics of sandy and clayey soil. The seepage of sandy soil obeys Darcy’s law. Because of the viscous resistance of adsorbed water, the pore water can seep only if the i is greater than the initial hydraulic gradient. The infiltration process of clayey sand in the bottom aquifer of a thick alluvium is influenced by the initial hydraulic gradient of clayey soil, the non-Darcy infiltration of clayey soil, the Darcy infiltration of sandy soil and the drainage effect of clayey sand samples; each factor has a different influence on the permeability characteristics under different infiltration conditions.
The concrete manifestations were as follows: When the σ r was low, clayey sand was dominated by Darcy infiltration of sandy soil, and when the head pressure difference was 50 kPa, there was a smooth seepage channel inside the sample. With the increase in i , the effective back pressure ( σ r p 1 ,   its   value   calculation   meets   σ r p 1 = σ r p 1 ) remained unchanged, while the effective base pressure ( σ r p 2 ,   its   value   calculation   meets   σ r p 2 = σ r p 2 ) kept increasing, resulting in a decrease in the size of the whole seepage channel and a gradual decrease in the k v , as shown in Figure 13a,b. When the σ r was high, the seepage process was influenced by the non-Darcy seepage of clayey soil and the Darcy seepage of sandy soil. Under a high σ r , the pores were compressed, the soil skeleton was closed, and the viscous particles blocked the seepage channel. When the head pressure difference was 50 kPa, there was almost no smooth seepage channel in the sample. At this time, the changes in the Δ Q 1 and Δ Q 2 were mainly due to the drainage effect caused by a decrease in the p2. As i increased to the initial hydraulic gradient, during the transition from non-Darcy seepage of clayey soil to Darcy seepage of sandy soil, the k v gradually increased. Then, with a continuous increase in the σ r p 2 , the size of the whole seepage channel of the sample decreased, while the k v also gradually decreased; that is, the k v gradually increased and then decreased with i , as shown in Figure 13c,d. This law is also reflected by changes in the Δ Q 1 and Δ Q 2 . When the σ r was low, the changes in the Δ Q 1 and Δ Q 2 were highly consistent and synchronized, basically meeting Darcy’s law. When the σ r was high, changes in the Δ Q 1 were obviously delayed compared to changes in the Δ Q 2 , and then tended to be consistent, having the permeability characteristics of non-Darcy infiltration of clayey soil and Darcy infiltration of sandy soil.

3.5. Applicability Analysis and Parameter Determination of the Bottom Aquifer Permeability Model

The permeability coefficient of clayey sand in the bottom aquifer of thick alluviums decreased nonlinearly with a decreasing void ratio during the consolidation process. In response to the nonlinear relationship between the permeability coefficient and void ratio of cohesive soil, scholars at home and abroad have conducted a vast amount of research, mainly including the following:
(1)
The lg [ k v ( 1 + e ) ] lg e permeability model.
Taylor [33] obtained the expression of the permeability coefficient of sand through a sand permeability test:
k v = C e 3 1 + e ,
Samarasinghe [34] proposed the e k v relationship model for general normal consolidated clay according to Formula (2):
k v = C e n 1 + e ,
That is, lg [ k v ( 1 + e ) ] = lg C + n lg e , where C represents the reference permeability coefficient reflecting the properties of the soil and n represents the soil parameter.
(2)
The e lg k v permeability model.
e = C k lg ( k v / k v 0 ) + e 0 = C k lg k v + e 0 ,
where C k is the permeability index; e 0 and k v 0 are the initial void ratio and the initial permeability coefficient, respectively; e 0 is the pore ratio corresponding to the unit vertical permeability coefficient.
Formula (4) is the most commonly used model to express nonlinear changes of the permeability coefficient with the void ratio. Mesri [35] pointed out that e lg k v represented by Formula (4), has a linear relationship, which is applicable to common clays in engineering.
(3)
The lg k v lg e permeability model.
Mesri [36] found, through research, that if the variation range of the clay pore ratio is too large, the applicability of Formula (4) is poor, and then put forward an improved lg k v lg e model:
k v = B e A ,
That is, lg k v = A lg e + lg B , where A and B are the parameters of clay permeability.
(4)
The lg k v lg ( 1 + e ) permeability model.
Xie Kanghe [37] once proposed the following nonlinear permeability model: k v = k v 0 1 + e 1 + e 0 2 . Then, the model was improved and a new model regarding the permeability coefficient and void ratio was put forward [38]:
k v = k v 0 1 + e 1 + e 0 α ,
That is, lg k v = α lg 1 + e 1 + e 0 + lg k v 0 = α lg ( 1 + e ) + β , where α and β are the soil parameters, which can be obtained by analyzing test data and fitting curves.
Through the regression fitting of the nonlinear relationship between four common pore ratios and permeability coefficients to clayey sand permeability test data, the statistical regression values and corresponding R2 parameters for the four nonlinear infiltration models’ parameters were obtained, and the results are shown in Table 5.
From Table 5, it can be seen that all four permeability models had relatively high fitting degrees for the clayey sand in the bottom aquifer, with the fitting correlation coefficient, R2, exceeding 0.95. From the perspective of engineering application, all four nonlinear permeability models are suitable for the nonlinear permeability of clayey sand in the bottom aquifer in the Juye mining area. The fitting degree of Model lg [ k v ( 1 + e ) ] lg e was the highest, and the fitting correlation coefficient, R2, of the high-confined water permeability model was slightly higher than that of the low-confined water permeability model.

4. Pore Structure Characteristics and Nonlinear Permeability Mechanism of Clayey Sand
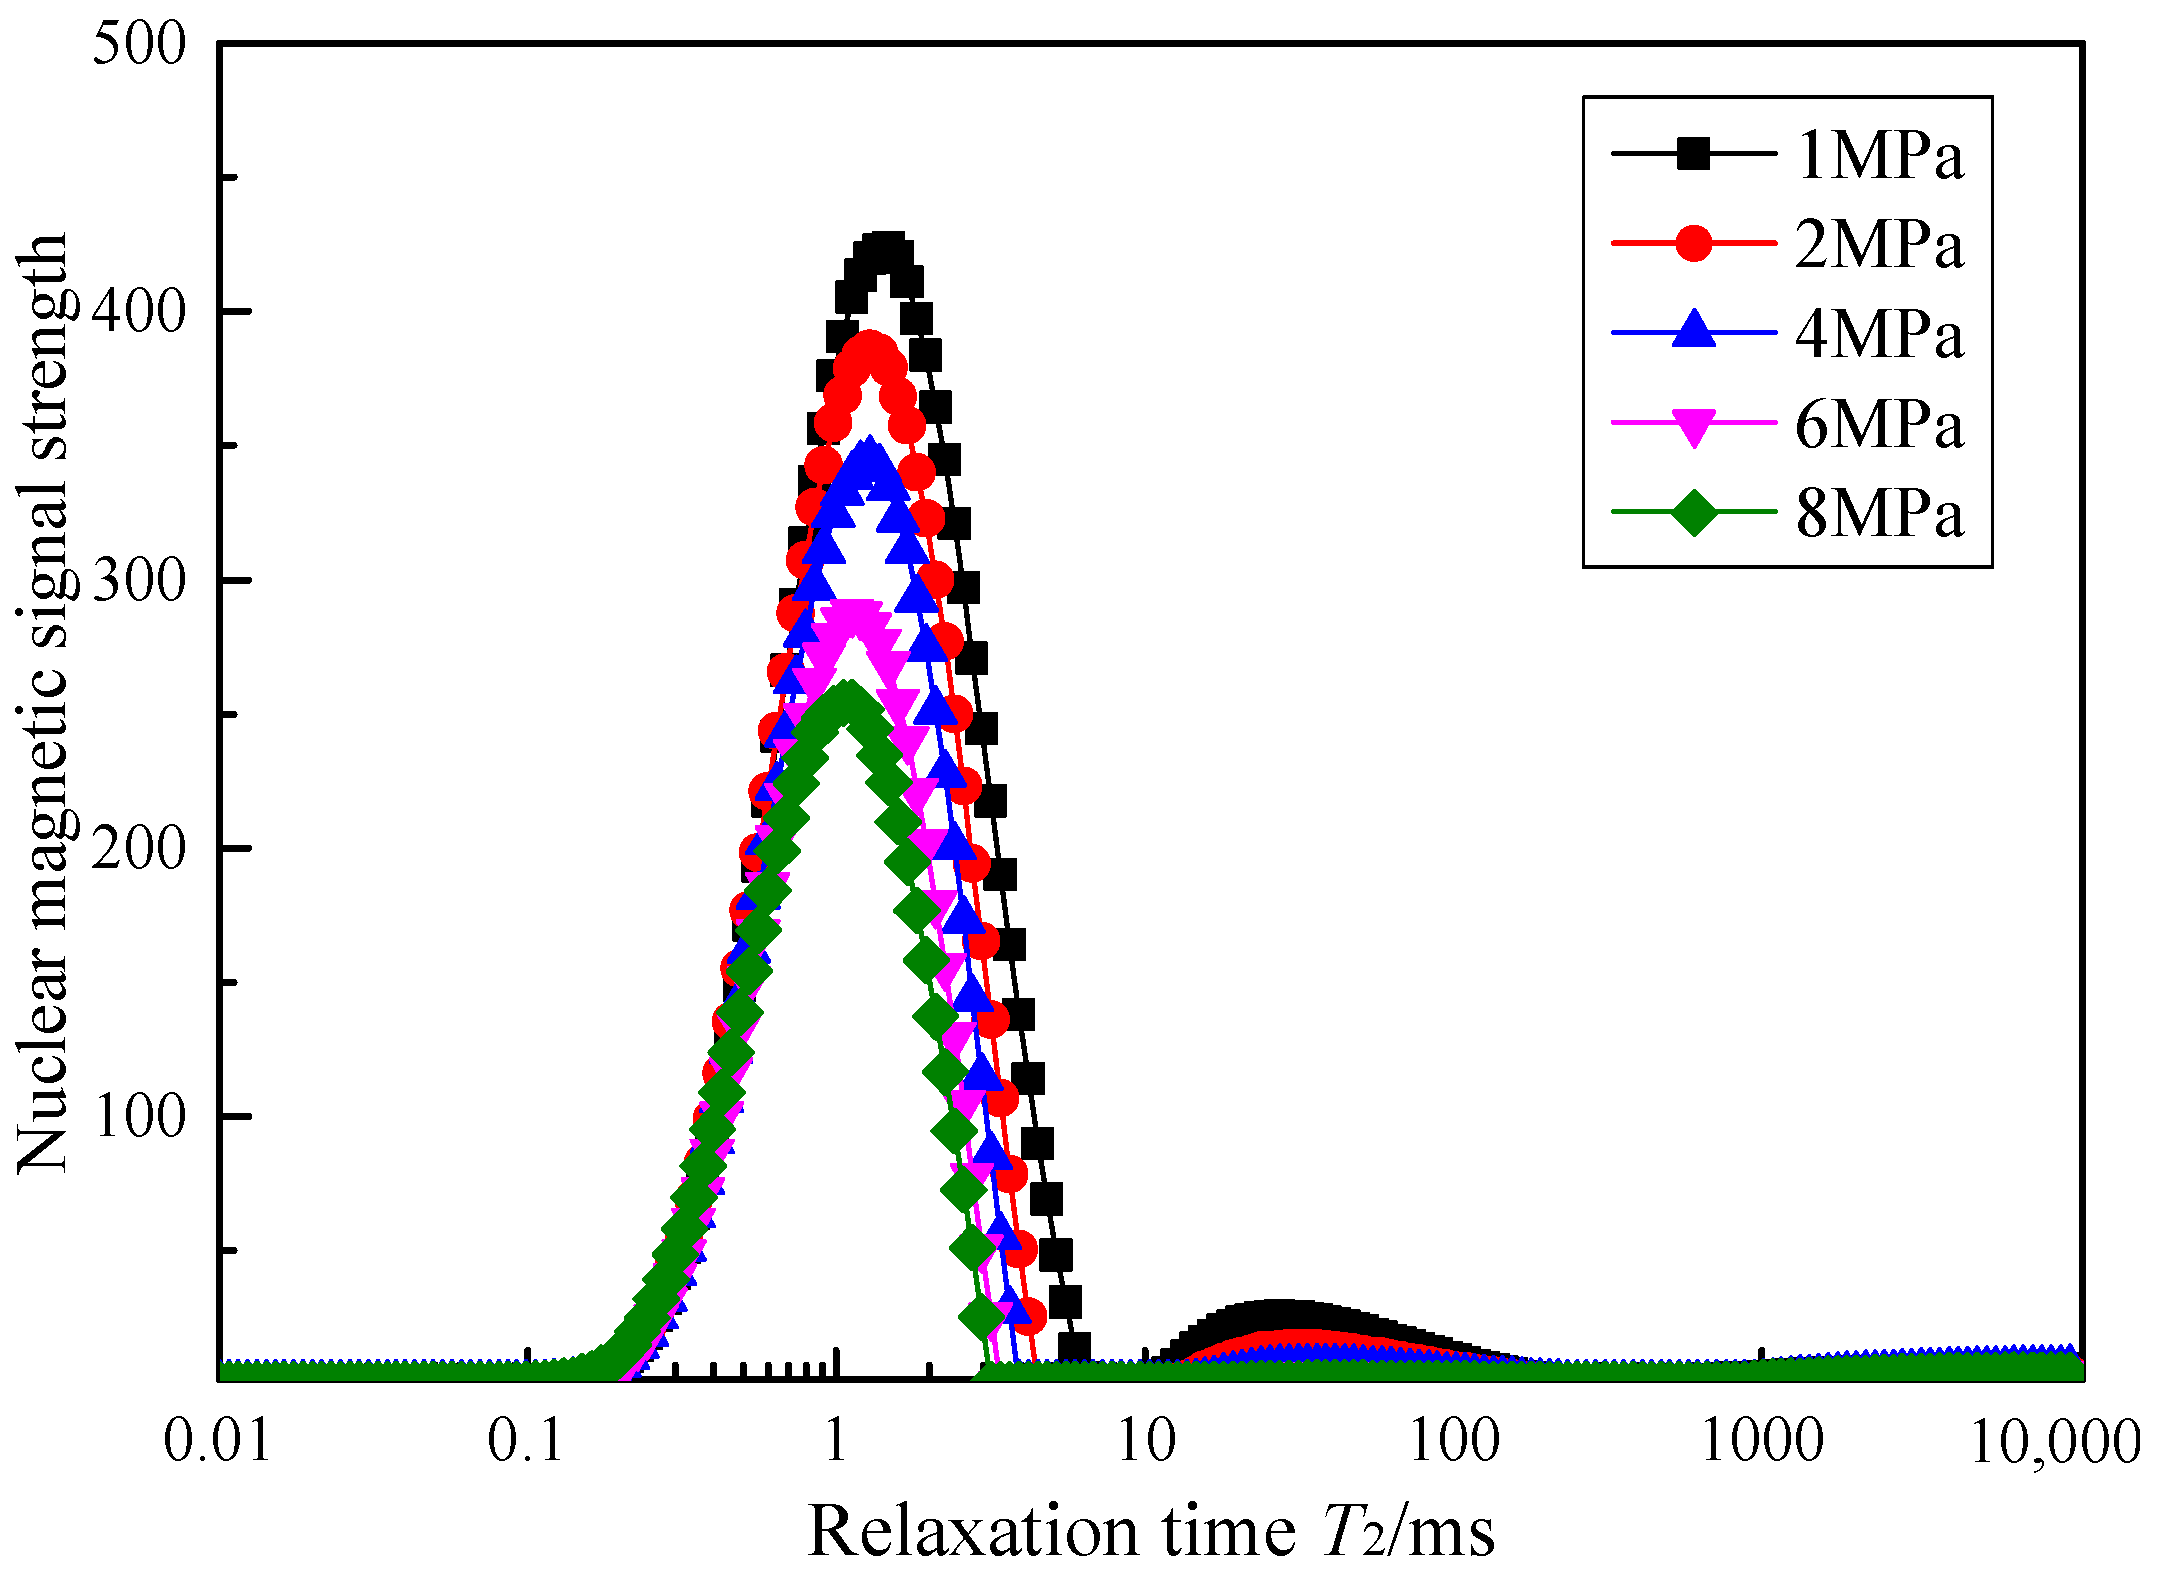
The pore water type and pore structure distribution of clayey sand under different stress levels determine its macro-mechanical and hydraulic characteristics. In order to reveal the nonlinear permeability mechanism of clayey sand from the aspect of pore structure characteristics, low-field NMR technology was selected to study the pore structure characteristics of clayey sand in detail.
The MesoMR23-060V-I low-field nuclear magnetic resonance testing system (NMR) was adopted for the nuclear magnetic resonance test. The physical object of the system is shown in Figure 14, and the main technical parameters are shown in Table 6.
Low-field NMR uses an external magnetic field to calibrate the hydrogen magnetic moment, so that the hydrogen-containing fluid generates a dipole moment, and the pore structure volume filled with the fluid is measured according to the proportional relationship between the amplitude of the dipole moment and the number of hydrogen atoms. The time evolution of the dipole moment can be decomposed into the decay time spectrum, that is, longitudinal T 1 and transverse T 2 relaxation time distribution. In this paper, the T 2 relaxation measurement was used to characterize the pore types. T 2 relaxation in NMR mainly adopts surface relaxation of the water–soil interface, which is a function of the pore surface volume ratio:
1 T 2 = ρ 2 S V ,
where T 2 is the transverse relaxation time caused by surface interaction, ρ 2 is the transverse relaxation strength constant, and S / V is the surface–volume ratio related to pore size.
Because of the high S / V value of small pores, Formula (7) shows that hydrogen protons in small pores relax faster than those in large pores [39,40]. Therefore, the distribution of the T 2 in the sample reflects the distribution of pore size, and the relaxation time of the smallest pore is the shortest and that of the largest pore is the longest.

4.1. Clayey Sand T 2 Spectrum Distribution Law

According to the relaxation principle of low-field NMR, water in small pores experiences greater surface relaxation, so it relaxes faster than water in large pores. Therefore, the T 2 distribution is similar to the pore size distribution, in which each relaxation time corresponds to the pore size: Larger pores correspond to longer relaxation times and smaller pores correspond to shorter relaxation times [40]. Bai Songtao [41] proved that the pore structure corresponds to the T 2 spectrum distribution one by one through a mercury injection test; that is, the larger the pore throat diameter, the greater the corresponding T 2 value.
T 2 spectrum distribution features include the number, size, and location of T 2 spectrum peaks, among which different spectrum peaks reflect various types of seepage paths of clayey sand. In order to quantitatively analyze the pore structure of clayey sand under different stress states, after the permeability test, T 2 spectrum distribution characteristic curves of saturated clayey sand under different stress states were obtained using low-field NMR technology and reflecting the pore structure with the T 2 value of pore liquid water, as shown in Figure 15.
As can be seen from Figure 15, the T 2 spectrum distribution law of clayey sand was almost the same under different stress states, basically of the bispectrum peak type. The first spectrum peak was located in the range of transverse relaxation time, T 2 = 0.01~5 ms, and the second spectrum peak was located in the range of transverse relaxation time, T 2   = 10~100 ms. The signal amount of the first spectrum peak was large, so it can be assumed that there are a large number of tiny pores in clayey sand. Because clayey sand contains more fine clay particles and large specific surface areas, there are more tiny pores in clayey sand. The first peak is the main spectrum peak, the second peak is the subspectrum peak, with almost no nuclear magnetic signal between the two peaks, which indicates that the connectivity between the two pores was poor. With an increase in σ r , the signal intensity and interval width of the first and second spectrum peaks decreased, which shows the closure of seepage pore and the decrease in channels. Specifically, in the interval of transverse relaxation time T 2 = 0.01~5 ms, the pore structure under different stress states was almost the same, but with an increase in σ r , the peak point of the spectrum peak in the interval decreased continuously, indicating that the number of adsorption pores in clayey sand decreased. At the same time, the end point value at the left end of the interval remained almost unchanged, while the end point value at the right end decreased, indicating that the pore size of the clayey sand adsorption hole decreased. In the range of T 2   = 5~10 ms, the number of pores was zero and the connectivity between the pores was poor. In the range of T 2   = 10~100 ms, the signal intensity of the T 2 spectrum under different stress states was small, which indicates that the number of permeable macropores in clayey sand is small and the permeability is poor. With an increase in the σ r , the peak value and width of the spectrum in this range obviously decreased. When the σ r increased to 4 MPa, the peak value of the spectrum almost dropped to zero, while a large number of seepage pores in the sample closed, and the permeability plummeted. The variation law of pores with an σ r was the same as that of k v , which shows that analyzing the permeability law of porous media by the T 2 spectrum distribution curve of NMR technology is highly reliable.
According to the T 2 spectrum curve cluster of clayey sand in different stress states in Figure 15, the T 2 spectrum area was analyzed [42], as shown in Table 7.
It can be seen from Table 7 that with an increase in the σ r , the total water content of clayey sand and the pore water content corresponding to the first and second peaks all decreased rapidly, while the proportion of water content in the first peak increased. This indicates that the pore type corresponding to the second peak controlled the permeability of the sample during the increase in the σ r .

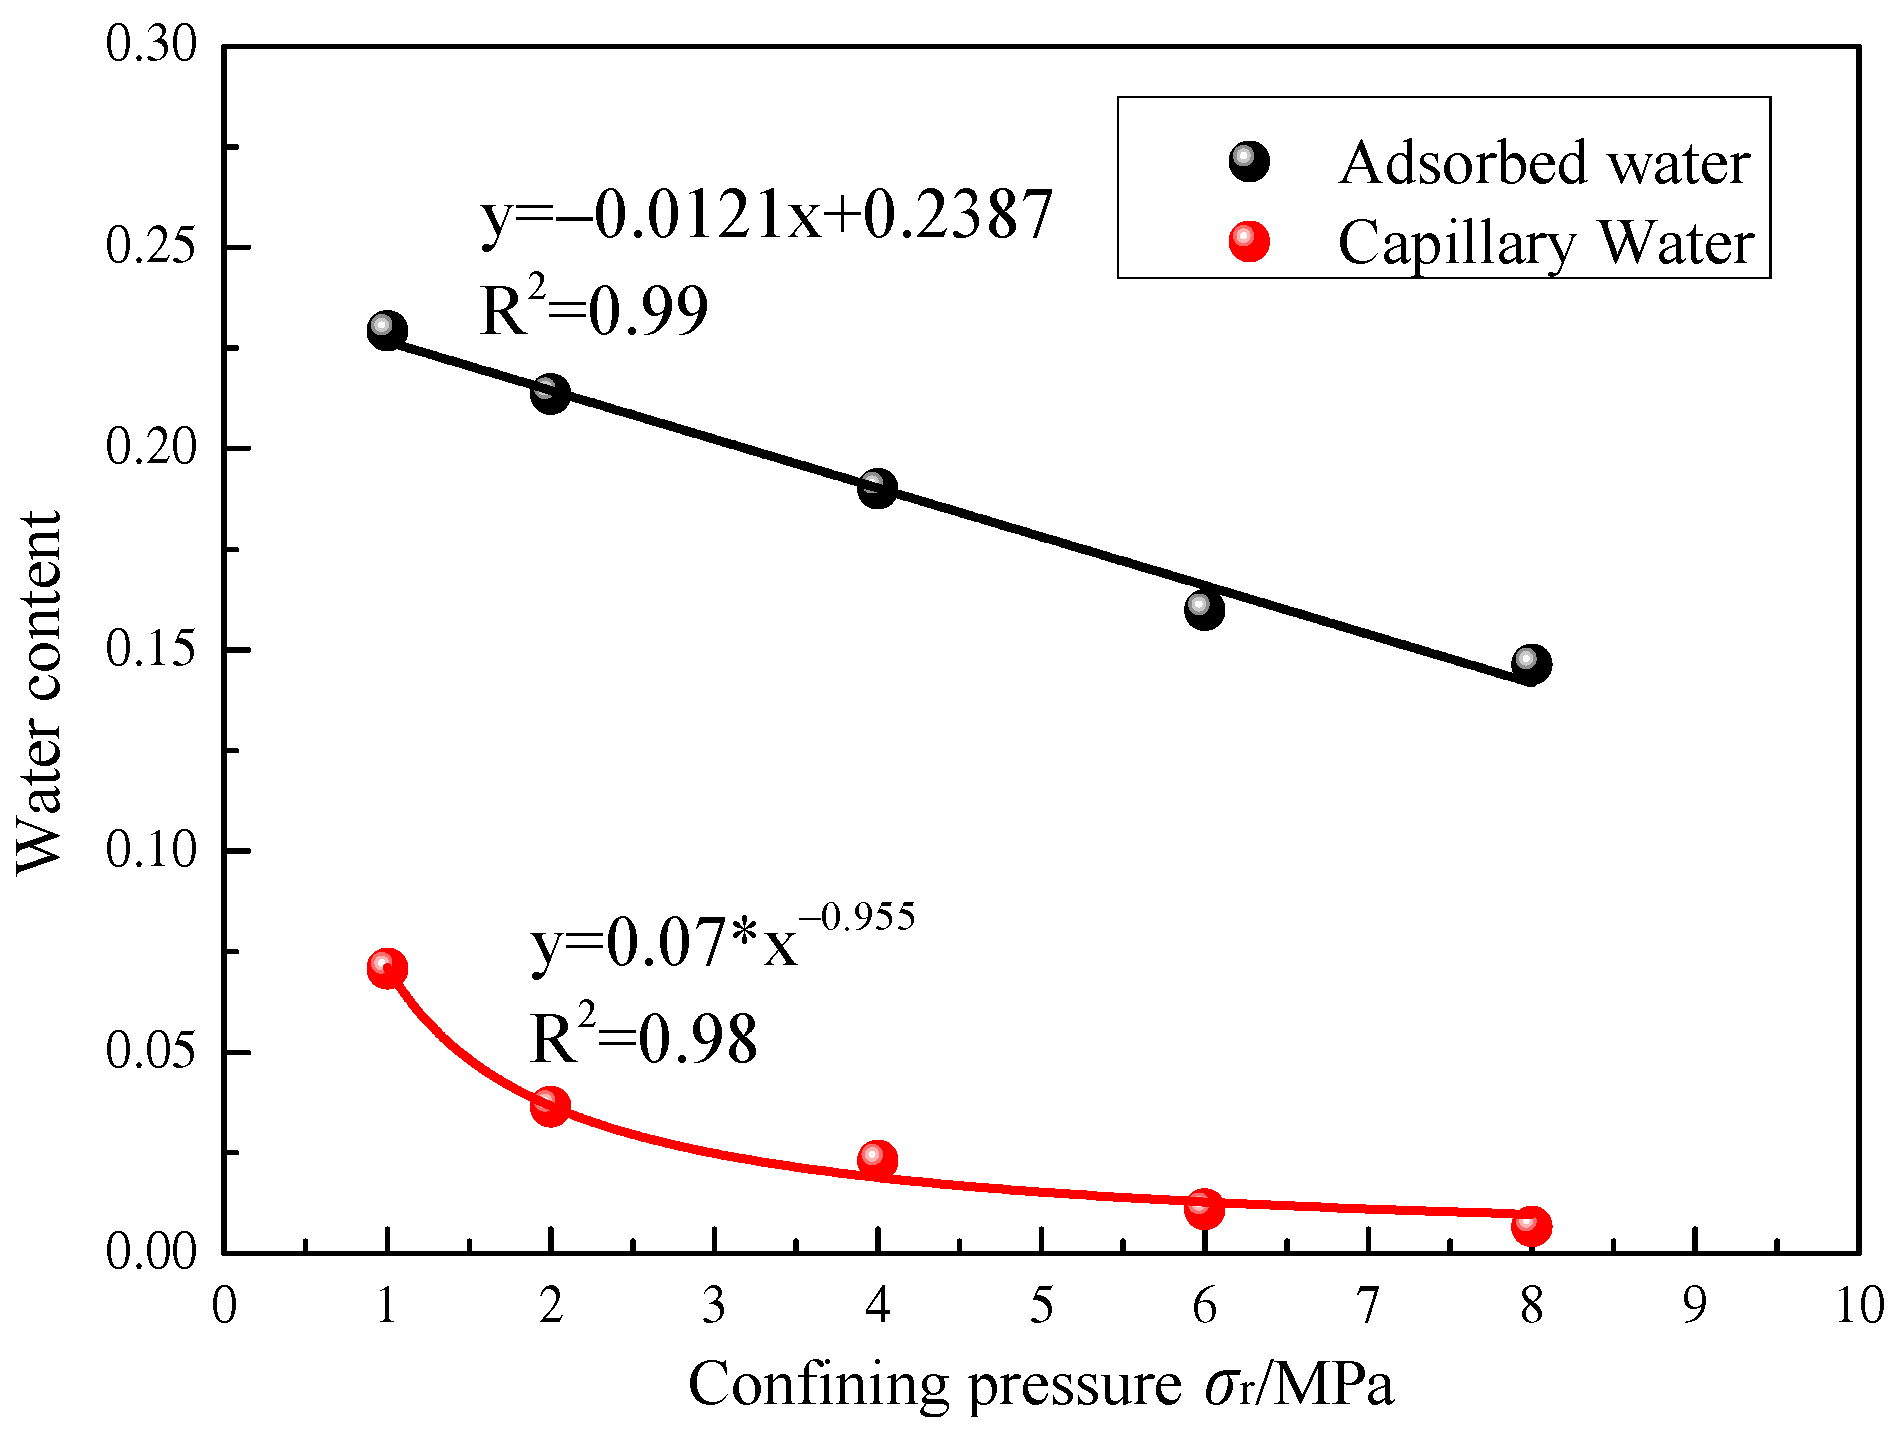
4.2. Distribution Characteristics of the Pore Structure of Clayey Sand and Its Micro-Mechanism of Permeability

Pores in porous media are usually composed of two different (double-pore) systems, including primary and secondary pores. The primary pore system consists of micropores and mesopores ( < 0 . 1   μ m ) , while the secondary pore system includes macropores ( > 0 . 1   μ m ) , micro-fractures and cleat and natural fractures, forming a pipeline for large-flow fluid transfer. Micropores and mesopores are also called adsorption pores, while macropores are called permeability pores, and their permeability threshold is 0.1 μ m . In view of this phenomenon, Yao Yanbin [43,44,45,46] provided the corresponding relationship between the transverse relaxation time, T 2 , and pore size, as shown in Table 8. Because the adsorption pores were saturated with bound water, they could not be used as the seepage path of pore water in the permeability test, which has little influence on the permeability of clayey sand, while the permeability pores were saturated with free water, which could be used as the seepage path in the permeability test. Thus, the size and number of permeability pores determine the permeability of porous media.
Table 8 shows that different T 2 intervals correspond to different pore types. The interval of T 2 = 0.1~2.5 ms corresponds to adsorption pores, a pore size of less than 0.1 μm, and most pores being film-adsorbed water, which hardly permeates due to the strong adsorption force on the particle surface. The T 2   = 2.5~100 ms interval corresponds to the seepage hole, a pore size greater than 1 μm, and capillary water being in the hole. This part of water is only bound by capillaries and can permeate under the action of i , which is the main part of permeability. In the T 2   > 100 ms interval, there are cracks, and the pores are free water, which has very little constraint and can very easily infiltrate. Therefore, the smaller the pore size, the more difficult it is for pore water to eliminate the constraints and infiltrate. During the infiltration process, cracks and pores infiltrate in turn, according to the pore size, while the adsorbed water in the adsorption pores only decreases the thickness of the adsorption film with increasing pore water pressure and does not infiltrate [47].
In addition, for clayey sand, the comprehensive proportion of adsorption and permeability holes was larger than that of 97%, and the proportion of fissure pores was too small to be ignored. To simplify the analysis, T 2   = 2.5 ms was taken as the dividing line between the adsorption holes (0.1~2.5 ms) and permeability holes (2.5~100 ms), and a curve of the content of adsorbed water and capillary water in clayey sand changing with the σ r could be obtained, as shown in Figure 16.
As can be seen from Figure 16, the capillary water and adsorbed water content decreased with an increasing σ r but the reduction forms of the two were different. The adsorbed water decreased in a linear relationship, while the capillary water decreased in a power function form. After the σ r increased to 2 MPa, almost all of the capillary water was discharged, resulting in the capillary water content being less than 5% (the total water content of 1 MPa was 30% of the initial water content), leaving only some adsorbed water in the sample. At this time, the adsorbed water was mainly bound water, which has little influence on water infiltration. Based on this, a seepage model of clayey sand could be established, as shown in Figure 17.
Pores in clayey sand and pore water play a decisive role in the seepage process. Because the bound water near the surface of soil clay particles has shear strength ( τ f ), its distribution decreases exponentially with the distance from the surface of clay particles. Under a certain water head or consolidation stress, some bound water with a smaller τ f is in a flowing state, while some bound water is in a solid-like state. Therefore, only some of the bound water is in a moving state in those pores filled with bound water, and that in the pores where bound water can flow is called a seepage hole, and its diameter is called the seepage diameter.
Regarding the whole process of clayey sand infiltration, when p < 2   MPa , free water is dominant in soil pores, and the seepage fluid is mainly free and bound water. With an increasing consolidation pressure, the free water in pores is gradually discharged, causing pores to become smaller and the void ratio to change greatly, resulting in a great change in the k v . When p > 4   MPa , the bound water in the soil is dominant, and the bound water mainly seeps. When the head pressure difference exceeds the τ f of bound water, it has the nature of free water and participates in seepage. This part of bound water bears the pore water pressure, and this effect gradually decreases with an increasing σ r . Even if the head pressure difference increases, the proportion of bound water that can overcome the τ f does not change much. At this time, the pores change little and the k v value tends to become stable.
To sum up, according to the T 2 spectrum distribution of clayey sand under different stress states, we can not only quantitatively analyze the pore structure in soil, but also judge the connectivity between pores. Moreover, the analysis results are consistent with the conclusions of the ETAS permeability test. The content of capillary water in pores plays a key role in the permeability of clayey sand, and its fitting relationship with the σ r and between the k v and σ r all meet the power function relationship. Therefore, it is of great significance to explore the nonlinear permeability law of clayey sand through the capillary water distribution in pores to improve the existing permeability mechanism of porous media under high stress.

5. Conclusions

Against the background of shaft damage caused by hydrophobic consolidation settlement of the bottom aquifer of thick alluviums, a joint HPLTC-HPPNP test was carried out based on the ETAS test system. The results revealed nonlinear permeability characteristics and obtained the following main conclusions:
(1)
Under the actin of high stress, the k v of low- and high-confined water both decreased with an increasing σ r . The k v under an σ r  of 1 MPa was obviously greater than that under a high σ r . When the σ r of the sample was greater than 4 MPa, the k v under low and high pressure was less than 1   ×   10 8   cm / s , and the relationship between the k v and σ r satisfied a power function.
(2)
In the clayey sand permeability test, the seepage flow was affected by the head pressure difference and the dissipation of pore water in the sample. During low- σ r infiltration, the seepage flow was mainly affected by the head pressure difference, and upper and lower seepage occurred almost simultaneously, while the seepage flow time–history curve showed a good linear relationship. When the σ r was high, changes in the Δ Q 1 resulted from the head pressure difference, while early changes in the Δ Q 2 came from the dissipation of internal pore water near the lower end of the sample caused by a sudden drop of the p2. As the influence of the internal pore water dissipation spread to the upper end of the sample, the changes in the Δ Q 2 were gradually influenced by the head pressure difference.
(3)
The variation law of low- and high- σ r permeability coefficients with an increasing i was completely different. When the σ r was low, Darcy infiltration of sandy soil was dominant, and with an increasing i , the σ r p 2 increased continuously, resulting in a gradual decrease in sample k v . When the σ r was high, the seepage process was influenced by the non-Darcy seepage of clayey soil and the Darcy seepage of sandy soil, and the k v increased first and decreased with an increasing i .
(4)
Under different stress states, the T 2 spectrum distribution law of clayey sand remained almost the same, which was basically of the bispectrum peak type. The capillary and adsorbed water content in the sample decreased with an increasing σ r , but then decreased in different ways. The adsorbed water decreased through a linear relationship, while the capillary water decreased in a power function form. When the σ r increased to 2 MPa, almost all of the capillary water was discharged. The content of the capillary water in the permeability hole plays a key role in the permeability of clayey sand.
(5)
The permeability characteristics of the bottom confined aquifer in the thick loose layer directly affected the drainage process of the bottom aquifer and the hydraulic replenishment rate of the surrounding aquifer. The initial drainage amount of the bottom aquifer was mainly supplemented by the surrounding water, while the later stage was mainly drained by pore water. Research has shown that the permeability of deep confined aquifers is poor. In order to avoid additional vertical force acting on the shaft caused by the consolidation of bottom aquifer drainage, it is necessary to control the bottom aquifer drainage at the peripheral hydraulic supply stage, to prevent closure of the permeability pore throat.

Author Contributions

Methodology, S.P.; Validation, Z.L. and Y.X.; Writing—review & editing, G.C. All authors have read and agreed to the published version of the manuscript.

Funding

The work presented in this paper was financially supported by the National Natural Science Foundation of China (No. 52004003, 51878005, 51874005) and the Natural Science Foundation of Anhui (Grant No.2208085QE142); The Open Project Program Foundation of Engineering Research Center of underground mine construction, Ministry of Education (No. JYBGCZX2021101, JYBGCZX2020102).

Institutional Review Board Statement

Not applicable.

Informed Consent Statement

Not applicable.

Data Availability Statement

The datasets generated and analyzed during the current study are available from the corresponding author upon reasonable request.

Conflicts of Interest

The authors declare no conflict of interest.

References

  1. Chen, G.Q.; Wang, Y.S.; Leng, Y.G.; Zhang, C.H. Experimental study on unloading mechanical properties of K0 consolidated clay under long-term high pressure. Chin. J. Rock Mech. Eng. 2014, 33, 2996–3002. [Google Scholar]
  2. Cheng, H.; Cao, G.Y.; Yao, Z.S.; Rong, C.X.; Zhang, L.L. Tensile fracture mechanism of drilling shaft under the special engineering conditions of thick alluvium and thin bedrock. J. China Coal Soc. 2021, 46, 100–111. [Google Scholar]
  3. Su, J.; Cheng, H. Analysis on additional forces of shaft with during drainage of stratum. Chin. J. Rock Mech. Eng. 2000, 19, 310. [Google Scholar]
  4. Yu, Q.; Miao, H.Y.; He, X.H.; Lin, M.H.; Guo, R.; Zhang, K.X. Experimental Study on Influence of Additional Stress Induced by Hydrophobic Drainage on Vertical Shaft-Lining. Mining Metall. Explor. 2023, 40, 667–689. [Google Scholar] [CrossRef]
  5. Li, Z.Q.; Lai, J.X.; Ren, Z.D.; Shi, Y.F.; Kong, X.G. Failure mechanical behaviors and prevention methods of shaft lining in China. Eng. Failure Anal. 2023, 143, 106904. [Google Scholar] [CrossRef]
  6. Peng, S.L.; Cheng, H.; Yao, Z.S.; Rong, C.X.; Cai, H.B.; Zhang, L.L. Study on prediction and characteristics of surface subsidence in mining when the bottom aquifer of thick loose layer directly covers thin bedrock. J. China Coal Soc. 2022, 47, 4417–4430. [Google Scholar]
  7. Cheng, H.; Peng, S.L.; Yao, Z.S.; Rong, C.X.; Cai, H.B. Comprehensive treatment technology for wellbore deflection in thick loose bed and thin bedrock formation. Int. J. Coal Sci. Technol. 2023, 51, 260–271. [Google Scholar]
  8. Wu, J.; Xi, R.C.; Liang, R.Z.; Zong, M.F.; Wu, W.B. One-Dimensional Nonlinear Consolidation for Soft Clays with Continuous Drainage Boundary Considering Non-Darcy Flow. Appl. Sci. 2023, 13, 3724. [Google Scholar] [CrossRef]
  9. Liang, R.Z.; Xia, T.D.; Lin, C.G.; Yu, F.; Wu, S.M. Initial excess pore water pressures induced by tunnelling in soft ground. J. Cent. South Univ. 2015, 22, 4300–4309. [Google Scholar] [CrossRef]
  10. Chen, Z.W.; Liu, H.L.; Zhu, C.Y.; Ma, S.Q.; Hang, Y.J.; Luo, W.J. Seepage characteristics and influencing factors of weakly consolidated rocks in triaxial compression test under mining-induced stress path. Minerals 2022, 12, 1536. [Google Scholar] [CrossRef]
  11. Ling, W.Q.; Xie, H.P.; Li, Y.H.; Zhang, Z.T.; Ren, L. Confining pressure effect on the permeability and mechanical behavior of sandstone under a certain pore water pressure condition. Therm. Sci. 2023, 27, 647–654. [Google Scholar] [CrossRef]
  12. Al-Moadhen, M.M.; Clarke, B.G.; Chen, X. The permeability of composite soils. Environ. Geotech. 2018, 7, 478–490. [Google Scholar] [CrossRef]
  13. Guo, H. Triaxial Experimental Study on Triaxial Seepage of Disturbed Q3 Loess in Different Regions. Master’s Thesis, Northwest A&F University, Xianyang, Shaanxi, 2009. [Google Scholar]
  14. Li, P. Triaxial Permeability Test of Saturated Loess. Master’s Thesis, Northwest A&F University, Xianyang, Shaanxi, 2007. [Google Scholar]
  15. Zoback, M.D.; Byerlee, J.D. Effect of high-pressure deformation on permeability of Ottawa sand. Am. Assoc Pet. Geol. Bull. 1976, 60, 1531–1542. [Google Scholar]
  16. Terzaghi, K.; Peck, R.B.; Mesri, G. Soil Mechanics in Engineering Practice; John Wiley & Sons: New York, NY, USA, 1996. [Google Scholar]
  17. Ameta, N.K.; Wayal, A.S. Effect of Bentonite on Permeability of Dune Sand. Electron. J. Geotech. Eng. 2008, 13, 1–7. [Google Scholar]
  18. Sällfors, G.; Öberg-Högsta, A.L. Determination of hydraulic conductivity of sand-bentonite mixtures for engineering purposes. Electron. J. Geotech. Eng. 2002, 20, 65–80. [Google Scholar]
  19. Wei, L.; Wang, G. Deformation pattern and permeability change of compacted clay under triaxial compression. Bull. Eng. Geol. Environ. 2022, 81, 180. [Google Scholar] [CrossRef]
  20. Borg, I.; Friedman, M. Experimental deformation of St. Peter sand: A study of cataclastic flow. Geol. Soc. Mem. 1960, 79, 133–192. [Google Scholar]
  21. Sui, W.H.; Liu, J.Y.; Du, Y. Permeability and seepage stability of coal-reject and clay mix. In Procedia Earth and Planetary Science; Elsevier: Amsterdam, The Netherlands, 2009; pp. 888–894. [Google Scholar]
  22. Zhu, C.H.; Liu, J.M.; Wang, Z.H. Experimental study on seepage of coarse grain soil. Yangtze River 2005, 36, 53–55. [Google Scholar]
  23. Lapierre, C.; Leroueil, S.; Locat, J. Mercury intrusion and permeability of Louiseville clay. Can. Geotech. J. 1990, 27, 761–773. [Google Scholar] [CrossRef]
  24. Kong, L.W.; Li, X.M.; Tian, H.N. Effect of fines content on permeability coefficient of sand and its correlation with state parameters. Rock Soil Mech. 2011, 32, 21–26. [Google Scholar]
  25. Hazen, A. Discussion of dams on sand foundations by A. C. Koenig. Am. Soc. Civ. Eng. Trans. 1911, 73, 199–203. [Google Scholar]
  26. Wang, Y.S.; Jia, J.B.; Chen, G.Q.; Wen, K. Study on long-term and high pressure K0 consolidation process of remodeling deep clay. J. Min. Sci. 2017, 34, 1169–1173. [Google Scholar]
  27. Wang, Y.S.; Jia, J.B.; Leng, Y.G. Strength properties of unloading confining pressure of long-term K0-consolidated artifical frozen clay under high pressure. Chin. J. Geotech. Eng. 2017, 39, 1636–1644. [Google Scholar]
  28. Li, W.P.; Zhang, Z.Y.; Sun, R.H.; Wang, W.L.; Li, X.Q. High pressure K0 creep experiment and the anisotropy of microstructure of deep buried clay. Chin. J. Geotech. Eng. 2006, 28, 1185–1190. [Google Scholar]
  29. Ma, J.R.; Qi, Y.; Zhou, G.Q. Research on Tri-Axial shear properties of clay under high pressures. Min. Sci. Technol. 2008, 37, 176–179. [Google Scholar]
  30. Zhang, G.L.; Wang, J.Y. Experimental investigation of hydraulic conductivity of sand under high confining pressure. Rock Soil Mech. 2014, 35, 2748–2754. [Google Scholar]
  31. GB/T 50123-2019; Standard for Geotechnical Test Methods. Standardization Administration of the People’s Republic of China: Beijing, China, 2019.
  32. Zhang, M.; Jiang, M.M.; Zhao, Y.M. Nonlinear permeability and parameter determination for dredged fill based on GDS consolidation apparatus. Chin. J. Rock Mech. Eng. 2013, 32, 625–632. [Google Scholar]
  33. Kenyon, W.E. Petrophysical principles of applications of NMR logging. Log Anal. 1997, 38, 21–43. [Google Scholar]
  34. Taylor, D.W. Fundamentals of Soil Mechanics; John Wiley & Sons: Hoboken, NJ, USA, 1948. [Google Scholar]
  35. Samarasinghe, A.M.; Huang, Y.H. Permeability and consolidation of normally consolidated soils. ASCE J. Soil Mech. Found. Div. 1982, 108, 835–850. [Google Scholar] [CrossRef]
  36. Mesri, G.; Rokhsar, A. Consolidaiton of normally consolidated clay. ASCE J. Soil Mech. Found. Div. 1974, 100, 889–903. [Google Scholar]
  37. Mesri, G.; Olson, R.E. Mechanisms controlling the permeability of clays. Clays Clay Miner. 1971, 19, 151–158. [Google Scholar] [CrossRef]
  38. Xie, K.H.; Zheng, H.; Leo, C.J. An analytical theory for 1-D nonlinear large strain consolidation of soft clay. Chin. J. Geotech. Eng. 2002, 24, 680–684. [Google Scholar]
  39. Xie, K.H.; Qi, T.; Hu, A.F.; Xia, J.Z. Experimental study on nonlinear permeability characteristics of Xiaoshan clay. Rock Soil Mech. 2008, 29, 420–424. [Google Scholar]
  40. Kleinberg, R.; Straley, C.; Kenyon, W.E. Nuclear magnetic resonance of rocks: T1 vs. T2. In SPE Annual Technical Conference and Exhibition; SPE: Houston, TX, USA, 1993. [Google Scholar]
  41. Bai, S.T.; Cheng, D.X.; Wan, J.B.; Yang, L.; Peng, H.L.; Guo, X.K.; Zeng, J.B. Quantitative characterization of sandstone NMR T2 spectrum. Acta Pet. Sin. 2016, 37, 382–392. [Google Scholar]
  42. Zhou, K.P.; Li, J.L.; Xu, Y.J.; Zhang, Y.M.; Yang, P.Q.; Chen, L.P. Experimental study of NMR characteristics in rocks under freezing and thawing cycle. Chin. J. Rock Mech. Eng. 2012, 31, 731–737. [Google Scholar]
  43. Yao, Y.B.; Liu, D.M.; Tang, D.Z.; Tang, S.H.; Huang, W.H. Preservation and deliverability characteristics of coalbed methane. North China. Pet. Explor. Dev. 2007, 34, 664–668. [Google Scholar]
  44. Yao, Y.B.; Liu, D.M.; Tang, D.Z.; Tang, S.H. Fractal characterization of adsorptionpores of coals from North China: An investigation on CH4 adsorption capacity of coals. Int. J. Coal. Geol. 2008, 73, 27–42. [Google Scholar] [CrossRef]
  45. Yao, Y.B.; Liu, D.M.; Tang, D.Z. Fractal characterization of seepage-pores of coals from China: An investigation on permeability of coals. Comput. Geosci. 2009, 35, 1159–1166. [Google Scholar] [CrossRef]
  46. Yao, Y.B.; Liu, D.M.; Che, Y. Petrophysical characterization of coals by low-field nuclear magnetic resonance (NMR). Fuel 2010, 89, 1371–1380. [Google Scholar] [CrossRef]
  47. Wang, C.; Zhao, Y.; Ning, L.; Bi, J. Permeability evolution of coal subjected to triaxial compression based on in-situ nuclear magnetic resonance. Int. J. Rock Mech. Min. Sci. 2022, 159, 105213. [Google Scholar] [CrossRef]
Figure 1. Location map of the coal mine and geological histogram of the sampling points.
Applsci 13 11599 g001
Figure 2. Clayey sand sample.
Applsci 13 11599 g002
Figure 3. Environmental triaxial automated system (ETAS).
Applsci 13 11599 g003
Figure 4. Installation of the permeation test sample.
Applsci 13 11599 g004
Figure 5. Schematic diagram of the permeability test of clayey sand with low-confined water bearing.
Applsci 13 11599 g005
Figure 6. Schematic diagram of the permeability test of clayey sand with high-confined water bearing.
Applsci 13 11599 g006
Figure 7. Time history curves of low-confined water seepage discharge.
Applsci 13 11599 g007aApplsci 13 11599 g007b
Figure 8. Time history curves of high-confined water seepage discharge.
Applsci 13 11599 g008aApplsci 13 11599 g008b
Figure 9. Curves of the low-confined water permeability coefficient with time under different σ r  values.
Applsci 13 11599 g009
Figure 10. Curves of the high-confined water permeability coefficient with time under different σ r  values.
Applsci 13 11599 g010
Figure 11. Fitted curves of the k v and σ r .
Applsci 13 11599 g011
Figure 12. Relationship curves between the permeability coefficient and σ r in the loading–unloading process.
Applsci 13 11599 g012
Figure 13. Relationship between the permeability coefficient and hydraulic gradient of clayey sand.
Applsci 13 11599 g013aApplsci 13 11599 g013b
Figure 14. Low-temperature and high-pressure nuclear magnetic resonance test platform.
Applsci 13 11599 g014
Figure 15. Distribution of the ‘T2’ spectrum of clayey sand under different stress conditions.
Applsci 13 11599 g015
Figure 16. Fitting curve of the capillary water and adsorbed water content with the σ r in clayey sand.
Applsci 13 11599 g016
Figure 17. Permeability mechanism of clayey sand.
Applsci 13 11599 g017
Table 1. Index properties of the clayey sand.
Moisture Content
/%
ProportionDensity
/g·cm−3
Porosity
/%
Modulus of Compression
/MPa
12.022.6252.0530.475.02
Table 2. Test parameters and results after permeation stabilization.
Pressure Bearing Type Confining   Pressure   ( σ r )
/MPa
Back Pressure ( p 1)/kPa Back Pressure
( p 2)/kPa
Hydraulic Gradient Permeability Coefficient
/(10−8 cm/s)
Low-confined water1500300208.7208.68
2500300214.31.26
4500300212.30.53
6500300210.70.35
8500300216.2Impermeable
High-confined water1500300208.7208.69
21000800206.28.05
420001800212.73.47
630002800210.50.21
840003800216.20.13
Table 3. Relationships between the permeability coefficient (10−8 cm/s) and hydraulic gradient in loading–unloading process.
Confining   Pressure   ( σ r )/MPa Low-Confined Water Infiltration High-Confined Water Infiltration
i load k load i unload k unload i load k load i unload k unload
1208.7208.7214.625.21208.7208.7214.625.21
2210.211.45215.22.322210.210.45214.94.425
4213.20.641215.80.315212.81.054215.60.525
6215.40.324216.20.183214.90.324215.90.211
8216.70.114216.70.114216.20.130216.20.130
Table 4. Recovery ratio ( k unload / k load ) of the loading–unloading permeability coefficient of the clayey sand samples.
Low-Confined Water Infiltration High-Confined Water Infiltration
Confining   Pressure   ( σ r )/MPa Recovery   Ratio k unload / k load Confining   Pressure   ( σ r )/MPa Recovery   Ratio k unload / k load
10.1210.12
20.2020.42
40.4940.50
60.5660.65
8181
Table 5. Four permeability model parameters and related parameters of clayey sand.
Permeability Type Permeability Model
lg [ k v ( 1 + e ) ] lg e e lg k v lg k v lg e lg k v lg ( 1 + e )
nCR2 C k e 0 R2ABR2 α β R2
Low-confined water14.240.0340.97570.06560.85570.959513.9510.01870.974647.899−14.3740.9650
High-confined water13.9340.0280.98880.06790.90040.970813.6450.01540.988146.813−14.1740.9769
Table 6. Low-field NMR test system parameters.
Serial NumberProjectsParameters
1Main magnetic field strength/T0.5
2Magnetic field uniformity/ppm≤20
3Magnetic field stability/Hz·Hour−1≤300
4Radio frequency pulse frequency/MHz1.0~30
5Radio frequency power/W300
6Maximum sampling pulse width/KHz2000
Table 7. The T 2 spectrum area of clayey sand under different stress conditions.
Confining   Pressure   ( σ r )/MPaTotal Peak AreaFirst Peak AreaFirst Peak Percentage
/%
Second Peak AreaSecond Peak Percentage
/%
15703.325304.0993.00399.237.00
24749.734546.9295.73202.814.27
44049.603911.9196.60137.693.40
63248.413170.7797.6177.642.39
82624.562585.9898.5338.581.47
Table 8. Corresponding relationship between the transverse relaxation time, T2, and pore throat diameter.
T2Aperture ‘D’Pore TypesPore Water Classifications
0.1~2.5 ms<0.1 μmAdsorption poreAdsorbed water
2.5~100 ms>0.1 μmInfiltration poreCapillary water
>100 ms-CrackFree water
Disclaimer/Publisher’s Note: The statements, opinions and data contained in all publications are solely those of the individual author(s) and contributor(s) and not of MDPI and/or the editor(s). MDPI and/or the editor(s) disclaim responsibility for any injury to people or property resulting from any ideas, methods, instructions or products referred to in the content.

