Article

Leveraging Real-World Data from IoT Devices in a Fog–Cloud Architecture for Resource Optimisation within a Smart Building

1
The School of Computing, Engineering and Build Environment (SCEBE), Glasgow Caledonian University, London E1 6PX, UK
2
The School of Computing, Engineering and Build Environment (SCEBE), Glasgow Caledonian University, Glasgow G4 0BA, UK
*
Author to whom correspondence should be addressed.
Appl. Sci. 2024, 14(1), 316; https://doi.org/10.3390/app14010316
Submission received: 6 November 2023 / Revised: 19 December 2023 / Accepted: 27 December 2023 / Published: 29 December 2023
(This article belongs to the Special Issue IoT in Smart Cities and Homes)

Abstract

:
It is estimated that over 125 billion heterogeneous and homogeneous Internet of Things (IoT) devices will be internet-connected by 2030. This significant increase will generate large data volumes, posing a global problem for Cloud–Fog computing infrastructures. The current literature uses synthetic data in the iFogSim2 simulation toolkit; however, this study bridges the gap using real-world data to reflect and address the real-world issue. Smart IoT device data are captured, compared, and evaluated in a fixed and scalable scenario at both the Cloud and Fog layers, demonstrating the improved benefits achievable in energy consumption, latency, and network bandwidth usage within a smart office building. Real-world IoT device data evaluation results demonstrate that Fog computing is more efficient than Cloud computing, with increased scalability and data volume in a fixed- and low-bandwidth smart building architecture. This indicates a direct correlation between the increase in devices and the increase in efficiency within a scalable scenario, while the fixed architecture overall shows the inverse due to the low device numbers used in this study. The results indicate improved energy savings and significant improvements of up to 84.41% and 38.95% in network latency and usage, respectively, within a fixed architecture, while scalability analysis demonstrates improvements up to 4%, 91.38% and 34.78% for energy, latency, and network usage, respectively. Fog computing improvements are limited within a fixed smart building architecture with relatively few IoT devices. However, the benefits of Fog computing are significant in a scalable scenario with many IoT devices.

1. Introduction

Current research trends within the Internet of Things (IoT) focus on specific characteristics, such as systems, networking, Cloud support and middleware [1,2,3]. Currently, research trends are moving towards the application development aspect of IoT [4,5,6]. This movement is partly due to IoT’s core and fundamental nature, as smart devices are predominantly heterogeneous, making the application development process complicated and challenging [7,8].
Researchers and technology organisations estimate that over 125 billion heterogeneous and homogeneous IoT devices will be connected to the internet by 2030 [9]. With understanding from previous research in this area [9], the increased number of IoT devices in a Cloud computing environment will generate large amounts of data. The generation of extensive data will, in turn, lead to an increase in energy consumption, latency, and network bandwidth usage. Furthermore, Cloud computing and other operational challenges are present, such as the scalability of network infrastructure, data privacy, network congestion, and data processing capability [8]. A previous research study demonstrated that the inherent challenges associated with Cloud computing can be addressed by introducing Fog computing [9]. Addressing these challenges is achieved by integrating the Fog layer into the traditional Cloud computing architecture between the Cloud and device layers, bringing the IoT device processing requests closer to the network edge [10]. Additionally, one of the characteristics of Cloud network infrastructure is the geographical distribution of IoT smart devices, which can generate large amounts of data per unit time [11].
In the current trend within the Fog computing literature, researchers frequently use default synthetic data in the iFogSim2 network simulation toolkit [12,13,14,15,16]. At the same time, a small group of researchers use real-world data to represent the network infrastructure Cloud, Fog nodes, gateway, and proxy servers using Arduino and Raspberry Pi and other IoT devices [17,18]. Notably, research has yet to use real-world data throughout a smart building network across all the network architecture, Cloud, Fog, and device layers. Therefore, this has created a gap in the literature with the use of real-world data across both the device and infrastructure network layers within a real-world smart building. Consequently, this study’s motivation was founded on the need to use real-world data across the real-world smart building network architecture, including using real-world parameter values of both the infrastructure and the device in the simulation, to bridge this research gap.
The method used to conduct this study’s simulation experiment in a real-world smart office building was based on data being collected from the standardly placed smart IoT devices. Then, the smart IoT device placements were modified to enhance their efficiency, based on the usage frequency of certain areas in the smart building floor plan. Subsequently, the iFogSim2 network simulation toolkit was used to run the simulation for the standard and enhanced scenarios in both Cloud and Fog computing environments. The results were then processed, analysed, evaluated, and compared to highlight the benefits of Fog computing and the novel contribution of demonstrating further improvements to the state-of-the-art Fog computing paradigm in energy consumption reduction, higher latency, and reduced network bandwidth usage. Consequently, in this study, the smart building infrastructure and IoT device parameters were all derived from real-world data, informing and influencing the implementation and evaluation. Therefore, this paper’s novelty and main contributions represent a significant contribution to the body of knowledge in Cloud and Fog computing data management in a smart building using real-world data.
In addition, this study also aims to contribute to the field of sustainability and the importance and relevance of building knowledge and awareness in the area of energy efficiency and sustainability, such as the United Nations (UN) Sustainable Development Goals (SDG), particularly SDG 11 on sustainable cities and communities [19].
This study develops a Cloud and Fog computing architecture-based model using the iFogSim2 network simulation toolkit to simulate smart IoT device usage in a smart building. The smart office building presented in this study is a case study exhibiting a refined design for an intelligent office floor plan layout. The layout integrates state-of-the-art IoT devices, including advanced lighting sensors, sophisticated CCTV surveillance cameras, and sensitive CO2 sensors. These sensors collect data to analyse and determine various smart building functions, such as controlled air quality, person occupancy, a security system, and energy-saving operations. The major contributions of this study are as follows:
  • Evaluation of the critical placement of IoT smart devices in a smart building floor plan and the capture of real-world IoT smart device datasets generated within iFogSim2 for a smart building;
  • Providing analysis and insight into the impact of fixed devices on the data management process of performance metrics;
  • Adopting the iFogSim2 toolkit to evaluate Fog computing’s impact and benefits on performance metrics using real-world data in a smart building environment;
  • Demonstrating a comparative analysis of device scalability in Cloud/Fog computing scenarios concerning performance metrics during the data management simulation process.
The rest of this paper is structured as follows: The Section 2 comprises the literature review, where the current and trending literature in IoT and Fog and Cloud computing was explicitly explored in this study. The Section 3 delves into the methodology and techniques adopted to collect smart IoT device sensor datasets for the benefit of this study. The Section 4 highlights the implementation of the simulation experiments using the iFogSim2 toolkit. The Section 5 and Section 6 critically discuss the simulation output results, with the Section 7 concluding the research conducted in this study.

2. Literature Review

2.1. IoT Architecture

As shown in Figure 1, IoT architecture comprises three layers: perception, network, and application [20].
  • Application Layer: This layer comprises a group of intelligent computer programs specifically written to deliver the application service in a presentable manner that satisfies the user’s requests [20,21];
  • Network Layer: Comprises public and private networks with interconnected wired and wireless systems. The primary function of the network layer is to transfer information from the perception layer to the application layer. The network layer uses multiple protocols and standards, such as IPv6, ZigBee, Z-Wave, WiFi, long term evolution (LTE), 5th generation (5G), LoRAWAN, and Bluetooth, to facilitate connectivity [21];
  • Perception Layer: In the perception layer, the physical object identification and information-gathering process uses monitoring stations such as interactive smart devices, actuators, and sensors [20,21].

2.2. Synthetic Data Limitations

This study used the iFogSim2 network simulation toolkit to conduct the simulation. Other simulation toolkits frequently use synthetic data with no functional grounding and need benchmark case studies to validate service management policies [22,23,24]. These often lead to error-based and biased performance evaluations [16]. This study adopted real-world manufacturer specifications and datasheets to derive numeric parameter values for smart IoT devices, sensors, and systems.

2.3. Real-World Dataset Advantages

To remove the limitations of synthetic data, numeric parameter values were substituted with real-world parameters for the device layer in this simulation. However, the parameter values for all other devices—from level 0, which represent sensors, actuators, and smart IoT devices; level 1, which represents communication, Fog nodes, routing, and network infrastructure; and level 2, which represents Cloud-based applications, services, and software—were derived from the existing literature in line with current Fog and Cloud computing research trends. Furthermore, mobility-aware application migration, microservice orchestration, and dynamic distributed cluster formation were embedded in iFogSim2. Using real-world datasets for the smart building was adopted with other integrated components within iFogSim2, mimicking the state-of-the-art capabilities of Cloud computing, router/proxy servers, gateways, and Fog computing nodes [16]. From Table 1 in Section 2.4, a review of the current literature related to this research area demonstrates that a limited number of researchers use real-world datasets generated from IoT smart devices within a smart building. Most researchers use simulator default data settings within their infrastructure to evaluate real-world environments. Therefore, the main advantage of using real-world datasets in this study is to simulate real-world situations within a smart building infrastructure, including assessing application, software, and service requirements, efficient latency, energy management from data generation, and network congestion.

2.4. Related Work

According to [25], many research publications in IoT and Fog computing focus on real-world data collection, which can be achieved securely and reliably. The use of real-world application data in Fog computing research and technology is increasing exponentially; therefore, there is a need to understand the challenges and future direction of Fog computing. Furthermore, the demand for smart IoT devices in various environments, including smart homes, is also rising. The data gathered from these smart IoT devices are processed and analysed to address real-world issues and challenges in real time. Conversely, synthetic data may be used to simulate real-world scenarios; however, they cannot be used to address real-world issues and challenges in real-time [26,27]. The most effective way to evaluate service management policy is through the use of real-world data [16]. However, the time it takes to implement a real-world environment is considerable and modifying system parameters is difficult, especially during the simulation [28].
Most network simulator toolkits do not have set benchmarks to validate management usability policies in this research area. Instead, simulation toolkits use synthetic data without a functional grounding, which leads to errors and biased performance. To deal with the issue of bias, iFogSim2 was developed to exploit and mimic various forms of real-world data [16]. Furthermore, other network simulation toolkits, like FogBus, use real-world data to achieve effective analysis and critical decision-making, which may not be possible when using synthetic data [29].
According to [16], many Fog computing network simulation toolkits do not integrate real-world data. These simulation toolkits rely on synthetic data, which are quite rigid in their variability and do not replicate simulations in various contexts. Furthermore, the lack of standardised benchmark policies with synthetic data makes these simulation toolkits unsuitable for effective performance comparison and validation accuracy of resource management for policies in Fog computing environments.
According to [30], the use of synthetic data provides room for variability control that might not be possible with real-world data, which benefits a research study when trying to isolate certain factors in a simulation. However, the use of synthetic data may only factor in some of the complexities of and unpredictable variations in real-world data, which creates discrepancies and makes the results less accurate compared to the use of real-world data.
Although synthetic data are quite effective, they depend on three primary characteristics: relevance, coherence, and diversity. Therefore, in order for synthetic data to remain effective, the data need to be reliable [31]. While real-world data tend to be reliable, there are potential issues with privacy. However, in this study, the privacy issue is non-existent as the data type excludes any personal data. In addition, a major issue with synthetic data is that they might not capture unpredictability, correlation, and other intricate details found in real-world data. This can skew model results performed with synthetic data and, therefore, cannot be used to generalise in real-world environments [31].
Table 1 summarises the research literature on data management optimisation in traditional Cloud infrastructure while introducing the Fog computing layer in a smart home environment with IoT smart devices at the device layer. The measures focused on energy consumption, latency, and network bandwidth usage in a smart building’s Cloud- and Fog-based computing environment. Ref. [32] investigated the use of Fog computing in a Cloud computing network architecture to enhance sustainability in smart cities using real-world application data and smart IoT devices to measure energy consumption in the transportation area. The research paper did not use real-world infrastructure data, data optimisation, latency, or bandwidth usage measurements. Ref. [33] proposed a framework for leveraging Fog computing in a Cloud architecture to enhance a car parking solution. The paper covered data optimisation through latency and network bandwidth usage measurements; however, the paper excluded energy consumption measurements and the use of real-world device and infrastructure data. Ref. [34] discussed using the Cloud and Fog computing paradigm to manage smart IoT devices and sensors in a smart home environment through efficient resource allocation and router optimisation. Although the paper used real-world device data, it used synthetic infrastructure data. Ref. [35] investigates smart home security optimisation through smart IoT devices. The research paper also covers data optimisation and Cloud and Fog computing. The use of real-world device and infrastructure data, including performance metrics, was excluded.
Ref. [36] delves into smart home system automation, managing the smart IoT devices through design functionality using real-world device data, energy consumption measurements, but excluding real-world infrastructure data, data optimisation, Fog computing, latency, and network bandwidth usage performance metrics. Ref. [37] explores decentralised transactive energy concepts in buildings and electric vehicles within an edge computing environment focusing on sustainable energy. The research covers data optimisation, IoT devices, Cloud and Fog computing, but excludes real-world device and infrastructure data and all identified performance metrics. Ref. [38] focuses on using Fog computing to optimise data aggregation security in a smart building environment. The paper covers the IoT, Cloud and Fog computing, but excludes the use of real-world data for both devices and infrastructure, though it does include identified performance metrics. In ref. [39], the paper explores how personalised smart IoT devices can optimise energy efficiency in a smart building environment. The paper focused on data optimisation, Cloud and Fog computing, but excluded the use of real-world device and infrastructure data, latency, and network bandwidth usage performance metrics. Ref. [40] investigates the use of Fog computing in managing application microservices and data management through patient monitoring.
Ref. [32], encouraged the use of real-world data at the device layer with data analysis at the network’s edge, to be combined with enterprise-level IoT solutions to realise real Fog computing potentials in a smart home network architecture and other environments. Meanwhile, ref. [34] focused on a novel resource management technique to accurately predict smart IoT device performance metrics and resource utilisation efficiency using real-world device parameter values. In addition, ref. [36] developed an adaptable and user-friendly home automation system that allows smart building users to control smart IoT devices using real-world device data through the various case studies presented in their research. These research studies focused on device layer real-world data parameters only. Conversely, ref. [40] focused on the simulated system topologies and application infrastructure models responsible for multisensory processing at the Cloud and Fog computing infrastructure layers. Overall, the limitation of these existing works is the lack of consideration for real-world infrastructure data gaps. Although a few related studies did consider real-world infrastructure data, they lacked consideration of device layer real-world data. These gaps observed in existing research studies led to the design of this study’s proposed approach of adopting both device and infrastructure layer real-world data and using a single floor plan in a real-world smart building network architecture environment as the primary novel contribution.
Real-world infrastructure data, data optimisation, Cloud and Fog computing, IoT devices, and performance metrics were used in the paper, but energy consumption performance metrics and real-world device data were not included. All the research identified in Table 1 lacks one or more focused attribute areas. However, two significant technical gaps were observed when comparing and evaluating the other papers with this study. Firstly, there is limited use of real-world devices and infrastructure data in existing research papers. This is crucial to ensure research findings remain critical and applicable to link with real-world environments. This lack of comprehensive analysis with device and infrastructure real-world data usage leads to a disconnect when addressing real-world challenges. This gap is comprehensively investigated in this study. Secondly, there are limited studies on data analysis and optimisation with multiple performance metrics in the existing research. This study addresses and explores this gap to ensure crucial assessment of various performance metrics for efficient, effective, and scalable solutions in a real-world smart building environment founded on Cloud- and Fog-based computing scenarios. Furthermore, addressing these gaps in this study will help improve the robustness of outcomes that align with real-world challenges and requirements. Therefore, this study significantly extends the state-of-the-art Fog–Cloud computing research area using real-world IoT device data, infrastructure optimisation, and extensive evaluation metrics.
Table 1. Summary of related work.
ReferenceReal-World Device DataReal-World Infrastructure DataData OptimisationCloud ComputingFog ComputingIoT DeviceEnergy ConsumptionLatencyNetwork Bandwidth Usage
[32]
[33]
[34]
[35]
[36]
[37]
[38]
[39]
[40]
This study

2.5. Smart Building Multiple Sensor IoT Device Data Management Simulation

This section of the research study outlines network system architecture comprising a Cloud, proxy server, Fog node, and IoT devices. Furthermore, the study demonstrates the simulation of multiple IoT smart devices embedded in each floor of a smart building, in which energy consumption, latency, and network bandwidth usage measurements were generated and results collected during the simulation process. The simulation was conducted in both Cloud-only and Fog-only scenarios. At the same time, the results were collated in tabular formats and graphical illustrations were used to highlight differences and similarities. The network architecture for the smart building comprises three layers, namely the Cloud layer, the Fog layer, and the device layer.

2.5.1. The Cloud Computing Layer

Also known as a data centre, the Cloud layer comprises powerful computational capability and almost limitless data storage capacity. Furthermore, due to the vast resources it makes available, service management and the processing of large volumes of data, including smart IoT device data, occurs in this layer. In addition, Fog computing applications and smart IoT device applications benefit from quality of service (QoS) management and the processing extensive data operations, including predictions, classifications, and pre-processing [34,41]. Although Cloud computing possesses these vital characteristics, there are also associated weaknesses such as increased energy consumption, slow latency, and increased network bandwidth usage. Consequently, Fog computing was introduced to address the weaknesses inherent in Cloud computing by processing computational requests and temporarily storing data at the network’s edge, closer to the IoT devices themselves.

2.5.2. Fog Computing Layer

These Fog devices are called Fog nodes, comprising network devices with limited computation and processing capability and transient storage capacity. One of the main characteristics of Fog computing is its proximity to the devices at the network’s edge, where resources are local, resulting in improved QoS and efficient data management, including data analytics with multiple points of failure within the network architecture [32].

2.5.3. IoT Device Layer

This layer, also known as the device layer, is a collection of physical sensors and actuator-embedded smart IoT devices. The smart sensors embedded within these IoT devices are intelligent and allow the devices to capture and generate data. This layer also comprises edge devices such as smart home appliances (white goods), gateways, sensors, etc., providing a means for user interaction with the Fog computing layer through sensors and smart IoT client applications [34].

3. Methodology

This study uses current research case studies as a benchmark to support a real-world dataset model of a smart building with integrated smart IoT devices and the management of data using Cloud- and Fog-based scenarios. The simulation in this study demonstrates and validates the benefits of Fog computing and its optimisation of energy consumption, latency, and network bandwidth usage. This study utilised a dataset collected from heterogeneous smart IoT devices operating on one floor of a smart office building. The IoT device dataset was inputted into the iFogSim2 network simulation toolkit. In addition, the experiment for this study was conducted on a MacBook Pro computer with a 2.3 GHz 8-Core Intel Core i9 Processor with 16 GB RAM. The fractional selectivity of the input–output relationship was 1.0 within each module. At the same time, the parameter numeric infrastructure values, such as the Cloud datacentre, router/proxy server, and gateway, were derived from the latest literature that uses real-world infrastructure values such as [9,16,34,42,43]. The parameter values for the IoT smart devices, sensors, and systems were derived from real-world manufacturers’ specifications and datasheets of the smart devices, sensors, and systems used in the simulation in this study.
This study further highlights the challenges of high latency, energy consumption, and network bandwidth usage in Cloud computing. Adopting the geographical mobility feature within the Fog computing paradigm was explored to address and optimise Cloud computing challenges during data management in an IoT network within a smart building. One of the knowledge gaps and limitations within this research area is the need for real-world data collected from smart IoT devices and used within the experiment and simulation process. In most of the literature, the use of synthetic data, for example, in the iFogSim2 network simulation toolkit, is commonplace. Therefore, this study bridges this gap by using real-world data generated and captured through IoT smart devices and inputted into the iFogSim2 network simulator toolkit for processing. The results from this study highlight and demonstrate the performance metrics of energy consumption, latency and network bandwidth usage using real-world data in a smart building environment. For example, real-world applications can be simulated to ensure consistency and service availability in a smart building, especially for applications requiring real-time response as part of their core functionality.

3.1. Real-World Data Collection

A comprehensive methodology was used in this study, in which real-world data were collected for effective validation of the benefits of Fog computing in a smart building environment, for both the fixed and scalable scenarios.
The data were collected from three physical off-the-shelf (OTS) smart IoT devices, CCTV, CO2 sensors, and light sensors used in a smart office building, with real-world data providing real-world insights into the practical functionalities of the smart IoT devices in a real-world smart building environment. As demonstrated in Table 1, the latest research in this area relies on synthetic data that do not represent any actual device. In contrast, this study relies on real-world data gathered from device operation to run the simulation. In this study, the parameter values for the smart IoT devices were derived from real-world manufacturer datasheet specifications and measured performance. This ensures that the parameter values used mirror the actual operational performance a smart IoT device. The real-world data were then inputted into the device configuration parameter values of the MIPS, RAM, Uplink, and Downlink values in the iFogSim2 network simulation toolkit.

3.2. Fixed Scenario

The iFogSim2 toolkit was used to run the simulation of the fixed scenario, where a fixed number of CCTV cameras, CO2 devices, and lighting sensors were inputted into the number of devices in the iFogSim2 algorithm code. The floor plan of the smart office building included fixed devices numbering 7, 17, and 22 for the CCTV, CO2, and light sensors, respectively. The fixed scenario was designed to reflect a predefined set of smart IoT devices placed across various locations around the real-world floor plan in the smart office building. The parameter values were sourced from real-world data derived from the datasheets of the smart IoT devices used in this study. The number and types of the smart IoT devices was predetermined by the real-world building infrastructure and did not vary outside these fixed numbers for the simulation. The parameter values such as MIPS, RAM, Uplink, and Downlink bandwidth were set to specific real-world values and remained constant during the simulation experiment. The performance metrics for the energy consumption, latency, and network bandwidth usage data were collected while simulating with the fixed conditions, representing the fixed scenario method.

3.3. Scalable Scenario

The iFogSim2 toolkit was also used to run the simulation in the scalable scenario by changing the number of devices in the following sequence 20, 40, 60, 80, 100, 120, 140, 160, 180, and 200 smart IoT devices for the CCTV, CO2, and light sensors. The scalable scenario was designed with a changing number of smart IoT devices, which started from 20 and was scaled up in increments of 20 to a final 200 smart IoT devices. The parameter values such as MIPS, RAM, Uplink, and Downlink bandwidth were set to the same specifications as the fixed scenario, using real-world values, and remained constant during the simulation experiment. In the scalable scenario, only the number of smart IoT devices could be increased or reduced as required, while other network configuration settings remained constant. The main aim of the scalable scenario was to provide insight into how the system performed as the number of smart IoT devices was scaled up, identifying the system’s adaptability and performance metric efficiency as the number of devices increased.
In the fixed scenario, the environment was fixed with the number of smart IoT devices reflecting a real-world smart building infrastructure. In contrast, the scalable scenario scaled the number of smart IoT devices upwards at increments of 20 devices to a final 200 devices, in order to represent a high volume of IoT devices within the infrastructure. The methodology for the fixed scenario provides a stable and controlled environment with a fixed impact on performance metrics; meanwhile, the scalable scenario provides a less stable environment with a dynamic increase in smart IoT devices and the consequent impact on performance metrics.

3.4. Smart Office Building IoT Device Layout Floor Plan

Multiple smart IoT devices and sensors were placed on each floor of the smart building. The smart CCTV cameras were strategically placed to cover the entrance and other vital areas when navigating the floor. In addition, there were also CO2 sensors and light sensor devices. The highlighted floor in Figure 2 comprises the following smart IoT devices: 7 smart CCTV cameras, 17 CO2 sensor devices, and 22 light sensor devices. The CO2 sensors capture and measure CO2 gas concentrations in various rooms and other locations, and the smart CCTV cameras capture, process, and store video images; the CCTV cameras are activated when the sensors embedded within the cameras are triggered due to movement in strategic areas, while the light sensors are also triggered through movement detection.

3.5. Real-World Data Management in an IoT-Based Smart Building

This study focuses on the impact of Fog computing on the traditional Cloud-based architecture in a smart building. The monitoring and measuring of energy consumption, latency, and network bandwidth usage in the smart building highlights the impact of introducing Fog computing to the smart building architecture using real-world infrastructure data and smart IoT device data. In addition, the Raspberry Pi 4 model microcomputer was used to represent infrastructure devices with real-world data from the existing literature [40]. Furthermore, averages of real-world smart IoT device data were derived from popular off the shelf (OTS) smart device datasheets, such as smart CCTV cameras, CO2 sensor devices, and light sensor devices [44,45,46,47,48,49,50,51,52,53]. Real-world infrastructure and device data scenarios were used to simulate and observe real-world data management within the smart building. These real-world data were inputted into the iFogSim2 network simulation toolkit parameter value settings for the Cloud, proxy server, Fog nodes, and sensor devices.

4. Simulation Implementation

This study aims to analyse the management of data generated by smart IoT devices within smart buildings. The analysis was conducted through simulation experiments using the iFogSim2 network toolkit to generate data and capture output results based on both Cloud-only and Fog-only scenarios. The results were compiled using graphical illustrations to depict trends, benefits, and weaknesses in terms of Cloud and Fog computing. Furthermore, within the iFogSim2 simulation toolkit, the Fog application architecture in the Fog layer consisted of three distinct components: the client module, the feature extractor, and the analyser [40]. The client module was predominantly deployed on the IoT device layer closer to the network’s edge. Client application sensor data were received from the smart IoT sensors and then transferred to the actuator for display or to other microservices for processing [40]. Table 2 highlights the network infrastructure and device configuration parameter values used in this study. Table 3 highlights a detailed breakdown of the infrastructure and device configuration values, where the busy and idle power consumption plays a crucial role in the energy consumption simulation outputs. The asterisks are not part of the value but represent the multiplication of the energy consumption of the nodes within the simulator system [16,54,55,56].
The client application receives the data generated from sensor nodes and then transfers the data to the mobile device [34,40]. Subsequently, the data are forwarded to the Fog node, where computational processing and transient storage occur as required. The data are then transferred to the Cloud layer through the router/proxy server for any potential additional processing, analysis, and storage.

4.1. Smart Office Building Floor Plan

Figure 2 is an illustrative image of the floor plan, highlighting multiple IoT smart devices installed and strategically placed around this floor of the smart office building. Smart IoT devices such as CCTV cameras, CO2 sensors, and lighting sensors are installed in each office, meeting room, and other service areas. These smart IoT devices generate different types, sizes, and volumes of data.
This section presents the floor plan of one floor, presenting the smart office building case study and the simulation output results. Figure 2 shows that this floor plan has 7 CCTV cameras, 17 CO2 sensor devices, and 22 light sensor devices placed around the floor. Table 4, Table 5 and Table 6 display the simulation results of the smart IoT devices on this floor for both the Fog and Cloud computing scenarios.

4.2. Evaluation of the Metrics Used in iFogSim2

In this study, the iFogSim2 network simulation tool uses the following metrics to measure energy consumption, latency, and network bandwidth usage. The mathematical equations presented in this section represent the metrics fully described in greater detail below; referenced by [55] and summarised here in this study.

4.2.1. Energy Consumption

The measurement of energy consumption in the iFogSim2 simulation toolkit is a pertinent parameter when considering system processing and computation capabilities. Furthermore, it can identify energy-efficient nodes by measuring the total energy consumed at the network’s edge, and in the Fog and Cloud layers. In addition, energy can be described as the total amount of power consumed by any Fog node device, calculated while factoring in the total processing power of all hosts for a predetermined execution time [57].
The efficiency metrics of energy consumption, latency, and network bandwidth usage are, in the iFogSim2 network simulation toolkit, measured in joules. For the benefit of this study, and its easier readability and presentation, energy consumption results were converted from Joules to Mega joules. Furthermore, this study calculates energy consumption by adding together all devices and network and infrastructure resources, that are active in the transmission, routing, and processing of data in both the Cloud and Fog computing layers. The implication of energy consumption in the fixed scenario is that the fixed number of smart IoT devices consumes less energy; however, in the context of each smart IoT device, the energy consumption is less efficient. Meanwhile, the implication of energy consumption in a scalable scenario is that the energy consumption increases as the number of smart IoT devices increases, while energy savings can be achieved through decentralised computation processing in the Fog computing layer, eliminating the energy required to transmit data to the Cloud layer.
In a real-world data centre, energy consumption typically consists of infrastructure data communication, power supply for backup systems, HVAC, and other environmental regulatory controls such as technological security controls, emergency fire controls, and temperature regulation systems. Energy consumption is essential as it affects the operational cost of infrastructure; therefore, this study is beneficial as it highlights some of the benefits of Fog computing, such as environmental protection and the availability, efficiency, and dependability of infrastructure devices, which aims to address the high energy consumption issue in Cloud computing [55]. According to [16], iFogSim2, microservices can be introduced to simulate the full potential of edgeward computation processing, moving away from the traditional monolithic architecture in Cloud computing. Microservices move seamlessly between the edge and Cloud, coordinating with each other to build applications through workload scalability and resource availability in the Fog computing layer. The measurement of total energy consumption is dependent on the number of virtual machine (VM) servers, the assigned MIPS designated for each VM, and the variable energy utilised by the server during request processing and computation, and the following equation represents how energy consumption is measured in iFogSim2 [55]:
i = 0 m ( k = 1 n E N i k + E 0 )
E N i k = e 1 E X T   T k i  
  • ENik—represents server utilisation when processing data requests;
  • E—represents the total energy consumption;
  • E N i k —represents the energy consumption for the task Tk on the VM or node;
  • i—represents the node;
  • E0—represents the fixed energy the server consumes in an idle state;
  • e1—represents the per unit energy consumed in the node;
  • Ni—represents the node.

4.2.2. Latency

According to [55], the application loop occurs in the following sequence: client microservices—pre-processing microservices—decision-making microservices—client microservices. Various methods are used in module placements in the iFogSim2 network simulator, including edgeward placement and others. Latency is measured in milliseconds, which represents how long it takes for the data to be transmitted from the source to the destination. The implication of latency in the fixed scenario is that latency is consistent; however, latency could be higher when the cloud computing layer is used for processing due to the proximity of the cloud layer to the device layer. On the other hand, the implication of the scalable scenario highlights the benefit of Fog computing processing and computation closer to the edge of the network and the device layer. Compared to the Cloud computing layer, the Fog computing layer is closer to the device layer, thereby optimising latency. The latency measurement is the time it takes for processing requests between the start point at the device, all the way to the edge devices, fog nodes, and Cloud data centre layer and back to the device start point.
The following equation represents latency measurement:
T L = m C A L
  • TL—represents total latency, which is dependent directly on VM allocations in the Fog nodes where tasks are allocated for processing;
  • m—represents the host for “m” servers;
  • CAL—represents the total current average delay in each VM within the host.
CAL = CCET
  • CC—represents the simulator clock;
  • ET—represents the execution time of the tuple.
When the request is sent, the simulator clock CC records the simulation time when the device receives the response to the request, how long it took to execute the request, and how long it took the Fog node to execute the request when received; hence, the difference represents the total latency for each tuple. This process also includes all potential delays along the network pathway, such as queueing, propagation, transmission, and processing delays [55].

4.2.3. Network Bandwidth Usage

The measurement of network bandwidth usage in iFogSim2 represents the total data transmitted across the network when a request is initiated between the device starting point and the edge device, Fog nodes, and Cloud data centre, and back to the originating device. In large networks, because this comprises a large volume of homogeneous and heterogeneous devices, there is a high potential for applications to experience an increased average of control loop delays, network bottlenecks, and congestion, including interruptions to various services [55]. Compared to Cloud operations, there can be an improved reduction in latency should there be effective balance and management of workload processing at the network’s edge and Fog nodes. In addition, data pre-processing at the network’s edge and Fog nodes could also decrease the volume of data transmitted across the network. These approaches can improve data flow across the network, reducing bottlenecks, congestion, service interruptions, and CAL delays [55].
Network bandwidth usage is typically measured in megabits per second in the iFogSim2 toolkit. However, this study presents the network bandwidth usage in Gigabits per second for better visibility. This represents the amount of data that is transmitted over the network. The implications of network bandwidth usage in the fixed scenario are that bandwidth consumption might be lower; however, bandwidth efficiency may be different. In the scalable scenario, it is essential that network bandwidth usage is efficient since the smart IoT devices will be scaled up, leading to network bandwidth usage congestion. This can be addressed by using Fog computing for decentralised computation and data processing closer to the network’s edge.
On the other hand, it is essential to reduce network bandwidth usage as there are multiple endpoint connections in a network that also require large multiple databases for their operation. This also clearly shows that network bandwidth usage mainly depends on network latency and the size of the data tuples, as shown in Equation (5). NU relies on the number of VMs in the Fog nodes assigned for processing and computation [55].
N U = n l T N S
  • NU—represents total network bandwidth usage;
  • l—represents the latency in the network;
  • TNS—represents the number of tuples processed simultaneously in the network.

5. Results

The simulation was performed based on Cloud-only and Fog-only scenarios with smart IoT devices across all floors in a smart office building environment. Furthermore, the iFogSim2 network simulation toolkit measured energy consumption, latency, and network bandwidth usage performance metrics. As shown in Table 4, Table 5 and Table 6, the results highlight the energy consumption, latency, and network bandwidth usage for data generated from each smart IoT device (CCTV, CO2, and lighting sensor) placed on the smart office building floor plan floor, as shown in Figure 3.

5.1. Fixed Simulation Analysis

Table 4, Table 5 and Table 6 further show the comparative percentage differences between Fog and Cloud computing. In addition, 
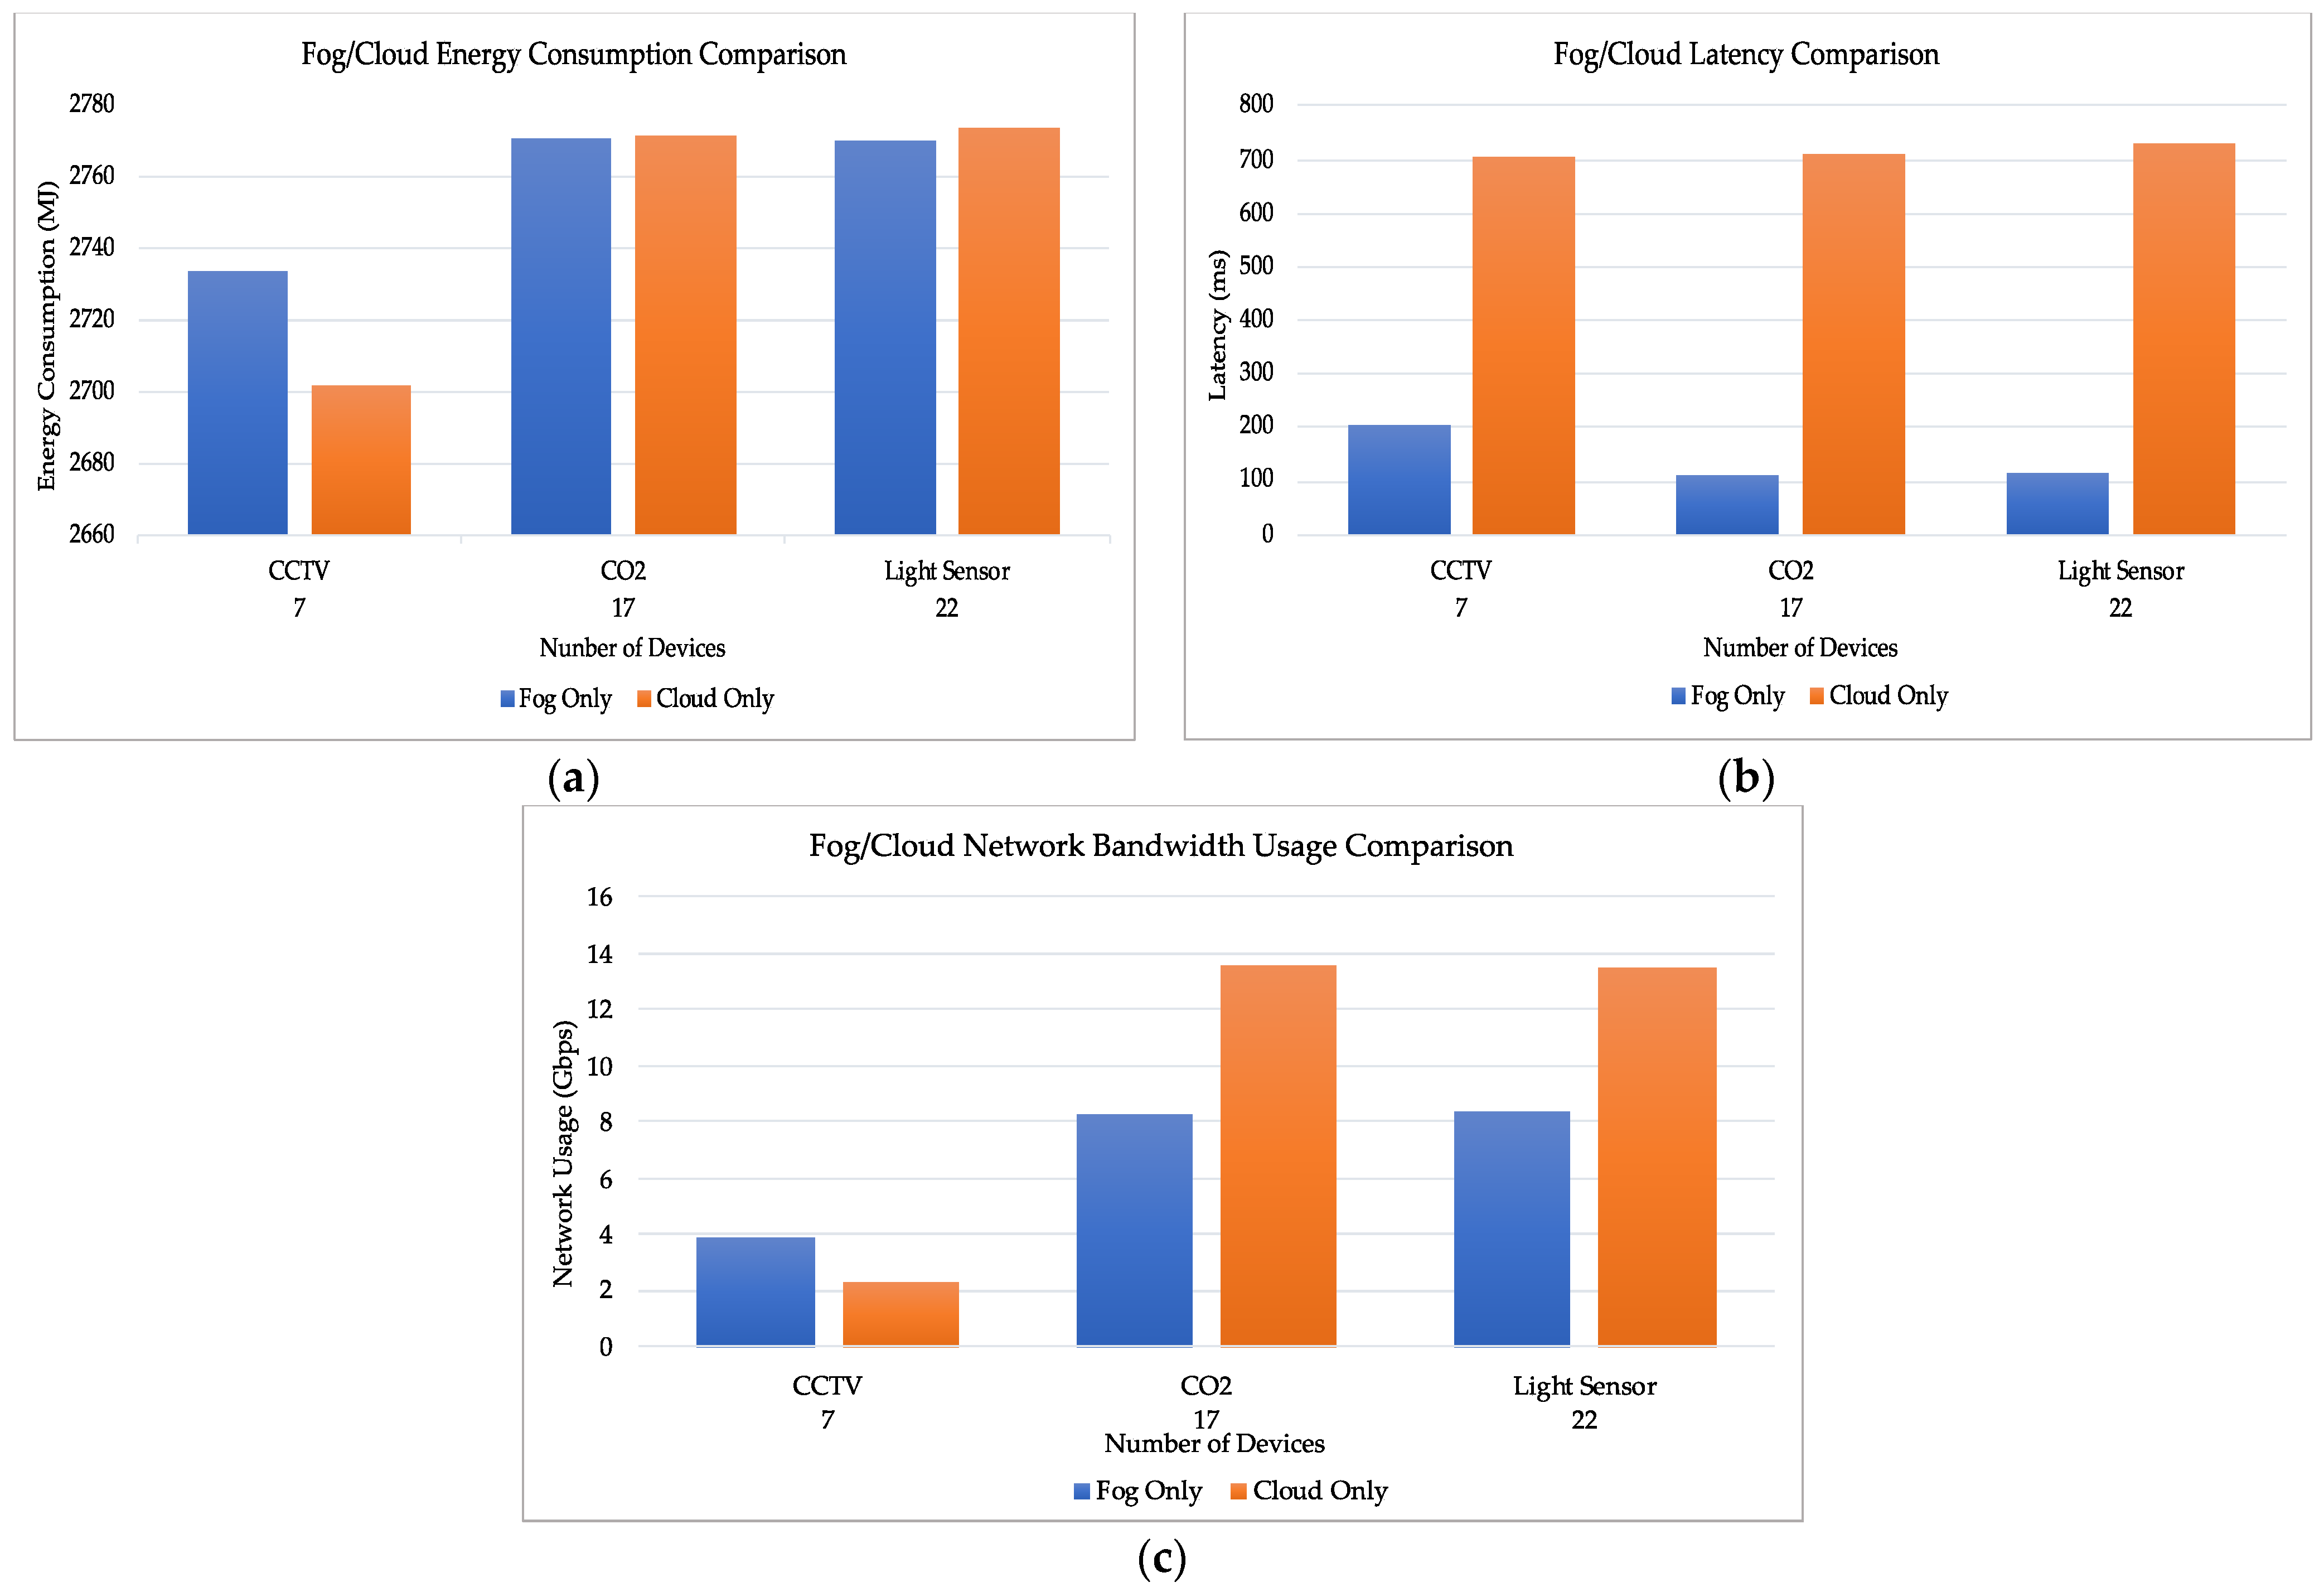
Figure 3 depicts a graphical illustration of the Fog/Cloud comparison for all the smart IoT devices, including CCTV, CO2, and lighting sensors, highlighting the benefits and efficiency of Fog computing compared to Cloud computing. The Fog and Cloud computing comparisons are simulated for (a) energy consumption, (b) latency, and (c) network bandwidth usage. Additionally, for energy consumption and network bandwidth usage, the use of the Fog-only simulation for data management on this floor initially shows that the lower number of devices is higher than that of the Cloud-only simulation. However, as the number of devices increases, the Fog computing paradigm becomes more efficient than the Cloud computing paradigm. This initial increase is due to multiple resources at the network edge, which require more energy overall when activated. Furthermore, it was observed that the Fog-only energy consumption results were higher than their Cloud equivalents for CCTV, which was 1.9% higher than Cloud. However, CO2 was reduced by 0.06%, and light sensors were decreased by 0.14%, as shown in Table 4. For latency, the Fog simulation results highlight a reduction of 70.65% for CCTV, 84.41% for CO2, and 84.13% for light sensors compared to their Cloud equivalents, as shown in Table 5. Lastly, analysing the network bandwidth usage, Fog-only simulation results show an increase in network use for CCTV data by 67%, while CO2 and light sensors reduced by 38.95% and 38.02%, respectively, as shown in Table 6.
In the Cloud computing layer, it is theoretically understood that storage and computational processing resources are infinitely available; therefore, data are typically transferred to the Cloud layer for processing [32]. However, some of the costs and consequences associated with constantly forwarding homogeneous and heterogeneous data to the Cloud for processing are increased energy consumption, higher latency, and congested network bandwidth usage. Earlier aspects of this research have demonstrated, through previous studies, that introducing the Fog computing layer to the traditional Cloud computing architecture optimises energy consumption, latency, and network bandwidth usage. Consequently, this study compared the impact on energy consumption, latency, and network bandwidth usage for multiple smart IoT devices in a smart office building. From the results in Table 4, Table 5 and Table 6 and Figure 3 above, the Fog computing results for energy savings and network bandwidth usage were higher compared to their Cloud scenario equivalents. This highlights the limitations of Fog computing when evaluated in a fixed low-device environment, such as the smart office floor plan. The percentage difference for energy savings ranged between −1.19% for 7 CCTV devices and increased to 0.14% for 22 lighting sensors. Meanwhile, the network bandwidth usage results were similar, ranging from −67% for 7 CCTV devices, 38.95% for 17 CO2 devices, and 38.02% for 22 lighting sensor devices. However, the benefits of Fog computing were clearly highlighted for latency compared to Cloud computing, ranging from 70.65% for 7 CCTV devices, 84.41% for 17 CO2 devices, and 84.13% for 22 lighting sensor devices.
The fixed results highlight a higher energy consumption in the Fog computing simulation with fewer smart IoT devices such as CCTV. Meanwhile, the scalability result indicates that energy consumption efficiency benefits become more pronounced as the number of smart IoT devices increases. Furthermore, due to the high demand for processing, computation, and storage in the centralised Cloud computing scenario, the results confirm a direct correlation between the increase in energy consumption and the increase in the number of smart IoT devices. However, due to additional energy required by Fog computing nodes and resources, which are necessary for the core functions of Fog computing and the achievement of the Fog computing benefits, occasionally, the level of energy consumption was higher in the Fog computing scenario compared to the Cloud computing scenario.
Additionally, although Cloud computing possesses almost unlimited computation, processing, and storage capabilities and resources, consistent data transmission to the centralised Cloud computing layer can increase energy consumption. Meanwhile, in Fog computing, the results highlight more energy consumption savings compared to Cloud computing. However, the energy savings depend on the number and type of smart IoT devices, as shown by the energy consumption savings of 1.19% for 7 CCTVs and 0.14% for 22 light sensors. This result for the CCTV is negative, therefore highlighting increased energy consumption, which indicates a Fog computing challenge when managing a small number of fixed devices. The 0.14% saving for the 22 light sensors indicates an increased energy consumption saving for Fog computing for specific types of smart IoT devices. The high volume of data generated as the number of devices increases leads to increased network congestion and, subsequently, longer data transmission times. Therefore, the Cloud and Fog computing results highlight a direct correlation between the number of smart IoT devices and increased latency. Furthermore, the results demonstrate a consistently lower latency rate for Fog computing than Cloud computing. This highlights the efficiency benefit of Fog computing, which indicates that applications with real-time response requirements will benefit from Fog computing.
Additionally, the results highlight an enhancement in latency for all the smart IoT devices used in this study. The decrease in latency was significant for 7 CCTV cameras at 70.65%, 17 CO2 sensors at 84.41%, and 22 light sensors at 84.13%, indicating the benefits of Fog computing in reducing the request response times, which benefits decision-making and applications with real-time response requirements. Meanwhile, due to the distance between the device layer and the Cloud computing layer, data transmission takes longer, which is unsuitable for applications with real-time requirements. In both the Fog and Cloud scenarios, the scalable increase in the number of smart IoT devices leads to higher quantities of data generation and transmission, leading to higher network bandwidth usage. Meanwhile, the Fog computing scenario highlights the data management efficiency benefits of this approach by consuming slightly lower network bandwidth. Additionally, the results of network bandwidth usage varied, so that the 7 CCTV cameras output difference was −67%, which subsequently increased for 17 CO2 sensors to 38.95% and for 22 light sensors to 38.02%, indicating the varied impact of Fog computing on network bandwidth usage, dependent on the volume and type of smart IoT devices.

5.2. Scalability Simulation Analysis

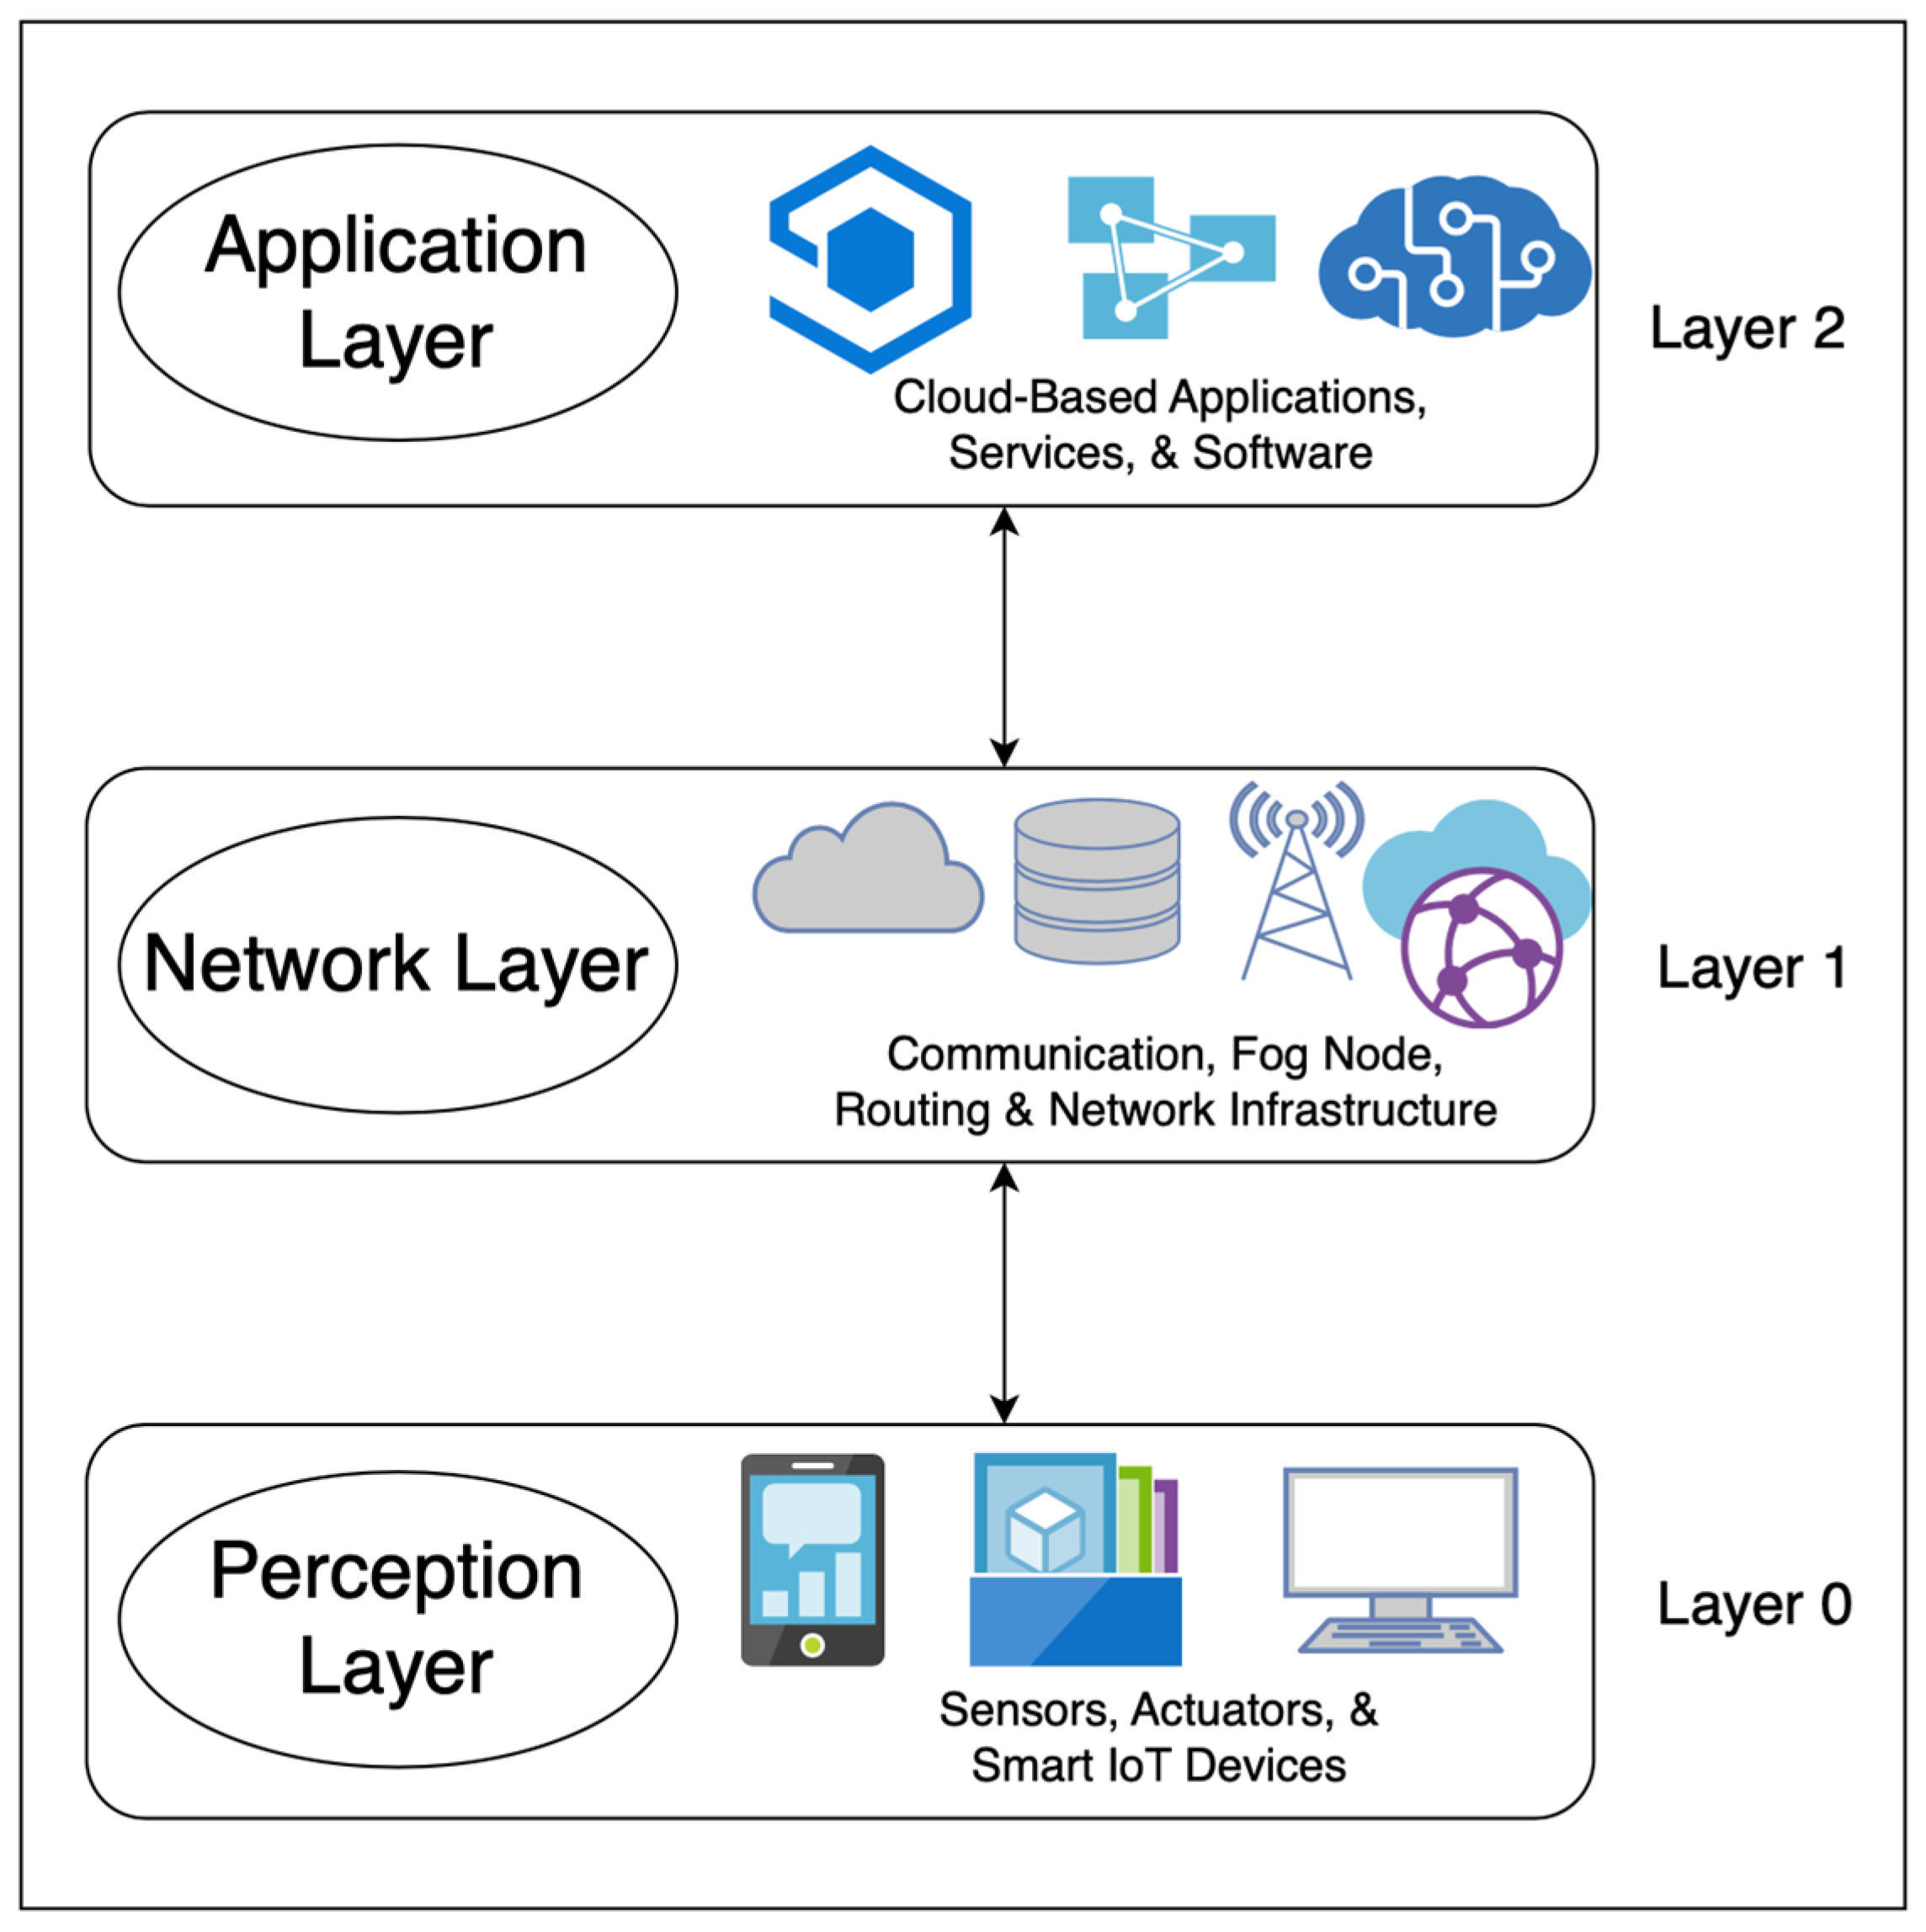
The following is a compilation of the scalability simulation results from monitoring smart IoT device usage in the smart building. For the benefit of this study, an experiment was conducted to evaluate real-world IoT device data in layers 0, 1, and 2, as shown in Figure 1 above, with IoT device scalability for smart office building use. The number of devices simulated was on scaled up in increments of 20 devices to capture energy consumption, latency, and network bandwidth usage and monitor performance metrics to demonstrate the benefits of Fog computing. 
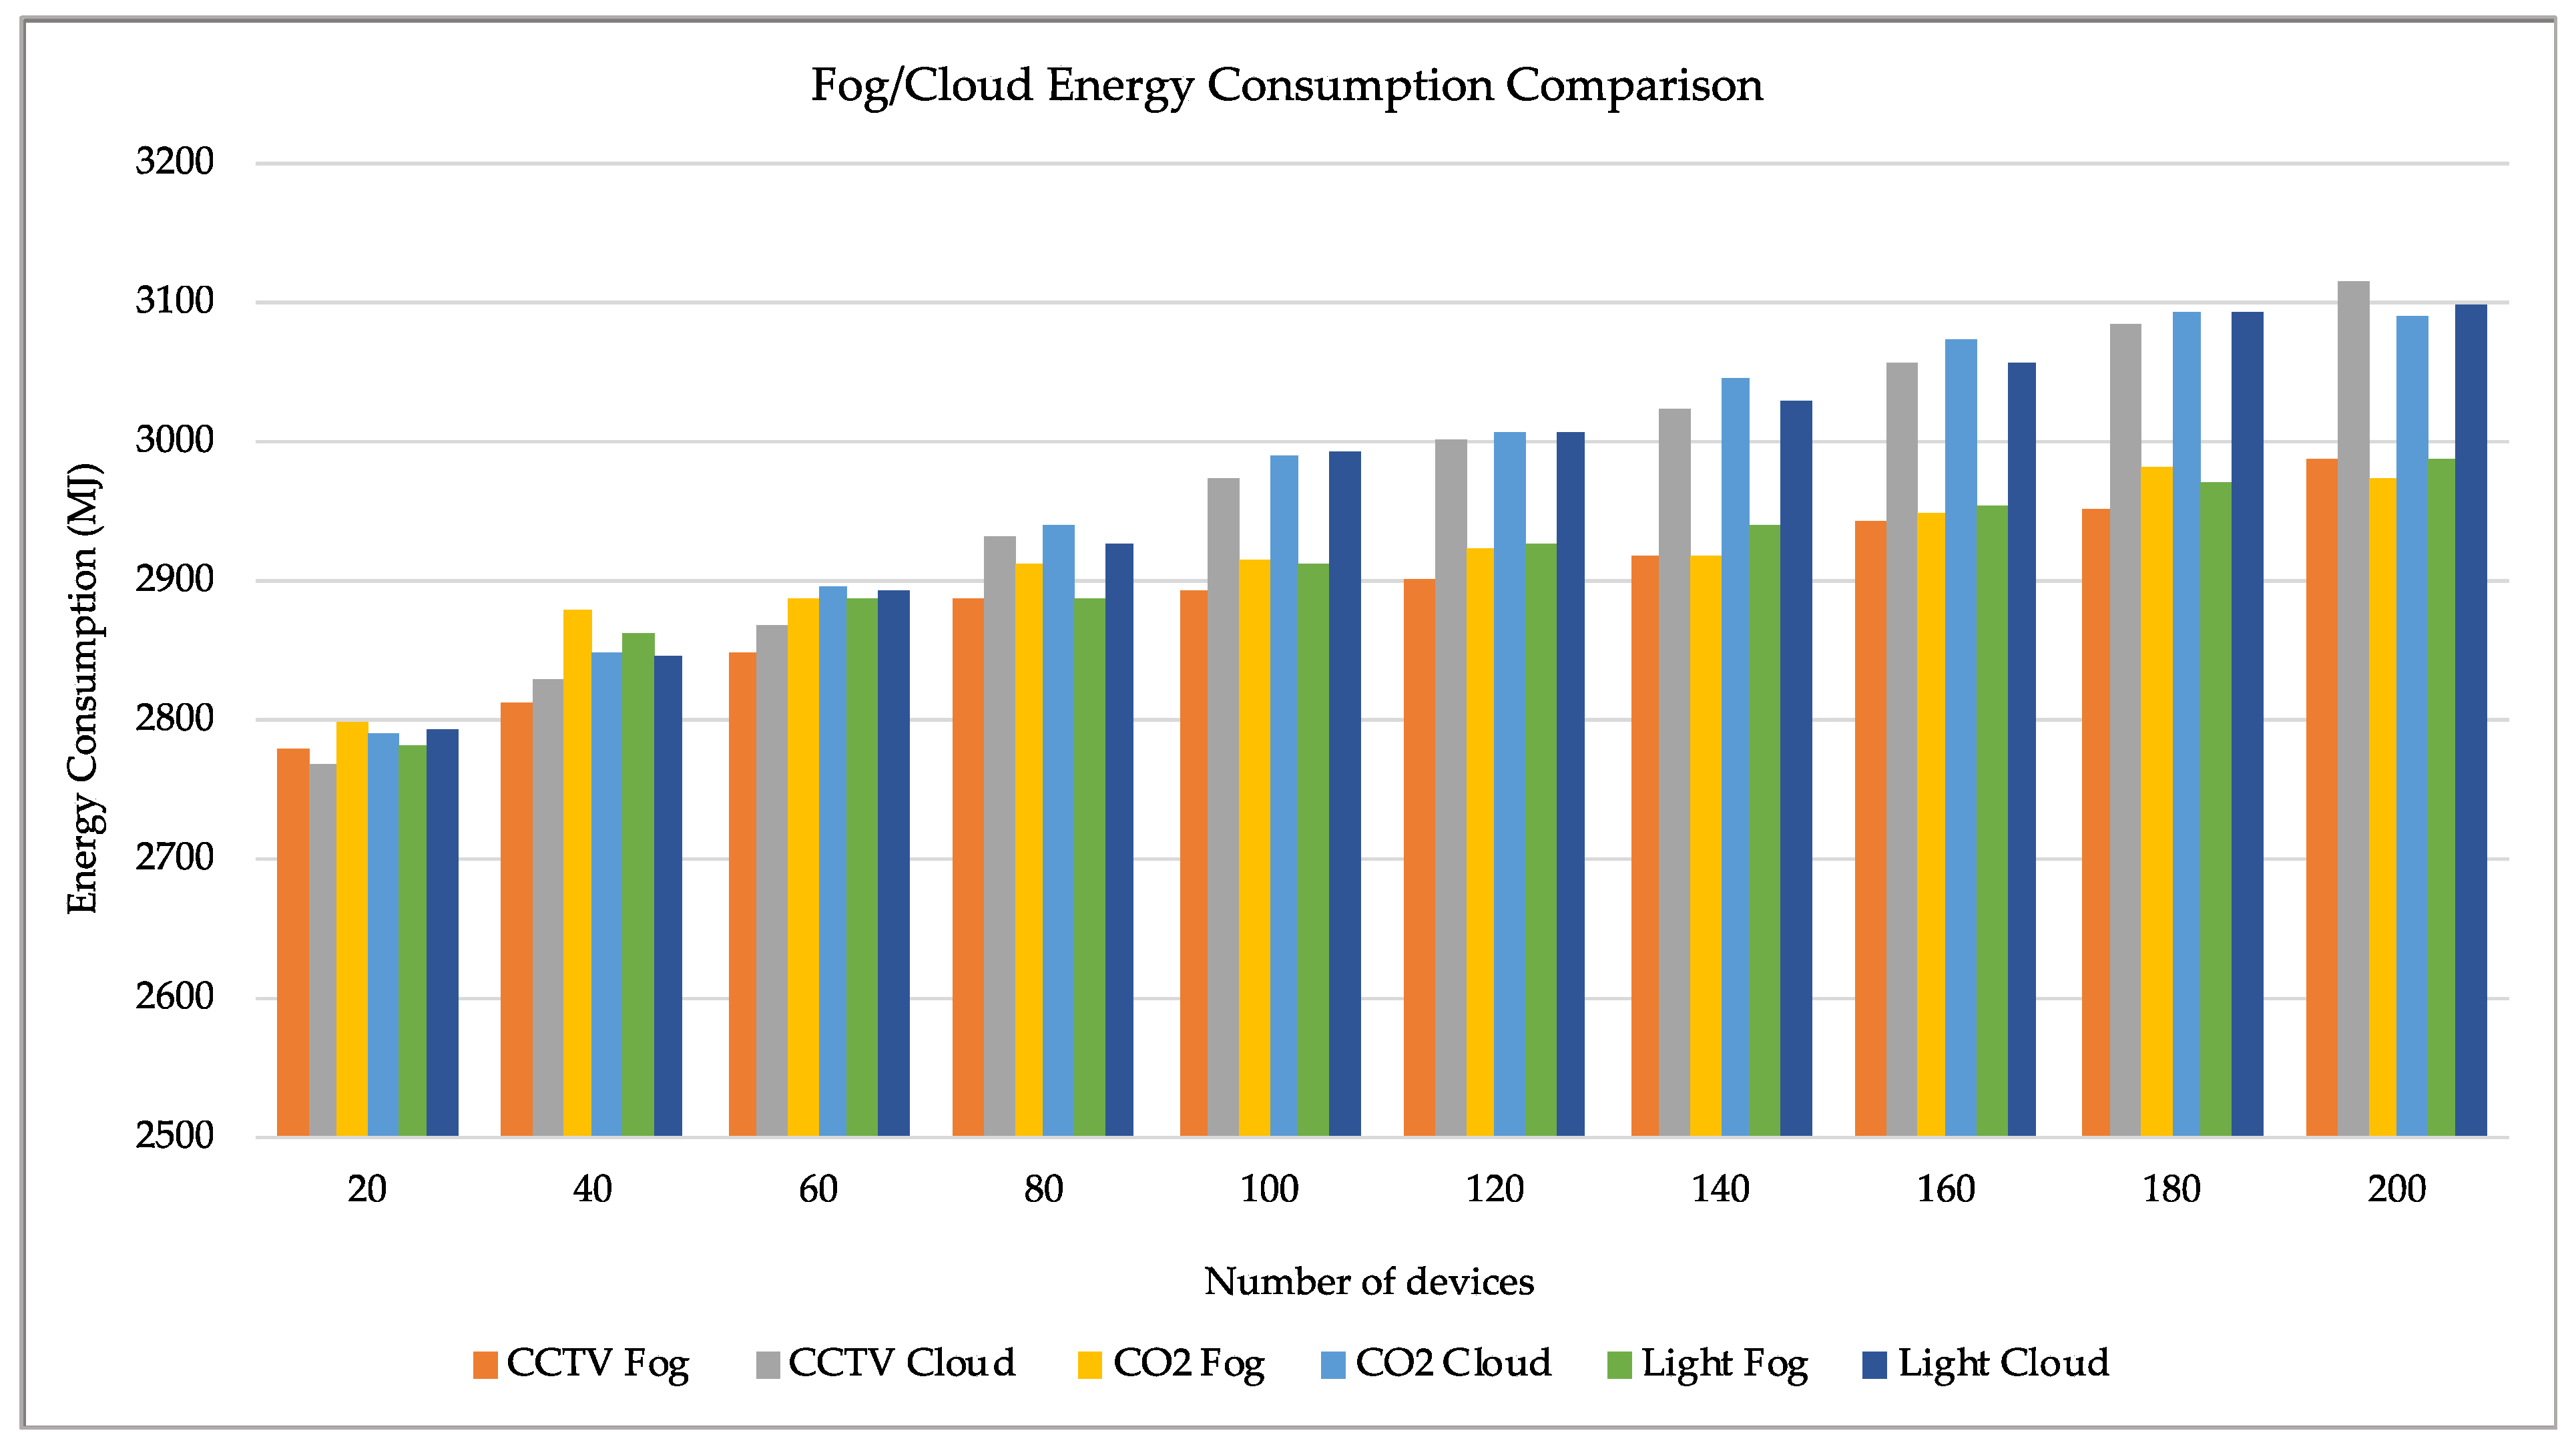
Table 7 below highlights the simulation results for the impact on energy consumption, focusing on managing CCTV IoT device data, CO2 IoT device data, and lighting sensor IoT device data processed at both the Cloud and Fog layer at the network’s edge in the smart office building. Furthermore, Table 7 shows varied numbers of devices, ranging from 20 to 200, in 20 device increments, simulating scalability for Cloud-only and Fog-only scenarios in the different (Cloud and Fog) columns. The difference % column represents the percentage difference between the Cloud-only and Fog-only simulations, comparing the energy consumption measured in megajoules (MJ).
In summary, the results highlighted in Table 7 show that the level of energy consumption for all three IoT devices was steady for both Cloud-only and Fog-only simulations with minimal changes, as the number of devices increased from 20 to 200. However, there was a higher difference from 100 to 200 devices. The results for CCTV in the Fog-only simulation clearly showed a slightly lower energy consumption rate compared to the Cloud-only simulation with a percentage difference between −0.47% at 20 devices and 4.35% at 180 devices, which then decreased to 4.07% at 200 devices.
While the result for CO2 is similar regarding energy consumption for both the Cloud-only and Fog-only simulations, the results of the Fog-only simulation also showed a lower energy consumption rate than those of the Cloud-only simulation. However, the percentage difference was between −0.26% at 20 devices and 4.20% at 140 devices. It then plateaued to between 3.57% and 4.01% from 140 to 200 devices, indicating a direct correlation between an increase in devices and the increase in energy consumption, which is logical and to be expected. However, the energy consumption figures stabilised with subsequent increases in devices between 140 and 160 devices.
Furthermore, the light sensor results also follow the same pattern of a steady level of energy consumption for both Cloud and Fog scenarios, with the Fog scenario consuming a lower energy rate, as shown in Figure 4. The percentage difference for the light sensors ranged between −0.58% at 40 devices and 3.89% at 180 devices.
In addition, 
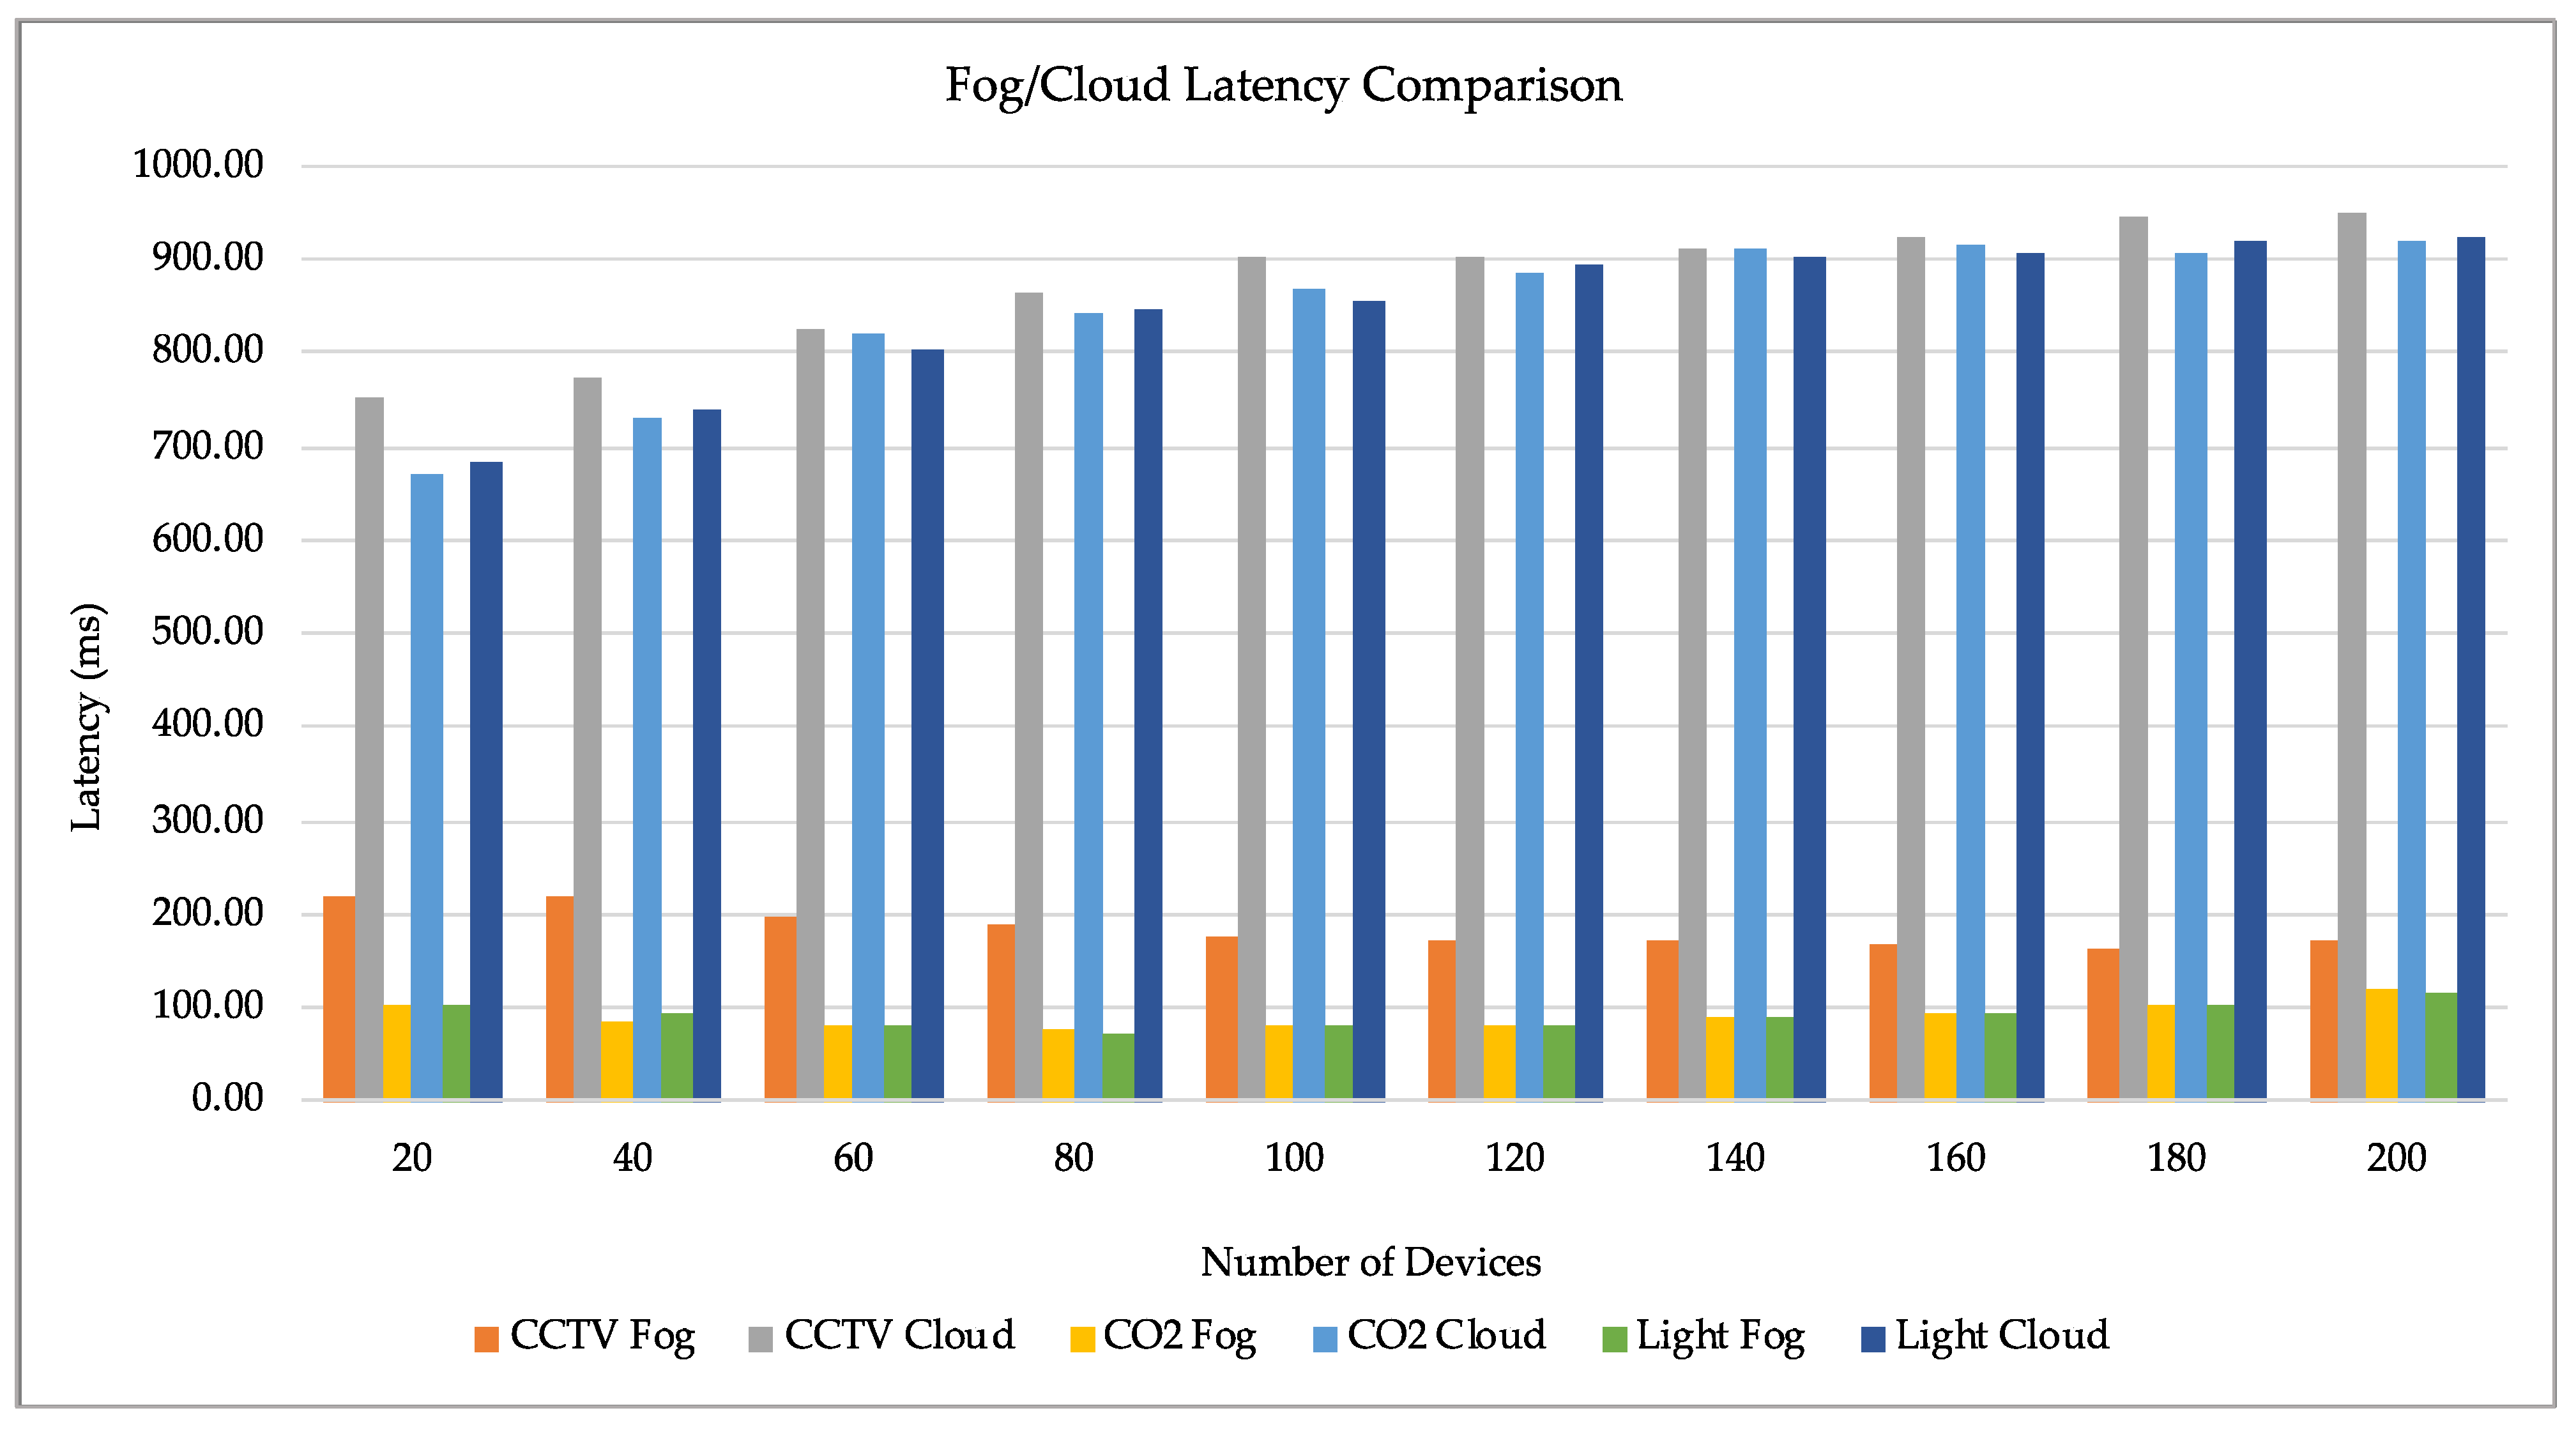
Figure 5 below highlights the simulation results for latency with a focus on the management of CCTV IoT device data, CO2 IoT device data, and light sensor IoT device data processed with computation and storage resources at both the data centre (Cloud) and the network’s edge (Fog) in the smart building. Table 8 highlights the number of devices in 20 increments ranging from 20 to 200. The simulation was conducted for Cloud-only and Fog-only, respectively, with results in the different (Cloud latency and Fog latency) columns, and the difference % column represents the percentage difference between the Cloud-only and Fog-only simulations, comparing system latency measured in milliseconds (ms).
Table 8 highlights Cloud and Fog-only latency simulation results for managing CCTV, CO2, and light sensor data in the smart building environment. The Cloud-only simulation is high at between 750.58 ms for 20 devices and 949.41 ms for 200 devices compared to the Fog-only simulation, which was significantly lower at 217.93 ms, a 70.97% difference for 20 devices, and 169.97 ms, an 82.10% difference for 200 devices. This highlights a direct correlation between an increased number of devices and latency for Cloud-only simulations. However, the Fog-only simulation results showed an indirect correlation between increased devices and decreased latency. This results from established scheduled routing and offloading activities within the Fog node cluster for data processing transfers.
Furthermore, some of the benefits of Fog computing are data process and storage optimisation, distributed resource availability and distributed load balancing capability, and optimising data processing locally at the network’s edge in a decentralised architecture design instead of processing at a centralised Cloud location further away from the network’s edge. This decentralisation also reduces data transfer distance and frequency, taking advantage of the distributed network resources at the network’s edge.
Table 8 displays the latency simulation results for CCTV, CO2, and light sensor IoT devices, respectively, which showed a similar trend, i.e., a direct correlation between an increase in devices and an increase in latency for Cloud-only simulation. Conversely, there is an indirect correlation between the number of devices and latency with Fog-only simulation, where the increase in the number of devices showed a decrease in latency. Table 8 shows the Cloud-only latency simulation at 672.76 ms for 20 devices, which increased to 922.16 ms for 200 devices, a difference of 249.39 ms. In contrast, the Fog-only simulation, compared to the Cloud-only simulation, shows significantly less latency by 84.78% at 102.42 ms for 20 devices and 87.15% less latency at 118.47 ms for 200 devices, a difference of 16.05 ms. This difference represents a significantly lower latency between Cloud-only and Fog-only data management and computation processing resources, clearly highlighting the benefits of Fog computing in the smart office building architecture.
There is a similar trend in the Cloud-only light sensor latency simulation at 684.74 ms for 20 devices, which increased to 926.42 ms for 200 devices, a difference of 241.68 ms. Compared to the Cloud-only simulation, the Fog-only simulation shows significantly less latency by 85.28% at 100.78 ms for 20 devices and 87.33% less latency at 117.38 ms for 200 devices, a latency difference of 16.60 ms. There is a significantly lower latency between Cloud and Fog-only data management and computation processing resources, clearly highlighting the benefits of Fog computing in the smart building architecture. Data processing and computations are performed at the network’s edge, allowing the Fog nodes to act as resources closer to the smart IoT devices in the smart building. Hence, the data travels a shorter distance than the transfer and management of data at the Cloud (data centre) layer, which will include more network hops at a greater distance.
In continuation, 
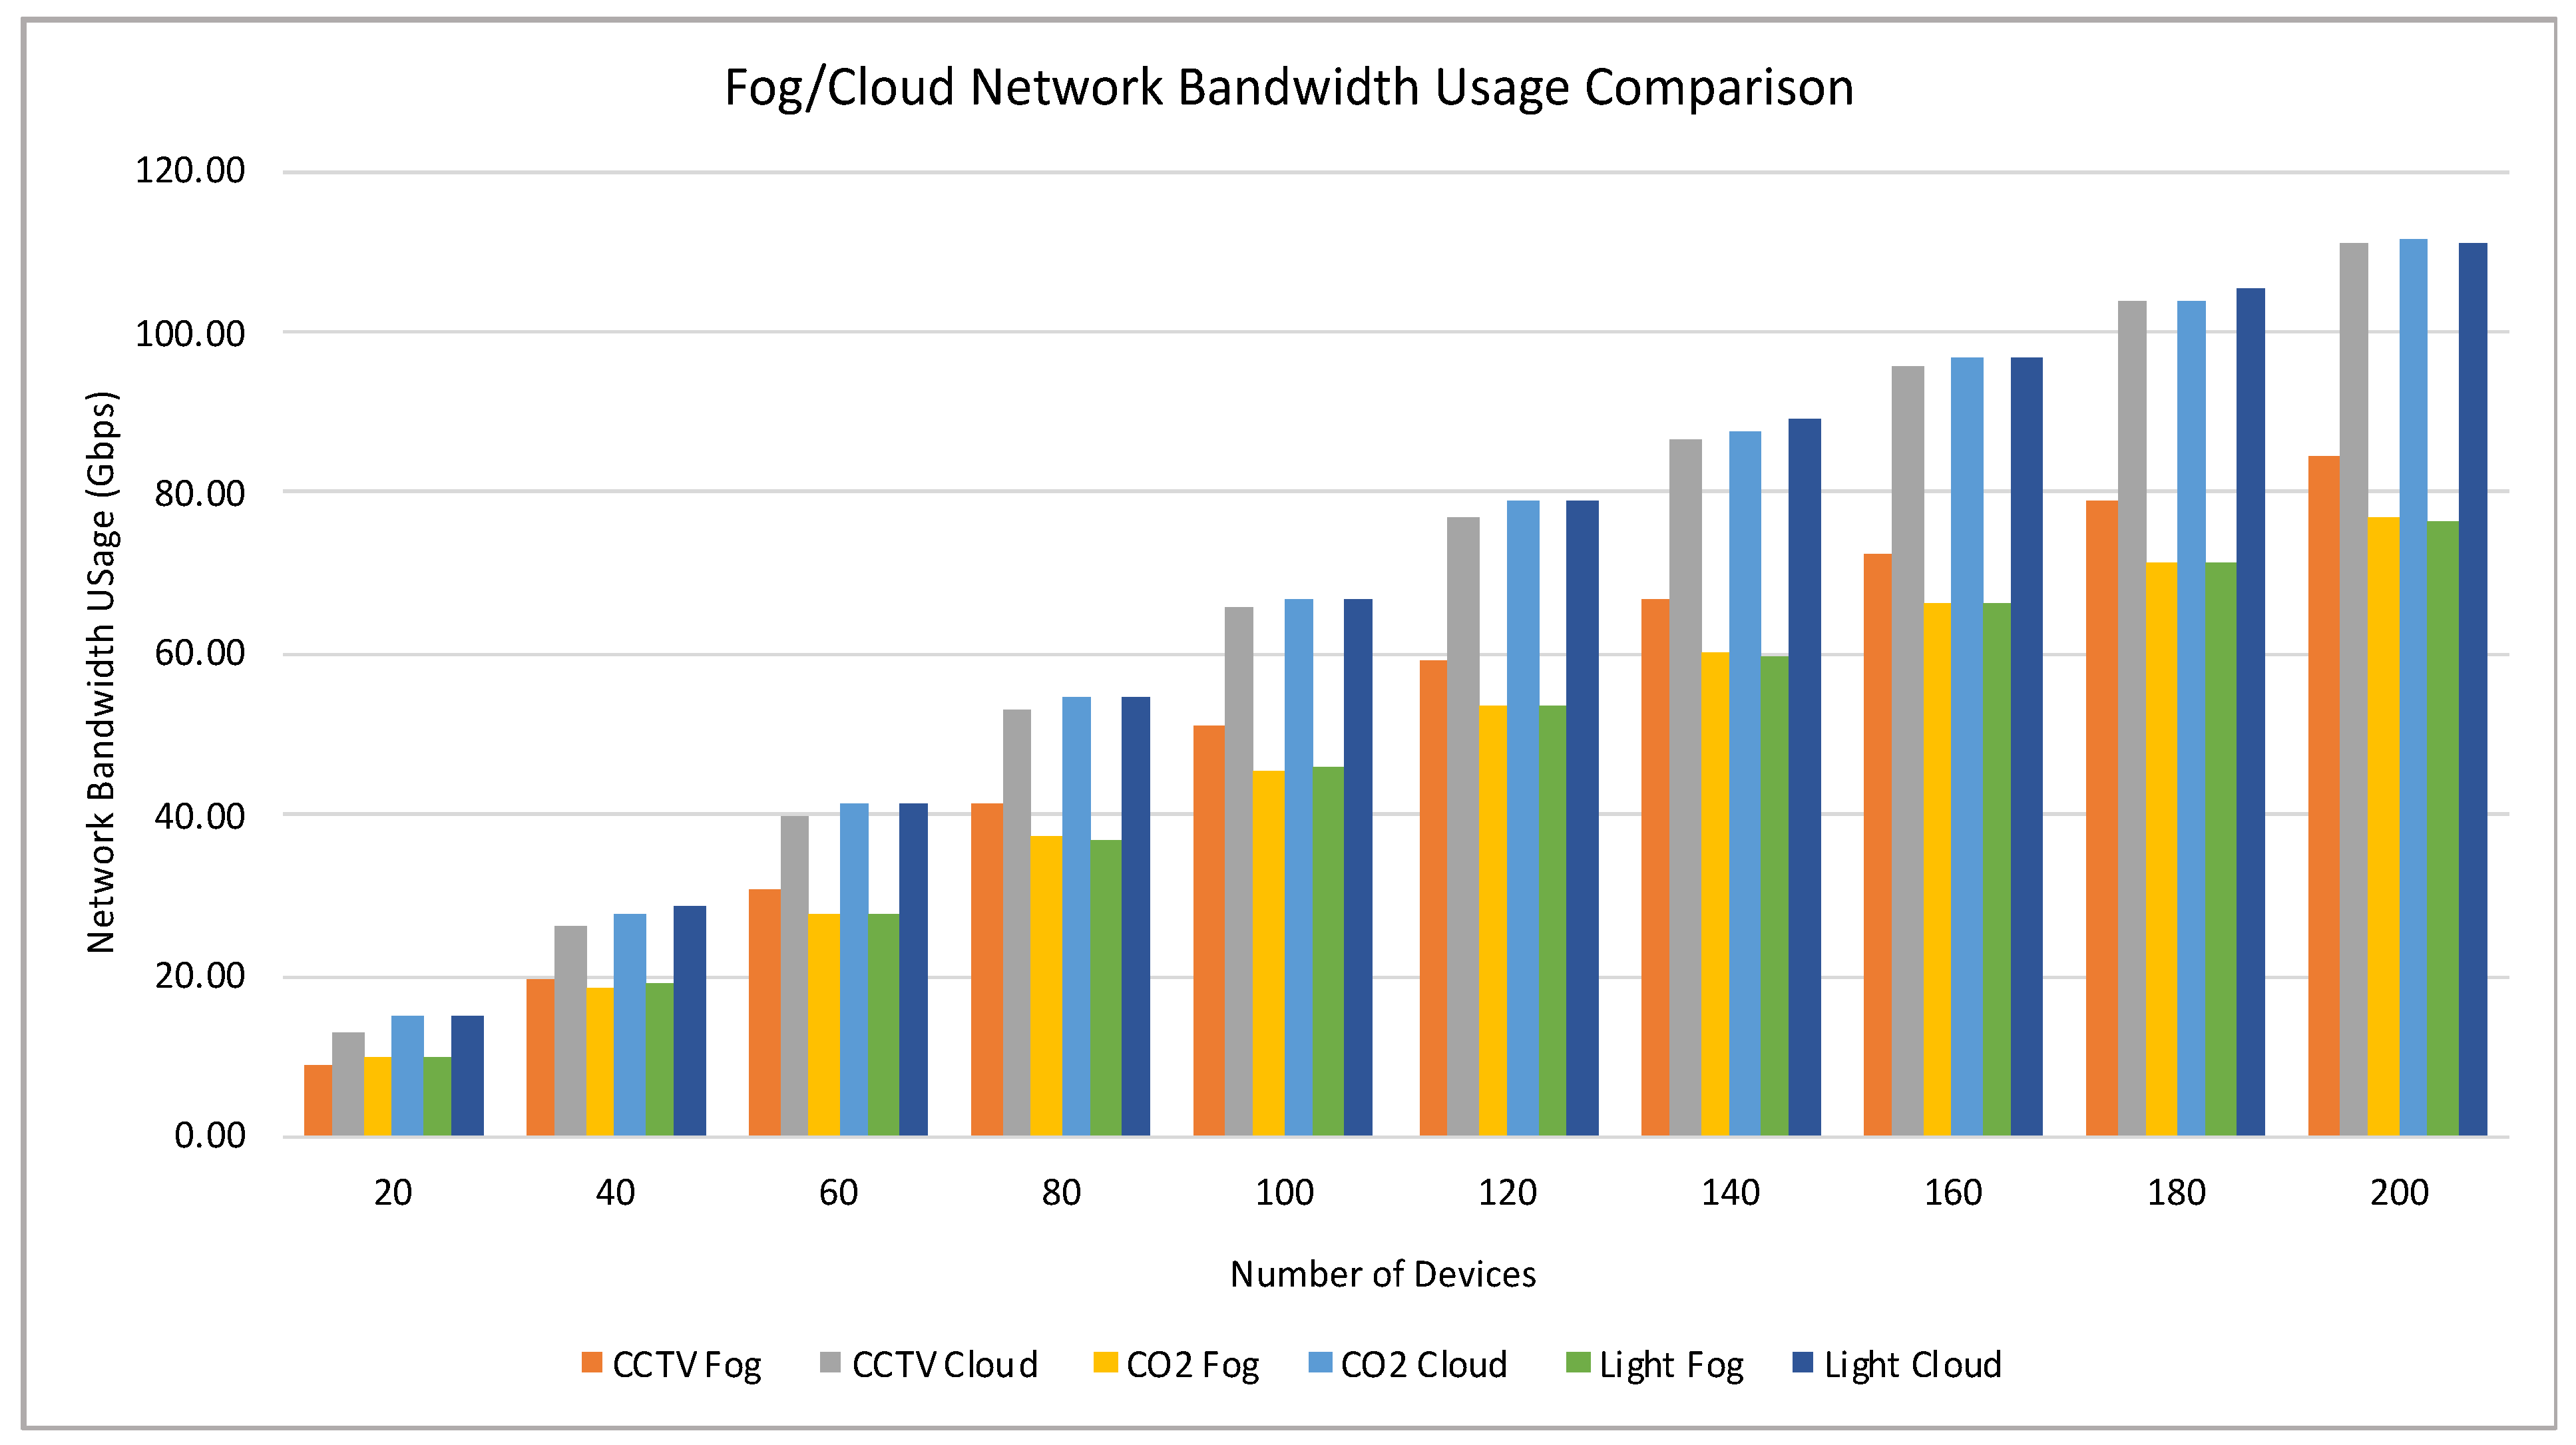
Figure 6 below graphically illustrates the simulation results for network bandwidth usage, focusing on the data management of CCTV IoT device data, CO2 IoT device data, and light sensor IoT device data processed with computing and storage resources at both the data centre (Cloud) and the network’s edge (Fog) in the smart building.
Similarly, Table 9 shows a similarity in the trends from earlier simulation results for energy consumption with a direct correlation between an increase in the number of devices and an increase in network bandwidth usage for both Cloud and Fog-only simulations. The network bandwidth usage simulation results for Cloud-only CCTV data management were 12.67 Gbps for 20 devices, which increased to 110.75 Gbps for 200 devices, a difference of 98.08 Gbps. In contrast, the Fog-only simulation, in comparison to Cloud-only simulation, shows a significantly lower network bandwidth usage by 31.02% at 8.74 Gbps for 20 devices and 23.72% less network bandwidth usage at 84.48 Gbps for 200 devices, a network bandwidth usage difference of 75.74 Gbps. Note that the percentage difference between the Cloud and Fog scenarios ranges from 31.02% at 20 devices, decreasing to 21.67% at 80 devices, then increasing steadily to 23.72% at 200 devices.
The trend continued, showing the network bandwidth usage simulation results for Cloud-only CO2 data management at 15.05 Gbps for 20 devices and increasing to 111.27 Gbps for 200 devices, a difference of 96.23 Gbps. The Fog-only simulation, in comparison to the Cloud-only simulation, shows significantly lower network bandwidth usage by 35.97% at 9.63 Gbps for 20 devices and 31.04% less network bandwidth usage at 84.48 Gbps for 200 devices, a network bandwidth usage difference of 67.10 Gbps. Note that the percentage difference between the Cloud and Fog scenarios ranges from 35.97% at 20 devices, decreasing steadily to 31.04% at 200 devices. Table 9 shows a direct correlation between the number of devices and the increase in the Cloud and Fog network bandwidth usage simulation results. The decentralised Fog computing results clearly show more than a 35% reduction in network bandwidth usage compared to the centralised Cloud computing results.
The simulation results for the light sensors maintained the same trends, with the Cloud-only data at 14.78 Gbps for 20 devices and increasing to 110.76 Gbps for 200 devices, a difference of 95.98 Gbps. At the same time, the Fog-only simulation, in comparison to Cloud-only simulation, shows significantly lower network bandwidth usage by 34.78% at 9.64 Gbps for 20 devices and 31.22% less network bandwidth usage at 76.18 Gbps for 200 devices, a network bandwidth usage difference of 66.54 Gbps. Note that the percentage difference between the Cloud and Fog scenarios ranges from 34.78% at 20 devices, decreasing steadily to 31.22% at 200 devices, showing a direct correlation between the increase in the number of devices and the increase in both Cloud and Fog network bandwidth usage simulation results. The decentralised Fog computing results clearly show more than a 34% reduction in network bandwidth usage compared to the centralised Cloud computing results.
In summary, this study used real-world IoT device data and real-world infrastructure data with multiple Raspberry Pi 4 model B parameter values representing Cloud data centres, proxy servers, and Fog nodes in a smart building’s Cloud–Fog network architecture. According to the simulation results, the management and computation of data processed at both the centralised Cloud data centre location and the decentralised Fog node clusters closer to the network’s edge, are highlighted and compared. The Cloud and Fog computing comparison also highlights the difference in energy consumption, latency, and network bandwidth usage output for Cloud and Fog computing data processing. Overall, the data processed at the Cloud layer had a relatively higher energy consumption, latency, and network bandwidth output. Conversely, the results from data processing at the Fog computing layer demonstrated the optimisation benefits of lower energy consumption, improved latency, and less congested network bandwidth usage.

6. Discussion

Evaluating the energy consumption comparison for Cloud and Fog computing across all three smart IoT devices in the smart office building demonstrates that the number of devices directly correlates to the increase in energy consumption. More energy is necessary for the computation, processing, transmission, and storage of data at the centralised Cloud data centre layer as the number of devices increases. However, the results also show instances where energy consumption for data processing, computation, and storage is higher at the Fog layer than at the Cloud layer. These instances of increased energy consumption by Fog computing are due to the infrastructure resource requirements at the network’s edge that facilitate operations within the Fog layer, which is what produces the benefits mentioned above. These infrastructure devices require more energy during the data management process at the network’s edge. The Fog nodes within the cluster also need to be active to receive and process requests from the scheduling node during the offloading and load distribution process. In addition, the scalability analysis demonstrates that Fog computing benefits such as energy efficiency and savings only kick in when the smart IoT device numbers are increased. Therefore, the high energy consumption levels observed for the Fog scenario compared to the Cloud scenario in the smart office floor layout can be theorised to be due to the relatively small number of CCTV cameras used in this study.
A review of the latency comparison between Cloud and Fog computing demonstrates that, as the number of devices increases the data generated increases, resulting in increased network congestion and higher data computation and processing times. Therefore, as the number of devices increases, there is an increase in the latency delay for both Cloud and Fog computing. However, the latency level for Fog computing is significantly lower compared to Cloud computing. Consequently, this shows that the adoption and introduction of the Fog computing layer to the network architecture of the smart building will optimise latency levels across all the smart IoT devices, thereby increasing response times for applications that require real-time and time-sensitive responses as a core function, such as healthcare applications in hospitals and care homes.
The network bandwidth usage review of the comparison between Cloud and Fog computing also demonstrates that an increased number of devices results in an increase in the data generated, which leads to more data being transmitted to the centralised (Cloud) or decentralised (Fog) environments for processing. Consequently, this leads to increased network bandwidth usage in the smart building. Furthermore, the network bandwidth usage in Cloud computing is slightly higher than in the Fog computing layer, highlighting the benefits of Fog computing. This difference also demonstrates that Fog computing optimises network bandwidth usage efficiency, thereby addressing the weaknesses associated with Cloud computing in network architecture and improving data management performance and the efficiency of IoT smart devices within a smart building environment. However, simulation results based on real-world data can vary depending on the type of smart IoT device, the volume and size of the data generated, and the frequency of data generation and transmission, including the infrastructure parameter values used in the simulation experiment, and could lead to results different to those of this study.
In addition, the results obtained from this study highlight the benefits of integrating the Fog computing layer into the traditional Cloud computing architecture within a smart office building environment. The analysis and interpretation of these results can assist and influence critical business decisions based on the design and operations, focusing on the benefits of Fog computing such as reduced energy consumption, improved latency, and fewer network bandwidth usage bottlenecks within smart building network architectures. Although latency and network bandwidth usage significantly improve energy savings, CCTV energy savings show limited results with poorer performance. This is due to the relatively low number of CCTV cameras in the smart office floor plan. However, in the scalability analysis section, energy savings for CCTV were achieved and showed significant improvements due to the increased number of CCTV devices. Additionally, these interpretations can optimise healthcare monitoring and management in hospitals and care homes using smart IoT device applications that operate in real-time. These Fog computing benefits address the need to meet the increasing demand for real-time responses by real-time applications. However, there could also be a need to combine both Cloud and Fog computing to achieve the best benefits for critical applications; this depends on the design of smart IoT applications and the operational criteria required for core functionality.

6.1. Scalability in a Broader Context

It is crucial to consider the scalability of the proposed architecture in various real-world settings, from both a Cloud and Fog computing perspective, and in the context of smart IoT devices. The ability to increase or decrease the number of smart IoT devices in various network architecture environments is described as scalability. The architecture’s scalability proposed in this study can be applied to other real-world environments. Some of these environments include manufacturing plants and industries, healthcare facilities, such as hospitals and care homes, and smart cities.
Industrial IoT (IIoT) environments are more complex due to the incorporation of smart industrial machines capable of complex functions with large-scale network sensors and time-sensitive monitoring capabilities [58]. Some of the challenges of the application of IIoT in a Cloud computing environment include security and privacy, data protection regulations, data location restrictions, and high-load-processing demand, which causes communication delays. Scalability challenges include the number of smart IoT devices required to support an industrial application environment and how a system can be designed efficiently to manage energy consumption issues in a scaled-up IIoT environment.
These challenges can be addressed through the adoption of Fog and edge computing. In the case of scalability in an IIoT environment, adopting Fog computing supports a decentralised network structure with greater security as data are processed locally and in a decentralised manner [59]. Fog computing also supports faster processing speeds and improving data communication for IIoT applications. In the case of smart device scalability, and as shown in this study, Fog computing, compared to Cloud computing, optimises latency, energy consumption, location awareness, real-time connectivity, and security and privacy. As in the smart office building floor plan, the design and implementation of distributed optimisation algorithms can also be adopted in an IIoT environment to manage smart IoT device numbers and the distributed computing resource issue. In addition, cloud computing possesses high interoperability, reliability, and scalability to enhance resource utilisation [60].
Healthcare environments can include hospitals, care homes, or homes for assisted living. In hospitals and other care home environments, the scalability of smart IoT devices can be used to track the physical location of patients or residents and to monitor their vital signs as an integral part of their care. Furthermore, smart IoT devices can be required to manage facilities and track assets and equipment. Some of the challenges that could be faced in the healthcare environment are the reliability, privacy, and security of patient or resident data, which are classed as sensitive data, as well as providing a good level of QoS. To address these issues, adopting Fog computing, and its ability to manage and process patient data closer to the network edge as a priority and with strict and secure high-level encryption, can strengthen the level of security in these types of healthcare facilities.
Another environment is smart cities, where the scalability of smart IoT devices is on a larger scale, involving a wide variety and range of smart IoT devices and applications, including the management of utilities, transport, traffic, and security. Some of the challenges involved in this environment involve the management of large data volumes and the management of various interoperable systems. To address these challenges, adopting the Fog computing model, with its hierarchical nature, can address the issue of large data volumes and improve relationships between various solution providers for better sharing and collaboration. The processing and storage of large data volumes is carried out in a scalable manner through Cloud computing storage solutions, while processing occurs at the network edge in the Fog computing layer.

6.2. Broader Implications

Optimised energy efficiency is one of the broader implications of this research study in the context of the IoT and smart buildings. The implications of the results indicate that the use of Fog computing significantly optimises energy consumption in IoT network environments. Furthermore, this is essential due to the increased use of smart IoT devices, leading to increased energy consumption. The adoption of Fog computing in the planning and design of smart buildings will optimise energy consumption, which in turn will lead to the more sustainable construction of smart buildings, which will subsequently lead to addressing global issues such as the United Nations Sustainable Development Goals, particularly SDG 11 on sustainable cities and communities.
Optimised latency is another broader implication of this study in the context of the IoT. The optimised latency benefits of Fog computing are suitable for applications with real-time response requirements in an IoT network architecture. Furthermore, this benefits automation, real-time data processing, and response to requests in a smart building network architecture environment. The adoption of Fog computing within a smart building can improve and optimise security, environment control, and emergency system response times, which is beneficial for making critical decisions.
The importance of network bandwidth usage efficiency to the IoT network environment cannot be overstated. The optimised efficiency of network bandwidth usage improves data flow and reduces network bandwidth usage congestion. Adopting Fog computing in a smart building environment optimises and supports reliability and performance. Should this be adopted in all smart buildings in a smart city with a large volume of smart IoT devices, this would result in enhanced and efficient network bandwidth usage for the improved performance and reliability of other smart systems in the smart city.
The scalability approach is also important in the broader context, with smart IoT devices’ ability to be scaled up, which benefits the IoT smart building network architecture environment. Consequently, with advancements in smart building development and innovative functions and capabilities will improve current smart buildings and support the retrofitting of existing non-smart buildings to benefit from Fog computing.

7. Limitations

Although real data were used in this study, the results of this study were derived through the simulation of a controlled environment. All simulations have inherent constraints when compared to real-world behaviour. In a real-world environment, there might be other factors and conditions, such as network infrastructure parameter values, upload and download speed fluctuations and dynamic IoT devices, that are not replicable or have not been considered under the simulation conditions of this study, leading to different outcomes and limiting the generalisation of the results.
The small number of smart IoT devices used in this study, such as CCTV devices, is a limitation and limits the generalisation of the results. Meanwhile, in a real-world environment, smart IoT device numbers are much higher, which will make the results very different from the simulation in this study.
In addition, the efficiency benefits of Fog computing are variable and are dependent on the type of smart IoT device; the generated quantity of data, such as for CCTV data, is greater than CO2 and light sensor data. This indicates that the results might vary across various smart home network architecture environments and cannot be generalised.
Only the IoT device implementation was considered, whereas the other general computer network traffic was outside of the scope of this study. The simulation used a single floor plan that is specific and directly impacts where smart IoT devices are placed in a fixed scenario, making it unique, while a generalised result analysis is available in the scalability section.
Due to the large-scale nature and geographical location of the smart IoT devices and the Cloud and Fog computing network infrastructure, it was impractical to measure accurately and in detail from the smart IoT devices through to the Fog and Cloud layer measurements.

8. Future Research

There are numerous areas in this study that are appropriate for potential future research development. Some of these areas include exploring security and privacy issues as a current challenge in IoT network environments. Another area is investigating how users within a smart building can best interact with the smart IoT devices, leading to improved QoS.
A further area for future research is to investigate the area of smart IoT device interoperability, due to the number of variable smart IoT devices that can be present in a smart building. Furthermore, future research areas that build on or extend this study based on the continued development of the IoT network, as mentioned above, will be integral to addressing future challenges and limitations to further improve and develop smart IoT network technology.
Additionally, in advanced computing technology areas such as machine learning and artificial intelligence, various forms of data analytics research can be conducted using smart home datasets, extending the scalability element in this study.

9. Conclusions

In conclusion, the results of the data derived from the simulation in this study, with regard to the analysis of energy consumption, make it evident that Fog computing can be more efficient, with core services running energy consumption optimisation. An example was the result of the CCTV energy consumption scalability analysis, where the energy consumption for Fog computing was slightly higher than for Cloud computing at 20 devices. However, from 40 to 200 devices, the Fog computing energy consumption levels steadily decreased compared to Cloud computing. For CO2, the Fog computing energy consumption levels were again higher than the Cloud up to 40 devices, subsequently reducing as the number of devices increased to 200. The light sensor results highlight a different trend, with Fog computing energy levels starting lower than the Cloud computing levels at 20 devices, increasing to become higher at 40 devices, and then decreasing steadily from 60 to 200 devices.
From the fixed scenario results in Section 4, the results for CCTV demonstrate a 1.9% higher energy saving for Fog compared to Cloud computing. Meanwhile, CO2 was lower at 0.06%, and the lighting sensor energy consumption was lower at 0.14% for Fog compared to Cloud computing. Regarding latency, the Fog computing results, compared to Cloud computing, were significantly lower by 70.65% for CCTV, 84.41% for CO2, and 84.13% for lighting sensors. The network bandwidth usage results for Fog computing compared to the Cloud scenario showed a significant increase for CCTV by 67%. However, the CO2 and lighting sensors exhibited reduced usage by 38.95% and 38.02%, respectively.
In the scalability analysis section, the Fog computing results for CCTV, compared to the Cloud results, showed lower energy savings by −0.47% for 20 devices. Then, the energy savings increased to 4.35% for 180 devices. The CO2 results showed a similar trend of lower energy savings at −0.26% for 20 devices and an increase to between 4.20% and 4.01% for 140 to 200 devices. The lighting sensor results also showed a similar trend of a −0.58% saving at 40 devices increasing to 3.89% for 180 devices. For latency, the CCTV Fog computing results compared to Cloud computing showed a 70.97% difference at 20 devices and a 82.10% difference at 200 devices. Meanwhile, the CO2 results showed significantly less latency by 84.78% for 20 devices and 87.15% less for 200 devices. The lighting sensor results showed significantly less latency, by 85.28% for 20 devices and by 87.33% for 200 devices. Compared to Cloud computing, the Fog computing results showed substantially less network bandwidth usage by 31.02% for 20 devices and by 23.72% for 200 devices.
This trend indicated a shift in the threshold as the number of devices increased before the benefits of Fog computing energy consumption kicked in. Then, energy consumption started to decline as expected compared to Cloud computing. These results vary due to the type of IoT smart device, device numbers, their respective device parameter values set in the iFogSim2 network simulation toolkit, and the infrastructure parameter value settings when using real-world data. Furthermore, the results indicate that the Fog computing layer is better suited and equipped to deal with many volatile random devices than the Cloud computing layer. Conversely, Fog computing could be more energy efficient generally for a low-data bandwidth and fixed, rigid infrastructure. In this study, however, the benefits are derived from the extra volatility of additional smart IoT devices and the accompanying data load. Therefore, this study has demonstrated its contributions through the results gathered, as stated earlier, in this paper by using the iFogSim2 simulator toolkit to monitor and assess smart IoT devices in a smart building and investigative insights into the impact of scalability of these IoT devices on the energy consumption, latency, and network bandwidth usage metrics for both Fog and Cloud computing paradigms.
Conversely, the trend in the literature has been to use the default parameter values for infrastructure and devices in iFogSim2. In this study, the use of real-world smart IoT devices and infrastructure parameter values represents a valuable and novel contribution to the field of Cloud and Fog computing research.

Author Contributions

Conceptualisation, K.N.L. and R.M.G.; methodology, K.N.L. and R.M.G.; software, K.N.L.; formal analysis, K.N.L. and R.M.G.; investigation, K.N.L. and R.M.G.; writing—review and editing, K.N.L., R.M.G. and T.K.O.; project administration, K.N.L. All authors have read and agreed to the published version of the manuscript.

Funding

This research received no external funding.

Institutional Review Board Statement

Not applicable.

Informed Consent Statement

Not applicable.

Data Availability Statement

Data are contained within the article.

Conflicts of Interest

The authors declare no conflicts of interest.

References

  1. Hazra, A.; Rana, P.; Adhikari, M.; Amgoth, T. Fog computing for next-generation internet of things: Fundamental, state-of-the-art and research challenges. Comput. Sci. Rev. 2023, 48, 100549. [Google Scholar] [CrossRef]
  2. da Silva, P.V.B.C.; Taconet, C.; Chabridon, S.; Conan, D.; Cavalcante, E.; Batista, T. Energy awareness and energy efficiency in internet of things middleware: A systematic literature review. Ann. Telecommun. 2023, 78, 115–131. [Google Scholar] [CrossRef]
  3. Saleem, M.U.; Shakir, M.; Usman, M.R.; Bajwa, M.H.T.; Shabbir, N.; Ghahfarokhi, P.S.; Daniel, K. Integrating smart energy management system with internet of things and cloud computing for efficient demand side management in smart grids. Energies 2023, 16, 4835. [Google Scholar] [CrossRef]
  4. Pallewatta, S.; Kostakos, V.; Buyya, R. Placement of Microservices-based IoT Applications in Fog Computing: A Taxonomy and Future Directions. ACM Comput. Surv. 2023, 55, 1–43. [Google Scholar] [CrossRef]
  5. Rejeb, A.; Rejeb, K.; Treiblmaier, H.; Appolloni, A.; Alghamdi, S.; Alhasawi, Y.; Iranmanesh, M. The Internet of Things (IoT) in healthcare: Taking stock and moving forward. Internet Things 2023, 22, 100721. [Google Scholar] [CrossRef]
  6. Tyagi, A.K.; Dananjayan, S.; Agarwal, D.; Ahmed, H.F.T. Blockchain—Internet of Things Applications: Opportunities and Challenges for Industry 4.0 and Society 5.0. Sensors 2023, 23, 947. [Google Scholar] [CrossRef]
  7. Patel, P.; Kattepur, A.; Cassou, D.; Bouloukakis, G. Evaluating the Ease of Application Development for the Internet of Things; HAL Portal Inria: 2013. Available online: https://inria.hal.science/hal-00788366 (accessed on 5 November 2023).
  8. Alsboui, T.; Qin, Y.; Hill, R.; Al-Aqrabi, H. Enabling distributed intelligence for the Internet of Things with IOTA and mobile agents. Computing 2020, 102, 1345–1363. [Google Scholar] [CrossRef]
  9. Lawal, K.N.; Olaniyi, T.K.; Gibson, R.M. A Fog Computing-Based Efficient Data Management Smart Home Architecture. In Proceedings of the Future Technologies Conference (FTC) 2022; Arai, K., Ed.; Springer International Publishing: Cham, Switzerland, 2023; Volume 2, pp. 233–257. [Google Scholar]
  10. Kumar, D.; Rishu; Annam, S. Fog Computing Applications with Decentralized Computing Infrastructure—Systematic Review. In Proceedings of the Seventh International Conference on Mathematics and Computing; Giri, D., Choo, K.-K.R., Ponnusamy, S., Meng, W., Akleylek, S., Maity, S.P., Eds.; Springer: Singapore, 2022; pp. 499–509. [Google Scholar]
  11. Mahmud, R.; Buyya, R. Modelling and simulation of fog and edge computing environments using iFogSim toolkit. In Fog and Edge Computing: Principles and Paradigms; Wiley STM: Hoboken, NJ, USA, 2019; pp. 1–35. [Google Scholar]
  12. Srinivasan, C.; Sridhar, P.; Pradeepa, J.; Thulasiragavan, P.V.; Yuvaraj, R. Internet of Things Towards the Implementation of a Smart City. In Proceedings of the 3rd International Conference on Pervasive Computing and Social Networking (ICPCSN), Salem, India, 19–20 June 2023; pp. 984–988. [Google Scholar]
  13. Mondal, M.K.; Mandal, R.; Banerjee, S.; Biswas, U.; Lin, J.C.-W.; Alfarraj, O.; Tolba, A. Design and Development of a Fog-Assisted Elephant Corridor over a Railway Track. Sustainability 2023, 15, 5944. [Google Scholar] [CrossRef]
  14. Das, R.; Inuwa, M.M. A review on fog computing: Issues, characteristics, challenges, and potential applications. Telemat. Inform. Rep. 2023, 10, 100049. [Google Scholar] [CrossRef]
  15. Shahid, M.A.; Alam, M.M.; Su’ud, M.M. A systematic parameter analysis of cloud simulation tools in cloud computing environments. Appl. Sci. 2023, 13, 8785. [Google Scholar] [CrossRef]
  16. Mahmud, R.; Pallewatta, S.; Goudarzi, M.; Buyya, R. IFogSim2: An Extended iFogSim Simulator for Mobility, Clustering, and Microservice Management in Edge and Fog Computing Environments. September 2021. Available online: http://arxiv.org/abs/2109.05636 (accessed on 25 October 2022).
  17. Raghavendar, K.; Batra, I.; Malik, A. A robust resource allocation model for optimizing data skew and consumption rate in cloud-based IoT environments. Decis. Anal. J. 2023, 7, 100200. [Google Scholar] [CrossRef]
  18. Khosroabadi, F.; Fotouhi-Ghazvini, F.; Fotouhi, H. Scatter: Service placement in real-time fog-assisted iot networks. J. Sens. Actuator Netw. 2021, 10, 26. [Google Scholar] [CrossRef]
  19. Klopči, M.K.; Kuipers, A.; Oltra-Badenes, R.; Guerola-Navarro, V.; Gil-Gómez, J.-A.; Botella-Carrubi, D. Design and Implementation of Teaching–Learning Activities Focused on Improving the Knowledge, the Awareness and the Perception of the Relationship between the SDGs and the Future Profession of University Students. Sustainability 2023, 15, 5324. [Google Scholar] [CrossRef]
  20. Domingo, M.C. An overview of the Internet of Things for people with disabilities. J. Netw. Comput. Appl. 2012, 35, 584–596. [Google Scholar] [CrossRef]
  21. Alfalouji, Q.; Schranz, T.; Kümpel, A.; Schraven, M.; Storek, T.; Gross, S.; Monti, A.; Müller, D.; Schweiger, G. IoT Middleware Platforms for Smart Energy Systems: An Empirical Expert Survey. Buildings 2022, 12, 526. [Google Scholar] [CrossRef]
  22. Rajagopal, S.M.; Supriya, M.; Buyya, R. Resource Provisioning using Meta-heuristic Methods for IoT Microservices with Mobility Management. IEEE Access 2023, 11, 60915–60938. [Google Scholar] [CrossRef]
  23. Maller, L.M.; Suskovics, P.; Bokor, L. Edge computing in the loop simulation framework for automotive use cases evaluation. Wirel. Netw. 2023, 29, 3717–3735. [Google Scholar] [CrossRef]
  24. Bachiega, J.B., Jr.; Costa, B.; Carvalho, L.R.; Rosa, M.J.F.; Araujo, A. Computational Resource Allocation in Fog Computing: A Comprehensive Survey. ACM Comput. Surv. 2023, 55, 1–31. [Google Scholar] [CrossRef]
  25. Chernyshev, M.; Baig, Z.; Bello, O.; Zeadally, S. Internet of things (IoT): Research, simulators, and testbeds. IEEE Internet Things J. 2018, 5, 1637–1647. [Google Scholar] [CrossRef]
  26. Rathi, S.; Nagpal, R.; Mehrotra, D.; Srivastava, G. A metric focused performance assessment of fog computing environments: A critical review. Comput. Electr. Eng. 2022, 103, 108350. [Google Scholar] [CrossRef]
  27. Iftikhar, S.; Gill, S.S.; Song, C.; Xu, M.; Aslanpour, M.S.; Toosi, A.N.; Du, J.; Wu, H.; Ghosh, S.; Chowdhury, D.; et al. AI-based fog and edge computing: A systematic review, taxonomy and future directions. Internet Things 2023, 21, 100674. [Google Scholar] [CrossRef]
  28. Mahmud, R.; Ramamohanarao, K.; Buyya, R. Edge affinity-based management of applications in fog computing environments. In Proceedings of the 12th IEEE/ACM International Conference on Utility and Cloud Computing, Auckland, New Zealand, 2–5 December 2019; pp. 61–70. [Google Scholar]
  29. Bhatia, M. Fog Computing-inspired Smart Home Framework for Predictive Veterinary Healthcare. Microprocess. Microsyst. 2020, 78, 103227. [Google Scholar] [CrossRef]
  30. Mahmud, R.; Ramamohanarao, K.; Buyya, R. Latency-Aware Application Module Management for Fog Computing Environments. ACM Trans. Internet Technol. 2018, 19, 1–21. [Google Scholar] [CrossRef]
  31. Lingo, R. Exploring the Potential of AI-Generated Synthetic Datasets: A Case Study on Telematics Data with ChatGPT. arXiv 2023, arXiv:2306.13700. [Google Scholar]
  32. Perera, C.; Estrella, J.C.; Vasilakos, A.V. Fog Computing for Sustainable Smart Cities: A Survey. ACM Comput. Surv. 2017, 50, 1–43. [Google Scholar] [CrossRef]
  33. Awaisi, K.S.; Abbas, A.; Zareei, M.; Khattak, H.A.; Khan, M.U.S.; Ali, M.; Din, I.U.; Shah, S. Towards a Fog Enabled Efficient Car Parking Architecture. IEEE Access 2019, 7, 159100–159111. [Google Scholar] [CrossRef]
  34. Gill, S.S.; Garraghan, P.; Buyya, R. ROUTER: Fog enabled cloud based intelligent resource management approach for smart home IoT devices. J. Syst. Softw. 2019, 154, 125–138. [Google Scholar] [CrossRef]
  35. Anupriya, S.R.; Muthumanikandan, V. A Survey on Exploring the Effectiveness of IOT Based Home Security Systems. In Proceedings of the International Conference on Computer Communication and Informatics (ICCCI), Coimbatore, India, 23–25 January 2023. [Google Scholar] [CrossRef]
  36. Khan, M.A.; Ahmad, I.; Nordin, A.N.; Ahmed, A.E.-S.; Mewada, H.; Daradkeh, Y.I.; Rasheed, S.; Eldin, E.T.; Shafiq, M. Smart Android Based Home Automation System Using Internet of Things (IoT). Sustainability 2022, 14, 10717. [Google Scholar] [CrossRef]
  37. Wu, Y.; Wu, Y.; Guerrero, J.M.; Vasquez, J.C. Decentralized transactive energy community in edge grid with positive buildings and interactive electric vehicles. Electr. Power Energy Syst. 2022, 135, 107510. [Google Scholar] [CrossRef]
  38. Li, Q.; Wang, X.; Wang, P.; Zhang, W.; Yin, J. FARDA: A fog-based anonymous reward data aggregation security scheme in smart buildings. Build. Environ. 2022, 225, 109578. [Google Scholar] [CrossRef]
  39. Krishnan, P.; Prabu, A.V.; Loganathan, S.; Routray, S.; Ghosh, U.; AL-Numay, M. Analyzing and Managing Various Energy-Related Environmental Factors for Providing Personalized IoT Services for Smart Buildings in Smart Environment. Sustainability 2023, 15, 6548. [Google Scholar] [CrossRef]
  40. Kazlauskas, M.; Navakauskas, D. Case Study of a Multisensor Patient Network and Microservices Managed by Fog Computing. In Proceedings of the 9th IEEE Workshop on Advances in Information, Electronic and Electrical Engineering, Riga, Latvia, 25–26 November 2021. [Google Scholar] [CrossRef]
  41. Gill, S.S.; Arya, R.C.; Wander, G.S.; Buyya, R. Fog-Based Smart Healthcare as a Big Data and Cloud Service for Heart Patients Using IoT. In Lecture Notes on Data Engineering and Communications Technologies; Springer Science and Business Media Deutschland GmbH: Frankfurt, Germany, 2019; Volume 26, pp. 1376–1383. [Google Scholar] [CrossRef]
  42. Gupta, H.; Dastjerdi, A.V.; Ghosh, S.K.; Buyya, R. iFogSim: A toolkit for modeling and simulation of resource management techniques in the Internet of Things, Edge and Fog computing environments. Softw. Pract. Exp. 2017, 47, 1275–1296. [Google Scholar] [CrossRef]
  43. Manzoor, A.; Judge, M.A.; Ahmed, F.; Islam, S.U.; Buyya, R. Towards simulating the constraint-based nature-inspired smart scheduling in energy intelligent buildings. Simul. Model. Pract. Theory 2022, 118, 102550. [Google Scholar] [CrossRef]
  44. HmIP-SCTH, CO2 Sensor, 230 V. 2022. Available online: www.homematic-ip.com (accessed on 24 October 2022).
  45. Cisco. Product Highlights • Fixed Lens, Mini-Dome Camera with a Compact form Factor • Three Models Designed to Meet a Variety of Needs • Intelligent Motion Indexing with Search Engine. 2022. Available online: https://meraki.cisco.com/lib/pdf/meraki_datasheet_mv12.pdf (accessed on 24 October 2022).
  46. ARM. Cortex-A7. Available online: https://developer.arm.com/Processors/Cortex-A7#Technical-Specifications (accessed on 12 October 2022).
  47. DeviceSpecifications. Sony SmartWatch 3—Specifications. Available online: https://www.devicespecifications.com/en/model/07092f83 (accessed on 12 October 2022).
  48. NXP. i.MX 7Dual Family of Applications Processors Datasheet; NXP: Hong Kong, China, 2016. [Google Scholar]
  49. Homematic. HmIP-CCU3. 2022. Available online: www.homematic-ip.com (accessed on 10 October 2022).
  50. Javed, A.; Shahid, M.A.; Sharif, M.; Yasmin, M. Energy Consumption in Mobile Phones. Int. J. Comput. Netw. Inf. Secur. 2017, 9, 18–28. [Google Scholar] [CrossRef]
  51. Tsai, C.H.; Bai, Y.W.; Chu, C.A.; Chung, C.Y.; Lin, M.B. PIR-sensor-based lighting device with ultra-low standby power consumption. In Proceedings of the IEEE International Instrumentation and Measurement Technology Conference, Hangzhou, China, 10–12 May 2011; pp. 1524–1529. [Google Scholar] [CrossRef]
  52. Tronix, S. Security Tronix ST-IP4VFD-MZ Camera Specification Sheet|Manualzz. Available online: https://manualzz.com/doc/53397987/security-tronix-st-ip4vfd-mz-camera-specification-sheet (accessed on 10 October 2022).
  53. Yan, A. Understanding IP Surveillance Camera Bandwidth. Fortinet. 2020. Available online: https://www.fortinet.com/content/dam/fortinet/assets/white-papers/wp-ip-surveillance-camera.pdf (accessed on 9 September 2022).
  54. Ashraf, M.; Shiraz, M.; Abbasi, A.; Alqahtani, O.; Badshah, G.; Lasisi, A. Microservice Application Scheduling in Multi-Tiered Fog-Computing-Enabled IoT. Sensors 2023, 23, 7142. [Google Scholar] [CrossRef]
  55. Rajagopal, S.M.; Supriya, M.; Buyya, R. FedSDM: Federated learning based smart decision making module for ECG data in IoT integrated Edge–Fog–Cloud computing environments. Internet Things 2023, 22, 100784. [Google Scholar] [CrossRef]
  56. Alatoun, K.; Matrouk, K.; Mohammed, M.A.; Nedoma, J.; Martinek, R.; Zmij, P. A Novel Low-Latency and Energy-Efficient Task Scheduling Framework for Internet of Medical Things in an Edge Fog Cloud System. Sensors 2022, 22, 5327. [Google Scholar] [CrossRef]
  57. Saad, M.; Qureshi, R.I.; Rehman, A.U. Task Scheduling in Fog Computing: Parameters, Simulators and Open Challenges. In Proceedings of the Global Conference on Wireless and Optical Technologies (GCWOT), Malaga, Spain, 24–27 January 2023. [Google Scholar] [CrossRef]
  58. Basir, R.; Qaisar, S.; Ali, M.; Aldwairi, M.; Ashraf, M.I.; Mahmood, A.; Gidlund, M. Fog Computing Enabling Industrial Internet of Things: State-of-the-Art and Research Challenges. Sensors 2019, 19, 4807. [Google Scholar] [CrossRef]
  59. Apat, H.K.; Nayak, R.; Sahoo, B. A comprehensive review on Internet of Things application placement in Fog computing environment. Internet Things 2023, 23, 100866. [Google Scholar] [CrossRef]
  60. Xu, H.; Yu, W.; Griffith, D.; Golmie, N. A Survey on Industrial Internet of Things: A Cyber-Physical Systems Perspective. IEEE Access 2018, 6, 78238–78259. [Google Scholar] [CrossRef]
Figure 1. Three-layer IoT architecture.
Applsci 14 00316 g001
Figure 2. Smart office building floor plan showing IoT devices and sensor placement.
Applsci 14 00316 g002
Figure 3. Results for the fixed scenario of smart office building devices: (a) Fog/Cloud energy consumption comparison; (b) Fog/Cloud latency comparison; (c) Fog/Cloud network bandwidth usage comparison.
Applsci 14 00316 g003
Figure 4. Cloud/Fog scenario energy consumption comparison.
Applsci 14 00316 g004
Figure 5. Cloud/Fog scenario latency comparison.
Applsci 14 00316 g005
Figure 6. Cloud/Fog scenario network bandwidth usage comparison.
Applsci 14 00316 g006
Table 2. Device configuration parameter values.
DevicesMIPSRAM (GB)Uplink (Mbps)Downlink (Mbps)
Cloud Data Centre100,00048100100,000
Proxy Server10,0001610010
Fog Node705081010
CCTV22006410100
CO2500813100
Light Sensor100413100
Table 3. Detailed network infrastructure and device configuration parameter values.
ParameterCloudRouter/Proxy ServerFog NodeCCTV CamerasCO2 SensorLight Sensors
Tier Level012333
CPU Speed (MIPS)100,00010,00070502200500100
Internal RAM (GB)481686484
Bandwidth Uplink (Mbps)10010010101313
Bandwidth Downlink (Mbps)100,0001010100100100
Busy Power (w)16*103107.339100.33912.951.69
Idle Power (w)16*83.2583.43380.433100.550.5
Table 4. Energy consumption (MJ) results for fixed smart office building device data management.
Number of DevicesEnergy ConsumptionFog Only (MJ)Cloud Only (MJ)Difference (%)
7CCTV27342702−1.19%
17CO2277127720.06%
22Light Sensor277027740.14%
Table 5. Latency (ms) results for fixed smart office building device data management.
Number of DevicesLatencyFog Only (ms)Cloud Only (ms)Difference (%)
7CCTV206.35702.9970.65%
17CO2110.91711.5784.41%
22Light Sensor115.47727.7284.13%
Table 6. Network bandwidth usage (Gbps) results for fixed smart office building device data management.
Number of DevicesNetwork Bandwidth UsageFog Only (Gbps)Cloud Only (Gbps)Difference (%)
7CCTV3.882.32−67.00%
17CO28.2613.5338.95%
22Light Sensor8.3513.4738.02%
Table 7. Energy consumption (MJ) results for device data management.
Number of DevicesCCTV FogCCTV CloudCCTV Difference (%)CO2 FogCO2 CloudCO2 Difference (%)Light FogLight CloudLight Difference (%)
2027802767−0.47%27972789−0.26%278127910.35%
40281128300.67%28792848−1.10%28622846−0.58%
60284928680.66%288828970.28%288728930.24%
80288629321.59%291129390.97%288629261.37%
100289329742.72%291529892.48%291329932.69%
120290230023.33%292330062.76%292630052.65%
140291730233.50%291830464.20%294130282.87%
160294330583.73%294930724.01%295230573.42%
180295130854.35%298230933.57%297130913.89%
200298731134.07%297530913.76%298630973.59%
Table 8. Latency (ms) results for device data management.
Number of DevicesCCTV FogCCTV CloudCCTV Difference (%)CO2 FogCO2 CloudCO2 Difference (%)Light FogLight CloudLight Difference (%)
20217.93750.5870.97%102.42672.7684.78%100.78684.7485.28%
40220.86776.0471.54%84.59731.4288.44%95.38740.2387.11%
60196.79825.0476.15%79.16819.5890.34%80.52806.0290.01%
80189.99865.5778.05%76.44842.9690.93%73.12848.2391.38%
100177.68903.0080.32%81.17869.0190.66%78.99857.1690.78%
120169.57905.2781.27%81.89885.8190.76%81.26895.8990.93%
140171.42911.6281.20%90.01912.8790.14%91.19904.8589.92%
160165.15923.4882.12%94.32915.0889.69%93.95907.8889.65%
180163.93945.8682.67%101.45906.3288.81%103.48918.5988.74%
200169.97949.4182.10%118.47922.1687.15%117.38926.4287.33%
Table 9. Network bandwidth usage (Gbps) results for light sensor data management.
Number of DevicesCCTV FogCCTV CloudCCTV Difference (%)CO2 FogCO2 CloudCO2 Difference (%)Light FogLight CloudLight Difference (%)
208.7412.6731.03%9.6315.0535.97%9.6414.7834.78%
4019.4126.2326.00%18.5927.9033.37%18.9028.6033.92%
6030.7839.7722.61%27.5241.6033.85%27.8341.6233.14%
8041.6153.1221.67%37.1954.5731.85%36.9054.5232.31%
10050.8465.7922.73%45.5566.6131.62%45.9866.8531.21%
12059.2876.8922.90%53.7278.8031.82%53.7278.7531.79%
14066.5386.5723.16%60.1387.6031.36%59.8189.0732.85%
16072.3795.9524.57%66.0596.5431.59%66.2096.8731.67%
18078.91103.8924.04%71.39103.9131.30%71.52105.1732.00%
20084.48110.7523.72%76.73111.2731.04%76.18110.7631.22%
Disclaimer/Publisher’s Note: The statements, opinions and data contained in all publications are solely those of the individual author(s) and contributor(s) and not of MDPI and/or the editor(s). MDPI and/or the editor(s) disclaim responsibility for any injury to people or property resulting from any ideas, methods, instructions or products referred to in the content.

