Article

Driving Behavior Risk Measurement and Cluster Analysis Driven by Vehicle Trajectory Data

1
School of Mechanical and Electrical Engineering, Guangzhou University, Guangzhou 510006, China
2
School of Civil Engineering, Guangzhou University, Guangzhou 510006, China
3
Guangdong Communication Planning & Design Institute Group Co., Ltd., Guangzhou 510507, China
*
Author to whom correspondence should be addressed.
Appl. Sci. 2023, 13(9), 5675; https://doi.org/10.3390/app13095675
Submission received: 15 March 2023 / Revised: 1 May 2023 / Accepted: 2 May 2023 / Published: 5 May 2023
(This article belongs to the Special Issue Transportation Big Data and Its Applications)

Abstract

:
The correct identification and timely pre-warning of driving behavior risks can remind drivers to correct their unsafe driving behaviors effectively. First of all, four risk evaluation indicators of driving behavior were defined based on lateral and longitudinal driving characteristics: the lateral stability indicator, the longitudinal stability indicator, the car-following risk indicator, and the lane-changing risk indicator. The Pearson correlation coefficient method was used to analyze the correlation of the four indicators, and the conclusion showed that the four indicators were very weakly correlated or presented an irrelevant correlation. Thus, the four indicators can describe different driving behavior risks. Secondly, the criteria importance through intercriteria correlation (CRITIC) method was used to determine the weight of each indicator, and a comprehensive measurement model of driving behavior risk was established. To test the model, this study preprocessed the trajectory data of small vehicles in Lanes 1–5 of the I-80 Expressway from the NGSIM dataset, collected statistical analysis results of vehicle speed and acceleration, and obtained the parameters data required for risk assessment. Then, based on the obtained trajectory data, the variation laws and the thresholds of the four indicators were determined by using the interquartile difference method. Finally, by using the K-means clustering algorithm, the risk types of driving behavior were divided into four categories, namely, dangerous, aggressive, safe, and conservative. The dangerous, aggressive, safe, and conservative driving behaviors accounted for 5.40%, 23.30%, 43.22%, and 28.08% of the total samples, respectively. The expert’s assessment results of the driving behavior risk aligned with the results obtained from the model measurements. This indicated that the driving behavior risk measurement model here described can evaluate a driver’s risk status in real time, provide safety tips for the driver, and offer theoretical support for driving safety warning systems.

1. Introduction

With the continuous development of urbanization, the number of vehicles has increased gradually, and the traffic safety situation is still grim. Several studies showed that an abnormal driving behavior of drivers is the main factor that causes traffic accidents [1,2]. Therefore, the correct identification and timely pre-warning of abnormal driving behaviors can effectively remind drivers to correct their driving behavior, which is of great significance for reducing road traffic accidents. By analyzing traffic accident data in the CIDAS database, Hu et al. [3] concluded that drivers with dangerous driving behaviors were closely related to accidents and constructed an evaluation system to describe this relationship. Guo et al. [4] established a traffic collision risk prediction model for highways after analyzing the relationship of between dangerous driving behaviors and traffic accidents. Ucar et al. [5] established an abnormal driving behavior management system and adopted mitigation strategies to improve the safety of all test vehicles by about 10 times based on the actual traffic data in Virginia.
As a measure of a driver’s various operational performances during driving, driving behavior is affected by many aspects. Singh et al. [6] reviewed natural driving research and data collecting methods, discussed various factors that influence the driving behavior, and found that the driving behavior was the main cause of most road accidents. Song et al. [7] used the SHRP2 large-scale questionnaire to study the relationship between demographic characteristics, sensation seeking, risk perception, and dangerous driving behavior, finding that lower levels of sensation seeking and higher levels of risk perception can serve to inhibit dangerous driving behaviors. Linkov et al. [8] studied the relation of personality variables and driving behavior safety and concluded that the driver’s personality with a high sense of seeking and a low sense of responsibility is closely related to a higher mean speed and a higher risk behavior during driving.
Currently, there are three methods for studying the driving behavior: questionnaire surveys, driving simulations, and algorithmic models. Among them, questionnaire surveys require a large amount of manpower, and the cost of driving simulations is high. It is most suitable to use an algorithm model for the evaluation of the driving behavior. Chandra et al. [9] used the centrality function C-Measurement to classify drivers’ behavior; they proposed a formula to quantify the driving behavior and divided it into four categories by combining the graph theory and social psychology. Wang et al. [10] proposed a new pattern recognition algorithm for unsupervised driving behavior data to discover the common driving behavior patterns for each cluster. Van et al. [11] collected data for different driving behaviors through a driving simulator, including maximum speed, lateral position, and distance from the preceding car, and compared the objective data retrieved by the driving simulator with the resulting scores of a questionnaire. The results showed that people may have a different understanding of the safety level of driving behaviors. The measurement of driving behavior risks is also a popular research field. However, the majority of data utilized in driving behavior risk measurement is derived from videos and simulation experiments. The length of road sections captured by video is limited, and simulation experiments struggle to provide accurate driving behavior trajectory data. In recent years, with the acquisition of a vast quantity of natural driving trajectory data, it has become possible to conduct in-depth research on vehicle driving behavior. Jiang et al. [12] proposed a new improved traffic conflict indicator, based on trajectory data collected using unmanned aerial vehicles (UAVs), that builds upon the strengths of conventional indicators and addresses their limitations. These indicators require the definitions and calculations for three types of traffic conflicts (rear-end, lane change, and with fixed objects) that accurately reflect real traffic risks. Park et al. [13] designed accurate algorithms to extract vehicle trajectory data from video data collected by UAVs and then proposed a lane-changing risk factor. This risk factor can provide a safety evaluation for the target vehicle and adjacent vehicles during lane change. Yang et al. [14] proposed a real-time driving behavior safety level classification and evaluation framework based on driving behavior data and divided the driving behavior into normal driving, low-risk driving, and high-risk driving by using the k-means clustering method, the hierarchical clustering method, and the model-based clustering method, respectively. Based on the analysis of a large number of trajectory data, Matousek et al. [15] proposed an abnormal driving pattern detection method based on outlier detection to detect the driving behavior of drivers. This method does not require specific data for normal driving behaviors and various abnormal driving behaviors and is very reliable in detecting abnormal vehicle-driving behaviors. In terms of risk measurement for driving behavior, the extant research primarily concentrates on evaluating traffic conflicts and predicting the likelihood of traffic collisions, while lacking a comprehensive risk assessment of various driving operations performed by drivers. Concurrently, the existing research on driver classification focuses on considering a driver’s overall driving style and lacks an evaluation of the driver’s driving behavior risk at each moment.
Furthermore, research on driving behavior could be applied in many frontier research fields, such as autonomous driving and ecological driving, in the future. Collin [16] used the autonomous driving rule manual to analyze the safety of driving behavior, formulated the driving behavior of driverless vehicles through the precise definition of rules, and made good use of trajectory violation indicators to help identify specific unsafe scenes. Xiang et al. [17] proposed a hybrid model composed of the cloud model and the Elman neural network to predict dangerous driving behaviors based on vehicle motion state estimation and passenger subjective evaluation, which could provide a practical solution for safe driving. Based on research into the rules governing the association between driving behavior and accident risk, the individual driving behavior can be quantitatively evaluated and utilized as an index for assessing the accident risk. The research findings related to the driving behavior can be applied to driver training, enhancing driving safety, developing driver behavior recommendation systems, or formulating personalized insurance for vehicles, and hold significant value.
In summary, the extant research on driving behavior risk measurement is not comprehensive and lacks a well-suited model for the real-time evaluation of driving behavior risks. The primary contributions of this study are as follows: (a) we utilized the NGSIM vehicle trajectory dataset as the data source for our research and employed a more accurate method to extract the required trajectory data; (b) we comprehensively measured the driving behavior risk from three perspectives: driving, car-following, and lane-changing. The parameters used in the established index model are easily collectible; (c) we constructed a risk measurement model for driving behavior and clustered the driving behavior risk into four categories. This model can assess the risk status at each moment during the driving process of a vehicle in real-time. The research results can be used for monitoring and warning against hazardous driving behaviors, driver training, and the creation of driver behavior recommendation systems.
This paper is organized as follows: Section 2 introduces the driving behavior risk indicators established in this study and the methods used; Section 3 conducts a case analysis through the NGSIM data set, establishes a driving behavior risk measurement model, divides the driving behavior risk categories through cluster analysis, and at the same time, tests the driving behavior risk measurement model; Section 4 provides a summary of this work.

2. Methods

2.1. Driving Behavior Risk Measurement

During the driving process, the driving behavior mainly includes lane-keeping, car-following, and lane-changing behaviors [18,19]. Thus, this study defined four quantitative indicators for three aspects (driving stability, car-following, and lane-changing safety), and analyzed their correlation by using the Pearson correlation coefficient. Then, the threshold of each indicator was calculated by using the interquartile difference method.

2.1.1. Risk Measurement Indicators

  • Driving stability indicator
  • The driving stability indicator includes lateral stability and longitudinal stability.
    (a)
    Lateral stability indicator. The magnitude of lateral displacement serves as an intuitive measure of a vehicle’s lateral deviation and can be readily computed using the lateral coordinates in the trajectory data. The lateral stability of vehicles during driving is evaluated by describing the coefficient of variation [20,21] of the lateral displacement offset. To calculate the lateral stability indicator of the vehicle in frame t, this study selected the data changes of the first 40 frames for description. The formula is shown in Equations (1) and (2).
            D x t = X t X t 1
    R 1 t = s t d D x t 40 , , D x t m e a n D x t 40 , , D x t
    where X t is the lateral coordinate of the target vehicle at frame t, D x t is the lateral offset of the target vehicle in the period [t − 1, t], s t d is the standard deviation, and mean is the mean. The ratio of s t d to the mean is the coefficient of variation. The larger the coefficient of variation is, the greater the dispersion of lateral displacement will be. It also shows that the higher the probability of the vehicle serpentine driving is, the worse the driving stability will be.
    (b)
    Longitudinal stability indicator. Variations in a vehicle’s velocity during operation can result in trajectory oscillations [22], with acceleration serving as a metric for quantifying such fluctuations. Longitudinal stability is mainly described by the difference between real-time acceleration and average acceleration of a vehicle in the period T. The formula is shown in Equation (3).
R 2 t = i = t T a i a ¯ T
where a i represents the acceleration of the target vehicle at frame i, and a ¯ represents the average acceleration of the target vehicle in the period T. The value of T in this study was 40 frames, which was measured by the driving stability of the vehicle in the first 40 frames of the frame t. The greater the value of R 2 is, the greater the possibility of driving speed instability, and the worse the longitudinal stability during driving.
2.
Car-following risk indicator
Time to collision (TTC) is a widely employed metric in the assessment of vehicular risk [23,24]. In this study, we utilized the inverse of TTC (ITTC) as an indicator of the car-following risk. The larger the car-following risk indicator is, the smaller the value of the TTC, and the higher the risk during car following will be. The formula is shown in Equation (4).
R 3 t = V F t V P t Y P t Y F t L P t
where Y F t and V F t are the longitudinal coordinates and speed of the following vehicle, respectively, and Y P t , V P t , L P t are the longitudinal coordinates, speed, and length of the vehicle being followed, respectively.
3.
Lane-changing risk indicator
The Difference between Space distance and Stopping distance ( D S S ) is a prevalent distance-based risk metric employed primarily in the computation of safe distances for collision avoidance [25]. First of all, this study calculated the DSS value between the target vehicle and three adjacent vehicles during lane changing. The formula is shown in Equation (5).
D S S t = V p 2 t V F 2 t 2 u g + Y P t Y F t L P t τ V F   t
where D S S t is the difference between the space and the stopping distance between the following and the followed vehicles, u is the fractional rate, g is the acceleration of gravity, and τ is the reaction time, with its value being 1.5 s when the rear vehicle accelerates and 0.7 s when the rear vehicle decelerates or drives at a constant speed. When DSS > 0, the space distance between the front and the rear vehicles is greater than the stopping distance, and no risk of collision between them is observed. When DSS < 0, the space distance is not enough for the rear vehicle to stop during an emergency, and there is a risk of collision between them.
The ratio of the absolute value of DSS to the speed of the rear vehicle can reflect the missing reaction time required by the driver [26]. The formula is shown in Equation (6).
T t = 0                                                           ,     D S S t > 0 D S S t V F t                                       ,     D S S t < 0
where T is the missing reaction time required by the driver to avoid a collision, and V F t represents the longitudinal speed of the following vehicle.
Finally, this study considered the maximum values of three missing reaction times for describing the risk of lane changing. The three missing reaction times are related to the target vehicle and the front vehicle in the same lane, the target vehicle and the front vehicle in the target lane, and the target vehicle and the rear vehicle in the target lane. The greater the value of this indicator is, the longer the missing reaction time. It means that the safety of lane changing is worse. The formula is shown in Equation (7).
R 4 t = m a x T o p t , T c p t , T c f t
where T o p t , T c p t , T c f t represent the missing reaction time between the target vehicle and the front vehicle before and after the lane change.

2.1.2. Indicators Correlation Analysis

Risk measurement indicators are used to describe the risk status of driving behavior during driving. The Pearson correlation coefficient is a statistical parameter used to reflect the degree of linear correlation between two variables [27,28,29]. To test the degree of correlation between each indicator, this study used the Pearson correlation coefficient. The correlation coefficient is represented by r, and its value is between −1 and 1. When r > 0, two risk metrics of driving behavior are positively correlated. When r < 0, two metrics are negatively correlated. This study used the absolute value of r to define the correlation. The larger the absolute value of r, the stronger the correlation. The correlation between two risk metrics of driving behavior is strong when |r| ≥ 0.7, moderate when 0.4 ≤ |r| < 0.7, weak when 0.2 ≤ |r| < 0.4, and extreme weak or irrelevant when |r| < 0.2. The formula is shown in Equation (8) [30,31].
r = i = 1 n X i X ¯ Y i Y ¯ i = 1 n X i X ¯ 2 · i = 1 n Y i Y ¯ 2
where n is the sample of vehicle trajectory data, X i , Y i are the observed values of any two risk metrics of driving behavior, and X ¯ , Y ¯ are the mean values of the corresponding risk metrics of driving behavior.

2.1.3. Indicators Threshold Analysis

This analysis shows that the driving behavior is dangerous when a certain indicator exceeds the risk threshold during driving. The interquartile difference method was used to solve the risk threshold of each indicator in this study.
The variation of lateral stability and longitudinal stability was selected to evaluate the driving stability. For these two indicators, the smaller the lateral displacement variation and the longitudinal speed variation, the smaller the driving stability indicator, thus the more conservative the driving behavior. Conversely, the higher the driving stability indicator, the more aggressive the driving behavior, and the higher the possibility of a dangerous driving behavior. Therefore, the upper boundary was used as the threshold of the driving stability indicator.
The inverse of TTC was used to describe the car-following risk and as an evaluating indicator. The smaller the value of TTC, the greater the car-following risk. Thus, the upper boundary was used as the threshold of the car-following risk indicator in this study.
The lane-changing risk indicator was used to describe the danger level for a vehicle during lane changing. Therefore, the larger the lane-changing risk indicator is, the higher the possibility of accidents in the process of changing lane. Thus, the upper boundary served as the threshold for the lane-changing risk indicator.
The interquartile difference method can be used to detect outliers far from the data center [32]. For driving behavior risk metrics, a driving behavior with a score that is lower than the threshold is more conservative. Abnormal values above the threshold represent high values of the driving behavior risk metric, which correspond to dangerous driving behaviors. For example, the driving behaviors characterized by lateral stability exceeding the threshold often present serpentine driving (dangerous driving situations) [33]. The threshold [34] of the i-th driving behavior indicator can be calculated according to Equation (9)
T h r e s h o l d = Q 3 + 1.5 × I Q R
where Q 3 is the upper quartile of the driving behavior risk metrics, and IQR is the interquartile difference, that is, the difference between the upper quartile and the lower quartile. Each driving behavior risk measurement indicator is calculated separately to judge the possible abnormal value of the corresponding indicator.

2.2. Cluster Analysis Method of Driving Behavior

2.2.1. Risk Indicators Weighting Analysis

The correlation analysis of the four indicators showed that there was no significant correlation between them. Therefore, the weight values of each indicator were calculated using the CRITIC weighting method, and a comprehensive measurement model for driver driving behavior risk was established. The risk measurement result of driving behavior from the measurement model was obtained from a comprehensive evaluation of various driving behaviors of a driver, simultaneously. In the preceding paragraph, the upper boundary of each evaluation indicator was used as the risk threshold, which also represents dangerous driving behaviors. Thus, the result of the measurement model is also inversely proportional to safety.
The driving behavior risk measurement model also represents the transition from conservative to dangerous behaviors as the value of the indicator increases. Before the driving behavior risk indicator is weighted, each indicator must be normalized to avoid the influence of the unit dimension among different driving behavior risk indicators. The min–max standardization method selected in this study could eliminate the differences among the indicators [35]. The formula is shown in Equation (10)
R i = R i R i - m i n R i - m a x R i - m i n
where R i is the normalized value of the i-th driving behavior risk metrics. R i is the initial value of the i-th driving behavior risk metric sample, and R i - m i n and R i - m a x are the minimum and the maximum sample values of the i-th driving behavior risk metrics, respectively.
The CRITIC weighting method is an objective weighting method that measures the indicators comprehensively based on the contrast strength and the conflict between the indicators [36]. Thus, the normalized data were weighted by using the CRITIC weighting method in this study. The objective weight [37] of each indicator is expressed by Equation (11)
W j = C j j = 1 P C j
where W j and C j are the weight and the information amount of the j-th driving behavior risk metrics, respectively. The formula [38] is shown in Equation (12)
C j = S j × R j = S j i = 1 n 1 r i j
where S j is the standard deviation of the j-th driving behavior risk metrics, that is, the variability of indicator. The larger the value of S j is, the greater the dispersion of the indicator will be, and the more the information it can reflect. Thus, the indicator has greater evaluation strength, and its weight value should be bigger. R j stands for the conflicting indicator of the j-th driving behavior risk metrics, and r i j represents the correlation between the indicators i and j. The stronger the correlation, the less the conflict between this and other indicators, and the more repetitive the evaluation content reflected. The weight distribution value of this indicator will be smaller. The value of r i j can be obtained through the pairwise correlation analysis of the driving behavior risk metrics reported in a previous article.

2.2.2. Risk Measurement Results Clustering Algorithm

The k-means clustering algorithm, also known as k-means algorithm, treats data as points in K-dimensional space and performs clustering analysis based on the distance. The variable K represents the clustering into K clusters, and means represents taking the mean of the data in each cluster as the center of the cluster. In the assessment of the driving behavior, K-means clustering exhibits exceptional applicability and convenience [14].
Based on the K-means clustering algorithm, this study defined four cluster centers, namely, dangerous, aggressive, safe, and conservative behaviors. The conservative type of behavior means that the driving behavior is too conservative during driving. This behavior has a high degree of safety but is not conducive to improving the actual traffic capacity of a road. The safe type of behavior means that the driving behavior is in an ideal state and ensures driving safety, which is most conducive to the improvement of the actual traffic capacity of a road. The aggressive type of behavior means that the driver has some aggressive driving behaviors, such as frequent acceleration and deceleration during driving, which are dangerous. The dangerous type of behavior means that the driver adopts extremely dangerous driving behaviors, such as sudden braking and frequent overtaking, which are extremely dangerous.
The 301,111 driving behavior risk measurement results from the trajectory data of 600 vehicles were clustered in the four cluster centers: dangerous, aggressive, safe, and conservative. The initial cluster center points of the four types of data from large to small were taken as the initial cluster center points from the 301,111 trajectory data, and the distance among the four cluster centers and the risk measurement results of each driving behavior were determined. According to the principle of the smallest distance, each driving behavior risk measurement result was assigned to the four clusters: dangerous, aggressive, safe, and conservative. Then, the calculation of the new cluster center point was performed, and iteration was repeated until convergence [39].
The distance between the driving behavior risk measurement results and the four cluster centers adopts the Euclidean distance [40,41]. The formula is shown in Equation (13).
d i s X i , C j = t = 1 m X i t C j t 2
where X i represents the risk measurement of the i-th driving behavior 1 ≤ in, C j represents the risk measurement cluster center of the j-th driving behavior 1 ≤ jk, X i t represents the i-th driving behavior’s risk measurement of the t-th trajectory data, 1 ≤ tm, and C j t represents the j-th driving behavior’s risk measurement cluster center of the t-th trajectory data.
The calculation of the cluster center [42] of the trajectory data of each driving behavior risk measurement cluster is presented in Equation (14).
C t = X i S l X i S l
where C l represents the center of the l-th driving behavior risk measurement cluster, 1 ≤ l ≤ k, S l represents the number of objects in the l-th driving behavior risk measurement cluster, and X i represents the i-th object of the l-th driving behavior risk measurement cluster, 1 ≤ i S l .

3. Case Analysis and Discussion

3.1. Data Sources

In this study, the vehicle trajectory dataset from the I-80 road section in the NGSIM dataset was selected. The detected road section is located on Interstate 80 in Emeryville, as shown in Figure 1.
The detection area comprises eight lanes, of which lane 1 is the high-occupancy vehicle lane, lane 6 is the distribution lane, lane 7 is the entry ramp, lane 8 is the exit ramp, and lanes 1–6 are unidirectional lanes with a length of about 503 m. The driving direction is from south to north, the average flow rate is 7124 veh/h, and the average speed is 8.32 m/s. This study selected the data from the congestion period, which contains a large number of trajectory data of car-following and lane-changing behavior and well meets the data requirements.

3.2. Data Preprocessing

3.2.1. Data Extraction

The NGSIM dataset contains a large amount of trajectory data. The parameters available are detection frame number, vehicle identification number, vehicle length, and the coordinate data of vehicles’ front center. The list of raw data used in this study is shown in Table 1.

3.2.2. Trajectory Data Preprocessing

According to existing research literature, there are some outliers and measurement errors in the NGSIM trajectory data, which have a great negative impact on the calibration and verification of the models. Furthermore, the vehicles’ speed and acceleration in NGSIM are obtained from first-order and second-order derivatives of longitudinal displacement, respectively. The error of speed and acceleration will be magnified 10 times and 100 times if the longitudinal displacement contains errors. Therefore, it was necessary to smooth the NGSIM data.
Many existing methods can be used for processing the NGSIM data, but most of them directly smooth the speed and acceleration obtained from the derivation of the longitudinal trajectory of vehicles, which will lead to overprocessing and affect the actual accuracy of trajectory to a certain extent. To meet the research needs of this study, some processing on the dataset was first carried out. The specific treatment scheme was as follows:
  • Convert the imperial units in the dataset into international standard units, exclude the data of trucks and motorcycles, and only keep the data of small cars in the I-80 highway as the research object.
  • Handling abnormal data in NGSIM dataset. The data marked with the same vehicle ID under different vehicle trajectories are relabeled, and then abnormal vehicles with mismatched framerates are eliminated due to lane-changing behavior. Abnormal data in the data collection, such as negative vehicle spacing, are also eliminated.
  • Renumber the vehicle ID of the sample data and recalculate the speed, acceleration, and following distance of each vehicle in each frame according to “Local_X” and “Local_Y” in the dataset. The formula is shown in Equations (15)–(19).
V x i t = X i t + n X i t 0.1 n
V y i t = Y i t + n Y i t 0.1 n
A x i t = V x i t + n V x i t 0.1 n
A y i t = V y i t + n V y i t 0.1 n
D i t = Y j t Y i t L j t
where V x i t and V y i t represent the lateral and the longitudinal speed of vehicle i at frame t, respectively, X i t and Y i t represent the lateral and the longitudinal coordinates of vehicle i at frame t, respectively, A x i t and A y i t represent the lateral and the longitudinal acceleration of vehicle i at frame t, respectively, n represents the difference between the frames, D i t represents the car-following distance, Y j t and L j t represent the longitudinal coordinate and the length of the vehicle j being followed, and Y i t represents the longitudinal coordinate of the following vehicle i.
4.
This study did not consider the collector–distributor lanes and the entrance and exit ramps. Thus, only lanes 1–5 were reserved as the research object. The front and rear vehicle information of vehicle i is searched through data matching, and only the vehicle i with continuous frames that can match the front and rear vehicle information is reserved as the research object of the car-following risk measurement.
5.
For the lane-changing behavior, this study only chose vehicles with single lane-changing behavior as the research objects of the lane-changing risk measurement.
6.
The Z-standardized scoring method was used to judge abnormalities of the screened data and remove the noise in the dataset. The Z-standardized scoring formula [43] is expressed by Equation (20).
Z = y μ σ
where y represents the observed value, and μ and σ represent the mean value and the standard deviation of the observed value, respectively.

3.2.3. Data-Preprocessing Results

  • Velocity mean and standard deviation
The average and standard deviation of the speed can reflect the quality of a driver’s driving behavior during driving. The higher the average speed of the vehicle is, the greater the possibility of overspeed during driving will be. A large standard deviation of speed indicates that the speed varies greatly. Through the analysis of the data in the dataset, the mean and standard deviation of the vehicle speed were obtained (as shown in Figure 2).
Figure 2 shows the mean and standard deviation of the vehicles’ speed according to the sample data. The variation range of the average vehicle speed was 4–14 m/s, and that of the standard deviation was 1–3. Data analysis showed that vehicles with a higher mean speed also had higher standard deviations, which also suggests a poorer driver behavior.
2.
Acceleration mean and standard deviation
The acceleration can reflect the amplitude of the driving speed adjustment during driving, further reflecting the driving stability of vehicles. Therefore, an overall analysis was conducted on the acceleration data in the dataset in this study, selecting the mean and standard deviation of the acceleration for analysis, as shown in Figure 3.
Figure 3 shows that the values of acceleration averages were mainly within the range of (−0.5, 0.5). Excessive acceleration means that the vehicle accelerates or decelerates rapidly. In the sample data with vehicle ID greater than 400, the standard deviation of acceleration largely fluctuated, and the possibility of speed instability was high.

3.3. Calculation and Correlation Analysis

3.3.1. Results of the Driving Behavior Risk Measurements

Based on the obtained vehicle trajectory data, the risk assessment results of each driving behavior could be obtained by using four risk measurement index calculation formulas. The results of the driving behavior risk metrics are shown in Figure 4.
Figure 4 shows the distribution of the evaluation results of the four driving behavior risk indicators. As shown in Figure 4, the values of each indicator are concentrated in the lower numerical range, and only a small part of the data are concentrated in the larger numerical range. The upper boundary of each indicator was considered as the risk threshold, which means that the risk of driving behavior was greater at the distribution points in the area with larger values.
The change in lateral displacement is closely related to the lateral driving stability of a vehicle during driving, and the change in the longitudinal speed of a vehicle can reflect speed stability. A lower value of the indicator R 1 indicates that the lateral driving stability of a vehicle is better, and a lower value of the indicator R 2 indicates that the longitudinal driving stability of a vehicle is better. For the evaluation of the indicator R 3 for the car-following risk, a larger value indicates that the car-following risk is greater, and the possibility of collision is greater. The value of the lane-changing risk indicator R 4 is relatively small in Figure 4, and the number of sample data with a low value was far greater than that with a high value. A larger value of the indictor R 4 indicates a higher risk for the vehicle during lane changing.

3.3.2. Correlation Analysis Results

Table 2 shows the results of a pairwise comparison of the four indicators (the lateral stability indicator, the longitudinal stability indicator, the car-following risk indicator, and the lane-changing risk indicator).
Table 2 shows that the correlation coefficient between R 1 and R 2 was 0.160, thereby showing a very weak positive correlation for the two indicators. For other indicators, the correlation coefficient was lower (e.g., it was 0.072 between R 3 and R 4 ). Thus, the four driving behavior evaluation indicators were very weakly correlated or showed an irrelevant correlation, and the risk measurement of the driving behavior could be calculated by weighting.

3.4. Driving Behavior Risk Measurement Model

3.4.1. Coefficient Normalization Results

For the convenience of data processing, a normalization processing of the indicators’ values was conducted, which did not affect the distribution of the data. The normalization results for each indicator are shown in Figure 5.
Figure 5 shows the normalized distribution of each indicator after normalization, and the density position of each indicator data aggregation varied. The values of R 1 , R 2 , and R 3 were mainly distributed in the range of 0–0.6, and the density peak points were concentrated between 0.1 and 0.2. The values of R 4 were mainly distributed in the interval [0.0, 0.2]. The data of each indicator showed a trend of normal distribution. Considering the ends of the normal distribution, the left end represents more conservative driving behaviors, whereas the right end represents more dangerous driving behaviors. A higher value of the risk metrics represents a greater risk of driving behavior. The values of the four risk metrics in the interval [0.6, 1.0] of the normal distribution were lower. The reason is that in the driving behavior dataset in this study, the data for dangerous driving behaviors were relatively few. For example, the total number of R 1 was 301,111, the number of R 1 < 0.4 was 289,739, whereas the data for other intervals (corresponding to aggressive and dangerous driving behaviors) only accounted for 3.8% of all data.

3.4.2. Weight Calculation Results

According to the above formula, the weights of various indicators (e.g., the driving stability indicator, the car-following risk indicator, and the lane-changing risk indicator) were calculated, and the results are shown in Table 3.
The driving behavior risk measurement of each vehicle in frame i was calculated according to the weight in Table 3. M O R refers to the comprehensive risk evaluation results of all driving behaviors for each vehicle in frame i. The calculation formula and distribution of M O R are presented in Equation (21)
M O R = 0.397 R 1 + 0.310 R 2 + 0.082 R 3 + 0.210 R 4
where R 1 and R 2 represent the indicators of the lateral and longitudinal stability, respectively, both of which determine the driving stability indicator, and R 3 and R 4 are the indicators of car-following and lane-changing risk, respectively. Based on the dataset, the frequency distribution of the driving behavior risk measurements was obtained, as shown in Figure 6.
Figure 6 shows that the overall data presented a normal distribution, the risk measurement for most drivers’ driving behavior was between 0.1 and 0.3, and the remaining samples showed a lower frequency. For the MOR data, the lower their value, the more conservative a driver’s driving behavior. Conversely, the higher their value, the more aggressive a driver’s driving behavior.

3.5. Driving Behavior Risk Measurements’ Threshold Results

Through the comparison of the threshold results of the driving behavior risk metrics, the division degree of the sample data of the indicator by the interquartile difference method was analyzed (Table 4).
Table 4 shows that the interquartile difference method could extract the respective thresholds according to different data to judge the distribution of abnormal data better. The proportion of dangerous driving behaviors that corresponded to different indicators varied. The boxplot of the interquartile difference method is shown in Figure 7.
Figure 7 illustrates that the values of each indicator basically conformed to the normal distribution, and most of the data were within the interquartile difference range. Only a small part was outside the boundary range, which represented the dangerous driving behavior. For example, for R 1 , the threshold of the interquartile difference was 2.560, which means that the data outside the upper boundary of 2.560 were abnormal data, that is, the vehicle appeared to perform serpentine driving, which accounted for 3.35% of the total data.

3.6. Cluster Results of the Driving Behavior Risk Evaluation

The K-means clustering algorithm was selected to cluster the result of driving behavior risk measurement in this study. First, the risk measurement model was used to measure the driving behavior risk extracted from the trajectory data of 600 vehicles in the NGSIM dataset, and the MOR value of each driving behavior in each frame was obtained. The MOR value at each moment was used to evaluate the driver’s driving behavior at that time. The initial cluster centers were sorted based on the magnitude of the assessed risk, and the driving behavior risk measurement results were correspondingly divided into four categories, namely, dangerous, aggressive, safe, and conservative.
The clustering results of the K-means clustering algorithm are shown in Table 5 and Table 6.
As can be seen in Table 5 and Table 6, the K-means clustering algorithm was used to iteratively classify the driving behavior risk measurement model and finally determine the four types for the driving behavior risk measurement. The range of [0, 0.10) for the MOR value represents a conservative driving behavior, accounting for 28.08% of the total sample. The range of [0.10, 0.16) for the MOR value represents a safe driving behavior, accounting for 43.22% of the total sample. The range of [0.16, 0.23) for the MOR value represents an aggressive driving behavior, accounting for 23.30% of the total sample. The range of [0.23, 0.47] of the MOR value represents a dangerous driving behavior, accounting for 5.40% of the total sample. The clustering results showed that most of driving behavior was safe and conservative. The proportion of aggressive driving behavior was small, and that of dangerous driving behavior was even less. It showed relatively few dangerous driving behaviors in a normal driving environment. The clustering results of the driving behavior risk measurement are shown in Figure 8.
Figure 8 shows the cluster results of the risk measurement for four types of driving behaviors. The range of the MOR value is [0, 0.47], which includes four evaluation results: dangerous, aggressive, safe, and conservative. Among them, the dangerous type was characterized by the largest range, but the sample size was small, only accounting for 5.40% of the entire sample. This showed that the driving behavior risk measurement model will sensitively judge a behavior as dangerous when the vehicle shows a dangerous driving behavior. According to the clustering results of the driving behavior risk measurement, the driving behavior of each driver at different times during driving can be analyzed, that is, the same driver may have different driving behaviors under various conditions, as shown in Figure 9.
In Figure 9, it can be seen that the considered driver showed four driving behaviors during driving, the safe driving behavior accounted for the largest proportion, and the dangerous driving behavior only appeared around the 220th frame. The four driving behavior clusters obtained by the K-means clustering algorithm can thus reflect the security types of driving behavior in real time during driving accurately.

3.7. Cluster Results Verification

In the previous section, the threshold result for each risk indicator was determined, which was then used to test the final clustering results. The worse the risk measurement of driving behavior is, the higher the percentage of the risk indicators for drivers’ various driving behaviors exceeding the threshold should be. The integration results of the data are shown in Table 7 and Table 8.
Table 7 and Table 8 show that the average value of each coefficient is higher when the risk measurement result of the driving behavior is worse. For example, the average value of the lateral displacement change indicator for the dangerous type was 2.526, whereas that for the conservative type was only 0.540. The maximum value of the longitudinal stability indicator for the dangerous type was 6.053, whereas that for the conservative type was only 1.752. At the same time, for the dangerous and the aggressive driving behaviors, the percentage of each coefficient exceeding the threshold was much higher than that for the safe type and the conservative type. The coefficients for the dangerous type and radical type were also different, which showed that the safety of a dangerous driving behavior is poorer than that of an aggressive driving behavior. For the safe and conservative driving behaviors, some of the values of the risk measurement indicators also exceeded the threshold, but the proportion in excess was very small.
By comparing the thresholds of each coefficient with the clustering results, the test results showed that clustering the driving behavior evaluation results into dangerous, aggressive, safe, and conservative is correct and feasible to distinguish the driving behaviors of drivers. In order to further validate the effectiveness of the selected indices, an experimental comparison was conducted on the driving behavior risk measurement models composed of different indicators. Utilizing the CRITIC weighting method, three new driving behavior risk measurement models were established, with the composition of each model indicator shown in Table 9.
In Table 9, one or two indicators were removed from the driving behavior risk measurement model, and the weight values of the indicators were recalculated. These three kinds of driving behavior risk measurement models were used to calculate the driving behavior risk measurement values, and clustering was completed through the K-means clustering algorithm. We selected 20 vehicles among the 600 sample vehicles for the test. By playing back the video, three experts in the field of traffic safety evaluated the risk of the vehicle’s driving behaviors at each moment. In the end, the category of driving behavior risk at each second for each vehicle was determined through discussion among the three experts. A total of 1207 driving behavior risk measurement results evaluated by the experts were collected in the experiment. The comparison between the expert evaluation results and the model measurement results is shown in Table 10.
Table 10 presents a comparison between the driving behavior risk measurements obtained from different models and the expert evaluation results. The average error was calculated as the ratio of the total number of cluster results measured by the model to the expert evaluation results. The error range was determined by counting the error size for each experimental vehicle. Firstly, when only considering the lateral stability indicator and the longitudinal stability indicator, the average error of the model risk measurement was the largest, with a significant discrepancy between the results identifying the dangerous and conservative types and the expert evaluation results. Subsequently, the car-following risk indicator and the lane-changing risk indicator were added to the model, resulting in a 4.36% and 5.67% improvement in the model accuracy. This demonstrated that the introduction of two indicators, the car-following risk indicator and the lane-changing risk indicator, could effectively enhance the evaluation of driving behavior risk. Finally, the measurement results of the risk measurement model composed of four indicators that we established were consistent with the expert evaluation results, with an accuracy rate of 95.54%. Through experimentation, it could be confirmed that the indicator setting of the driving behavior risk measurement model is reasonable and effective. In contrast to previous research [5,33], which often focused on individual indicators (e.g., following distance and speed) or specific behaviors (e.g., serpentine driving), our model accounts for lateral and longitudinal stability, car-following risk, and lane-changing risk to provide a more comprehensive quantification of the driving behavior risk. The trajectory feature variables used in our model can be easily and cost-effectively extracted from surveillance and UAV videos. This will enables a real-time risk assessment of the driving behavior.

4. Conclusions

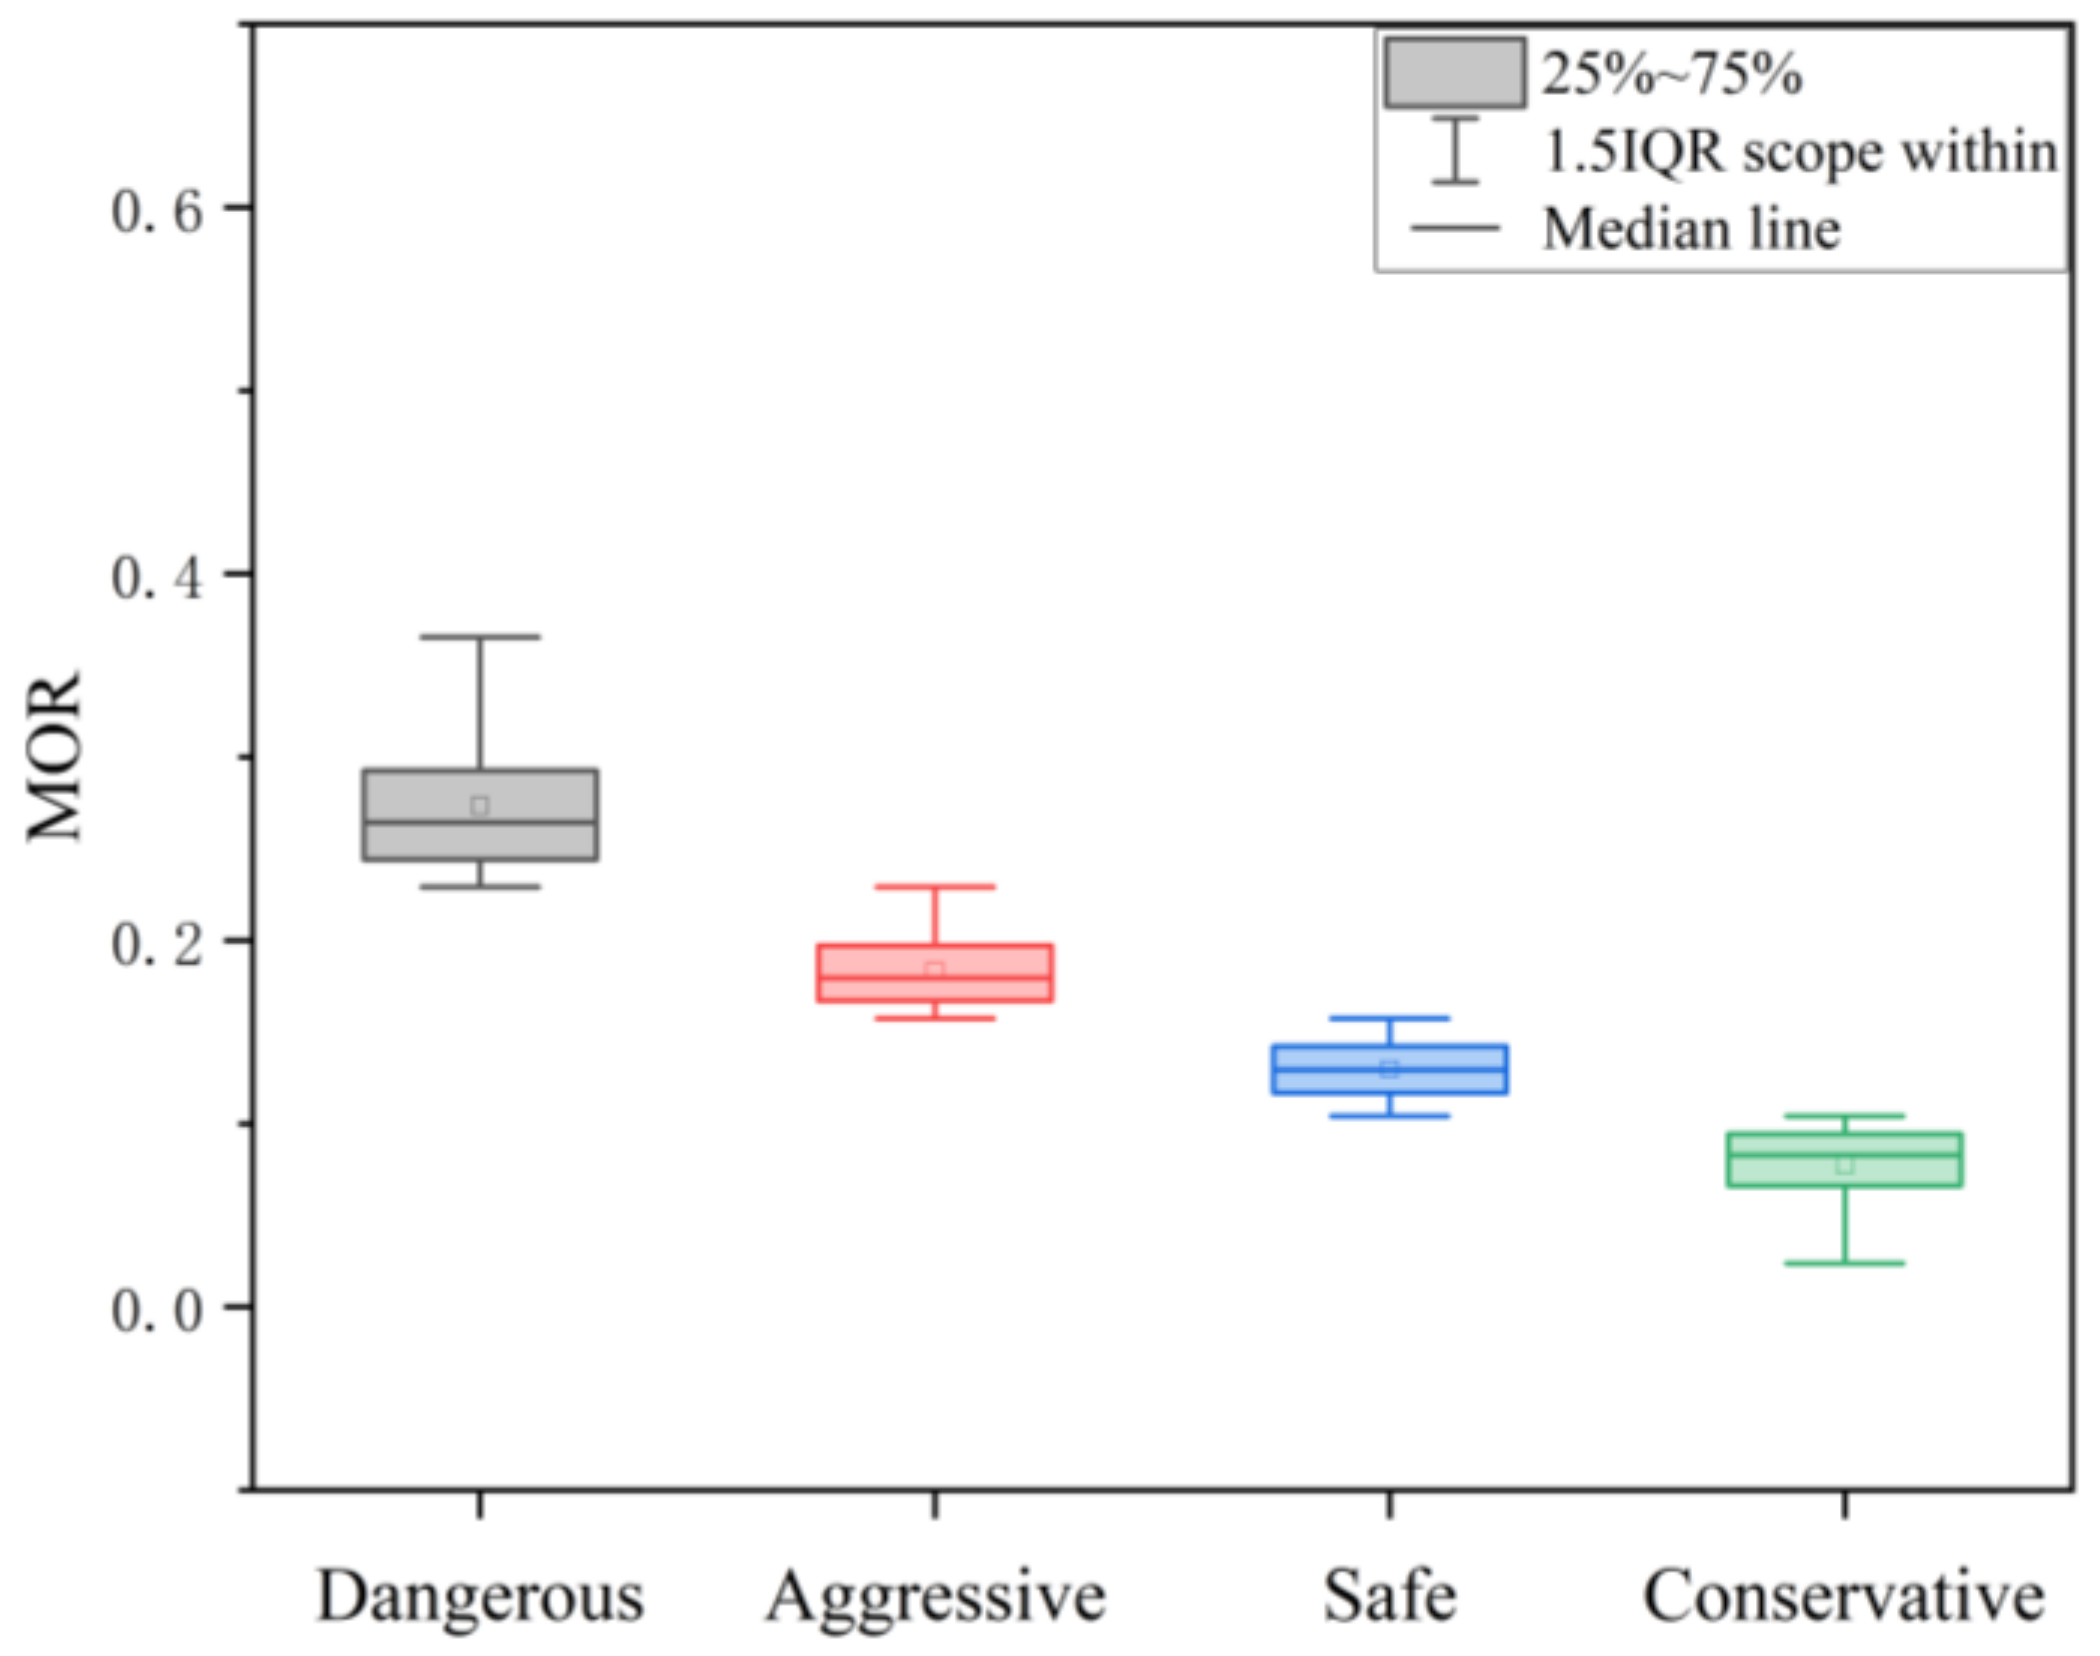
After analyzing the driving characteristics of vehicles, this research defined four indicators for driving behavior risk measurement and established a driving behavior risk measurement method based on the analysis of the driving trajectory data of a large number of vehicles. Then, the driving behaviors were clustered into four types, namely, dangerous, aggressive, safe, and conservative, based on the results of the driving behavior risk measurement.
Four evaluation indicators can accurately measure the risk of driving behavior on the basis of the lateral and longitudinal directions. The driving stability indicator includes the lateral stability indicator and the longitudinal stability indicator. It is used to measure if a vehicle performs serpentine driving and has an unstable speed. The car-following risk indicator that is expressed by the reciprocal of the collision time (TTC), is used to describe the car-following behavior risk. The lane-changing risk indicator considers the relationship between the target vehicle and adjacent vehicles (the front vehicles in the same lane, the front and rear vehicles in the target lane during lane changing),and is used to evaluate the safety degree of lane changing through the missing reaction time of the driver. Based on the NGSIM dataset, the vehicle trajectory data were extracted in this study, and the driving behavior risk measurement model was applied and verified by examples. The results showed that the measurement indicators defined in this study are reasonable and can accurately measure the driving behavior risk.
With the development of smart cities and big data, the availability of behavioral data will become widespread. The data source of this study was the NGSIM dataset, and more real-time vehicle trajectory data could be collected in the future. The results of this research can provide a theoretical basis for drivers’ driving behavior recognition based on artificial intelligence algorithms and further improve the accuracy of image recognition. In the follow-up research, we will further improve the sample size, consider the risk measurement for driving behaviors with multiple models, and consider more trajectory variables, such as vehicle performance, road environment, and other influencing factors, to recognize driver driving behavior risks better.

Author Contributions

Conceptualization, S.C. and Q.L.; methodology, Q.L. and X.Z.; software, K.C. and J.Y.; validation, K.C., X.Z., and J.Y.; formal analysis, S.C. and K.C.; investigation, J.L. and J.Y.; resources, Q.L. and J.L.; data curation, J.Y. and S.C.; writing—original draft preparation, S.C. and K.C.; writing—review and editing, Q.L. and S.C.; visualization, X.Z. and J.L.; supervision, K.C. and Q.L.; project administration, X.Z. and J.L.; funding acquisition, Q.L. All authors have read and agreed to the published version of the manuscript.

Funding

This research received no external funding.

Institutional Review Board Statement

Not applicable.

Informed Consent Statement

Not applicable.

Data Availability Statement

Publicly available datasets were analyzed in this study. These data can be found here: https://ops.fhwa.dot.gov/trafficanalysistools/ngsim.htm (accessed on 9 June 2022).

Acknowledgments

This work was jointly supported by the Guangzhou Science and technology planning project (202102020249).

Conflicts of Interest

The authors declare no conflict of interest.

References

  1. Tango, F.; Botta, M. Real-Time Detection System of Driver Distraction Using Machine Learning. IEEE Trans. Intell. Transp. Syst. 2013, 14, 894–905. [Google Scholar] [CrossRef]
  2. Ou, C.; Karray, F. Enhancing Driver Distraction Recognition Using Generative Adversarial Networks. IEEE Trans. Intell. Veh. 2020, 5, 385–396. [Google Scholar] [CrossRef]
  3. Hu, L.; Bao, X.; Lin, M.; Yu, C.; Wang, F. Research on risky driving behavior evaluation model based on CIDAS real data. Proc. Inst. Mech. Eng. Part D J. Automob. Eng. 2021, 235, 2176–2187. [Google Scholar] [CrossRef]
  4. Guo, M.; Zhao, X.; Yao, Y.; Yan, P.; Su, Y.; Bi, C.; Wu, D. A study of freeway crash risk prediction and interpretation based on risky driving behavior and traffic flow data. Accid. Anal. Prev. 2021, 160, 106328. [Google Scholar] [CrossRef] [PubMed]
  5. Ucar, S.; Patnayak, C.; Oza, P.; Hoh, B.; Oguchi, K. Management of anomalous driving behavior. In Proceedings of the 2019 IEEE Vehicular Networking Conference, Los Angeles, CA, USA, 4–6 December 2019; pp. 1–4. [Google Scholar]
  6. Singh, H.; Kathuria, A. Analyzing driver behavior under naturalistic driving conditions: A review. Accid. Anal. Prev. 2021, 150, 105908. [Google Scholar] [CrossRef]
  7. Song, X.; Yin, Y.; Cao, H.; Zhao, S.; Li, M.; Yi, B. The mediating effect of driver characteristics on risky driving behaviors moderated by gender, and the classification model of driver’s driving risk. Accid. Anal. Prev. 2021, 153, 106038. [Google Scholar] [CrossRef]
  8. Linkov, V.; Zaoral, A.; Řezáč, P.; Pai, C.W. Personality and professional drivers’ driving behavior. Transp. Res. Part F Traffic Psychol. Behav. 2019, 60, 105–110. [Google Scholar] [CrossRef]
  9. Chandra, R.; Bhattacharya, U.; Mittal, T.; Bera, A.; Manocha, D. Cmetric: A driving behavior measure using centrality functions. In Proceedings of the 2020 IEEE/RSJ International Conference on Intelligent Robots and Systems (IROS), Las Vegas, NV, USA, 25–29 October 2020; pp. 2035–2042. [Google Scholar]
  10. Wang, L.; Zhou, N.; Kang, Z.H. An unsupervised driving behavior pattern recognition algorithm based on clustering and LDA model. In Proceedings of the 2nd International Conference on Artificial Intelligence and Computer Engineering, Hangzhou, China, 5–7 November 2021; pp. 275–283. [Google Scholar]
  11. Van Huysduynen, H.H.; Terken, J.; Eggen, B. The relation between self-reported driving style and driving behaviour. A simulator study. Transp. Res. Part F Traffic Psychol. Behav. 2018, 56, 245–255. [Google Scholar] [CrossRef]
  12. Jiang, R.; Zhu, S.; Chang, H.; Wu, J.; Ding, N.; Liu, B.; Qiu, J. Determining an Improved Traffic Conflict Indicator for Highway Safety Estimation Based on Vehicle Trajectory Data. Sustainability 2021, 13, 9278. [Google Scholar] [CrossRef]
  13. Park, H.; Oh, C.; Moon, J.; Kim, S. Development of a lane change risk indicator using vehicle trajectory data. Accid. Anal. Prev. 2018, 110, 1–8. [Google Scholar] [CrossRef]
  14. Yang, K.; Al Haddad, C.; Yannis, G.; Antoniou, C. Classification and Evaluation of Driving Behavior Safety Levels: A Driving Simulation Study. IEEE Open J. Intell. Transp. Syst. 2022, 3, 111–125. [Google Scholar] [CrossRef]
  15. Matousek, M.; Yassin, M.; van der Heijden, R.; Kargl, F. Robust detection of anomalous driving behavior. In Proceedings of the IEEE Vehicular Technology Conference, Porto, Portugal, 3–6 June 2018; pp. 1–5. [Google Scholar]
  16. Collin, A.; Bilka, A.; Pendleton, S.; Tebbens, R.D. Safety of the intended driving behavior using rulebooks. In Proceedings of the IEEE Intelligent Vehicles Symposium (IV), Las Vegas, NV, USA, 19 October–13 November 2020; pp. 136–143. [Google Scholar]
  17. Xiang, H.; Zhu, J.; Liang, G.; Shen, Y. Prediction of dangerous driving behavior based on vehicle motion state and passenger feeling using Cloud Model and Elman Neural Network. Front. Neurorobot. 2021, 15, 641007. [Google Scholar] [CrossRef]
  18. Qiao, X.; Zheng, L.; Li, Y.; Ren, Y.; Zhang, Z.; Zhang, Z.; Qiu, L. Characterization of the Driving Style by State–Action Semantic Plane Based on the Bayesian Nonparametric Approach. Appl. Sci. 2021, 11, 7857. [Google Scholar] [CrossRef]
  19. Geng, X.; Liang, H.; Yu, B.; Zhao, P.; He, L.; Huang, R. A Scenario-Adaptive Driving Behavior Prediction Approach to Urban Autonomous Driving. Appl. Sci. 2017, 7, 426. [Google Scholar] [CrossRef]
  20. Abdi, H. Coefficient of variation. In Encyclopedia of Research Design; Sage: Thousand Oaks, CA, USA, 2010; Volume 1. [Google Scholar]
  21. Jalilibal, Z.; Amiri, A.; Castagliola, P.; Khoo, M.B. Monitoring the coefficient of variation: A literature review. Comput. Ind. Eng. 2021, 161, 107600. [Google Scholar] [CrossRef]
  22. Ding, R.; Pan, C.; Dai, Z.; Xu, J. Lateral Oscillation Characteristics of Vehicle Trajectories on the Straight Sections of Freeways. Appl. Sci. 2022, 12, 11498. [Google Scholar] [CrossRef]
  23. Li, Y.; Wu, D.; Lee, J.; Yang, M.; Shi, Y. Analysis of the transition condition of rear-end collisions using time-to-collision index and vehicle trajectory data. Accid. Anal. Prev. 2020, 144, 105676. [Google Scholar] [CrossRef]
  24. Li, L.; Gan, J.; Yi, Z.; Qu, X.; Ran, B. Risk perception and the warning strategy based on safety potential field theory. Accid. Anal. Prev. 2020, 148, 105805. [Google Scholar] [CrossRef]
  25. Mahmud, S.M.S.; Ferreira, L.; Hoque, M.S.; Tavassoli, A. Application of proximal surrogate indicators for safety evaluation: A review of recent developments and research needs. IATSS Res. 2017, 41, 153–163. [Google Scholar] [CrossRef]
  26. Wang, K.; Xue, Q.; Lu, J.J. Risky driver recognition with class imbalance data and automated machine learning framework. Int. J. Environ. Res. Public Health 2021, 18, 7534. [Google Scholar] [CrossRef]
  27. Obilor, E.I.; Amadi, E.C. Test for significance of Pearson’s correlation coefficient. Int. J. Innov. Math. Stat. Energy Policies 2018, 6, 11–23. [Google Scholar]
  28. Zhai, C.; Wu, W. Self-delayed feedback car-following control with the velocity uncertainty of preceding vehicles on gradient roads. Nonlinear Dyn. 2021, 106, 3379–3400. [Google Scholar] [CrossRef]
  29. Zhai, C.; Wu, W.; Xiao, Y. Cooperative car following control with electronic throttle and perceived headway errors on gyroidal roads. Appl. Math. Model. 2022, 108, 770–786. [Google Scholar] [CrossRef]
  30. Ly, A.; Marsman, M.; Wagenmakers, E.J. Analytic posteriors for Pearson’s correlation coefficient. Stat. Neerl. 2018, 72, 4–13. [Google Scholar] [CrossRef] [PubMed]
  31. Chen, W.; Zhang, S.; Li, R.; Shahabi, H. Performance evaluation of the GIS-based data mining techniques of best-first decision tree, random forest, and naive Bayes tree for landslide susceptibility modeling. Sci. Total Environ. 2018, 644, 1006–1018. [Google Scholar] [CrossRef]
  32. Naeem, S.M.; Hussein, A.N. Comparison of the percentile estimation method and mixture (maximum likelihood and least square) method for estimating parameters of Johnson bounded distribution. Int. J. Nonlinear Anal. Appl. 2022, 13, 2655–2663. [Google Scholar]
  33. Chen, S.; Xue, Q.; Zhao, X.; Xing, Y.; Lu, J.J. Risky driving behavior recognition based on vehicle trajectory. Int. J. Environ. Res. Public Health 2021, 18, 12373. [Google Scholar] [CrossRef]
  34. Laurikkala, J.; Juhola, M.; Kentala, E.; Lavrac, N.; Miksch, S.; Kavsek, B. Informal identification of outliers in medical data. In Proceedings of the Fifth International Workshop on Intelligent Data Analysis in Medicine and Pharmacology, Berlin, Germany, 20–25 August 2000; Volume 1, pp. 20–24. [Google Scholar]
  35. Singh, D.; Singh, B. Investigating the impact of data normalization on classification performance. Appl. Soft Comput. 2020, 97, 105524. [Google Scholar] [CrossRef]
  36. Wu, H.W.; Zhen, J.; Zhang, J. Urban rail transit operation safety evaluation based on an improved CRITIC method and cloud model. J. Rail Transp. Plan. Manag. 2020, 16, 100206. [Google Scholar] [CrossRef]
  37. Krishnan, A.R.; Kasim, M.M.; Hamid, R.; Ghazali, M.F. A modified CRITIC method to estimate the objective weights of decision criteria. Symmetry 2021, 13, 973. [Google Scholar] [CrossRef]
  38. Tuş, A.; Aytaç Adalı, E. The new combination with CRITIC and WASPAS methods for the time and attendance software selection problem. Opsearch 2019, 56, 528–538. [Google Scholar] [CrossRef]
  39. Yuan, C.; Yang, H. Research on K-value selection method of K-means clustering algorithm. J 2019, 2, 226–235. [Google Scholar] [CrossRef]
  40. Fränti, P.; Sieranoja, S. How much can k-means be improved by using better initialization and repeats? Pattern Recognit. 2019, 93, 95–112. [Google Scholar] [CrossRef]
  41. Zhai, C.; Wu, W. A continuum model considering the uncertain velocity of preceding vehicles on gradient highways. Phys. A 2022, 588, 126561. [Google Scholar] [CrossRef]
  42. Na, S.; Xumin, L.; Yong, G. Research on k-means clustering algorithm: An improved k-means clustering algorithm. In Proceedings of the 2010 Third International Symposium on Intelligent Information Technology and Security Informatics, Jian, China, 2–4 April 2010; pp. 63–67. [Google Scholar]
  43. Curtis, A.E.; Smith, T.A.; Ziganshin, B.A.; Elefteriades, J.A. The mystery of the Z-score. Aorta 2016, 4, 124–130. [Google Scholar] [CrossRef]
Figure 1. Schematic diagram of the I-80 detection section.
Applsci 13 05675 g001
Figure 2. Mean and standard deviation of vehicles’ speed.
Applsci 13 05675 g002
Figure 3. Mean and standard deviation of vehicles’ acceleration.
Applsci 13 05675 g003
Figure 4. Distribution of driving behavior risk measurement results.
Applsci 13 05675 g004
Figure 5. Normalization results for the driving behavior risk indicators.
Applsci 13 05675 g005
Figure 6. Frequency distribution of the driving behavior risk measurements.
Applsci 13 05675 g006
Figure 7. Boxplot graph of the risk measure indexes.
Applsci 13 05675 g007
Figure 8. Clustering results of the driving behavior risk measurement.
Applsci 13 05675 g008
Figure 9. MOR clustering for a single driver.
Applsci 13 05675 g009
Table 1. Original data of the NGSIM dataset.
ParameterDescribesUnit
Vehicle_IDvehicle identification number/
Frame_IDframe of data at a certain moment0.1 s
Total_Frametotal of frames of the target car in the dataset0.1 s
Global_TimetimestampMs
Local_Xlateral coordinate of the front center of the vehicleFeet
Local_Ylongitudinal coordinate of the front center of the vehicleFeet
v_lengthvehicle lengthFeet
v_Classvehicle type1-Motorcycle, 2-Car, 3-Truck
Lane_IDcurrent lane position of the vehicle/
Precedingvehicle ID number of the preceding vehicle on the same lane/
Followingvehicle ID number of the rear vehicle on the same lane/
Locationstreet name or highway name/
Table 2. Correlation analysis of the risk measure indexes.
Indicator R 1 R 2 R 3 R 4
R 1 1.0000.160 **−0.040 **−0.036 **
R 2 0.160 **1.0000.053 **0.043 **
R 3 −0.040 **0.053 **1.0000.072 **
R 4 −0.036 **0.043 **0.072 **1.000
In the table, ** indicates that the correlation is significant at the 0.01 level (two-tailed).
Table 3. Weights of the risk measure indexes.
Indicator S j R j C j W j
R 1 0.656522.9161.914420.397
R 2 0.545652.7441.497260.310
R 3 0.136372.9150.397510.082
R 4 0.346922.9211.013360.210
Table 4. Threshold results of the risk measure indicators.
IndicatorThresholdPercentage of Dangerous Driving Behaviors
R 1 2.5603.35%
R 2 2.1606.12%
R 3 0.3246.26%
R 4 1.4700.90%
Table 5. Cluster centers of the K-means clustering algorithm.
Cluster NameDangerousAggressiveSafeConservative
Initial cluster center0.420.310.210.00
final cluster center0.270.180.130.08
Table 6. Proportion of each cluster.
ClusterRangeProportion (%)
Dangerous[0.23, 0.47]5.40
Aggressive[0.16, 0.23)23.30
Safe[0.10, 0.16)43.22
Conservative[0.00, 0.10)28.08
Table 7. Cluster results of the driving stability indicator.
Cluster R 1 R 2
MeanRangePercent Over ThresholdMeanRangePercent Over Threshold
Dangerous2.526[0.355, 6.245]46.10%2.152[0.000, 6.053]51.12%
Aggressive1.669[0.039, 3.603]3.65%1.470[0.000, 3.638]13.58%
Safe1.060[0.005, 0.245]0%1.189[0.000, 2.588]0.35%
Conservative0.540[0.004, 1.624]0%0.817[0.000, 1.752]0%
Table 8. Cluster results of the car-following risk and lane-changing risk indicators.
Cluster R 3 R 4
MeanRangePercent Over ThresholdMeanRangePercent Over Threshold
Dangerous0.159[0.003, 2.859]10.98%0.647[0.005, 3.584]4.02%
Aggressive0.136[0.001, 2.771]7.76%0.605[0.001, 1.563]3.24%
Safe0.117[0.001, 2.421]5.68%0.428[0.002, 2.036]0.51%
Conservative0.111[0.002, 1.659]4.95%0.294[0.001, 1.564]0.57%
Table 9. Weights of the driving behavior risk measurement models.
Model CompositionWeights
R 1 R 2 R 3 R 4
R 1 + R 2 0.5460.4540.0000.000
R 1 + R 2 + R 3 0.4980.3930.1090.000
R 1 + R 2 + R 4 0.4240.3380.0000.238
Table 10. Results of the experiment.
Model CompositionAmountAverage ErrorError Range
DangerousAggressiveSafeConservative
M O R ( R 1 + R 2 + R 3 + R 4 ) 652894843694.46%[1.61%, 7.69%]
R 1 + R 2 5732850232015.02%[11.02%, 18.19%]
R 1 + R 2 + R 3 6031149534110.66%[6.74%, 13.64%]
R 1 + R 2 + R 4 613064933479.35%[6.49%, 14.10%]
Expert Evaluation Results69274476388//
Disclaimer/Publisher’s Note: The statements, opinions and data contained in all publications are solely those of the individual author(s) and contributor(s) and not of MDPI and/or the editor(s). MDPI and/or the editor(s) disclaim responsibility for any injury to people or property resulting from any ideas, methods, instructions or products referred to in the content.

