Article

Semantic-Aligned Cross-Modal Visual Grounding Network with Transformers

1
The Tenth Research Institute of China Electronics Technology Group Corporation, Chengdu 610036, China
2
College of Computer Science and Electronic Engineering, Hunan University, Changsha 410082, China
*
Author to whom correspondence should be addressed.
Appl. Sci. 2023, 13(9), 5649; https://doi.org/10.3390/app13095649
Submission received: 7 March 2023 / Revised: 28 April 2023 / Accepted: 28 April 2023 / Published: 4 May 2023
(This article belongs to the Special Issue Big Data Analysis and Management Based on Deep Learning)

Abstract

:
Multi-modal deep learning methods have achieved great improvements in visual grounding; their objective is to localize text-specified objects in images. Most of the existing methods can localize and classify objects with significant appearance differences but suffer from the misclassification problem for extremely similar objects, due to inadequate exploration of multi-modal features. To address this problem, we propose a novel semantic-aligned cross-modal visual grounding network with transformers (SAC-VGNet). SAC-VGNet integrates visual and textual features with semantic alignment to highlight important feature cues for capturing tiny differences between similar objects. Technically, SAC-VGNet incorporates a multi-modal fusion module to effectively fuse visual and textual descriptions. It also introduces contrastive learning to align linguistic and visual features on the text-to-pixel level, enabling the capture of subtle differences between objects. The overall architecture is end-to-end without the need for extra parameter settings. To evaluate our approach, we manually annotate text descriptions for images in two fine-grained visual grounding datasets. The experimental results demonstrate that SAC-VGNet significantly improves performance in fine-grained visual grounding.

1. Introduction

Visual grounding aims to locate the most relevant object or region in an image based on a natural language query. The recent advancements in deep neural networks have greatly contributed to the progress of visual grounding [1,2,3]. Technically, most 2D visual grounding approaches utilize visual representations to search for objects in an image, and they have shown promising performance in various applications such as automated driving systems (ADSs) [4], robotics [5], power transmission systems [6,7], and remote sensing [8,9,10,11], among others.
The existing vision-based visual grounding approaches can be categorized into three paradigms: (1) the two-stage model, which sequentially extracts region proposals followed by object classification [12,13,14]; (2) the one-stage model, which simultaneously outputs the locations and categories of objects [15,16,17,18]; and (3) the full end-to-end model, which directly generates results without manual parameter settings [19,20]. These vision-based approaches leverage strong feature representations to achieve coarse-grained object discrimination, where visually distinct differences exist between inter-class objects. Coarse-grained visual grounding, in this context, refers to the differentiation and localization of objects between superior classes, such as dogs and cats. In contrast, fine-grained visual grounding aims to differentiate and locate subordinate classes within a common superior class, posing greater challenges in object discrimination. This is because distinguishing between extremely similar objects from two subordinate classes can sometimes exceed the capability of vision-based recognition, and even our eyes struggle to differentiate between them. For instance, the two planes shown in Figure 1a are so similar in visual appearance that they cannot be distinguished, leading to detection failure by YOLO and deformable DETR [21,22,23].
As a result, vision-based approaches struggle to accurately capture the subtle differences between two similar objects, leading to incorrect predictions [21,22,23].
To tackle this problem, this paper explores the improvement of fine-grained visual grounding by integrating both textual and visual representations. As shown in Figure 1b, with the two passenger planes, they are difficult to distinguish based on visual appearances alone. However, their text descriptions clearly indicate their differences, such as “narrow-body” versus “wide body” and “two jet engines” versus “four jet engines”. Textual descriptions provide more abstract semantic knowledge. Therefore, utilizing this textual information can effectively complement the limitations of visual representation and provide valuable cues for distinguishing between similar objects in fine-grained visual grounding (more details in Section 3).
This paper introduces a novel approach called the semantic-aligned cross-modal visual grounding network with transformers (SAC-VGNet). SAC-VGNet is built upon the foundation of the state-of-the-art YOLOv7 [24] and combines textual and visual features [1,25,26] to enhance the discriminative capability of fine-grained visual grounding. In SAC-VGNet, given the textual and visual inputs, the network first employs a multi-scale cross-modal fusion module (MCMF) to effectively fuse both visual and textual descriptions. The MCMF consists of two sequential steps: textual and visual feature encoding, which generate the initial multi-modal feature, and multi-scale cross-modal feature decoding, which refines the multi-modal feature using a multi-head cross-attention operation. To further enhance the discrimination ability, SAC-VGNet adopts text-driven contrastive learning (TCL) to achieve an accurate feature alignment [27,28,29] (more details in Section 3.4). TCL uses the dot product to measure the similarity between the text projection and the related pixel-level projection while suppressing the response of the unrelated part. As a result, it could effectively project the original multi-modal feature into a new feature space to better capture the tiny differences between similar objects, yielding stronger discriminative abilities. Moreover, our architecture is end-to-end without extra parameter settings, such as NMS [30] and the anchor size [31], which greatly saves manual setting costs.
To evaluate our approach, we manually annotated a text description for each image in two fine-grained visual grounding datasets (“Military Aircraft Dataset” and “FGVC Aircraft Dataset”). The experimental results demonstrate that SAC-VGNet (integrating both visual and textual features) is effective for fine-grained visual grounding. The contributions of this paper are three-fold:
1.
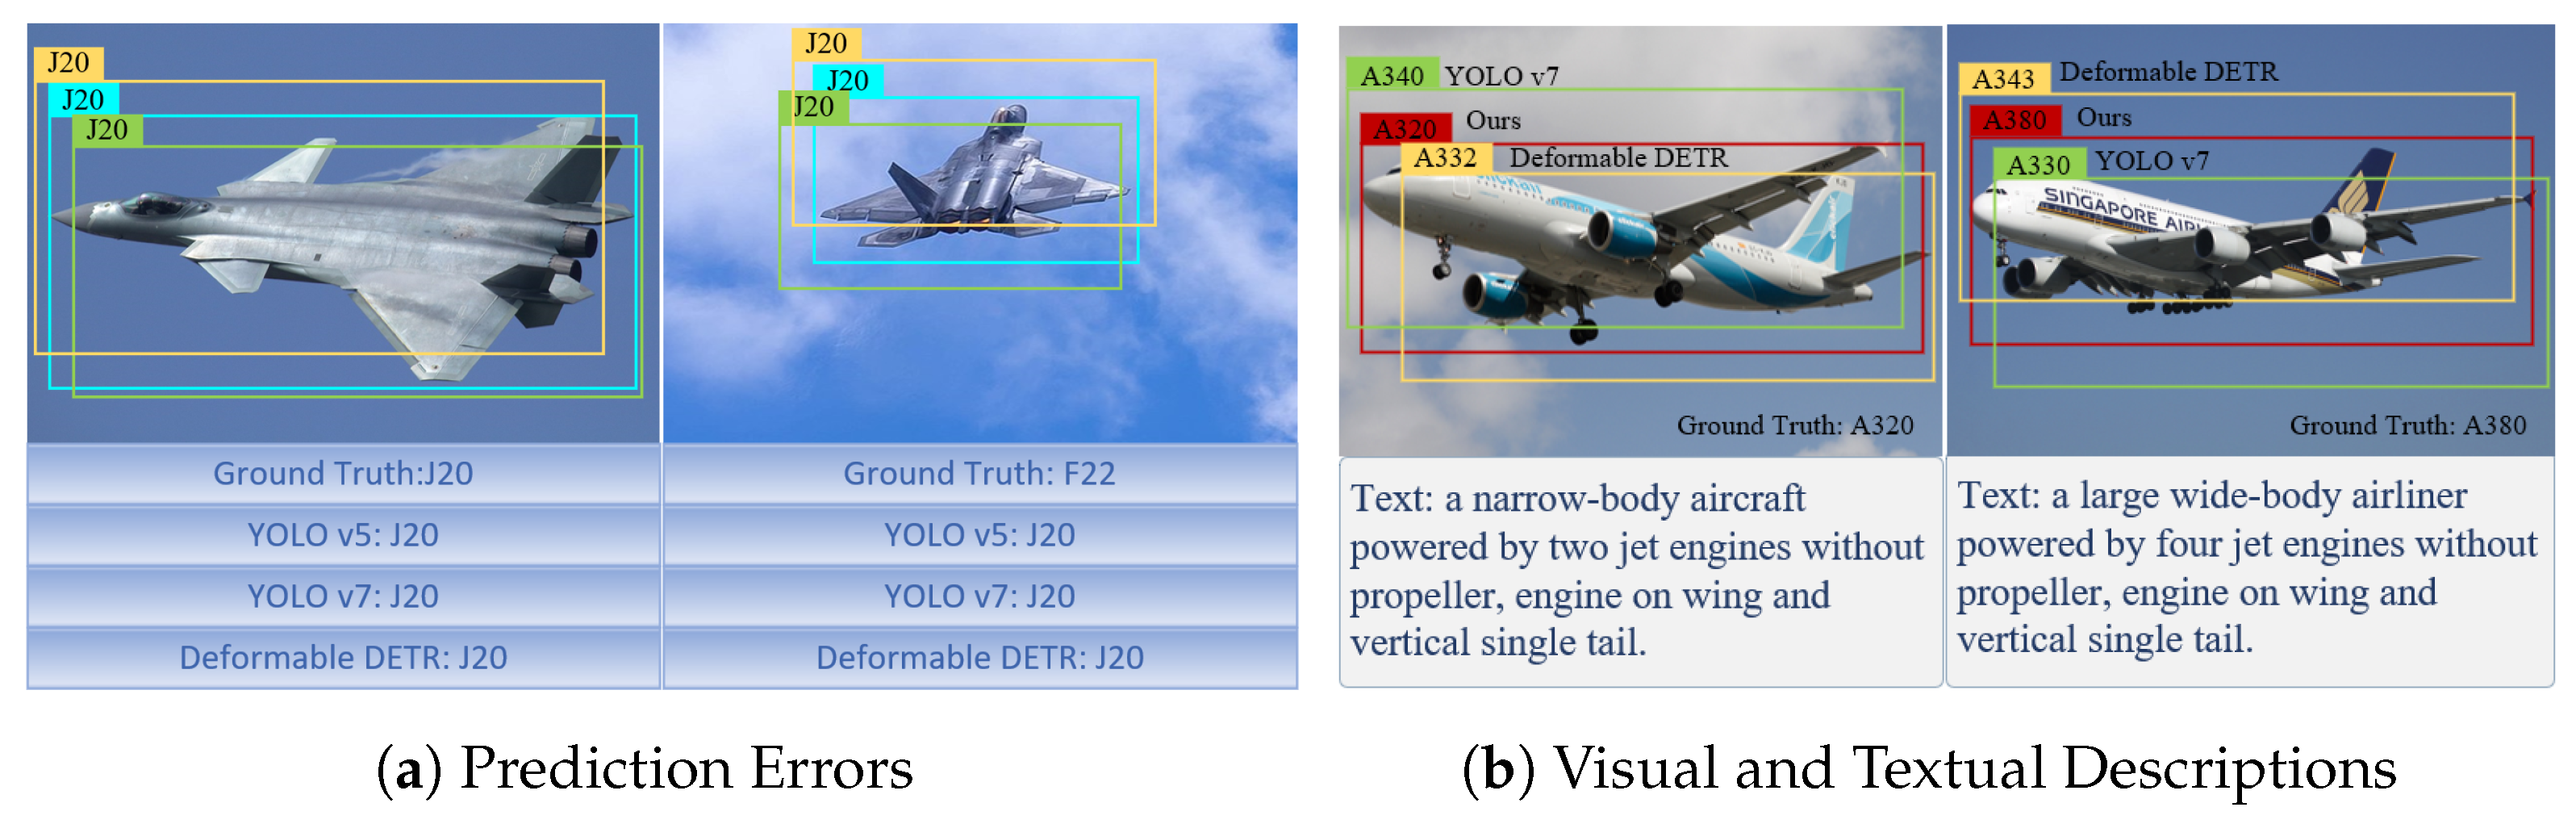
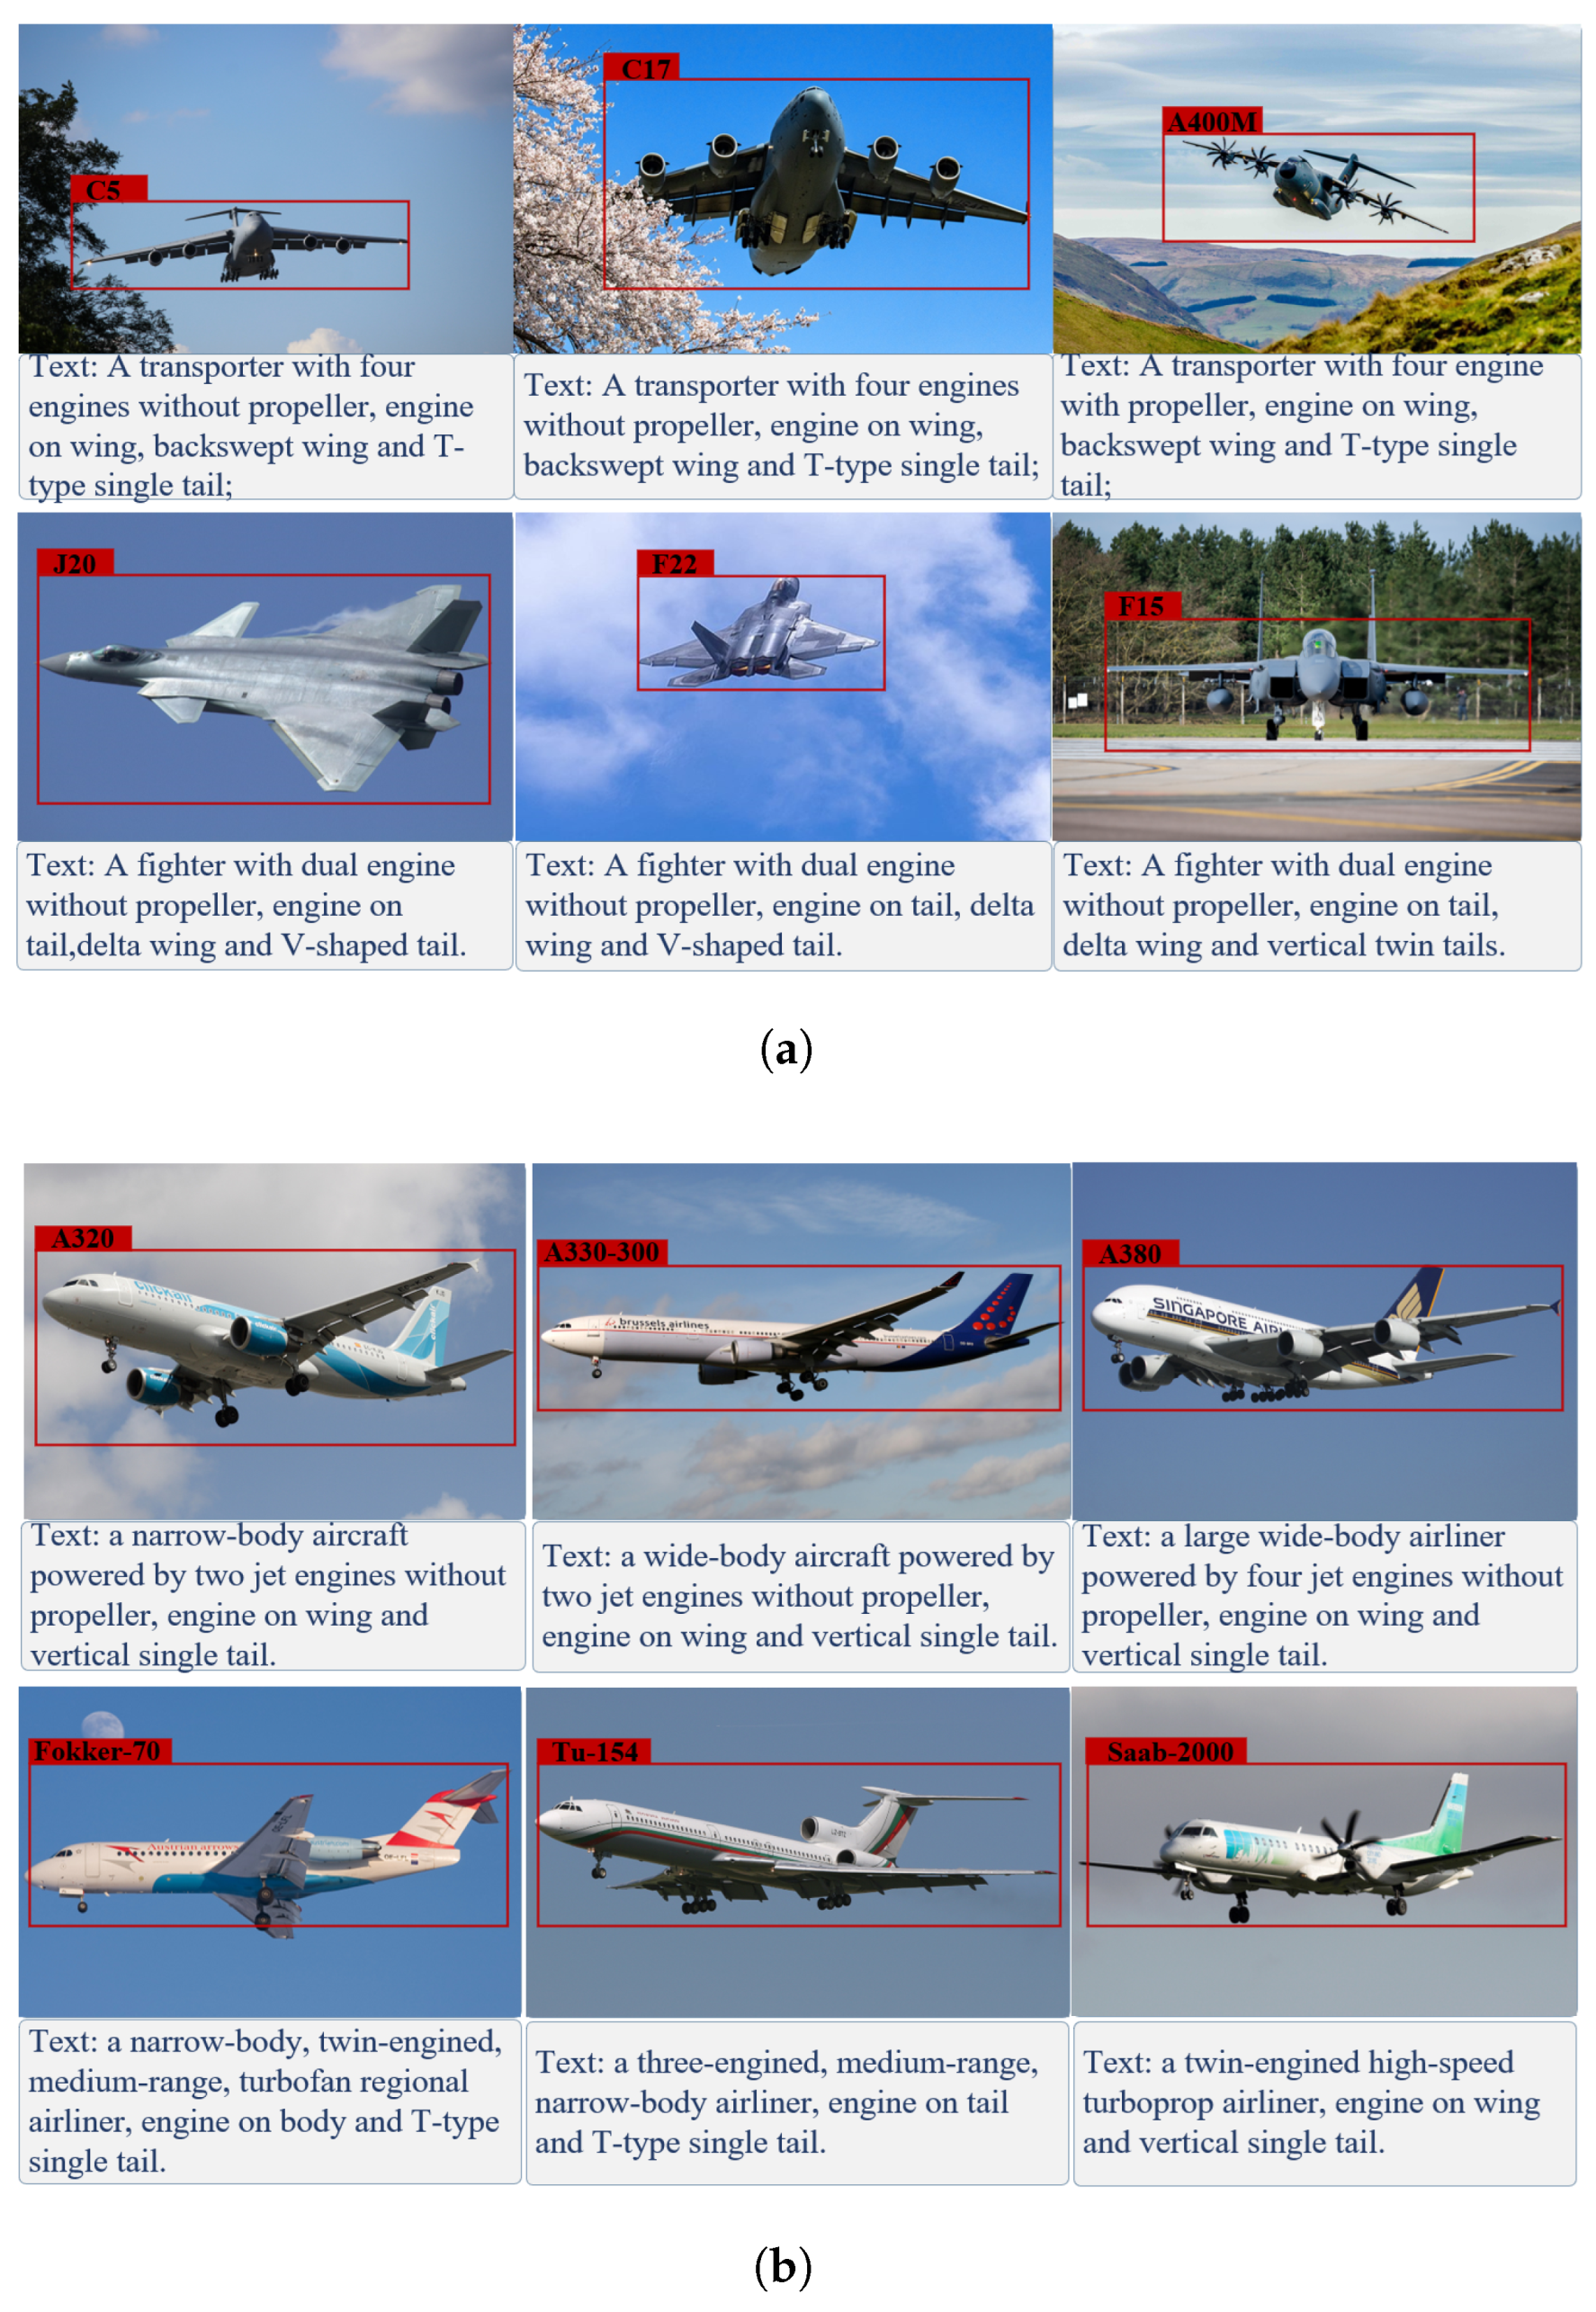
We propose a novel semantic-aligned cross-modal visual grounding network with transformers (SAC-VGNet) to integrate both visual and textual features for fine-grained visual grounding. Correspondingly, we manually annotated the text information of two fine-grained visual grounding datasets, providing valuable resources for future research in this area.
2.
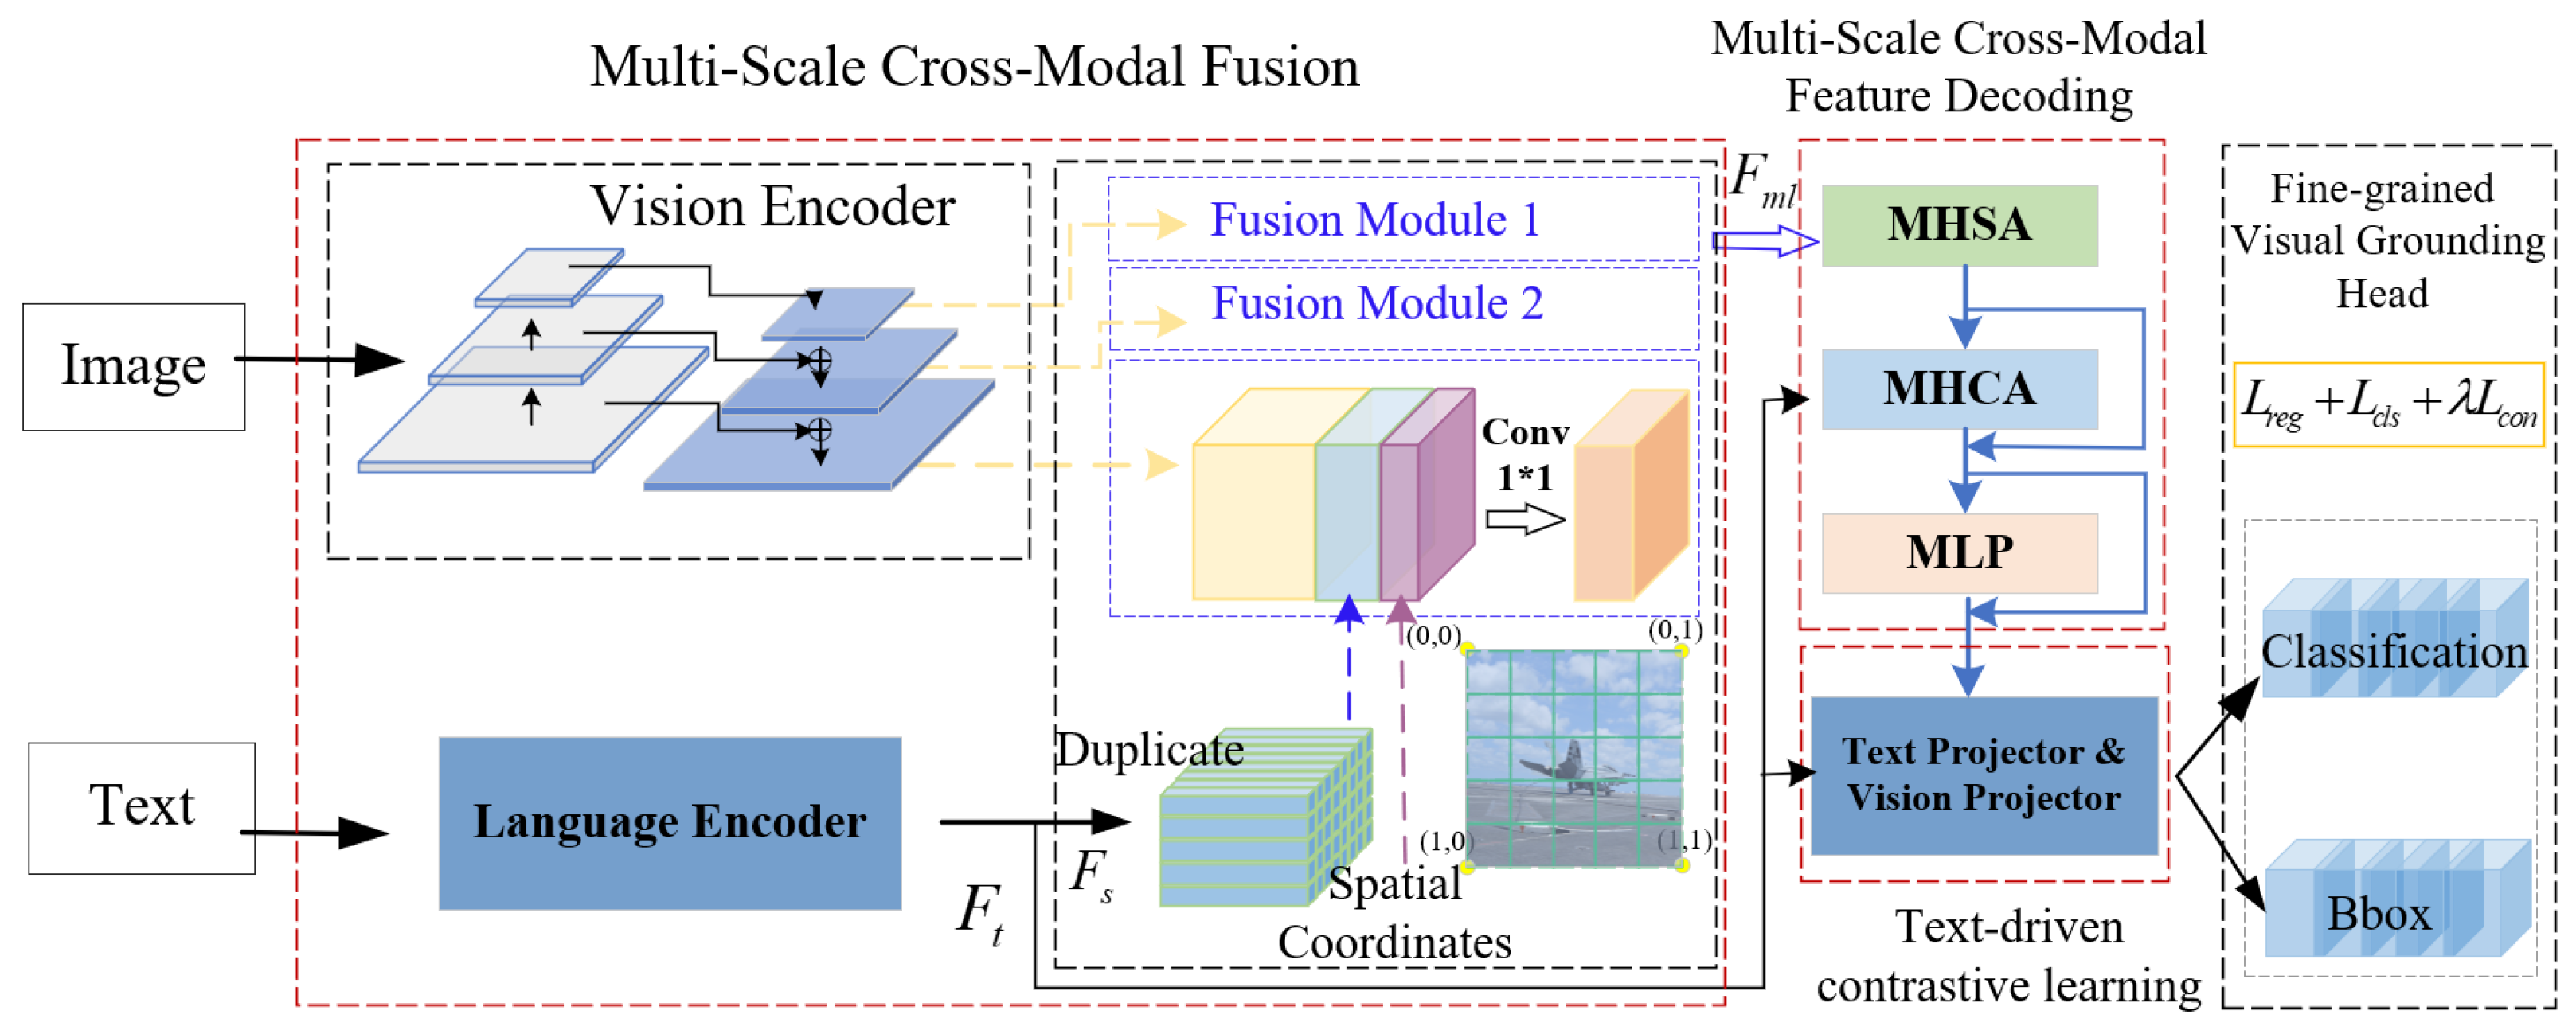
We designed a multi-scale cross-modal fusion module to effectively fuse visual and textual inputs. The module could effectively explore the correlations between them, and highlight the important areas in the feature map to capture the tiny differences between similar objects.
3.
We adopted text-driven contrastive learning to achieve accurate feature alignment, which could effectively project the original multi-modal feature into a new feature space and, thus, the refined feature offers a stronger discrimination ability for fine-grained visual grounding.
The rest of this paper is organized as follows. We review related work in Section 2. In Section 3, we elaborate on our model. Experimental results are reported in Section 4, followed by the conclusion in Section 6.

2. Related Works

The rapid advancement of deep learning has prompted a shift from traditional object detection methods that rely on handcrafted features to deep learning-based approaches. These approaches can be categorized into three paradigms: the two-stage method [32,33], the one-stage methods [30,34], and the full end-to-end methods [19,26,35]. In the two-stage methods, region proposals are first generated to identify potential objects, followed by object classification [12,36,37]. For example, Liu et al. [38] proposed a Faster R-CNN-based underwater target detector that utilizes the Swin Transformer as the backbone to fuse deep and shallow feature maps, leading to improved accuracy in underwater image detection. Xiang et al. [31] proposed an adaptive two-stage anchor assignment method to calculate the overlapping area by using a prediction box instead of a fixed anchor box. With the high accuracy, the two-stage methods usually suffer from low speeds, which greatly limits their applications. Comparatively, one-stage approaches could simultaneously predict both the location and category for each object and usually achieve faster speeds. The most representative one-stage algorithm is YOLO [15,39], which has undergone continuous updates in recent years [40,41]. Yang et al. [1] proposed a simple, fast, and accurate one-stage approach for visual grounding by integrating language queries and spatial features into the YOLOv3 object detector, creating an end-to-end trainable visual grounding model. The latest versions of YOLO are YOLOv6 [42] and YOLOv7 [24]. YOLOv6 improves the backbone architecture by incorporating CSPDarknet with EfficientRep, while YOLOv7 introduces an efficient aggregation network and an auxiliary training module to guide the label assignment strategy, resulting in reduced computation and improved accuracy. Benefiting from the fast speed, YOLO has found wide application in various engineering domains, including forestry detection in urban areas [43], forest fire detection [44], and more. In contrast to one-stage and two-stage approaches that require manual parameter tuning, fully end-to-end methods utilize Transformers with multi-head self-attention to directly generate results, reducing the need for manual adjustment. For example, Carion et al. [19] proposed an end-to-end framework called DETR, which combines CNNs and Transformers for object detection. Zhu et al. [35] introduced Deformable DETR, which focuses on a small set of sampling locations as a pre-filter to identify prominent key elements from the entire feature map, resulting in faster model training.
The aforementioned 2D visual grounding algorithms mainly focus on coarse-grained objects, where there are significant visual differences between inter-class objects. However, fine-grained visual grounding, which finds applications in real-world scenes, presents greater challenges due to the extremely high similarity between objects. For instance, Deng et al. [45] proposed an accumulated attention (A-ATT) mechanism to iteratively accumulate attention for useful information in images, queries, and objects while gradually ignoring irrelevant noise. Yang et al. [46] proposed a transformer-based framework for accurate visual grounding by establishing text-conditioned discriminative features and employing multi-stage cross-modal reasoning.
On the other hand, many studies have shown that the use of multi-modal information can lead to better performances in fine-grained image classification and remote sensing [47,48,49,50]. For instance, Andres Mafla et al. [51] used graph convolutional networks to perform multi-modal inference, obtaining relationally enhanced visual representations by learning a common semantic space between images and scene text. Their approach yielded promising performance in fine-grained image classification. Yuan et al. [52] proposed an asymmetric multi-modal feature matching network (AMFMN) that used a multi-scale visual self-attentive module to extract salient features from remote sensing images, along with a text representation. Gao et al. [53] introduced the multichannel feature fusion lozenge network (MLNet), which employed a three-sided network composed of three branches to enhance the accuracy of land cover segmentation.
Different from previous studies [1], this paper aims to integrate textual and visual information for fine-grained visual grounding by incorporating cross-attention and contrastive learning. In technical terms, we utilize the advanced one-stage approach YOLOv7 as the baseline and introduce Transformer with contrastive learning to enhance the learning of discriminative multi-modal features, thus addressing the misclassification issue encountered in fine-grained visual grounding.

3. Method

To distinguish between similar objects for fine-grained visual grounding, this paper proposes a semantic-aligned cross-modal visual grounding network with transformers (SAC-VGNet), which adopts YOLOv7 as the baseline and introduces multi-modal feature fusion with text-driven contrastive learning to boost performance for fine-grained visual grounding. YOLOv7 [24] is a highly efficient convolutional neural network (CNN)-based object detector. As illustrated in Figure 2, SAC-VGNet comprises four key components: multi-scale cross-modal fusion, multi-scale cross-modal feature decoding, text-driven contrastive learning, and fine-grained visual grounding head. Firstly, textual and visual features are extracted using a text encoder and an image encoder, respectively. These features are then concatenated with spatial features at three different resolutions. Secondly, the concatenated features are processed by the multi-scale cross-modal feature decoding module, which utilizes a transformer. The decoding features are subsequently input into the text-driven contrastive learning module. Finally, fine-grained visual grounding heads are employed to generate the final prediction results. Each head consists of two branches: the regression branch and the classification branch. Unlike previous studies, SAC-VGNet integrates both textual and visual features to address the misclassification issue encountered in fine-grained visual grounding.

3.1. Background

Contrastive language-image pretraining (CLIP). CLIP [28] has achieved notable success in aligning two modalities in the embedding space. Technically, CLIP adopts contrastive learning with high-capacity language models and visual feature encoders to capture compelling visual concepts for image classification. Therefore, CLIP could offer priori knowledge to capture the complex correlations between visual and textual modalities.
Transformer. Transformer [25] uses stacked self-attention and fully connected layers for both the encoder and decoder. The core component of the Transformer encoder is the attention module, which is described as mapping a query and a set of key-value pairs to an output. The cross-attention operation could efficiently explore the correlations between two different modalities and, thus, it could help mine the complex correlations between visual and textual modalities in our approach.
Byte pair encoding (BPE). BPE [54] is a practical middle ground between character-level and word-level language modeling, which could effectively interpolate between word-level inputs for frequent symbol sequences and character-level inputs for infrequent symbols. Compared to other text-encoding approaches, BPE could better explain the semantic meanings of words.

3.2. Multi-Scale Cross-Modal Fusion

Multi-scale cross-modal fusion first encodes textual and visual features for a given image, respectively, and then fuses them at a multi-scale level to offer robust fusion features for visual grounding. Next, we will elaborate on them.
Textual and visual feature encoding. Given an image I R 3 × H × W and a corresponding referring text T R B , where H and W are the height and width of I , respectively, and B represents the word length of T , we first adopt the backbone in YOLOv7 [24] as the image encoder to extract multi-scale visual features { F v l } l = 1 L R C l × H s l × W s l , where C l is the feature dimension in the l-th layer and s l is the scale factor. YOLOv7 uses extended efficient layer aggregation networks (E-ELAN), RepConv [55], and auxiliary head modules to improve the accuracy of real-time visual grounding without increasing the reasoning cost. The multi-scale visual features could provide global abstract representation as well as local discriminative representation to support fine-grained classification. Meanwhile, the text sequence is encoded by lower-cased byte pair encoding (BPE), and is bracketed with [sos] and [eos] tokens, which represent the start and end of a sequence, respectively. We utilize the text encoder of CLIP [28] to extract the semantic information of T to obtain a representative textual feature F t R C t × B , which is further flattened F s R C s . CLIP has an exceptional ability to align text and images. It is trained on a wide variety of images with abundant natural language supervision available on the internet. This training enables CLIP to effectively locate visual pixels through textual semantics during subsequent multi-modal fusion.
Multi-modal feature fusion. In order to incorporate positional information into the fused features, we generate a coordinate map of the size H s l × W s l × D s p a t i a l as the spatial features, where D s p a t i a l indicates the channel of the spatial features. Following the modality fusion approach in [1], we first map the visual and text features to the same scale and then use the concatenate operation to fuse the visual, text, and spatial features. Finally, we supply F v l , F s , and F c o o r d to generate an initial multi-modal feature F m l as follows:
F m l = C o n v ( [ R e l u ( F v l W v l ) , R e l u ( F s W s ) , F c o o r d ] ) ,
where [,] is the concatenation operation, C o n v ( ) denotes a 2D 1 × 1 convolution, and W v l and W s are the learnable matrices to eliminate the scale difference between F v l and F s . We refer readers to [56] for more details about the ReLu activation function. Since the initial multi-modal feature F m l is generated by concatenating both visual and textual features with the convolution operation, it cannot exceptionally align visual and textual features. Therefore, we pass it to the following modules for further refinement.

3.3. Multi-Scale Cross-Modal Feature Decoding

The multi-scale cross-modal feature decoder aims to generate discriminative multi-scale multi-modal features, which consist of a multi-head self-attention layer, a multi-head cross-modal attention layer, and a feed-forward neural layer (see Figure 3). Concretely, given the encoding feature F m l and the textual feature F t , we first concatenate the fixed positional encoding [1,25] with the input to accurately capture the positional text-to-pixel information. Then, F m l is sent into the multi-head self-attention layer for global attention to highlight the important areas in I as follows:
F m l = M H S A ( L N ( F m l ) ) + F m l ,
M H S A ( Q , K , V ) = S o f t m a x ( Q K T d k ) V ,
where F m l represents the attention features, M H S A ( · ) and L N ( · ) represent multi-head self-attention and layer normalization [57] respectively. Q R N × d q , K R N × d k , V R N × d v denote the query, key, and value, respectively, which are obtained by three point-wise linear layers mapped F m l to intermediate representations. The Softmax function can convert a vector of d k real numbers into a d k -dimensional probability distribution. On this basis, the multi-head cross-modal attention layer executes the cross-modal attention on F m l and F t to generate the cross-attention multi-modal feature F c l , as follows:
F c l = M H C A ( L N ( F m l ) , F t ) + F m l .
Since F t provides salient text descriptions of objects, it can assist in identifying the corresponding features that distinguish different objects. Based on this assumption, cross-modal attention enables the exploration of correlations between F m l and F t , resulting in a highlighted multi-modal feature that effectively captures the subtle differences between similar objects. Finally, we input F c l into an M L P in the form of layer normalization and residual connection, as follows:
F c l = M L P ( L N ( F c l ) ) + F c l ,
where F c l R C × H s l × W s l is the transformed multi-modal feature in the l-th layer, and each pixel in F c l is represented as a C-dimensional multi-modal feature vector for the following alignment.

3.4. Text-Driven Contrastive Learning

The text feature F t of a given image only represents the objects in that image, and there are still background features in the multi-modal feature F c l . Therefore, there is an accurate alignment between the text feature F t and the multi-modal feature F c l , with the expectation that F t is similar to the object features in F c l , and dissimilar to the background features in F c l .
We introduce the text-to-pixel contrastive learning loss [29] to implement it. Concretely, we first project F c l and F t into the feature spaces z c l R D × N l and z t R D , respectively:
z c l = F c l W c + b c ,
z t = F t W t + b t ,
where W c and W t are learnable matrices that are responsible for mapping F c and F t to the same dimension D, and b c and b t are learnable biases.
The core of text-to-pixel contrastive learning is to improve the similarity between the text projection z t and the related pixel-level projection in z c l , while suppressing the response of the unrelated part in z c l . Motivated by this, we use the dot product to measure the similarity, and express the text-to-pixel contrastive learning loss as follows:
L c o n j ( z t , z c l j ) = l o g ( σ ( z t · z c l j ) ) , j P , l o g ( 1 σ ( z t · z c l j ) ) , j N ,
where z c l j represents the feature vector of the j-th pixel in z c l . Moreover, P and N record the positive and negative pixel sets in the ground truth, respectively. The sigmoid function σ is applied to output a probability value between 0 and 1. A large similarity between z t and z c l j indicates a high alignment between the text feature and the multi-modal feature for the positive pixel, while a small similarity indicates a low alignment for the negative pixel. During the optimization process, the contrastive learning loss gradually converges to encourage z t to be similar to the positive features in z c l and dissimilar to the negative ones. This encourages the model to capture more discriminative features. Finally, our contrastive learning loss on multi-scale features can be expressed as follows:
L c o n ( z t , z c ) = 1 | P N | l = 1 L j P N L c o n j ( z t , z c l j ) ,
The contrastive learning loss could nicely align the pixel-level projection z c l with the text projection z t to pay more attention to the key areas and distinctive features. As a result, the projected multi-modal feature could provide more fine-grained information for distinguishing similar objects in our task.

3.5. Training

Given the multi-modal feature F c l , we employ the YOLOv7’s predictor for fine-grained visual grounding. The predictor is composed of two branches: the regression branch and the classification branch. The regression branch adopts the regression loss L r e g to measure the localization of error, and the classification branch uses the classification loss L c l s to calculate the classification error between prediction and ground truth. In our task, it is necessary to distinguish the tiny differences in similar categories, and the previous approaches lack sufficient capacity in discriminative feature extraction, yielding unsatisfactory classification accuracy. Comparatively, our model introduces the third branch, called “contrastive learning branch”, to learn more discriminative multi-modal features. As aforementioned, the contrastive learning branch adopts the text-to-pixel contrastive learning loss, and the final loss function could be expressed as
L = L r e g + L c l s + β L c o n ,
where β denotes the balance weight. Different from the previous approaches, our approach propagates three estimation errors (position error, classification error, and feature alignment error) to update our model through joint training. Benefiting from the text features, as well as the feature alignment by contrastive learning, our model could learn more discriminative multi-modal features to support fine-grained visual grounding.

4. Experiments

In this section, we first introduce our datasets and experimental settings, followed by the illustration of the experimental results with a detailed analysis.

4.1. Datasets

We conducted experiments on two challenging datasets: the Military Aircraft Dataset [58] (https://www.kaggle.com/datasets/a2015003713/militaryaircraftdetectiondataset, (accessed on 27 April 2023)) and the FGVC Aircraft Dataset [59] (https://www.robots.ox.ac.uk/vgg/data/fGVCAircraft/, ( accessed on 27 April 2023)), which are widely used to evaluate fine-grained object detection and visual grounding.
The Military Aircraft Dataset (MAD) is one of the commonly used fine-grained object detection datasets with 40 aircraft types with bounding boxes recorded in the PASCAL VOC format ( x m i n , y m i n , x m a x , y m a x ). It consists of 7177 JPEG images with two resolutions ( 1280 × 1280 , 640 × 640 ) for 12 , 337 objects collected from the website via a ‘Google Images’ search, which are manually split into 5365 for training, 1330 for validation, and 482 for testing, respectively. We invited 10 people to manually annotate textual expressions. Before annotation, we selected four discriminative properties (“engine”, “propeller”, “wing”, and “tail”), and told the annotators that the text descriptions should include all four properties. Then, the annotators followed the instructions to give detailed descriptions to each object in an image, as Figure 4a shows, where two different aircraft may have different—or the same—text descriptions. As a result, there are a total of 8137 referring expressions, and each image contains one or more expressions with an average length of 30 words for visual grounding.
The FGVC Aircraft Dataset (FAD) organizes aircraft into a four-level hierarchy: model, variant, family, and manufacturer. We use ’variant’ as the category label. It contains 10 , 000 JPEG images with two kinds of resolutions ( 1280 × 1280 , 640 × 640 ) for 100 different aircraft variants; each variant contains 100 images. The train/test set split ratio is around 2:1, resulting in 6667 samples for training, and 3333 samples for testing. For text annotation, we describe the following aircraft features, “fuselage”, “wing”, “tail”, and “engine”, respectively, as Figure 4b shows. There are a total of 10 , 200 referring expressions, and each expression has an average length of 30 words.
To support future research, we uploaded our datasets with text annotations to the following website: (https://github.com/XuZhang1211/SAC-VGNet, (accessed on 27 April 2023)).

4.2. Implementation Details

The initial YOLOv7 model was pre-trained on the COCO dataset [60] with K-means clustering, and we removed the last layer in YOLOv7 as the visual encoder. For the textual encoder, we employed the pre-trained model on CLIP. Given an input image, we kept the original image ratio and resized it to 640 × 640 by padding. To expand training data, we adopted data augmentation as [24], including adding randomization to the color space (saturation and intensity), horizontal flipping, and random affine transformations. For the textual input, we set the max size of a sentence as 30 for both datasets. The multi-scale cross-decoding adopted Transformer with 4 heads, and the feed-forward hidden dimension was set to 1024. Following the same evaluation protocol in prior works [24], we adopted mean average precision (mAP) to verify the effectiveness of the Military Aircraft detection and FGVC Aircraft datasets. Moreover, L r e g uses the L1 loss, and L c l s uses focal loss [61]. We used PyTorch to implement our algorithm and trained the model with a batch size of 32 on 4 NVIDIA RTX A6000 with 48 GPU VRAM. The model was trained by SGD optimization with a momentum coefficient of 0.9 . The initial learning rate was set to 0.005 , and the coefficient of weight decay was set to 0.0001 for every 20 epochs. We executed 300 epochs to generate the final detection model.

4.3. Experimental Results

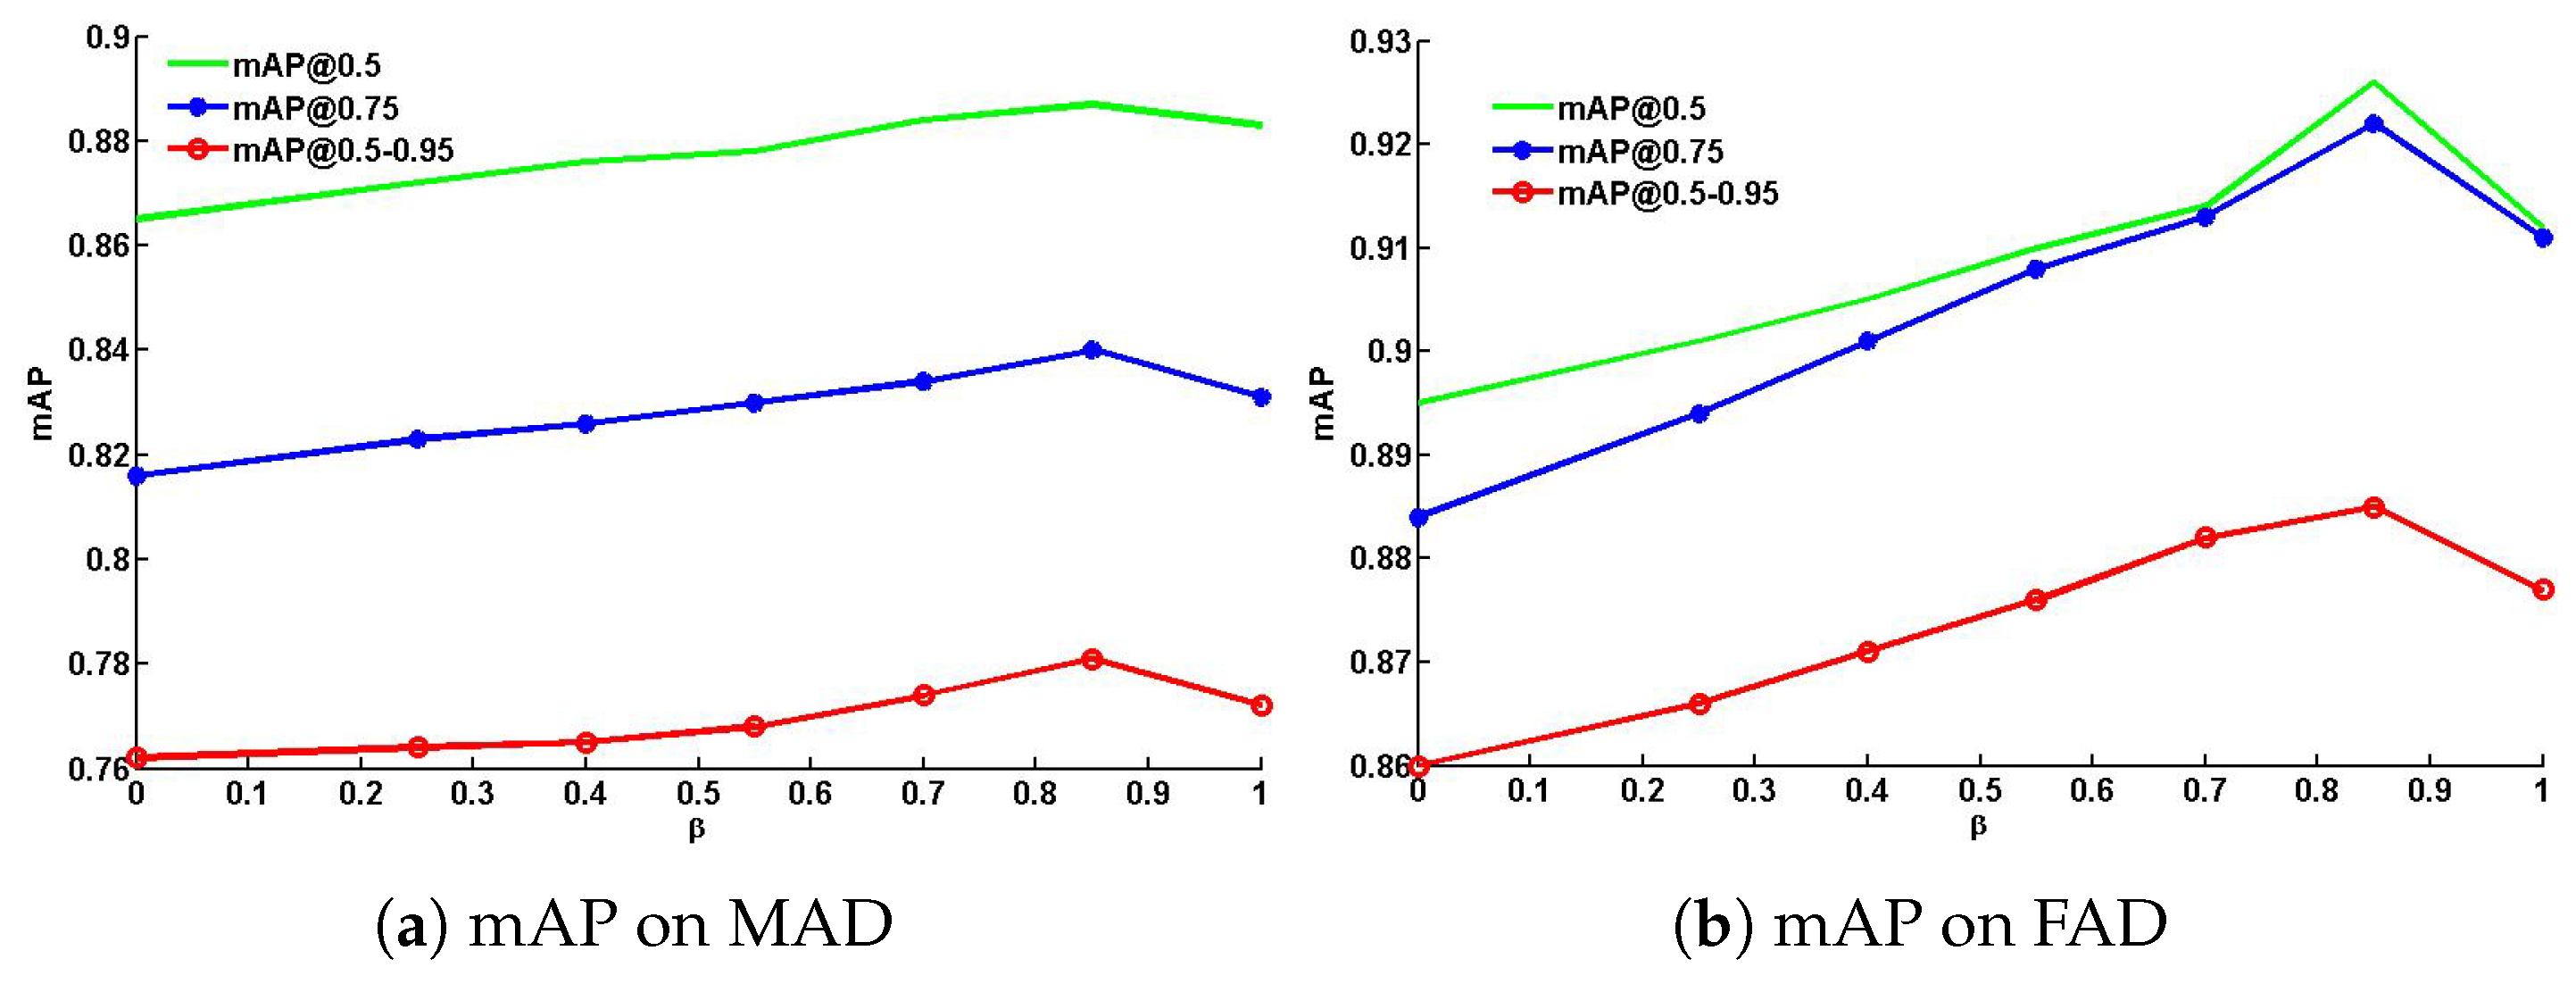
4.3.1. Parameter Analysis

In this experiment, we try different weights ( β = { 0 , 0.25 , 0.4 , 0.55 , 0.7 , 0.85 , 1 } ) in Equation (10) to observe the performance change. Figure 5 demonstrates the performance trends with respect to different β on MAD and FAD datasets, respectively. It is demonstrated that the best performance arises when β = 0.85 . This result proves the effectiveness of our text-driven contrastive learning because the contrastive learning loss could nicely align the pixel-level projection with the text projection, and pay more attention to the key areas and distinctive features. As a result, the projected multi-modal feature could provide more fine-grained information for distinguishing between similar objects in our task. Moreover, the further decrease of β leads to a performance drop because the utility of text-driven contrastive learning is overshadowed. Comparably, the too-large value of β also leads to a performance drop since the detection head is weakened, yielding unreliable prediction results.

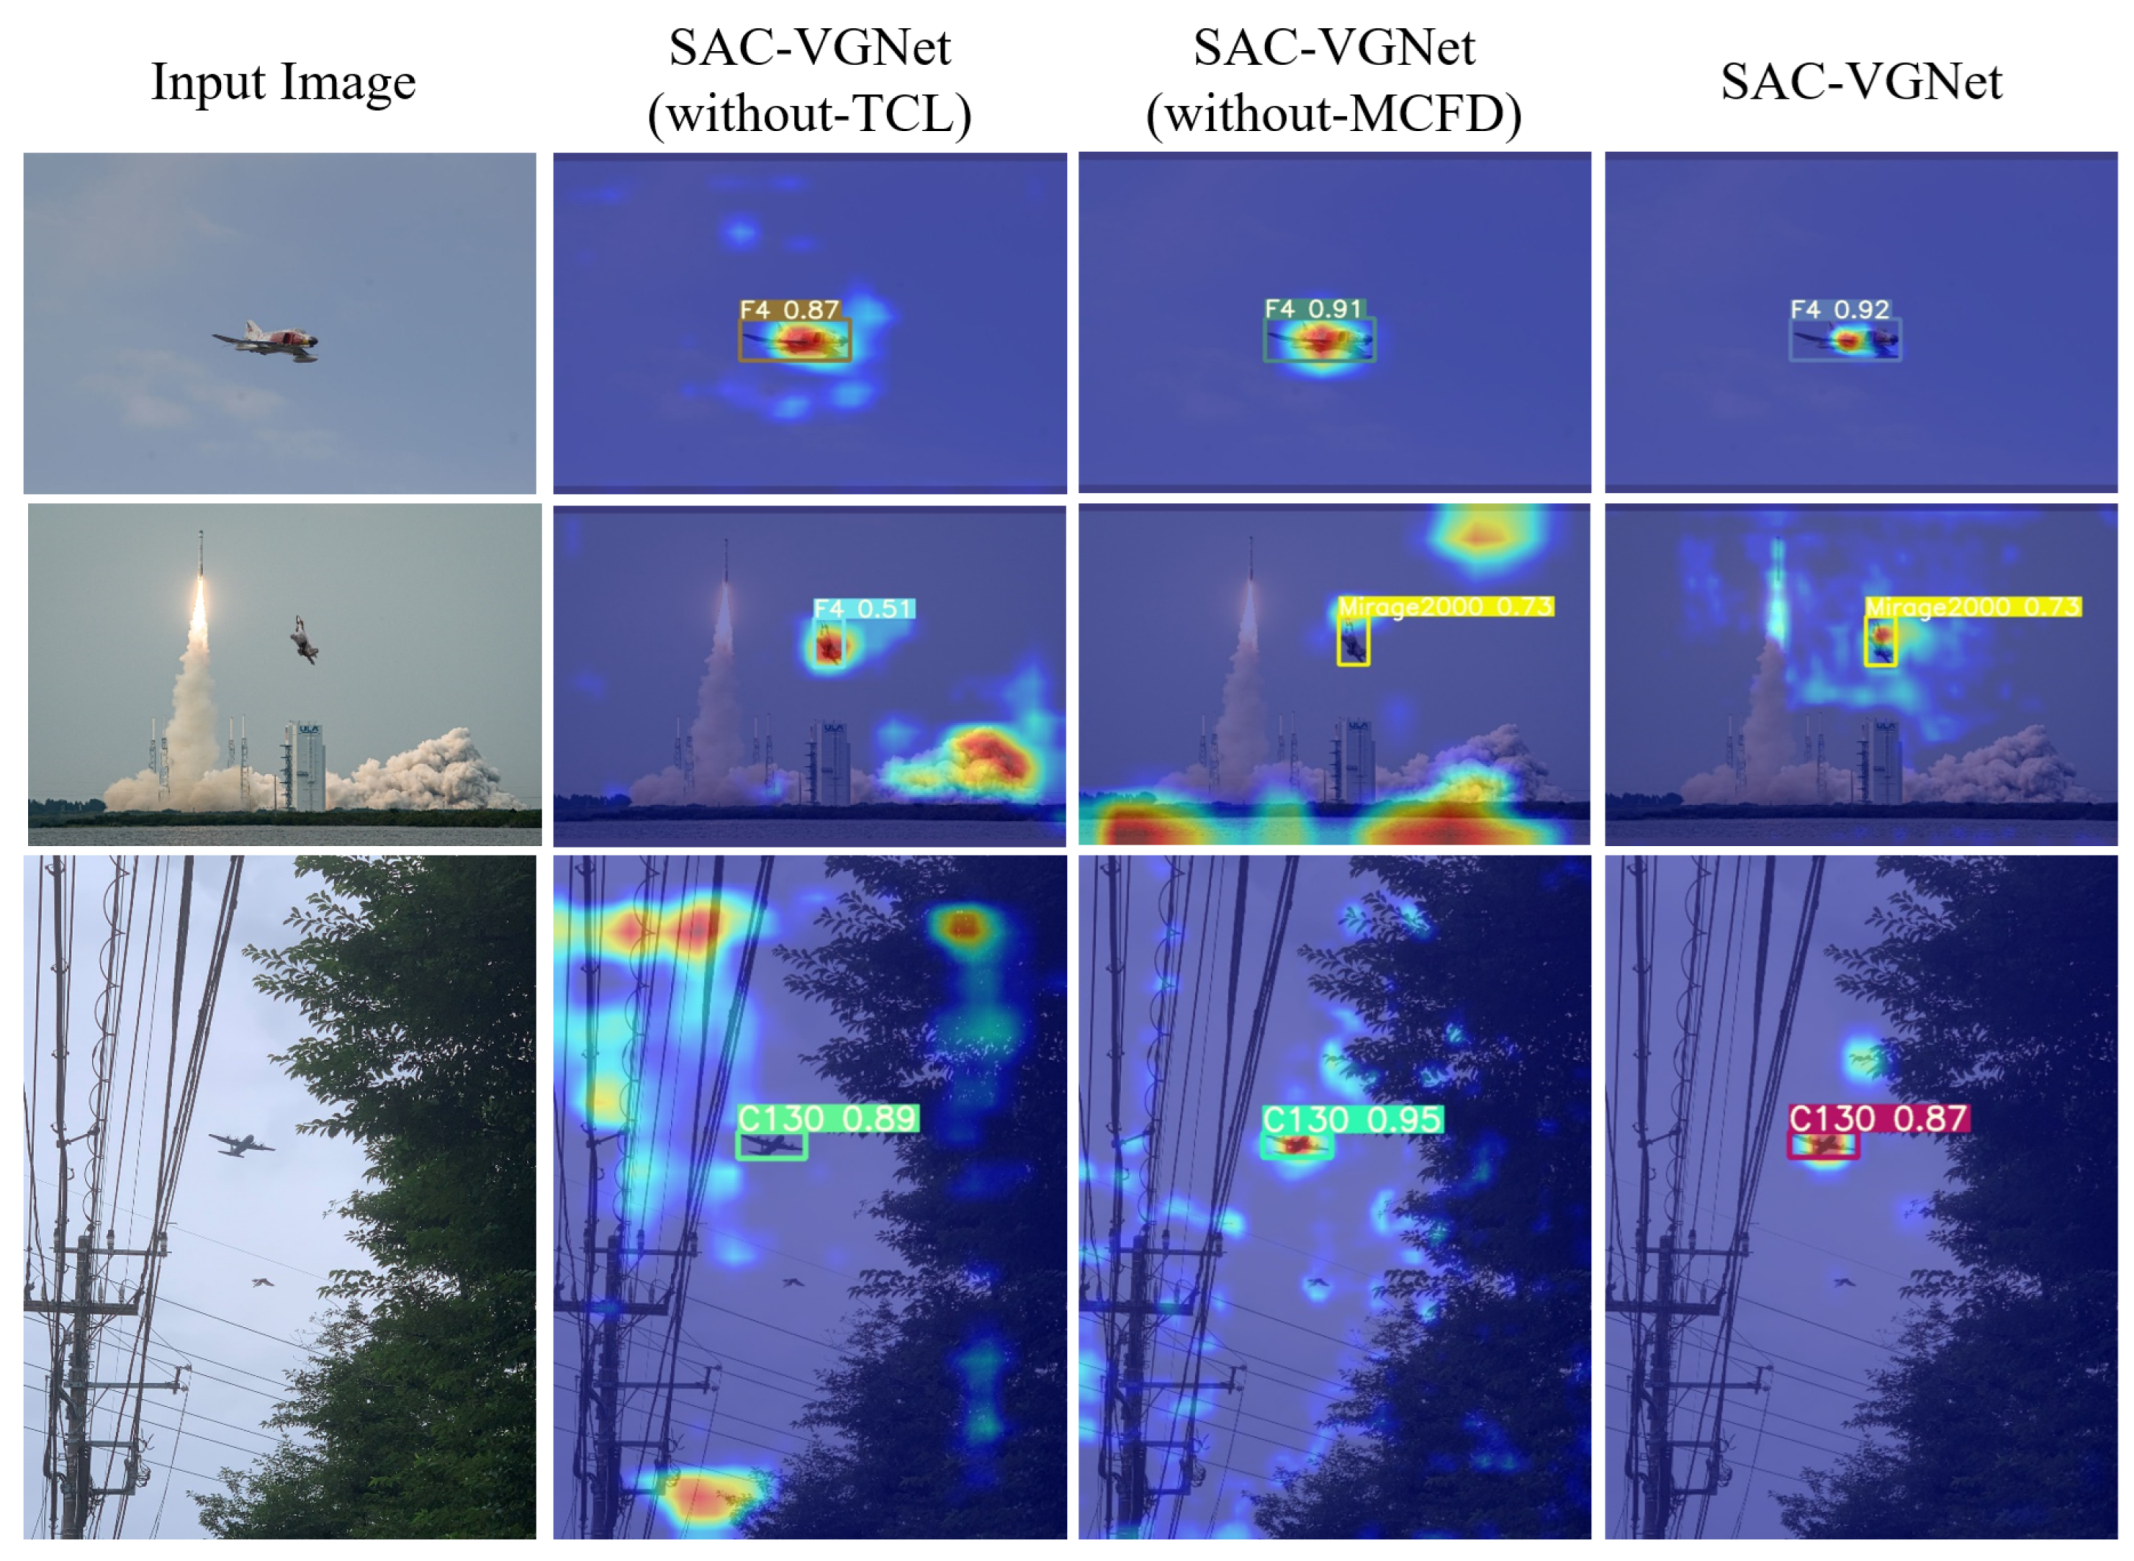
4.3.2. Ablation Study

This experiment verifies the utilities of multi-scale cross-modal feature decoding (MCFD) and text-driven contrastive learning (TCL). Table 1 and Table 2 demonstrate the comparison results on MAD and FAD datasets, respectively, where MCFD “-” indicates that the initial multi-modal feature in Equation (1) is used for the following detection without MCFD, and TCL “-” means that text-driven contrastive learning is not trained in our model. From the tables, we can draw the following conclusions:
1.
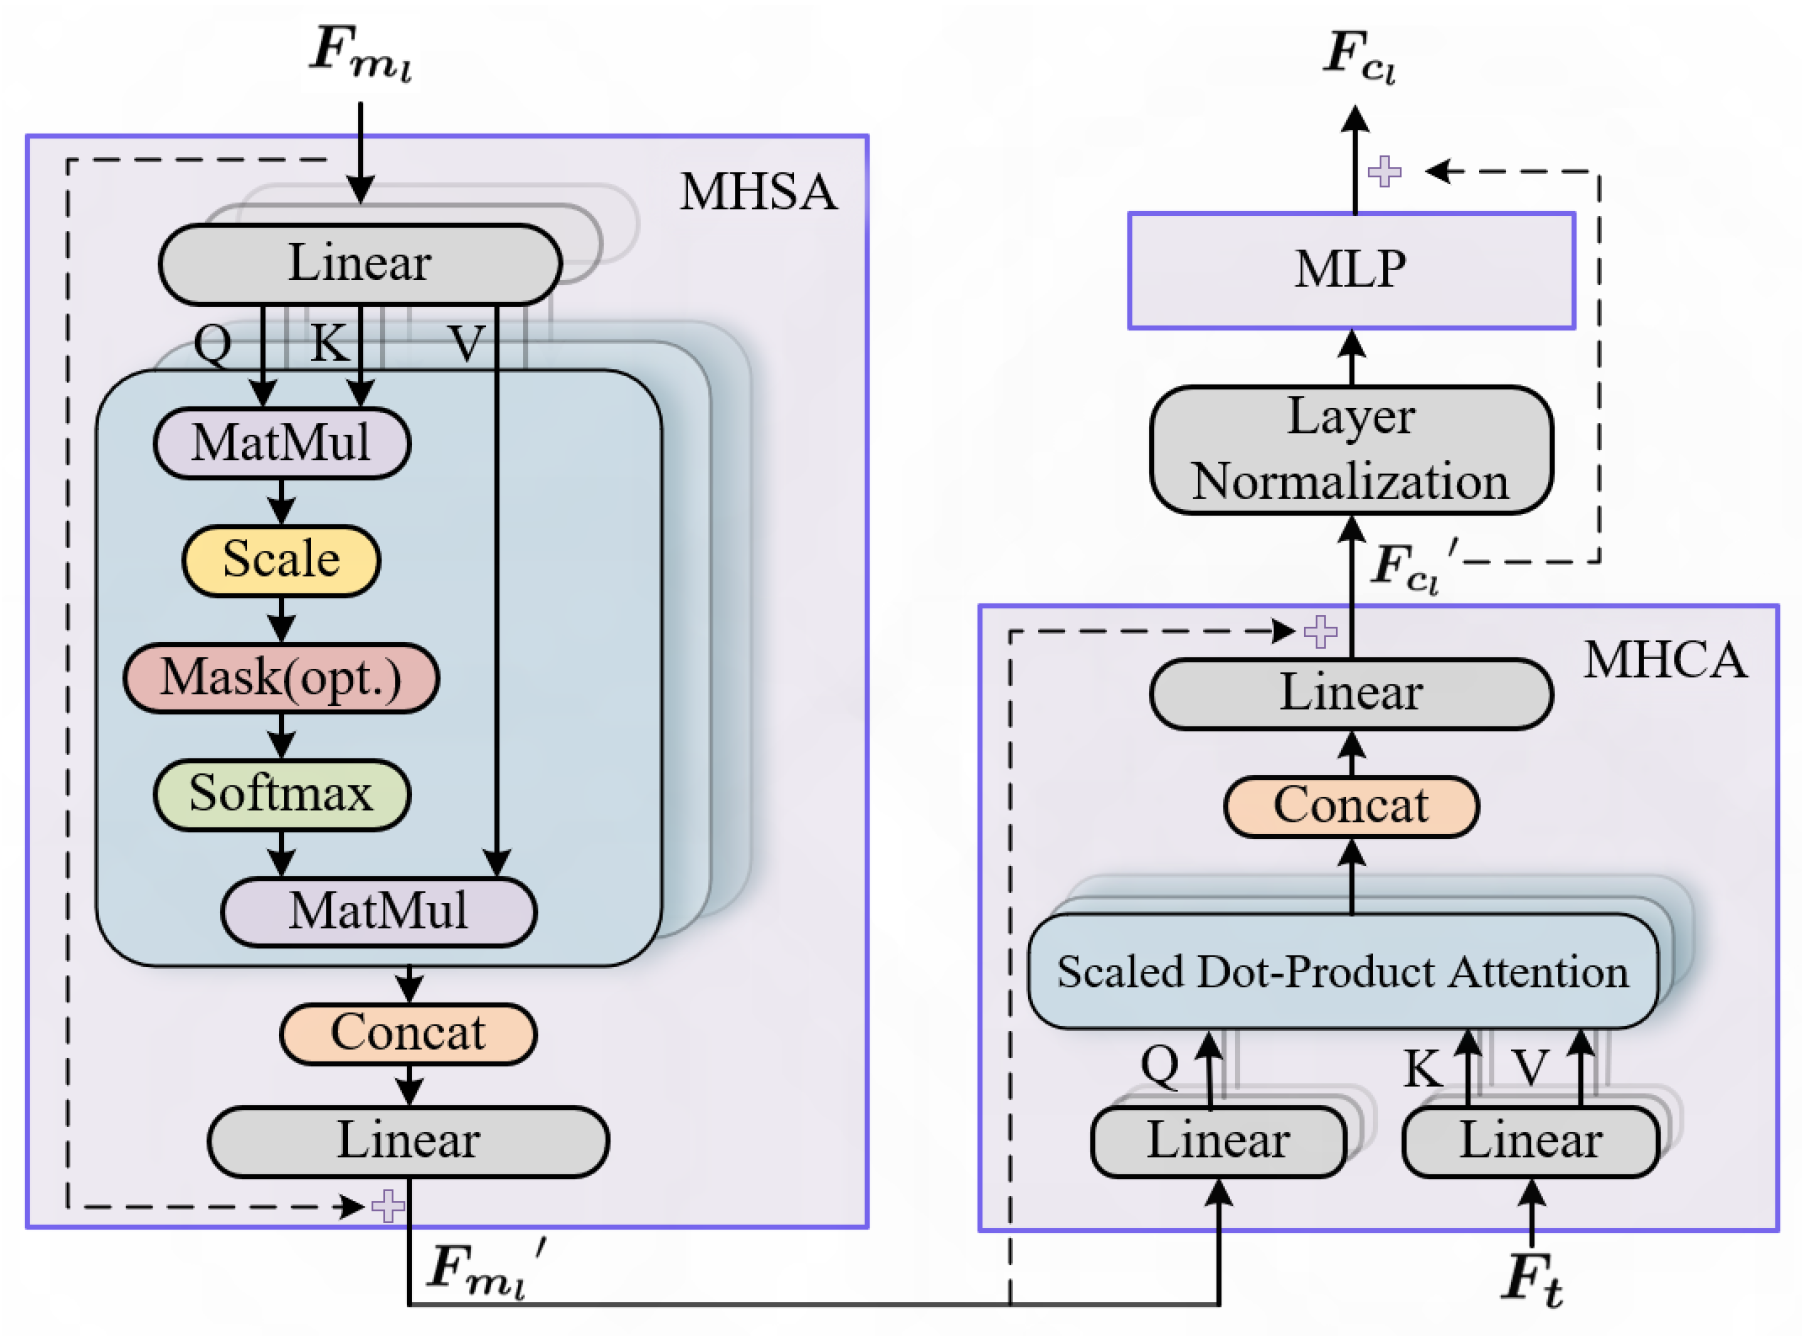
The introduction of multi-scale cross-modal feature decoding significantly improves the performance, increasing the mAP from 0.758 to 0.768 on MAD, and from 0.862 to 0.873 on FAD. As aforementioned, the cross-modal attention in MCFD could nicely explore the correlations between the text feature and the multi-modal feature and, thus, the highlighted multi-modal feature could nicely capture the tiny differences between similar objects.
2.
The text-driven contrastive learning boosts the performance by about 1 percent in both datasets. This improvement stems from the effective feature alignment by contrastive learning, which could help the model learn discriminative features to distinguish tiny differences between similar objects.
3.
Our SAC-VGNet (incorporating both components) achieves the best performance, with an mAP of 0.781 on MAD, and 0.885 on FAD. These remarkable results indicate the effectiveness of SAC-VGNet in fine-grained visual grounding because it could effectively fuse textual and visual features.
Figure 6 lists three examples to illustrate the heatmap results by SAC-VGNet. Without MCFD or TCL, the heat maps are more decentralized, and cannot nicely capture key objects. As a result, the extracted features often contain noisy information, resulting in detection errors. Comparably, SAC-VGNet could focus on key objects to extract discriminative features.

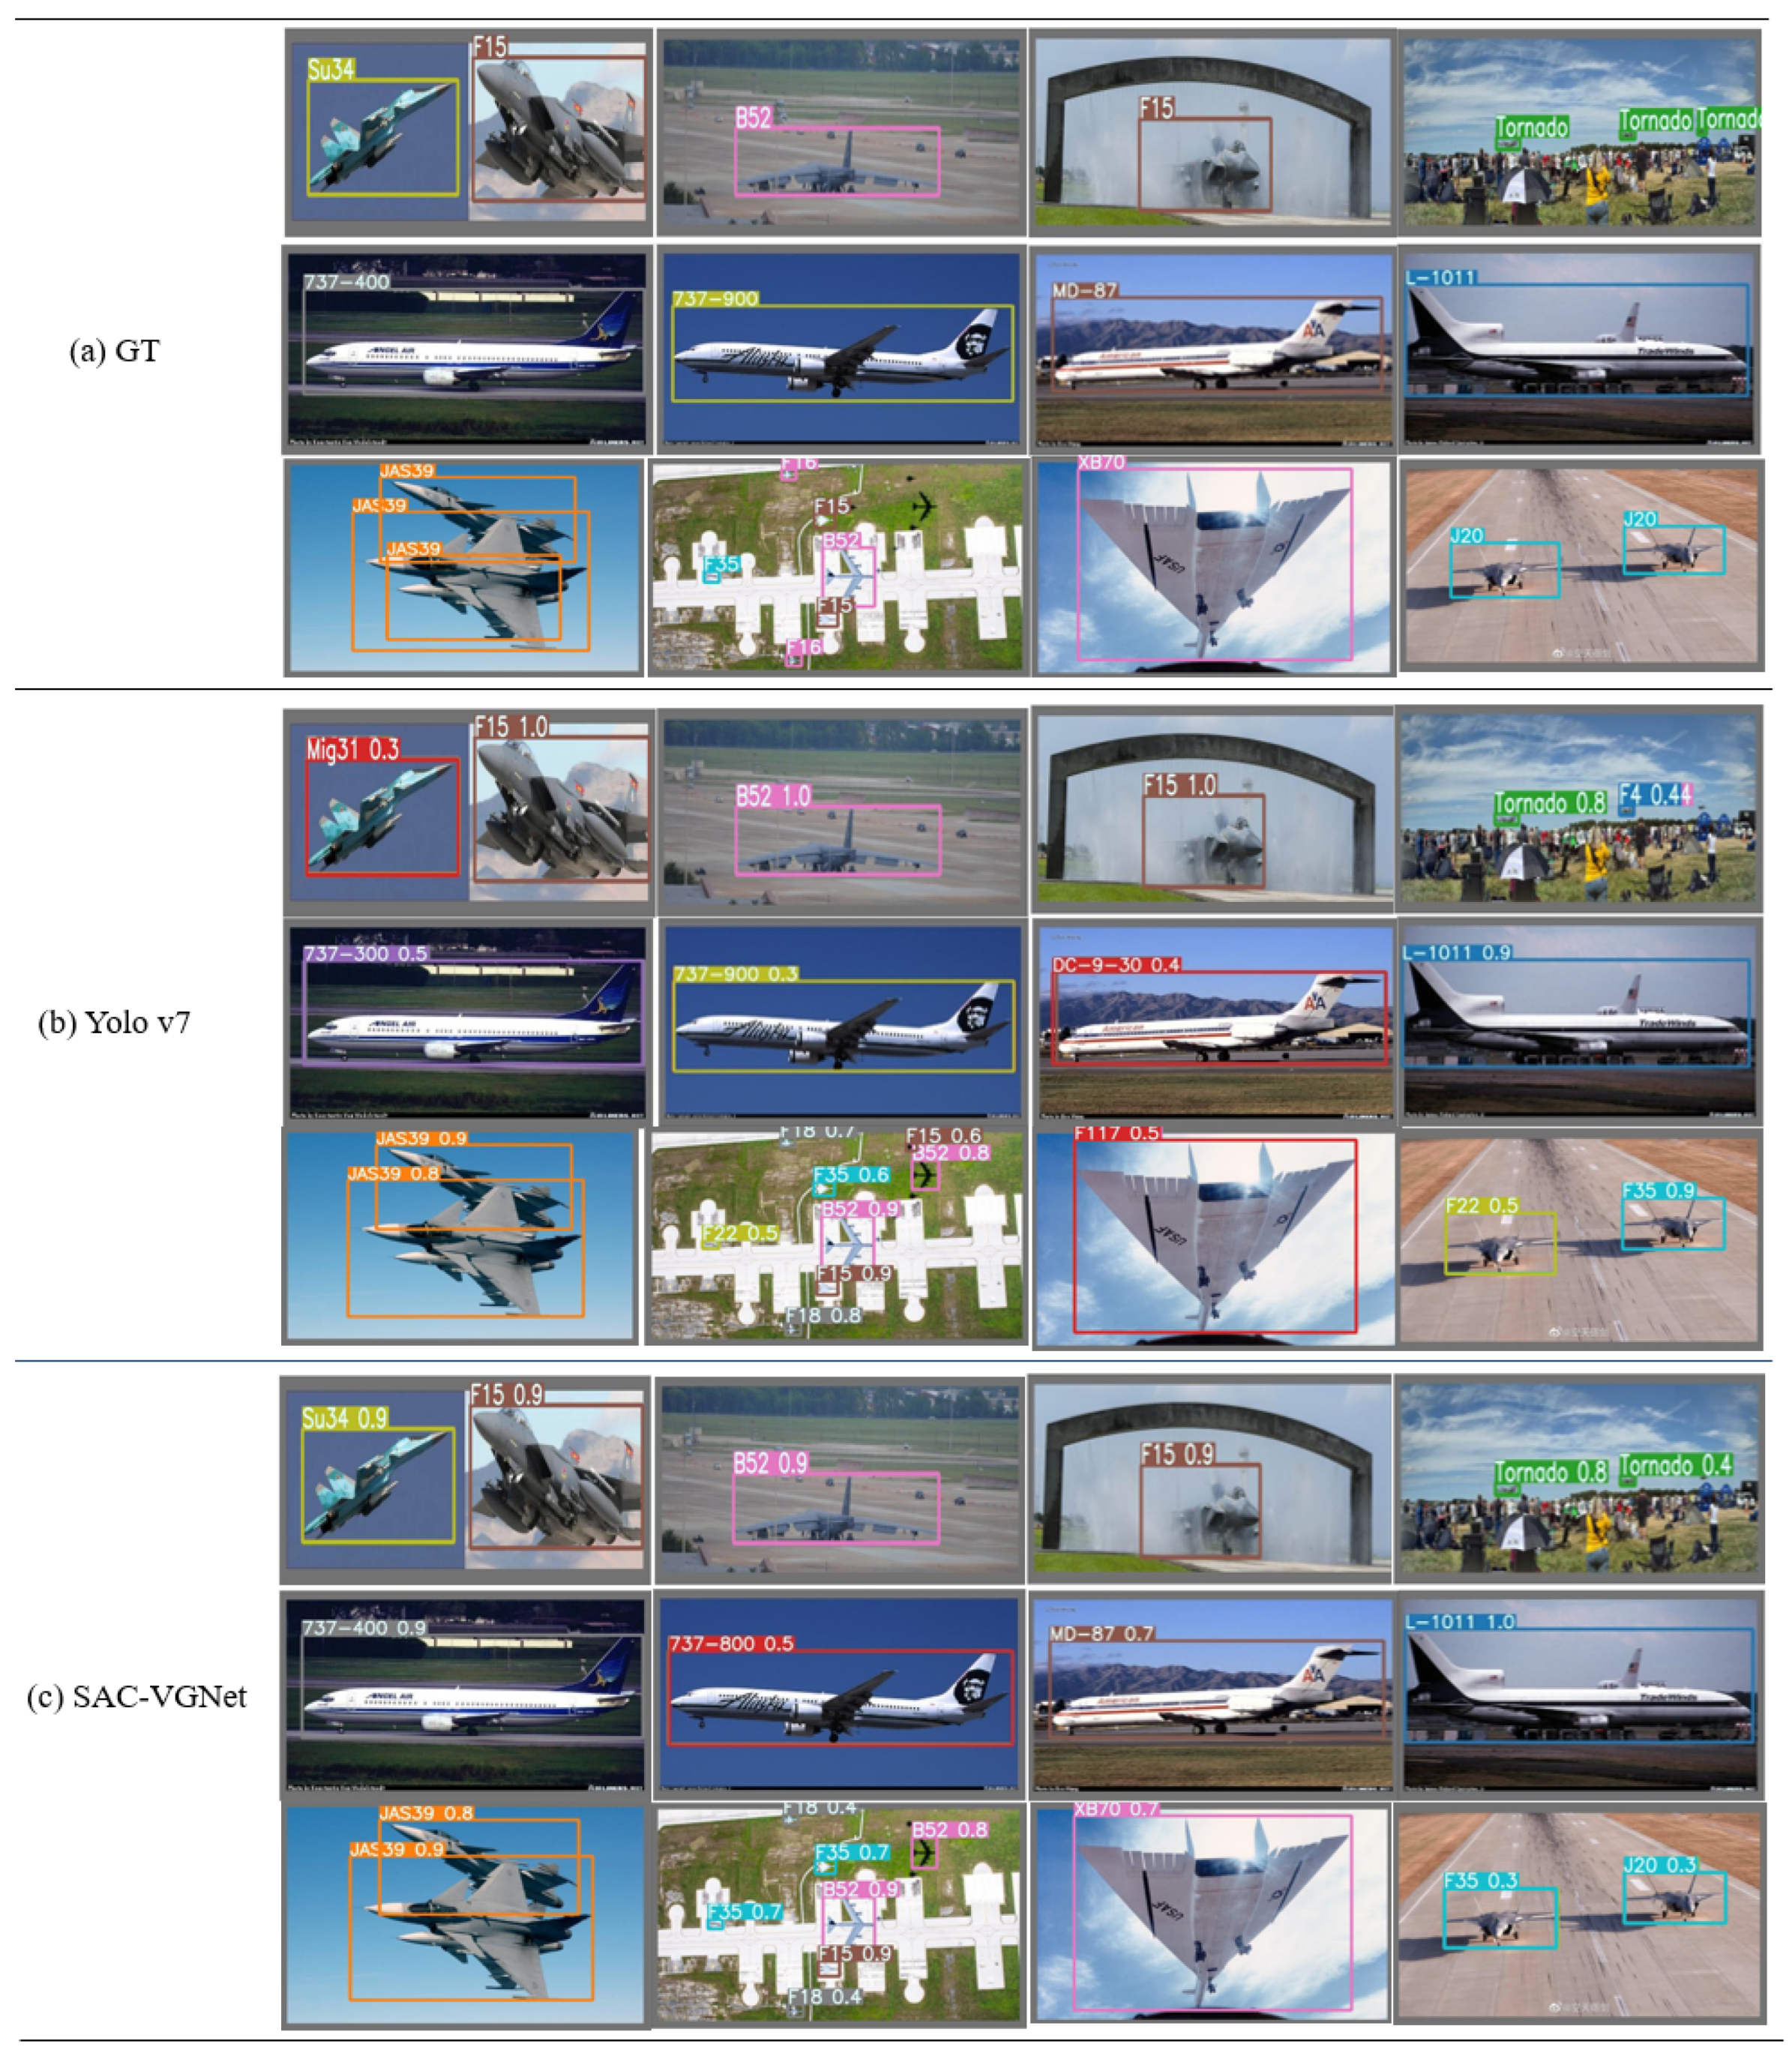
4.3.3. Comparison with the State-of-the-Art Approaches

Finally, we compare our approach with several state-of-art approaches; Table 3 and Table 4 show the comparison results. It is demonstrated that our model substantially and consistently outperforms the state-of-the-art methods on both datasets, with about 1 to 3 percentage improvements. First, DETR and Deformable DETR demonstrate poorer performances as compared to YOLO and R-CNN, this is because DETR adopts query point features to discriminate extremely similar objects, and these discriminative query points are difficult to be found sometimes. Second, YOLO and R-CNN only employ visual features to discriminate between different objects, and the performance significantly depends on the feature extraction network. When the network cannot explore the discriminative features, the prediction is wrong. In comparison, this impressive performance of our approach stems from two aspects: (1) SAC-VGNet introduces text descriptions that incorporate visual representations, and the proposed multi-scale cross-modal fusion module could effectively fuse them to capture the tiny differences between similar categories. (2) SAC-VGNet adopts text-driven contrastive learning to align both text and multi-modal features. As a result, the learned feature could better distinguish different categories.
Table 5 demonstrates the detailed results in each category between YOLOv7 and SAC-VGNet. Among the 40 categories, our approach outperforms YOLOv7 in 37 categories, and is worse in 3 categories. For instance, the mAP on “Su34” is increased by 7.5 % by our approach since the introduction of text information on “Su34” could help our model better distinguish from other categories. On the other hand, we also discover that SAC-VGNet results in a slight performance drop in “B1”, “Be200”, and “Rafale”. We assume that these three categories have similar text descriptions with other visually similar categories and, thus, the introduction of text information cannot well distinguish them.
Table 6 lists the resource requirement results. Since our SAC-VGNet is built on YOLOv7, by adding the multi-modal fusion module, it requires more resources and achieves a lower testing speed as compared to YOLOv7 with 21 FPS. Compared to Deformable DETR/DERT, our approach consumes fewer computations and achieves a faster speed to yield better detection accuracy for fine-grained visual grounding.
Figure 7 shows the detection results of 12 testing images from both datasets. We can see that our method can correctly detect the aircraft types, while YOLOv7 generates some detection errors. For instance, “Su34” is misclassified as “Mig31” in the first example. Even in the case of small targets and complex surroundings (see the fourth example), our method could correctly recognize the category, and YOLOv7 may generate detection errors. We also discovered the detection error in our approach in the bottom left example of the third row, with several small, dense objects in different categories in an image. In such a case, the corresponding text descriptions are mixed, which would confuse the model in discriminating between these different objects.

5. Limitations

There are some limitations to our approach: First, when our approach is applied to large-scale datasets, data annotation is a potential limitation, which not only requires a lot of manpower and time but also involves specialized knowledge for description generation. Second, the comparisons between our approach and the state-of-the-art methods are not strictly conducted on the same datasets, which requires further exploration of the effectiveness of the proposed approach on existing visual grounding datasets.

6. Conclusions

In this paper, we a proposed semantic-aligned cross-modal visual grounding network with transformers (SAC-VGNet) to learn discriminative multi-modal features for fine-grained visual grounding. Our approach is different from the previous studies in that it integrates both visual and textual inputs, and exploits the effective multi-modal feature generation to exceptionally capture the tiny differences between similar objects. Technically, we designed a multi-scale cross-modal fusion module to effectively fuse both visual and textual features, and text-driven contrastive learning was employed to provide accurate feature alignment at the pixel level. We manually annotated text descriptions on two fine-grained visual grounding datasets, and the experimental results demonstrated that SAC-VGNet yields promising performance for fine-grained visual grounding. The SAC-VGNet visual grounding framework can be applied to many specific fields, such as visual grounding in medical images.
In the future, it will be possible to train several attribute detectors to automatically predict object attributes to replace text descriptions for labeling savings. In addition, several subclasses may have a few samples for the model’s training; thus, how to solve the few-shot problem may be an interesting topic. Moreover, the input quality, such as noisy or low-resolution images, may affect the model’s performance. In such a case, introducing a denoising AI algorithm with multi-task learning may be a potential solution.

Author Contributions

Conceptualization, J.Y.; methodology, Q.Z. and J.Y.; validation, Q.Z.; formal analysis, Q.Z.; data curation, Q.Z.; writing—original draft preparation, Q.Z. and J.Y.; writing—review and editing, Q.Z. and J.Y.; visualization, J.Y. All authors have read and agreed to the published version of the manuscript.

Funding

This work was supported by the National Natural Science Foundation of China (no. 62272157) and the National Natural Science Foundation of The Tenth Research Institute of China Electronics Technology Group Corporation, 2022-1432-04-03.

Informed Consent Statement

Informed consent was obtained from all subjects involved in the study.

Data Availability Statement

The data and code used to support the findings of this study are available from the corresponding author upon request (yuanjin@hnu.edu.cn).

Acknowledgments

The authors would like to thank the Assistant Editor of this article and the anonymous reviewers for their valuable suggestions and comments.

Conflicts of Interest

The authors declare no conflict of interest.

References

  1. Yang, Z.; Gong, B.; Wang, L.; Huang, W.; Yu, D.; Luo, J. A fast and accurate one-stage approach to visual grounding. In Proceedings of the IEEE/CVF International Conference on Computer Vision, Seoul, Republic of Korea, 27 October–2 November 2019; pp. 4683–4693. [Google Scholar]
  2. Xu, S.; Wang, X.; Lv, W.; Chang, Q.; Cui, C.; Deng, K.; Wang, G.; Dang, Q.; Wei, S.; Du, Y.; et al. PP-YOLOE: An evolved version of YOLO. arXiv 2022, arXiv:2203.16250. [Google Scholar]
  3. Fang, Y.; Liao, B.; Wang, X.; Fang, J.; Qi, J.; Wu, R.; Niu, J.; Liu, W. You only look at one sequence: Rethinking transformer in vision through object detection. Adv. Neural Inf. Process. Syst. 2021, 34, 26183–26197. [Google Scholar]
  4. Li, Y.; Wang, H.; Dang, L.M.; Nguyen, T.N.; Han, D.; Lee, A.; Jang, I.; Moon, H. A deep learning-based hybrid framework for object detection and recognition in autonomous driving. IEEE Access 2020, 8, 194228–194239. [Google Scholar] [CrossRef]
  5. Reddy, S.; Levine, S.; Dragan, A.D. First Contact: Unsupervised Human-Machine Co-Adaptation via Mutual Information Maximization. arXiv 2022, arXiv:2205.12381. [Google Scholar]
  6. Wang, Z.; Xia, M.; Lu, M.; Pan, L.; Liu, J. Parameter Identification in Power Transmission Systems Based on Graph Convolution Network. IEEE Trans. Power Deliv. 2022, 37, 3155–3163. [Google Scholar] [CrossRef]
  7. Shuai Zhang, L.W. STPGTN–A Multi-Branch Parameters Identification Method Considering Spatial Constraints and Transient Measurement Data. Comput. Model. Eng. Sci. 2023, 136, 2635–2654. [Google Scholar] [CrossRef]
  8. Chen, B.; Xia, M.; Qian, M.; Huang, J. MANet: A multi-level aggregation network for semantic segmentation of high-resolution remote sensing images. Int. J. Remote Sens. 2022, 43, 5874–5894. [Google Scholar] [CrossRef]
  9. Ma, Z.; Xia, M.; Weng, L.; Lin, H. Local Feature Search Network for Building and Water Segmentation of Remote Sensing Image. Sustainability 2023, 15, 3034. [Google Scholar] [CrossRef]
  10. Lu, C.; Xia, M.; Lin, H. Multi-scale strip pooling feature aggregation network for cloud and cloud shadow segmentation. Neural Comput. Appl. 2022, 34, 6149–6162. [Google Scholar] [CrossRef]
  11. Chen, J.; Xia, M.; Wang, D.; Lin, H. Double Branch Parallel Network for Segmentation of Buildings and Waters in Remote Sensing Images. Remote Sens. 2023, 15, 1536. [Google Scholar] [CrossRef]
  12. Ren, S.; He, K.; Girshick, R.; Sun, J. Faster r-cnn: Towards real-time object detection with region proposal networks. Adv. Neural Inf. Process. Syst. 2015, 28. [Google Scholar] [CrossRef] [PubMed]
  13. Lin, T.Y.; Dollár, P.; Girshick, R.; He, K.; Hariharan, B.; Belongie, S. Feature pyramid networks for object detection. In Proceedings of the IEEE Conference on Computer Vision and Pattern Recognition, Honolulu, HI, USA, 21–26 July 2017; pp. 2117–2125. [Google Scholar]
  14. Ma, Z.; Xia, M.; Lin, H.; Qian, M.; Zhang, Y. FENet: Feature enhancement network for land cover classification. Int. J. Remote Sens. 2023, 44, 1702–1725. [Google Scholar] [CrossRef]
  15. Redmon, J.; Divvala, S.; Girshick, R.; Farhadi, A. You only look once: Unified, real-time object detection. In Proceedings of the IEEE Conference on Computer Vision and Pattern Recognition, Las Vegas, NV, USA, 27–30 June 2016; pp. 779–788. [Google Scholar]
  16. Chen, Q.; Wang, Y.; Yang, T.; Zhang, X.; Cheng, J.; Sun, J. You only look one-level feature. In Proceedings of the IEEE/CVF Conference on Computer Vision and Pattern Recognition, Virtual Conference, 19–25 June 2021; pp. 13039–13048. [Google Scholar]
  17. Li, X.; Wang, W.; Hu, X.; Li, J.; Tang, J.; Yang, J. Generalized focal loss v2: Learning reliable localization quality estimation for dense object detection. In Proceedings of the IEEE/CVF Conference on Computer Vision and Pattern Recognition, Virtual Conference, 19–25 June 2021; pp. 11632–11641. [Google Scholar]
  18. Zhang, C.; Weng, L.; Ding, L.; Xia, M.; Lin, H. CRSNet: Cloud and Cloud Shadow Refinement Segmentation Networks for Remote Sensing Imagery. Remote Sens. 2023, 15, 1664. [Google Scholar] [CrossRef]
  19. Carion, N.; Massa, F.; Synnaeve, G.; Usunier, N.; Kirillov, A.; Zagoruyko, S. End-to-end object detection with transformers. In Proceedings of the European Conference on Computer Visionm, Glasgow, UK, 23–28 August 2020; Springer: Cham, Switzerland, 2020; pp. 213–229. [Google Scholar]
  20. Kamath, A.; Singh, M.; LeCun, Y.; Synnaeve, G.; Misra, I.; Carion, N. MDETR-modulated detection for end-to-end multi-modal understanding. In Proceedings of the IEEE/CVF International Conference on Computer Vision, Montreal, BC, Canada, 11–17 October 2021; pp. 1780–1790. [Google Scholar]
  21. Reed, S.; Akata, Z.; Lee, H.; Schiele, B. Learning deep representations of fine-grained visual descriptions. In Proceedings of the IEEE Conference on Computer Vision and Pattern Recognition, Las Vegas, NV, USA, 27–30 June 2016; pp. 49–58. [Google Scholar]
  22. He, X.; Peng, Y. Fine-grained image classification via combining vision and language. In Proceedings of the IEEE Conference on Computer Vision and Pattern Recognition, Honolulu, HI, USA, 21–26 July 2017; pp. 5994–6002. [Google Scholar]
  23. Guan, X.; Wang, G.; Xu, X.; Bin, Y. Learning Hierarchal Channel Attention for Fine-grained Visual Classification. In Proceedings of the 29th ACM International Conference on Multimedia, Virtual, 20–24 October 2021; pp. 5011–5019. [Google Scholar]
  24. Wang, C.Y.; Bochkovskiy, A.; Liao, H.Y.M. YOLOv7: Trainable bag-of-freebies sets new state-of-the-art for real-time object detectors. arXiv 2022, arXiv:2207.02696. [Google Scholar]
  25. Vaswani, A.; Shazeer, N.; Parmar, N.; Uszkoreit, J.; Jones, L.; Gomez, A.N.; Kaiser, Ł.; Polosukhin, I. Attention is all you need. arXiv 2017, arXiv:1706.03762. [Google Scholar]
  26. Deng, J.; Yang, Z.; Chen, T.; Zhou, W.; Li, H. Transvg: End-to-end visual grounding with transformers. In Proceedings of the IEEE/CVF International Conference on Computer Vision, Montreal, BC, Canada, 10–17 October 2021; pp. 1769–1779. [Google Scholar]
  27. Tian, Y.; Krishnan, D.; Isola, P. Contrastive multiview coding. In Proceedings of the Computer Vision–ECCV 2020: 16th European Conference, Glasgow, UK, 23–28 August 2020; Proceedings, Part XI 16. Springer: Cham, Switzerland, 2020; pp. 776–794. [Google Scholar]
  28. Radford, A.; Kim, J.W.; Hallacy, C.; Ramesh, A.; Goh, G.; Agarwal, S.; Sastry, G.; Askell, A.; Mishkin, P.; Clark, J.; et al. Learning transferable visual models from natural language supervision. In Proceedings of the International Conference on Machine Learning, Virtual Event, 18–24 July 2021; pp. 8748–8763. [Google Scholar]
  29. Wang, Z.; Lu, Y.; Li, Q.; Tao, X.; Guo, Y.; Gong, M.; Liu, T. Cris: Clip-driven referring image segmentation. In Proceedings of the IEEE/CVF Conference on Computer Vision and Pattern Recognition, New Orleans, LA, USA, 18–24 June 2022; pp. 11686–11695. [Google Scholar]
  30. Liu, W.; Anguelov, D.; Erhan, D.; Szegedy, C.; Reed, S.; Fu, C.Y.; Berg, A.C. SSD: Single Shot MultiBox Detector. arXiv 2016, arXiv:1512.02325. [Google Scholar]
  31. Xiang, L.; Miao, H.; Haibo, L.; Huiyuan, Y.; Jiajie, X. TSAA: A Two-Stage Anchor Assignment Method towards Anchor Drift in Crowded Object Detection. arXiv 2022, arXiv:2211.00826. [Google Scholar]
  32. Girshick, R.; Donahue, J.; Darrell, T.; Malik, J. Rich Feature Hierarchies for Accurate Object Detection and Semantic Segmentation. In Proceedings of the 2014 IEEE Conference on Computer Vision and Pattern Recognition, Columbus, OH, USA, 23–28 June 2014; pp. 580–587. [Google Scholar] [CrossRef]
  33. Girshick, R. Fast R-CNN. In Proceedings of the 2015 IEEE International Conference on Computer Vision (ICCV), Santiago, Chile, 7–13 December 2015; pp. 1440–1448. [Google Scholar] [CrossRef]
  34. Redmon, J.; Farhadi, A. YOLOv3: An Incremental Improvement. arXiv 2018, arXiv:1804.02767. [Google Scholar]
  35. Zhu, X.; Su, W.; Lu, L.; Li, B.; Wang, X.; Dai, J. Deformable DETR: Deformable Transformers for End-to-end Object Detection. In Proceedings of the International Conference on Learning Representations, Vienna, Austria, 3–7 May 2021. [Google Scholar]
  36. Sun, P.; Zhang, R.; Jiang, Y.; Kong, T.; Xu, C.; Zhan, W.; Tomizuka, M.; Li, L.; Yuan, Z.; Wang, C.; et al. Sparse R-CNN: End-to-End Object Detection with Learnable Proposals. In Proceedings of the 2021 IEEE/CVF Conference on Computer Vision and Pattern Recognition (CVPR), Nashville, TN, USA, 20–25 June 2021; pp. 14449–14458. [Google Scholar] [CrossRef]
  37. Zhang, H.; Chang, H.; Ma, B.; Wang, N.; Chen, X. Dynamic R-CNN: Towards High Quality Object Detection via Dynamic Training. arXiv 2020, arXiv:2004.06002. [Google Scholar]
  38. Liu, J.; Liu, S.; Xu, S.; Zhou, C. Two-Stage Underwater Object Detection Network Using Swin Transformer. IEEE Access 2022, 10, 117235–117247. [Google Scholar] [CrossRef]
  39. Redmon, J.; Farhadi, A. YOLO9000: Better, Faster, Stronger. In Proceedings of the 2017 IEEE Conference on Computer Vision and Pattern Recognition (CVPR), Honolulu, HI, USA, 21–26 July 2017; pp. 6517–6525. [Google Scholar] [CrossRef]
  40. Bochkovskiy, A.; Wang, C.Y.; Liao, H.Y.M. YOLOv4: Optimal Speed and Accuracy of Object Detection. arXiv 2020, arXiv:2004.10934. [Google Scholar]
  41. Jocher, G.R.; Stoken, A.; Borovec, J.; NanoCode012; ChristopherSTAN; Liu, C.; Laughing; Hogan, A.; lorenzomammana; tkianai; et al. ultralytics/yolov5: v3.0. 2020. Available online: https://zenodo.org/record/3983579#.ZEx_0YgzaHs (accessed on 27 April 2023).
  42. Li, C.; Li, L.; Jiang, H.; Weng, K.; Geng, Y.; Li, L.; Ke, Z.; Li, Q.; Cheng, M.; Nie, W.; et al. YOLOv6: A Single-Stage Object Detection Framework for Industrial Applications. arXiv 2022, arXiv:2209.02976. [Google Scholar]
  43. Jintasuttisak, T.; Edirisinghe, E.A.; El-Battay, A. Deep neural network based date palm tree detection in drone imagery. Comput. Electron. Agric. 2022, 192, 106560. [Google Scholar] [CrossRef]
  44. Xu, R.; Lin, H.X.; Lu, K.; Cao, L.; Liu, Y. A Forest Fire Detection System Based on Ensemble Learning. Forests 2021, 12, 217. [Google Scholar] [CrossRef]
  45. Deng, C.; Wu, Q.; Wu, Q.; Hu, F.; Lyu, F.; Tan, M. Visual grounding via accumulated attention. In Proceedings of the IEEE Conference on Computer Vision and Pattern Recognition, Salt Lake City, UT, USA, 18–22 June 2018; pp. 7746–7755. [Google Scholar]
  46. Yang, L.; Xu, Y.; Yuan, C.; Liu, W.; Li, B.; Hu, W. Improving visual grounding with visual-linguistic verification and iterative reasoning. In Proceedings of the IEEE/CVF Conference on Computer Vision and Pattern Recognition, New Orleans, LA, USA, 18–24 June 2022; pp. 9499–9508. [Google Scholar]
  47. Song, L.; Xia, M.; Weng, L.; Lin, H.; Qian, M.; Chen, B. Axial Cross Attention Meets CNN: Bibranch Fusion Network for Change Detection. IEEE J. Sel. Top. Appl. Earth Obs. Remote Sens. 2023, 16, 32–43. [Google Scholar] [CrossRef]
  48. Qu, Y.; Xia, M.; Zhang, Y. Strip pooling channel spatial attention network for the segmentation of cloud and cloud shadow. Comput. Geosci. 2021, 157, 104940. [Google Scholar] [CrossRef]
  49. Miao, S.; Xia, M.; Qian, M.; Zhang, Y.; Liu, J.; Lin, H. Cloud/shadow segmentation based on multi-level feature enhanced network for remote sensing imagery. Int. J. Remote Sens. 2022, 43, 5940–5960. [Google Scholar] [CrossRef]
  50. Hu, K.; Zhang, E.; Xia, M.; Weng, L.; Lin, H. MCANet: A Multi-Branch Network for Cloud/Snow Segmentation in High-Resolution Remote Sensing Images. Remote Sens. 2023, 15, 1055. [Google Scholar] [CrossRef]
  51. Mafla, A.; Dey, S.; Biten, A.F.; Gomez, L.; Karatzas, D. Multi-Modal Reasoning Graph for Scene-Text Based Fine-Grained Image Classification and Retrieval. In Proceedings of the 2021 IEEE Winter Conference on Applications of Computer Vision (WACV), Waikoloa, HI, USA, 5–9 January 2021; pp. 4022–4032. [Google Scholar]
  52. Yuan, Z.; Zhang, W.; Fu, K.; Li, X.; Deng, C.; Wang, H.; Sun, X. Exploring a Fine-Grained Multiscale Method for Cross-Modal Remote Sensing Image Retrieval. IEEE Trans. Geosci. Remote Sens. 2021, 60, 1–19. [Google Scholar] [CrossRef]
  53. Gao, J.; Weng, L.; Xia, M.; Lin, H. MLNet: Multichannel feature fusion lozenge network for land segmentation. J. Appl. Remote Sens. 2022, 16, 1–19. [Google Scholar] [CrossRef]
  54. Sennrich, R.; Haddow, B.; Birch, A. Neural machine translation of rare words with subword units. arXiv 2015, arXiv:1508.07909. [Google Scholar]
  55. Ding, X.; Zhang, X.; Ma, N.; Han, J.; Ding, G.; Sun, J. Repvgg: Making vgg-style convnets great again. In Proceedings of the IEEE/CVF Conference on Computer Vision and Pattern Recognition, Virtual Conference, 19–25 June 2021; pp. 13733–13742. [Google Scholar]
  56. Agarap, A.F. Deep learning using rectified linear units (relu). arXiv 2018, arXiv:1803.08375. [Google Scholar]
  57. Ba, J.L.; Kiros, J.R.; Hinton, G.E. Layer normalization. arXiv 2016, arXiv:1607.06450. [Google Scholar]
  58. Chen, Y.; Yang, J.; Wang, J.; Zhou, X.; Zou, J.; Li, Y. An Improved YOLOv5 Real-time Detection Method for Aircraft Target Detection. In Proceedings of the International Conference on Automation and Computing (ICAC), Bristol, UK, 1–3 September 2022; pp. 1–6. [Google Scholar]
  59. Maji, S.; Rahtu, E.; Kannala, J.; Blaschko, M.; Vedaldi, A. Fine-grained visual classification of aircraft. arXiv 2013, arXiv:1306.5151. [Google Scholar]
  60. Lin, T.Y.; Maire, M.; Belongie, S.; Hays, J.; Zitnick, C.L. Microsoft coco: Common objects in context. In Proceedings of the European Conference on Computer Vision, Zurich, Switzerland, 6–12 September 2014; pp. 740–755. [Google Scholar]
  61. Lin, T.Y.; Goyal, P.; Girshick, R.; He, K.; Dollár, P. Focal loss for dense object detection. In Proceedings of the IEEE International Conference on Computer Vision, Venice, Italy, 22–29 October 2017; pp. 2980–2988. [Google Scholar]
Figure 1. An illustration of two examples of fine-grained visual grounding, where subfigure (a) lists the prediction results by different approaches on two similar aircraft, and subfigure (b) shows the visual and textual descriptions of two similar aircraft.
Applsci 13 05649 g001
Figure 2. An example to illustrate the framework of our SAC-VGNet.
Applsci 13 05649 g002
Figure 3. The detailed implementation of multi-scale cross-modal feature decoding.
Applsci 13 05649 g003
Figure 4. Several examples to illustrate the visual and textual representations of the MAD (subfigure (a)) and FAD (subfigure (b)) datasets.
Applsci 13 05649 g004
Figure 5. The performance change with respect to different β in Equation (10) on MAD and FAD datasets.
Applsci 13 05649 g005
Figure 6. Three examples to illustrate the heatmap results by SAC-VGNet without different components.
Applsci 13 05649 g006
Figure 7. Several examples to illustrate the detection results by SAC-VGNet, where the first and third rows are collected from MAD, and the second row is from FAD.
Applsci 13 05649 g007
Table 1. The performance comparison by SAC-VGNet without different components on MAD.
MCFDTCLmAP@0.5mAP@0.75mAP@0.5:0.95
-- 0.869 0.825 0.758
- 0.877 0.830 0.768
- 0.873 0.828 0.764
0 . 887 0 . 840 0 . 781
Table 2. The performance comparison by SAC-VGNet without different components on FAD.
MCFDTCLmAP@0.5mAP@0.75mAP@0.5:0.95
-- 0.909 0.887 0.862
- 0.918 0.911 0.873
- 0.920 0.917 0.879
0 . 926 0 . 922 0 . 885
Table 3. The performance comparison between SAC-VGNet and the advanced approaches on MAD.
MethodResolutionmAP@0.5mAP@0.75mAP
DETR [19] 0.831 0.776 0.739
YOLOv5 [41] 0.840 0.789 0.750
Deformable DETR [35]640 × 0.835 0.787 0.742
Sparse R-CNN [36]640 0.851 0.792 0.758
YOLOv7 [24] 0.856 0.815 0.762
SAC-VGNet 0 . 887 0 . 840 0 . 782
DETR [19] 0.871 0.835 0.783
YOLOv5 [41] 0.883 0.846 0.811
Deformable DETR [35]1280 × 0.878 0.838 0.801
Sparse R-CNN [36]1280 0.887 0.852 0.816
YOLOv7 [24] 0.892 0.856 0.823
SAC-VGNet 0 . 905 0 . 859 0 . 840
Table 4. The performance comparison between SAC-VGNet and the advanced approaches on FAD.
MethodResolutionmAP@0.5mAP@0.75mAP
DETR [19] 0.850 0.847 0.831
YOLOv5 [41] 0.862 0.854 0.836
Deformable DETR [35]640 × 0.859 0.857 0.838
Sparse R-CNN [36]640 0.873 0.865 0.842
YOLOv7 [24] 0.881 0.877 0.851
SAC-VGNet 0 . 926 0 . 922 0 . 885
DETR [19] 0.875 0.869 0.841
YOLOv5 [41] 0.898 0.882 0.856
Deformable DETR [35]1280 × 0.889 0.880 0.849
Sparse R-CNN [36]1280 0.903 0.892 0.870
YOLOv7 [24] 0.911 0.903 0.875
SAC-VGNet 0 . 935 0 . 927 0 . 902
Table 5. The performance comparison on each category between SAC-VGNet and YOLOv7 on the MAD dataset.
CategoryYOLOv7SAC-VGNet
mAP@0.5mAP@0.75mAPmAP@0.5mAP@0.75mAP
All0.8560.8150.7620.8870.8400.782
A100.9390.8880.8220.9310.890.829
A400M0.9570.9180.8440.9520.9110.86
AG6000.9290.9290.8730.9670.9670.892
AV8B0.9440.9390.880.9380.9350.882
B10.8890.8620.8020.880.8420.79
B20.8810.8310.7490.9080.8470.774
B520.9430.9430.8670.9510.9510.87
Be2000.9890.9890.9290.9870.9870.926
C1300.8260.720.6740.830.7280.682
C170.860.7910.730.9050.8250.747
C50.9130.9130.8360.9550.9360.877
E20.9020.8790.8150.9060.9060.844
EF20000.7860.7640.7380.8430.8430.798
F1170.7110.5970.5520.7940.6630.613
F140.8420.8420.8080.9020.8740.808
F150.8690.8280.7750.8780.840.776
F160.7250.6450.6030.7450.6980.632
F180.8370.7910.7130.8550.8330.741
F220.7980.7980.740.8220.8220.757
F350.8570.7750.7290.8940.8140.765
F40.780.7040.70.8470.7560.744
JAS390.7260.6890.6610.7690.7180.672
MQ90.840.840.7750.9010.8810.784
Mig310.9140.9140.8350.9350.9040.852
Mirage20000.9580.9120.8390.9750.9520.882
RQ40.820.6030.5970.8360.6250.608
Rafale0.8880.8620.8170.8730.8470.803
SR710.8610.670.6810.9270.7370.716
Su340.8180.7920.7520.9040.8670.827
Su570.7540.7470.7140.810.7930.749
Tu1600.9040.8840.8470.9560.8880.862
Tu950.8590.8330.8150.8880.8880.823
Tornado0.6750.6230.620.7620.6870.675
U20.8610.7870.7740.9320.8270.824
US20.9350.9160.8660.9530.9310.884
V220.9180.8570.7660.9210.8710.768
XB700.8870.8780.7330.9080.8930.742
YF230.9770.9770.9090.9910.9910.915
Vulcan0.7090.6490.6370.7980.7110.672
J200.7540.7230.6810.7520.7370.69
Table 6. Resource requirements as compared with the state-of-the-art approaches.
Model#Param.FLOPsSizeFPS
Sparse R-CNN77.8 M23.3 G133323
YOLOv586.7 M205.7 G128015
YOLOv736.9 M104.7 G128026
DETR41 M187 G133312
Deformable DETR40 M173 G133319
SAC-VGNet45 M113 G128021
Disclaimer/Publisher’s Note: The statements, opinions and data contained in all publications are solely those of the individual author(s) and contributor(s) and not of MDPI and/or the editor(s). MDPI and/or the editor(s) disclaim responsibility for any injury to people or property resulting from any ideas, methods, instructions or products referred to in the content.

