
A Two-Stage Framework for Time-Frequency Analysis and Fault Diagnosis of Planetary Gearboxes

Abstract
:1. Introduction
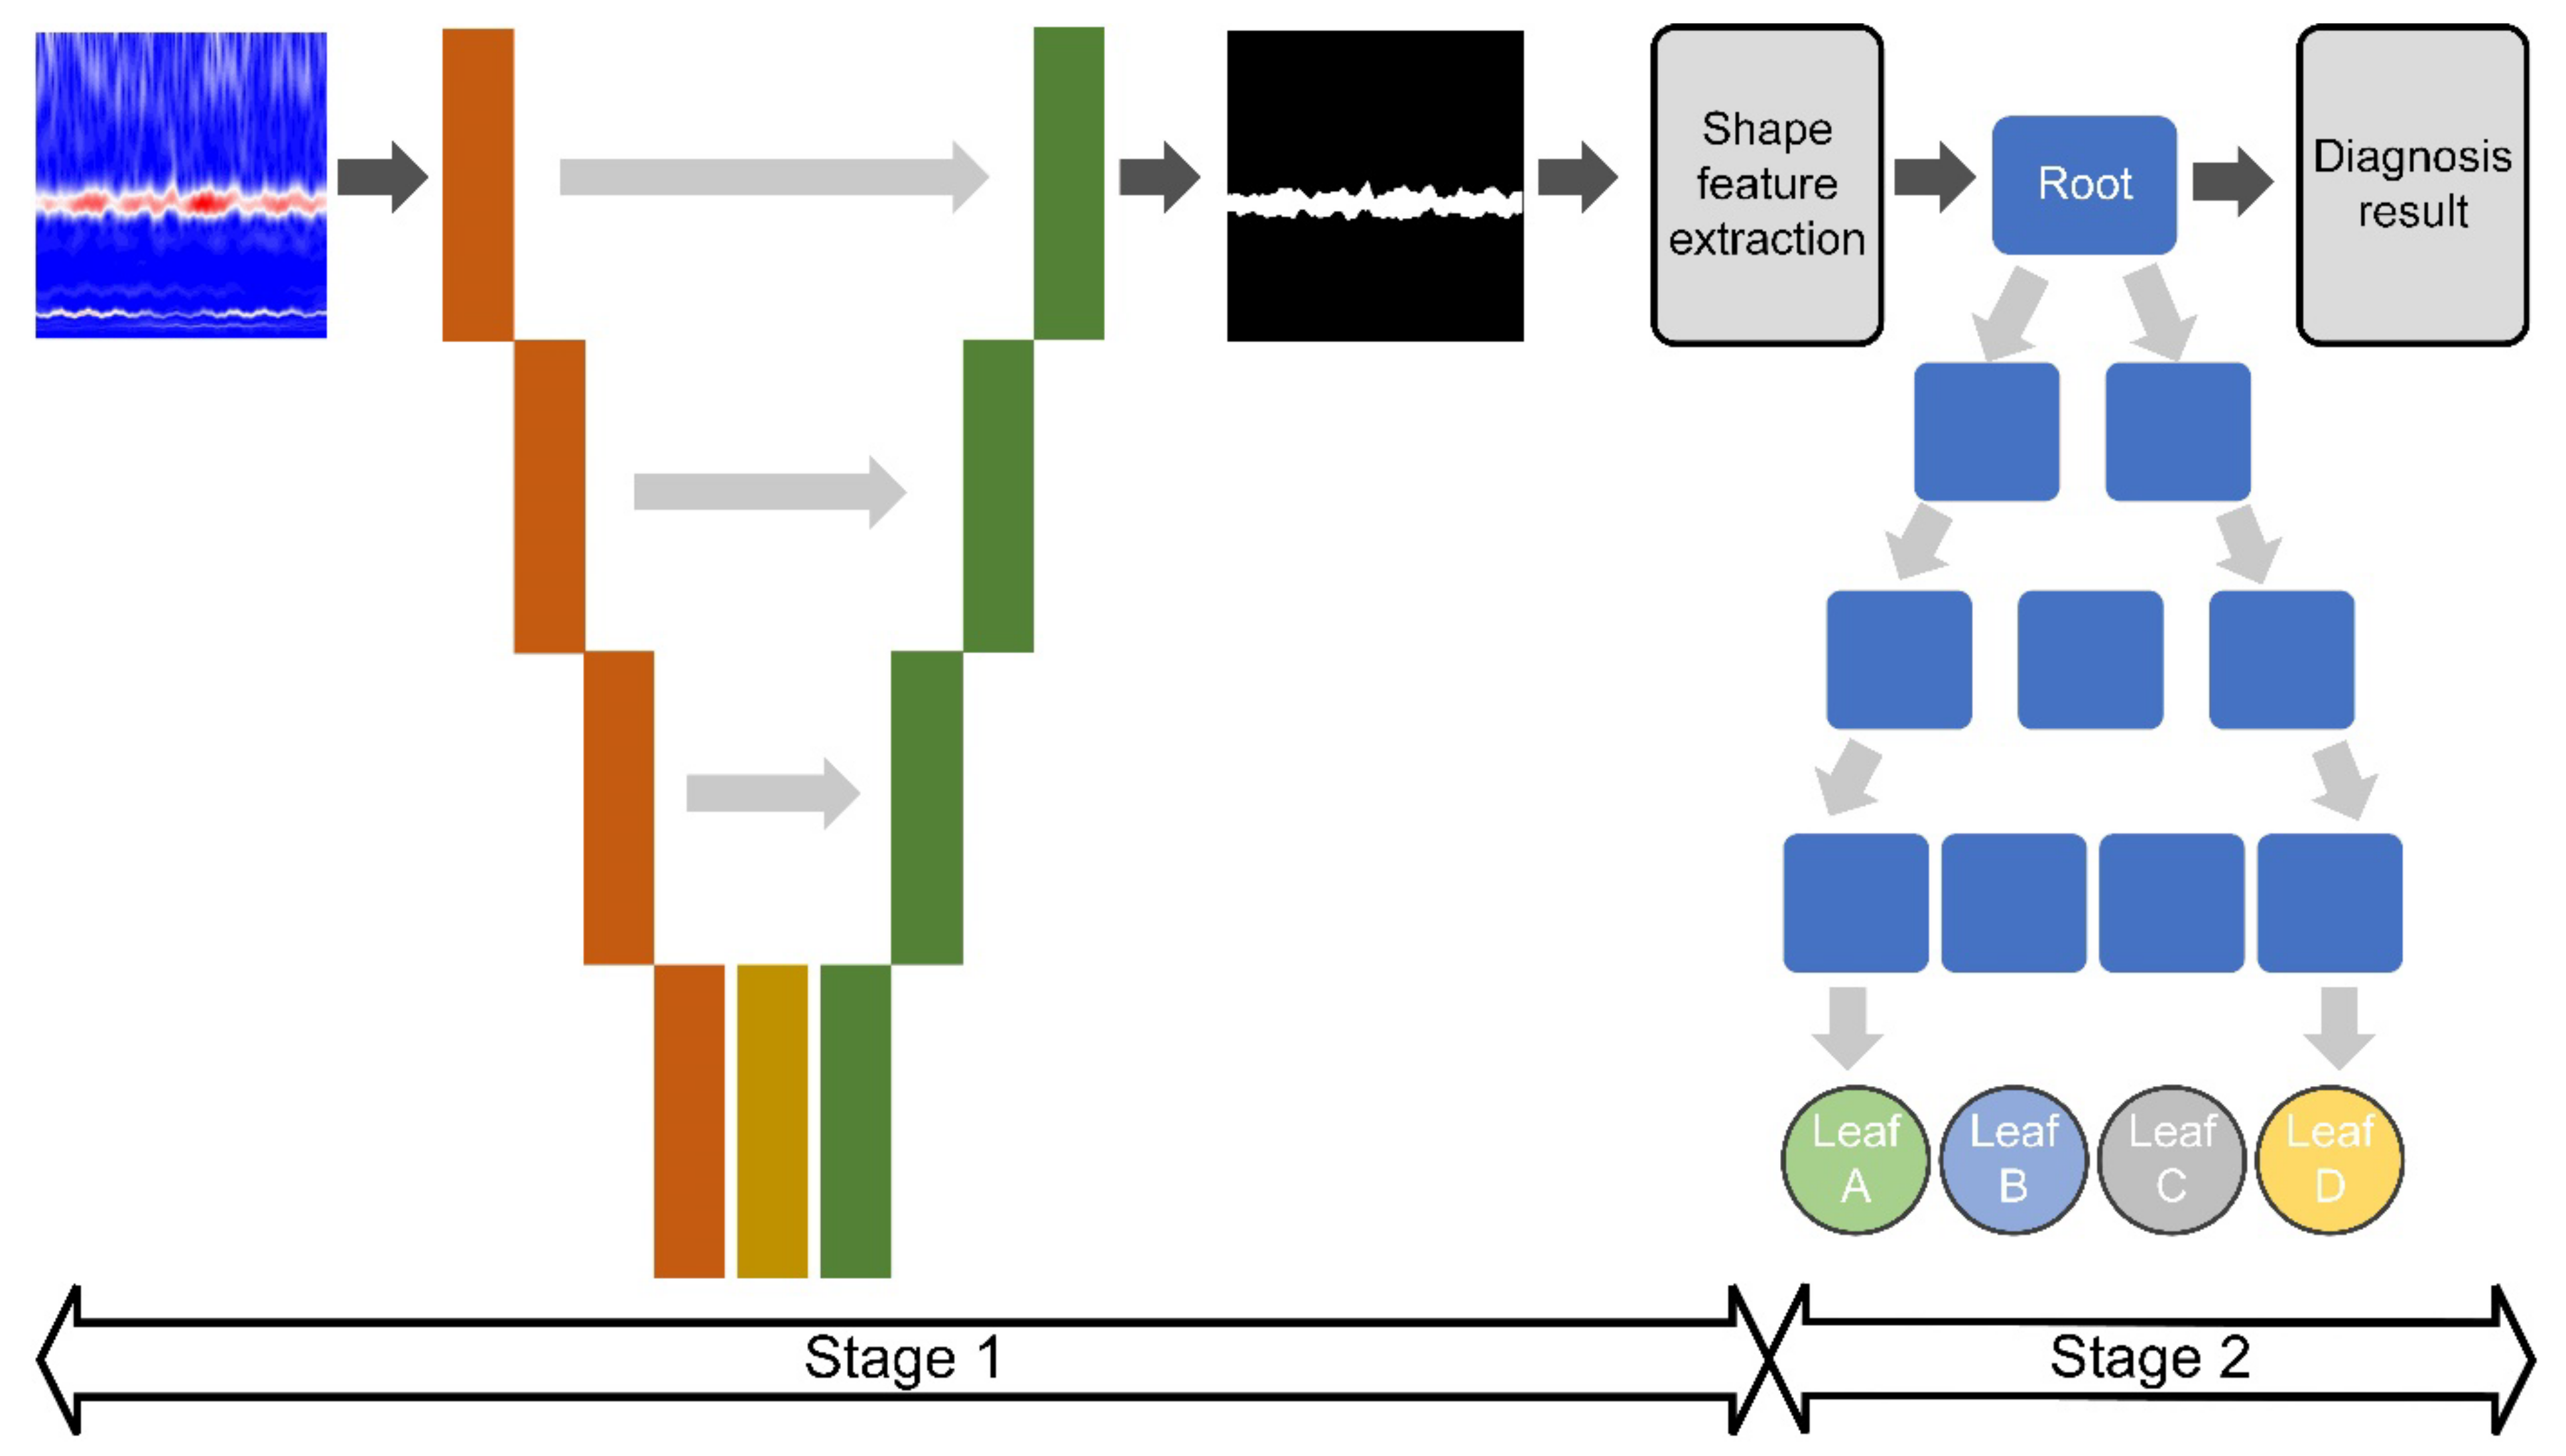
- Compared with previous studies that considered T-F analysis or fault diagnosis alone, a more comprehensive two-stage framework is proposed to combine the two tasks. To the best of our knowledge, we are the first paper to discuss planetary gearbox fault diagnosis based on T-F information from the perspective of an analysis and diagnosis two-stage task.
- The modified U-net model is adopted to process T-F image, which can utilize large-range context information to improve the segmentation accuracy and enhance the robustness against environmental variations.
- The effectiveness of the proposed method is verified by using the real data of in-service wind turbines. T-F images and ground truth labels are available online [25].
2. Preliminaries
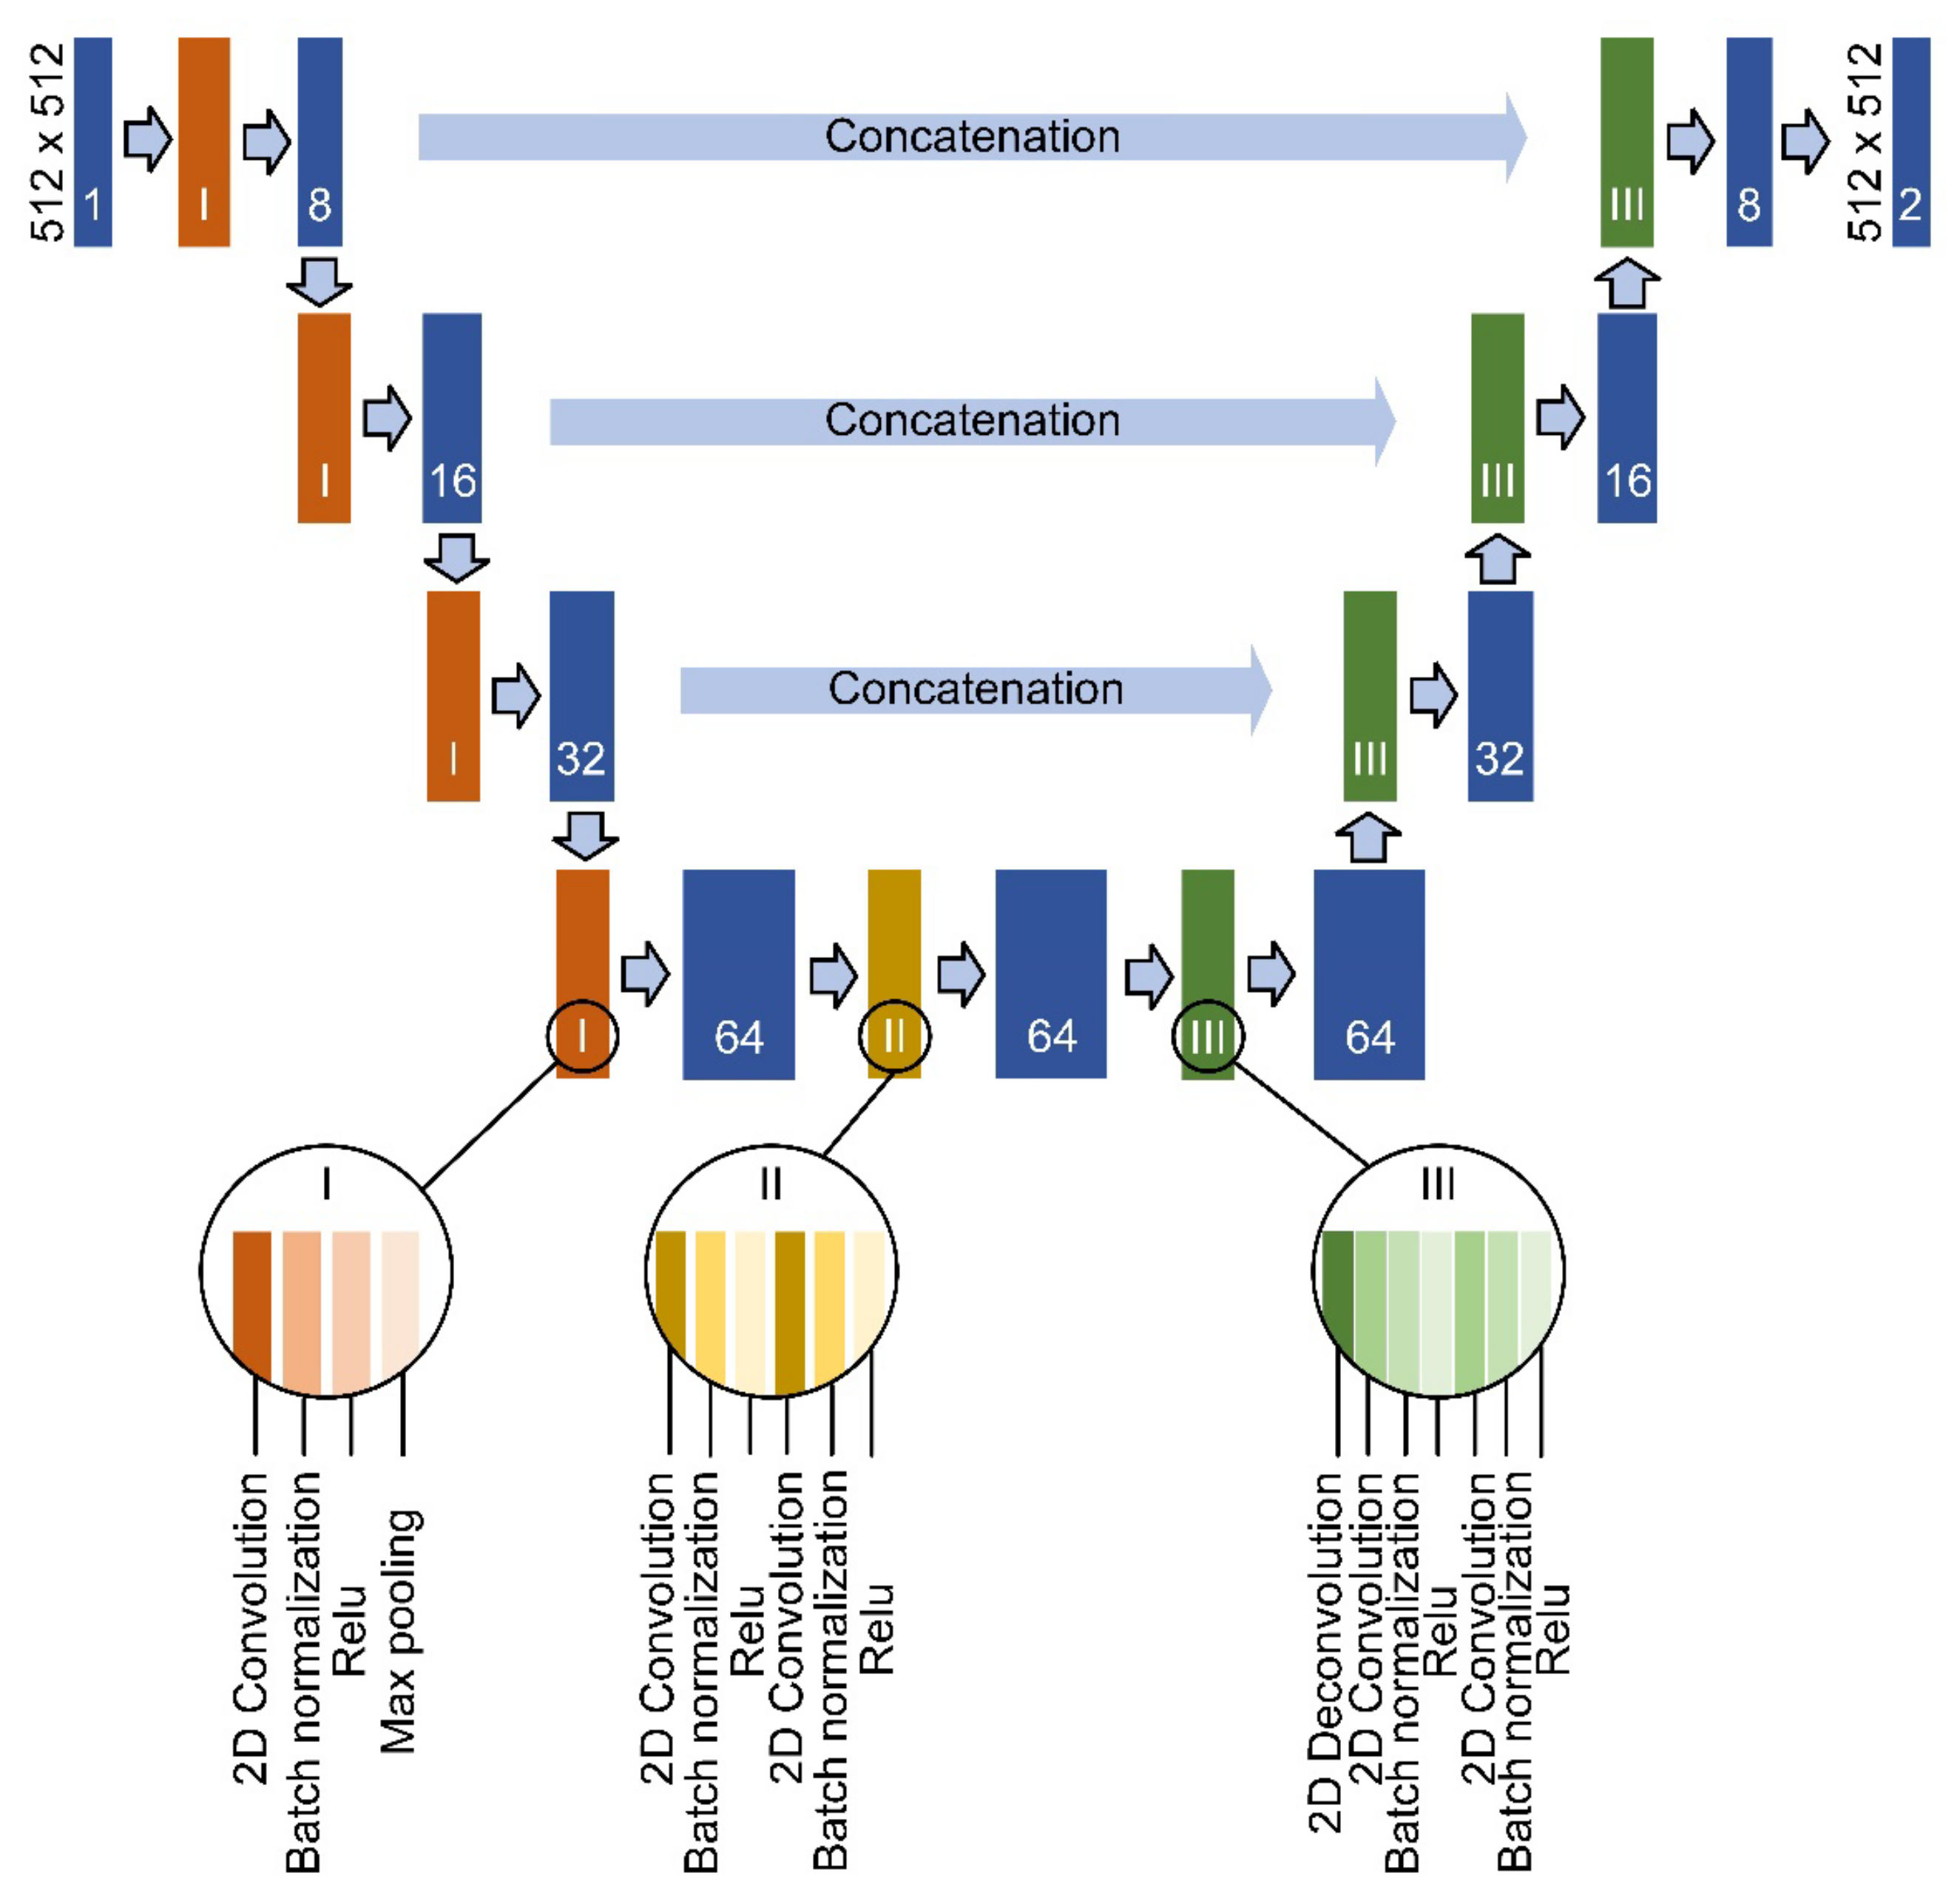
2.1. U-Net
- The convolutional layer is composed of a set of convolutional kernels that can be set high and wide. The learnable convolutional kernel enables the convolutional layer to generalize the feature information in the input and map it into a new feature space. In addition, the setting of shared weights enables the convolutional layer to have lower computational complexity than the fully connected layer. For each convolutional kernel, its output can be expressed as:
- 2.
- Deconvolution is also known as up-convolution or transposed convolution. Its function in the U-net model is to increase the resolution of feature maps rather than computing the true inverse of convolution. In order to obtain an appropriate expansive capability matching the contracting path, we use a 2 × 2 deconvolutional kernel and set the deconvolutional stride to 2.
- 3.
- Activation functions enable convolutional neural networks to model nonlinear mapping hidden in data. Common activation functions include Sigmoid, Tanh, ELU, ReLU [30], etc. As a non-saturated activation function, ReLU can alleviate the problems of gradient vanishing and exploding while accelerating model learning. Therefore, ReLU is selected as the activation function in the contracting operator and expansive operator.
- 4.
- Batch normalization is an effective tool to deal with the problem of feature distribution drift during batch training. Severe feature distribution drift will reduce the stability of neural network training and aggravate the over-fitting issue, which is particularly obvious in deep neural networks. Batch normalization transforms the distribution of neuron activations into the standard normal distribution. For batch training data [x1, x2, …, xm], the normalized result is calculated as follows:
2.2. Shape Feature
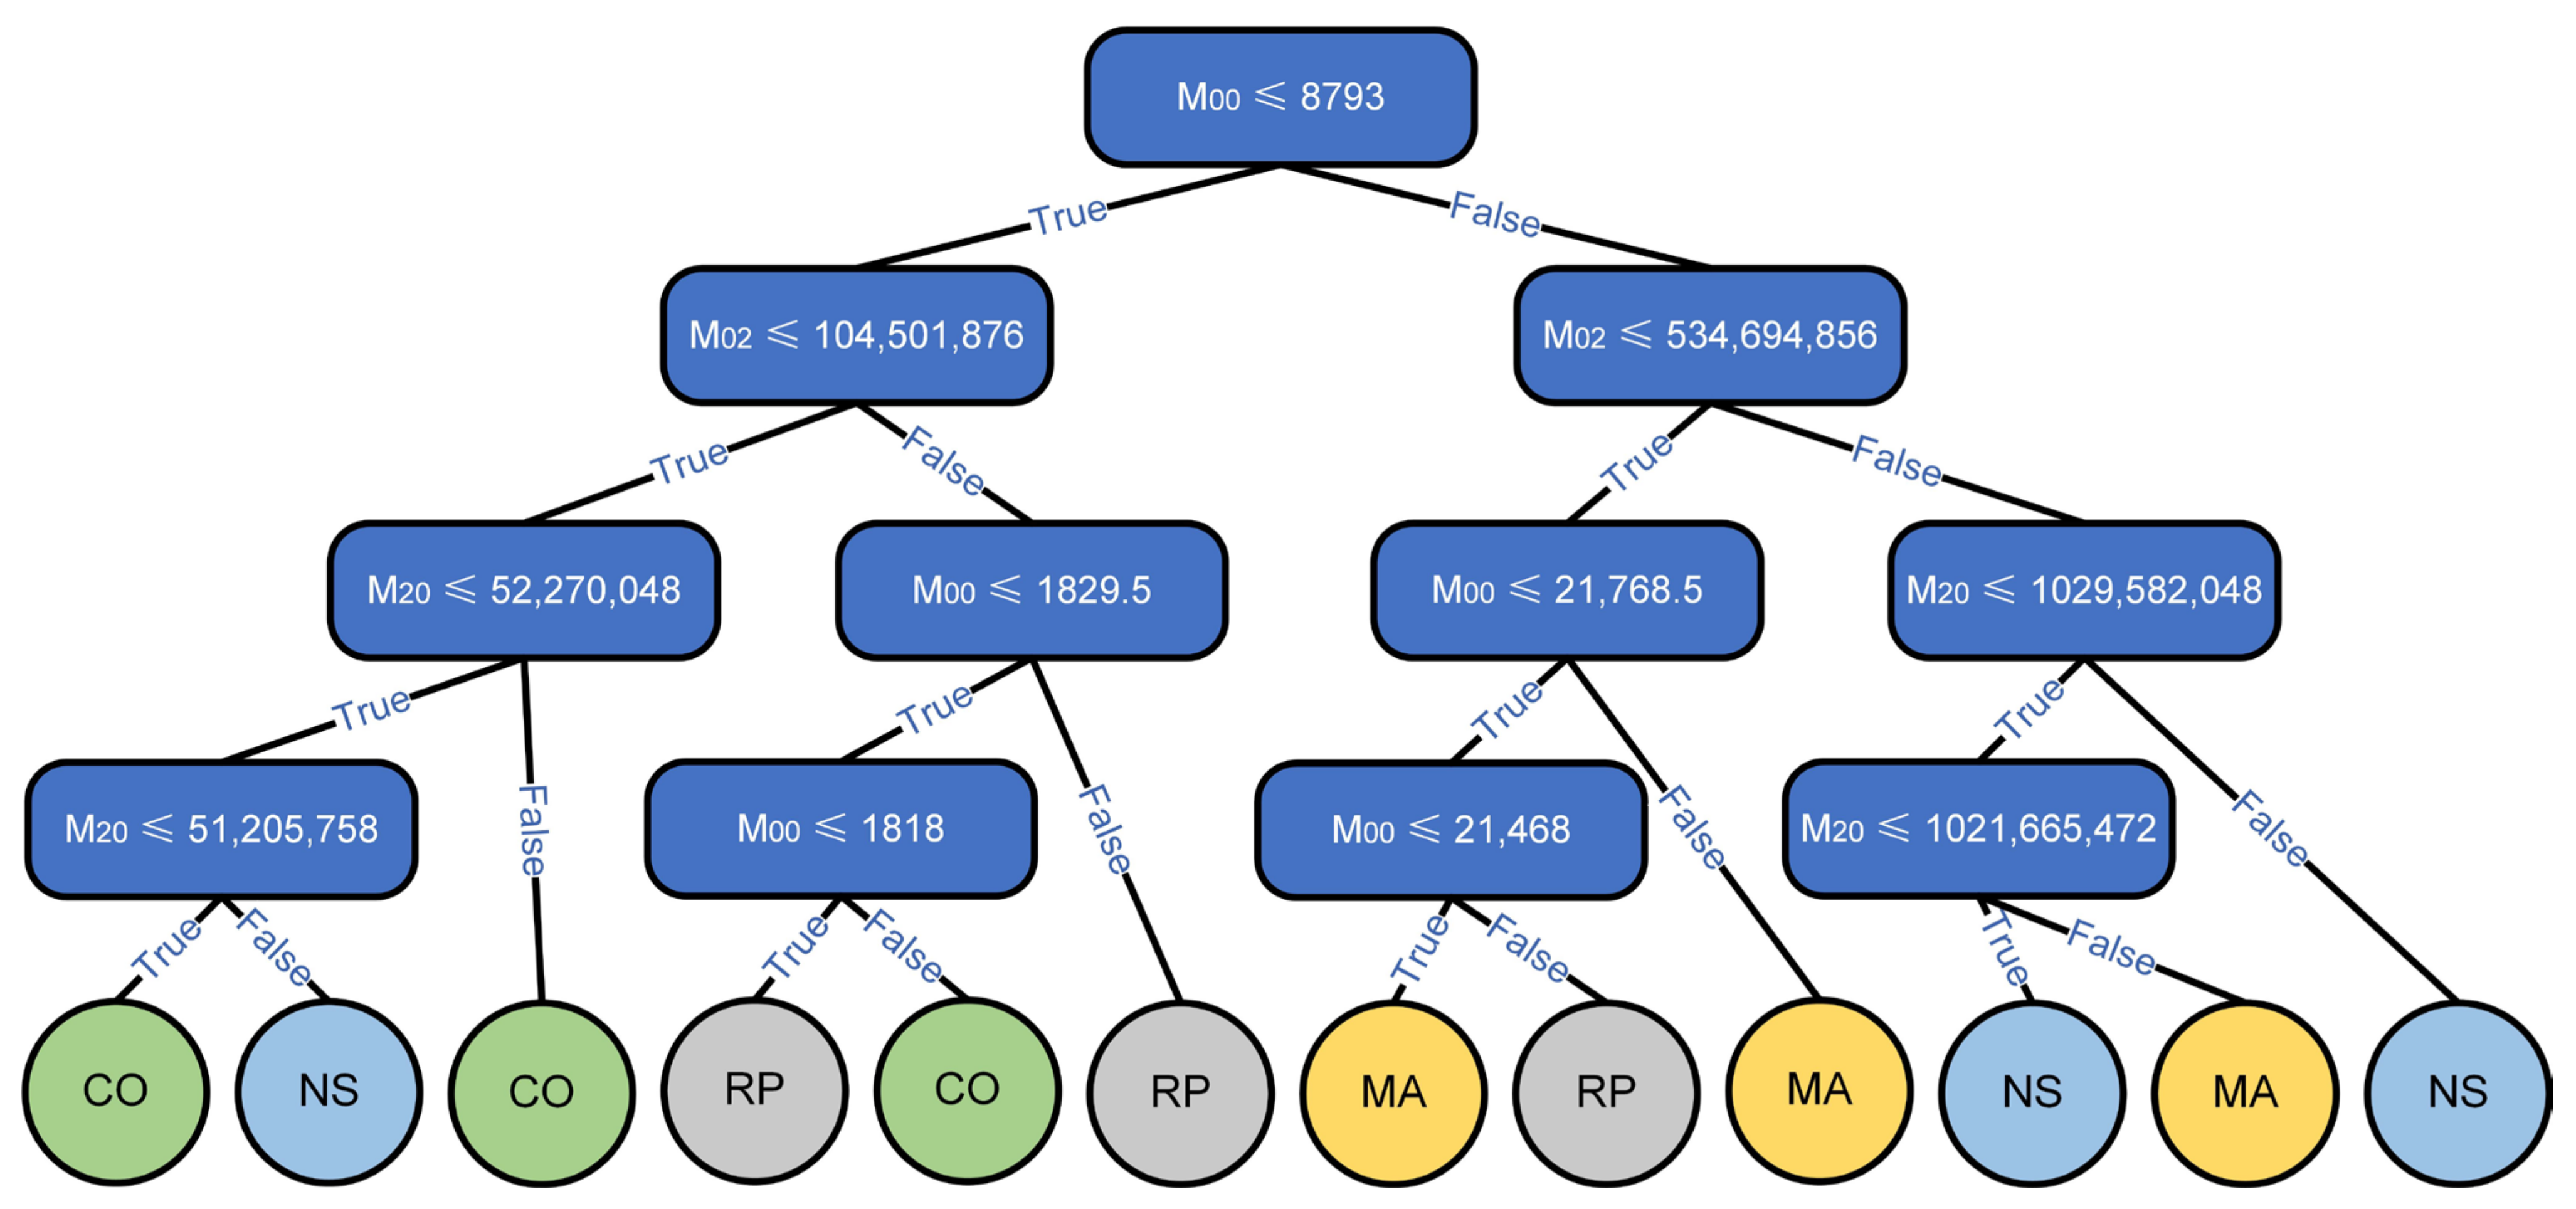
2.3. Decision Tree
- Building phase: The CART-based decision tree is a binary tree. Namely, each split generates exactly two branches. A test attribute x and a test threshold tx can divide the training set into two subsets. In the CART model, the attribute-threshold domain (X, T) is searched to obtain the combination that produces the purest subset. This process is repeated many times to segment subsets and subsets of subsets until the algorithm cannot put forward a new segmentation to obtain higher purity subsets or the preset maximum depth is reached. A fully grown, binary, tree-like structure makes the identification of crucial variables quite easy.
- Pruning phase: If the decision tree grows to the maximum size without restriction, developing as a nonparametric model, there will usually be an overfitting problem which will reduce the accuracy of the decision tree in the whole instance space. Therefore, it is necessary to delete unreliable branches or limit the model’s degrees of freedom. Setting the maximum depth of the tree structure is the most common pruning method. The other choices of hyperparameters include the minimum number of samples per leaf node, the maximum number of leaf nodes and the complexity parameter. For more information about the CART algorithm, see [36,37,38].
3. The Proposed Method
3.1. Architecture of the Two-Stage Framework
3.2. Evaluation Metrics of Performance
4. Case Study
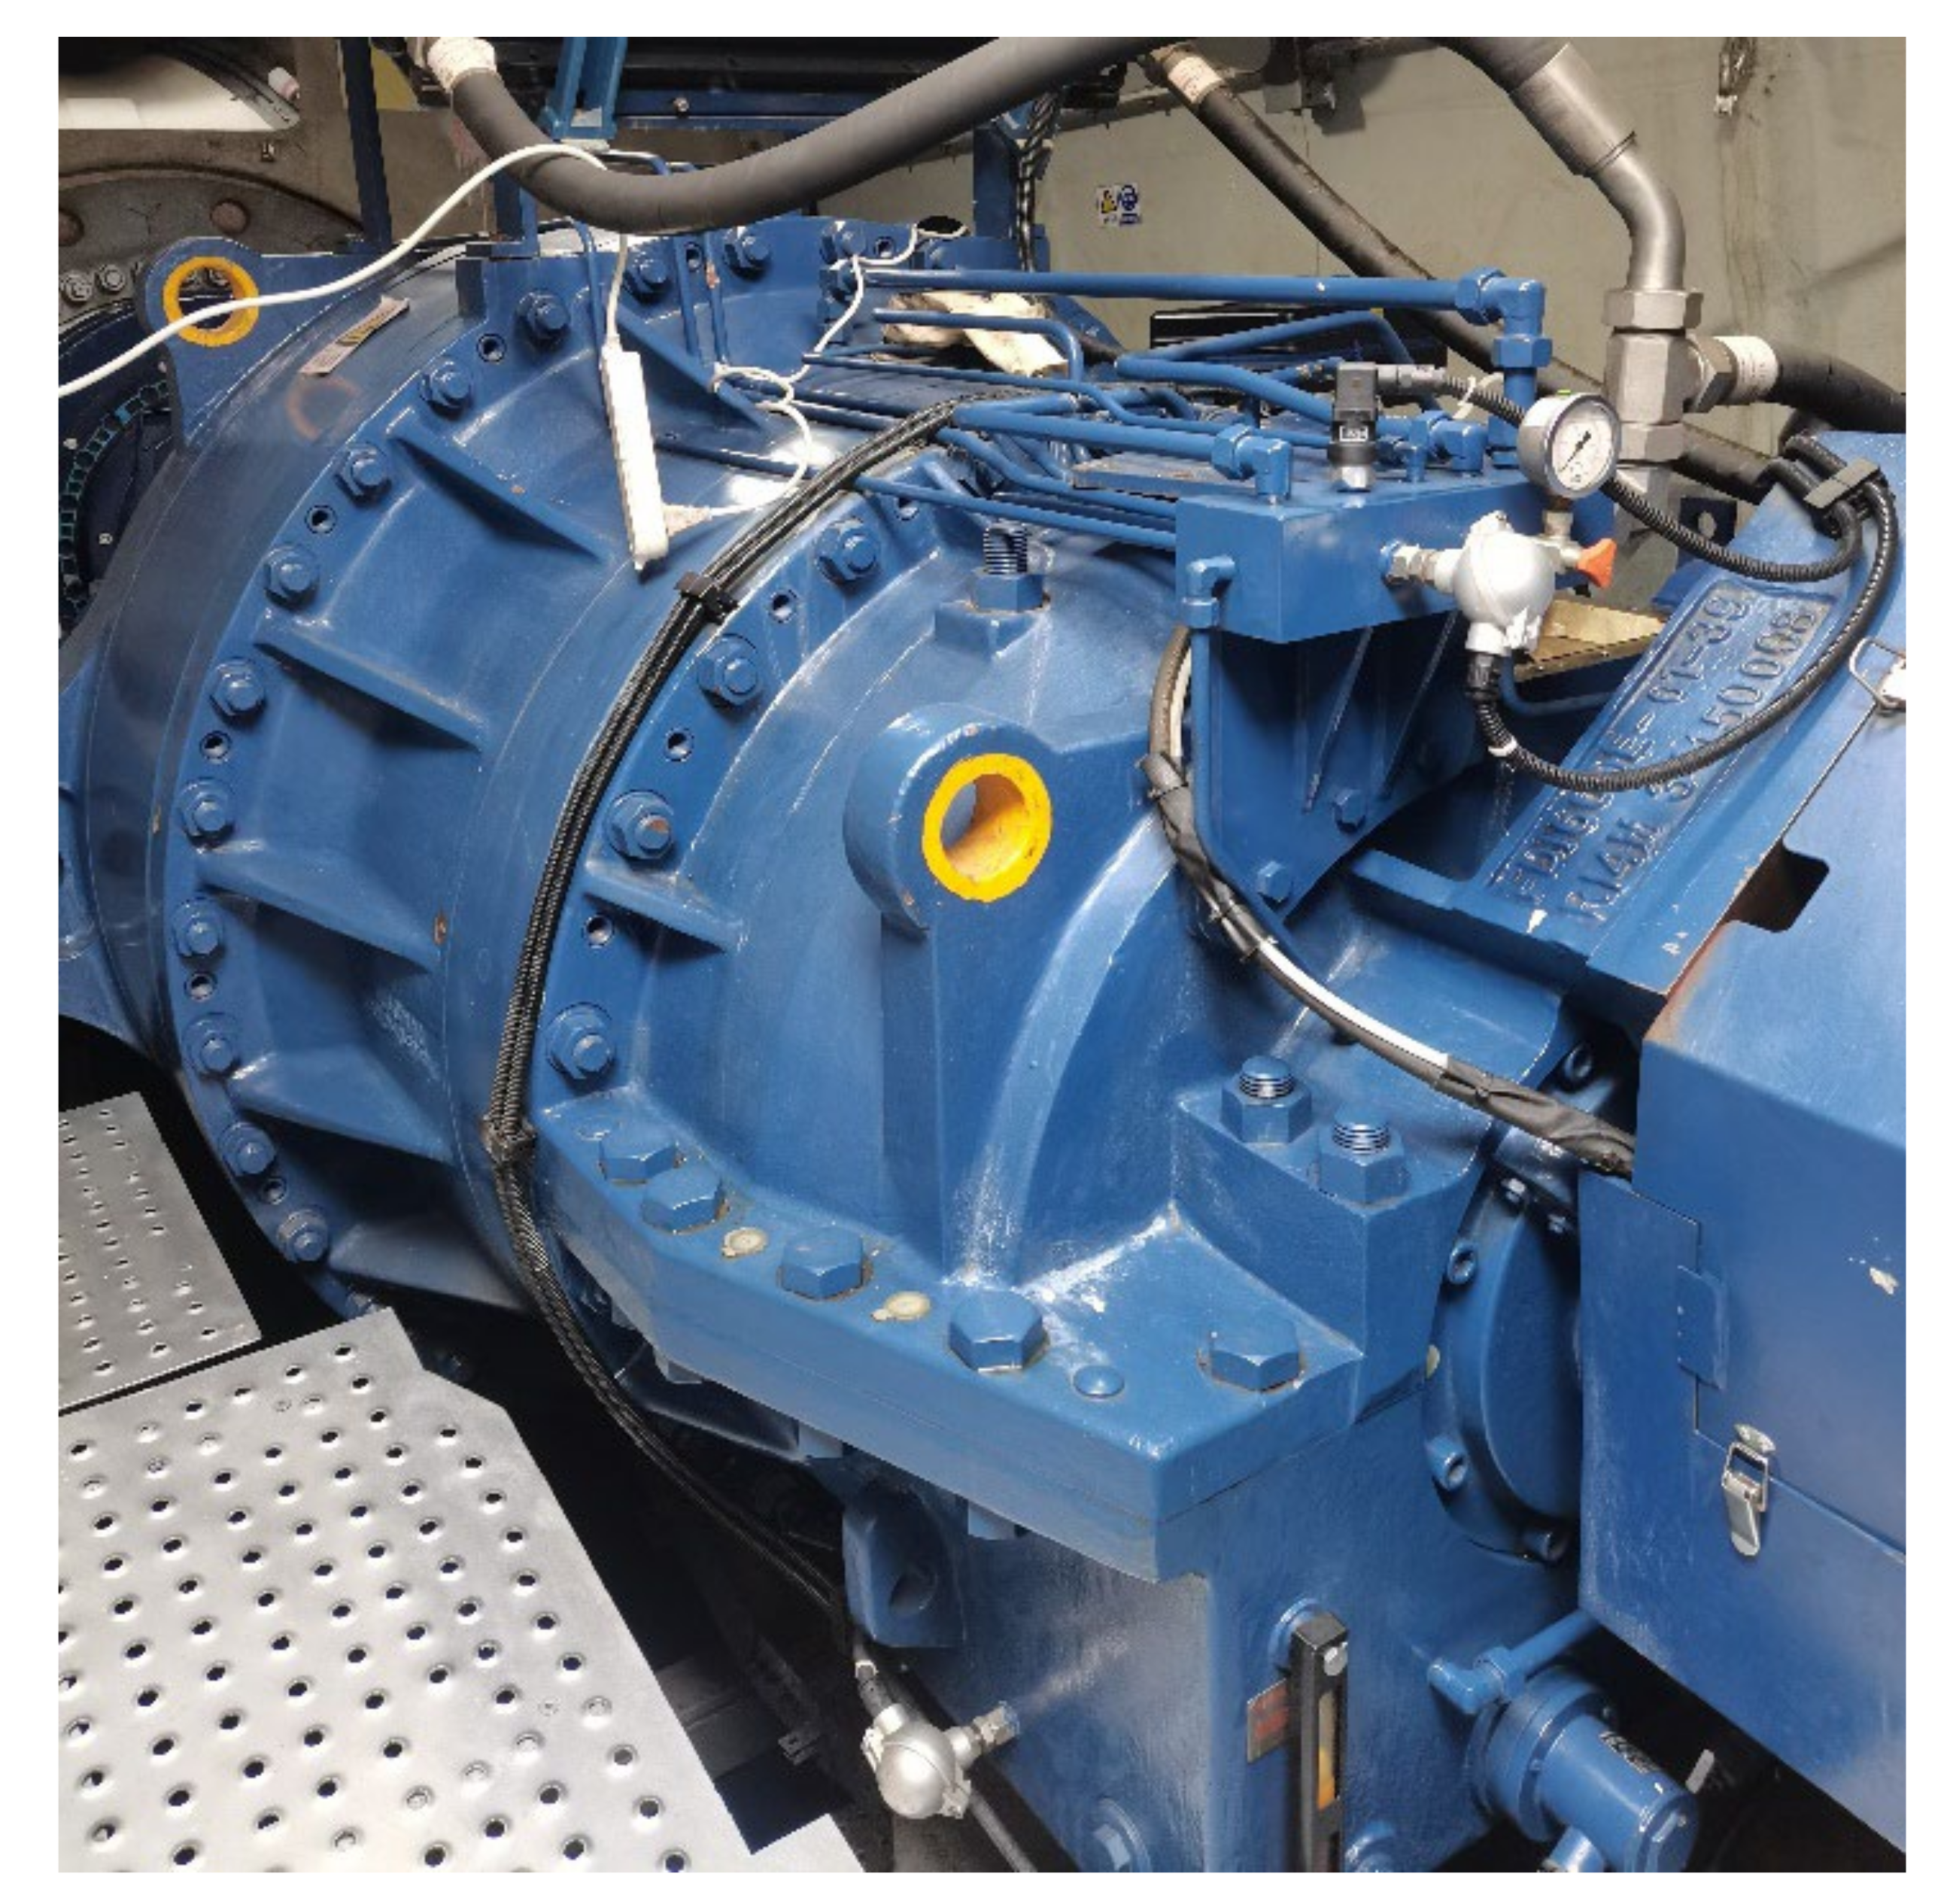
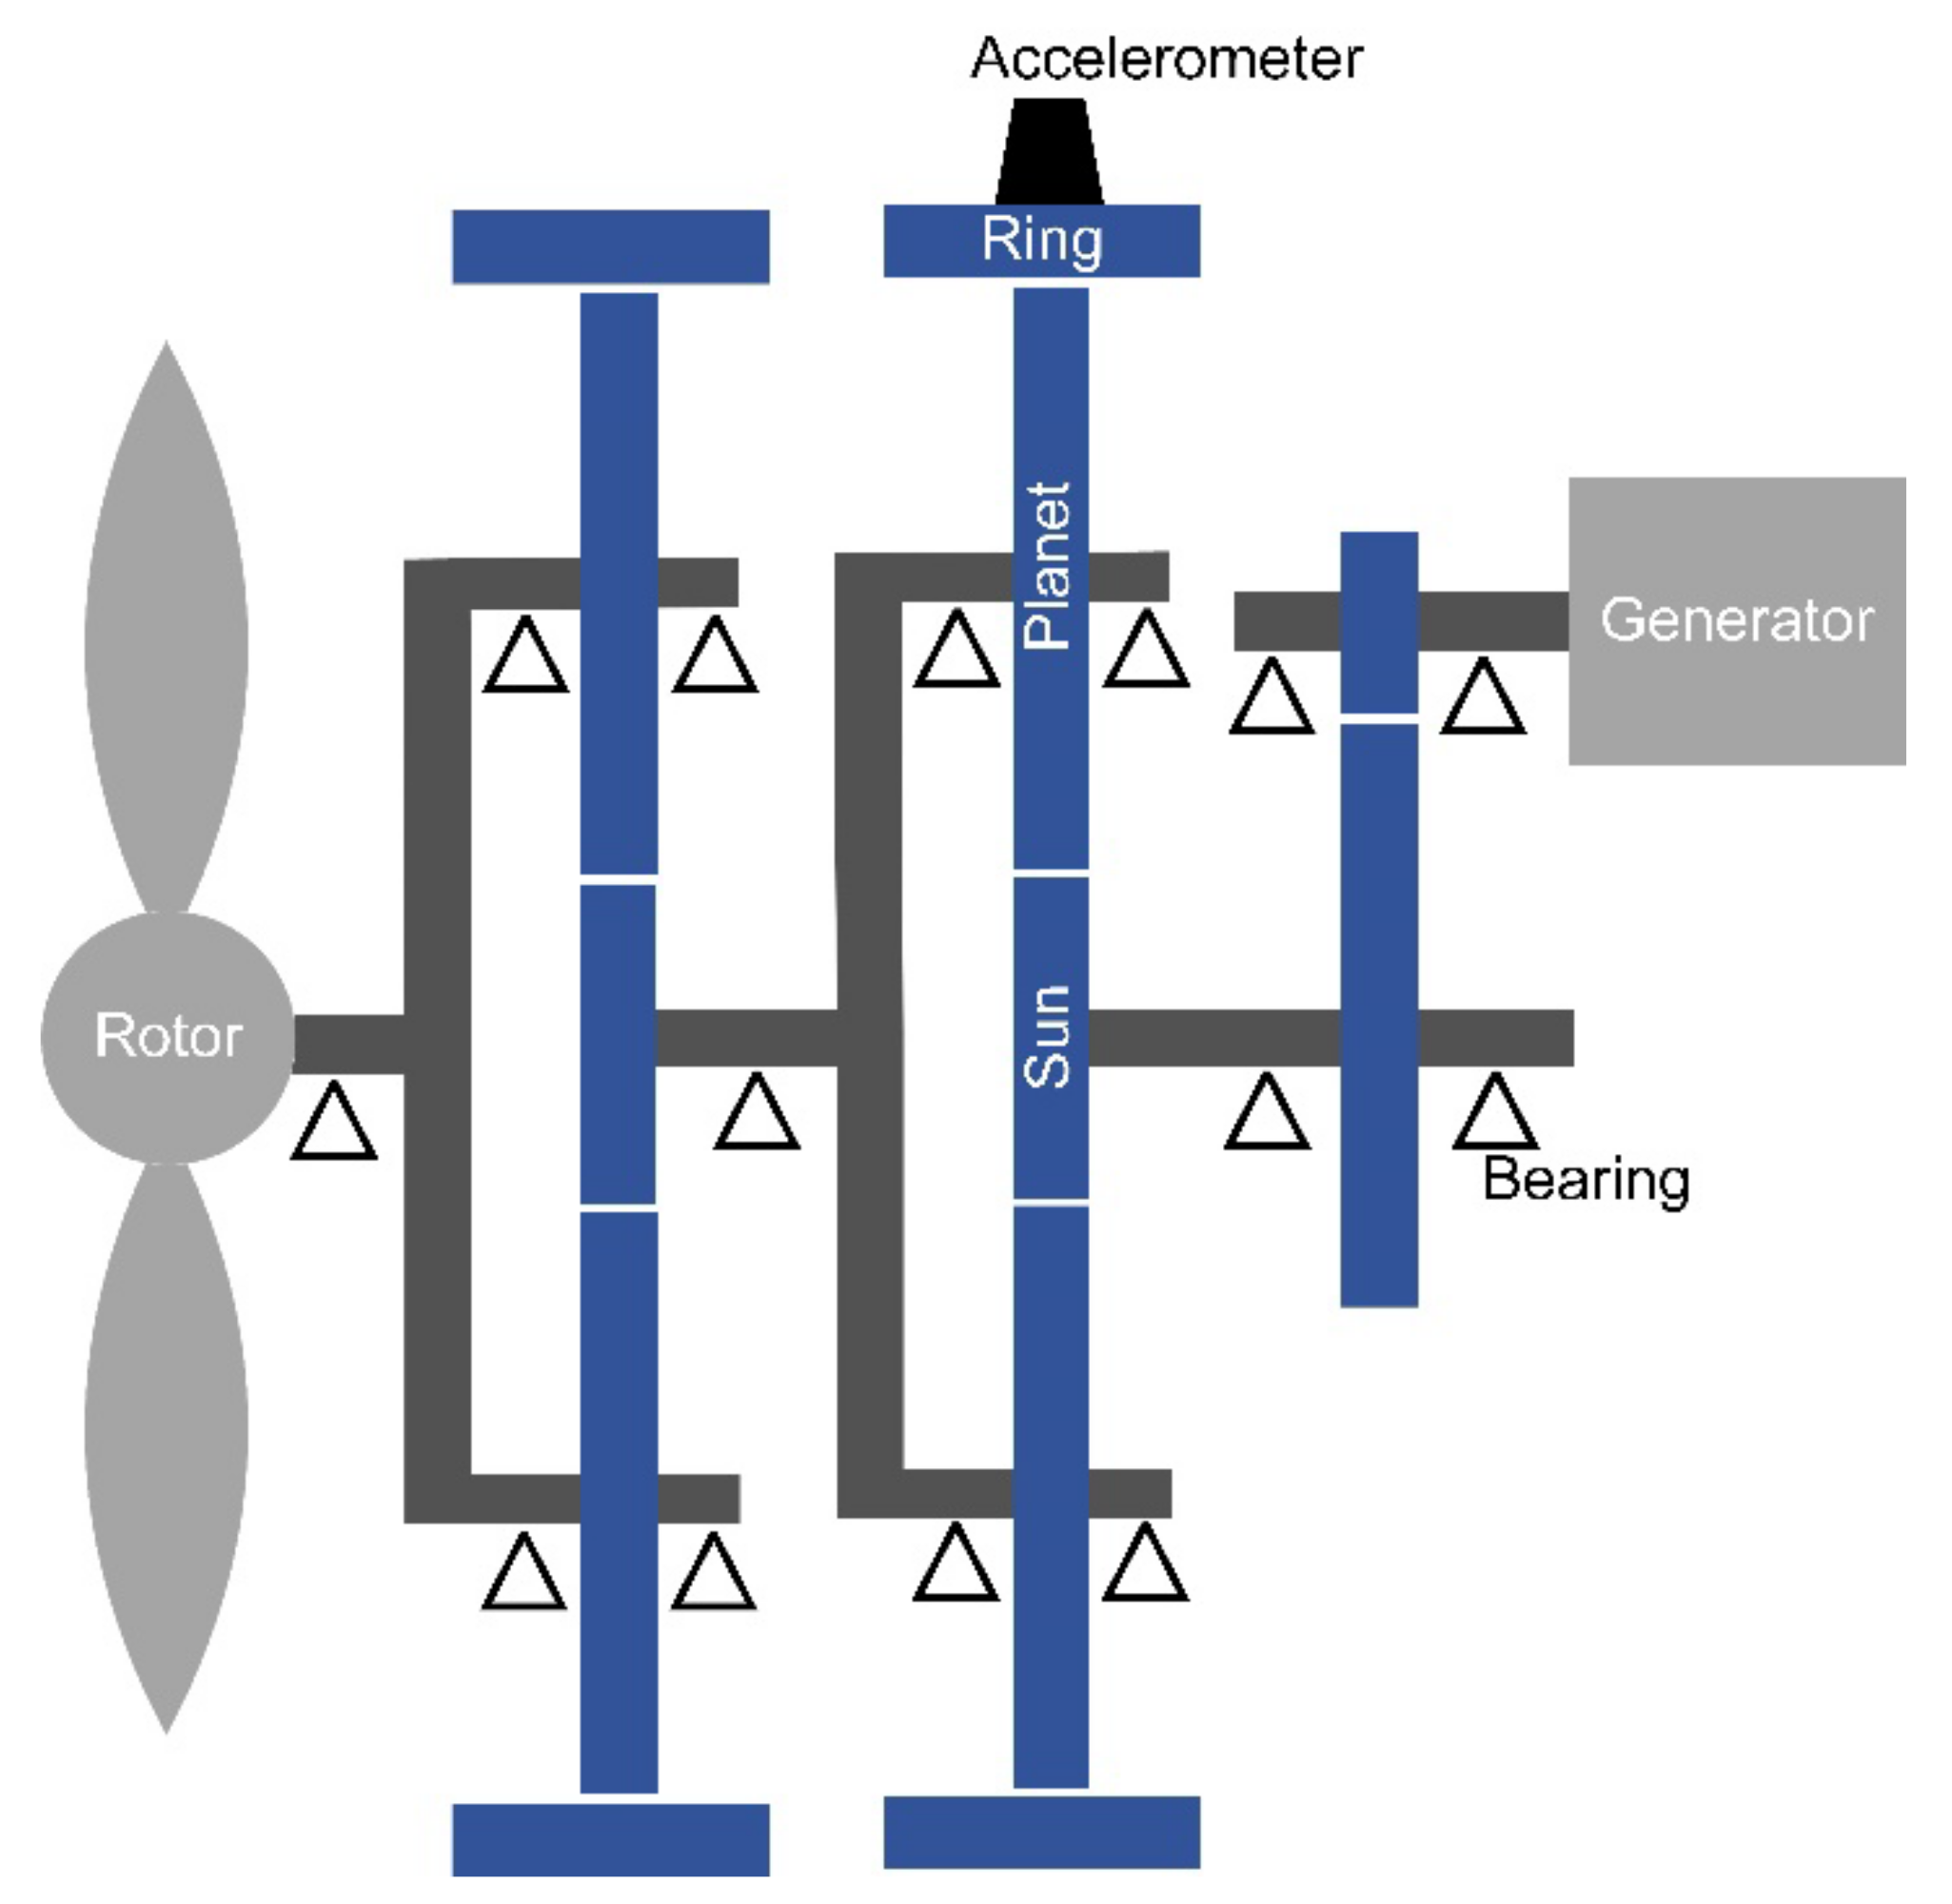
4.1. Data Collection and Augmentation
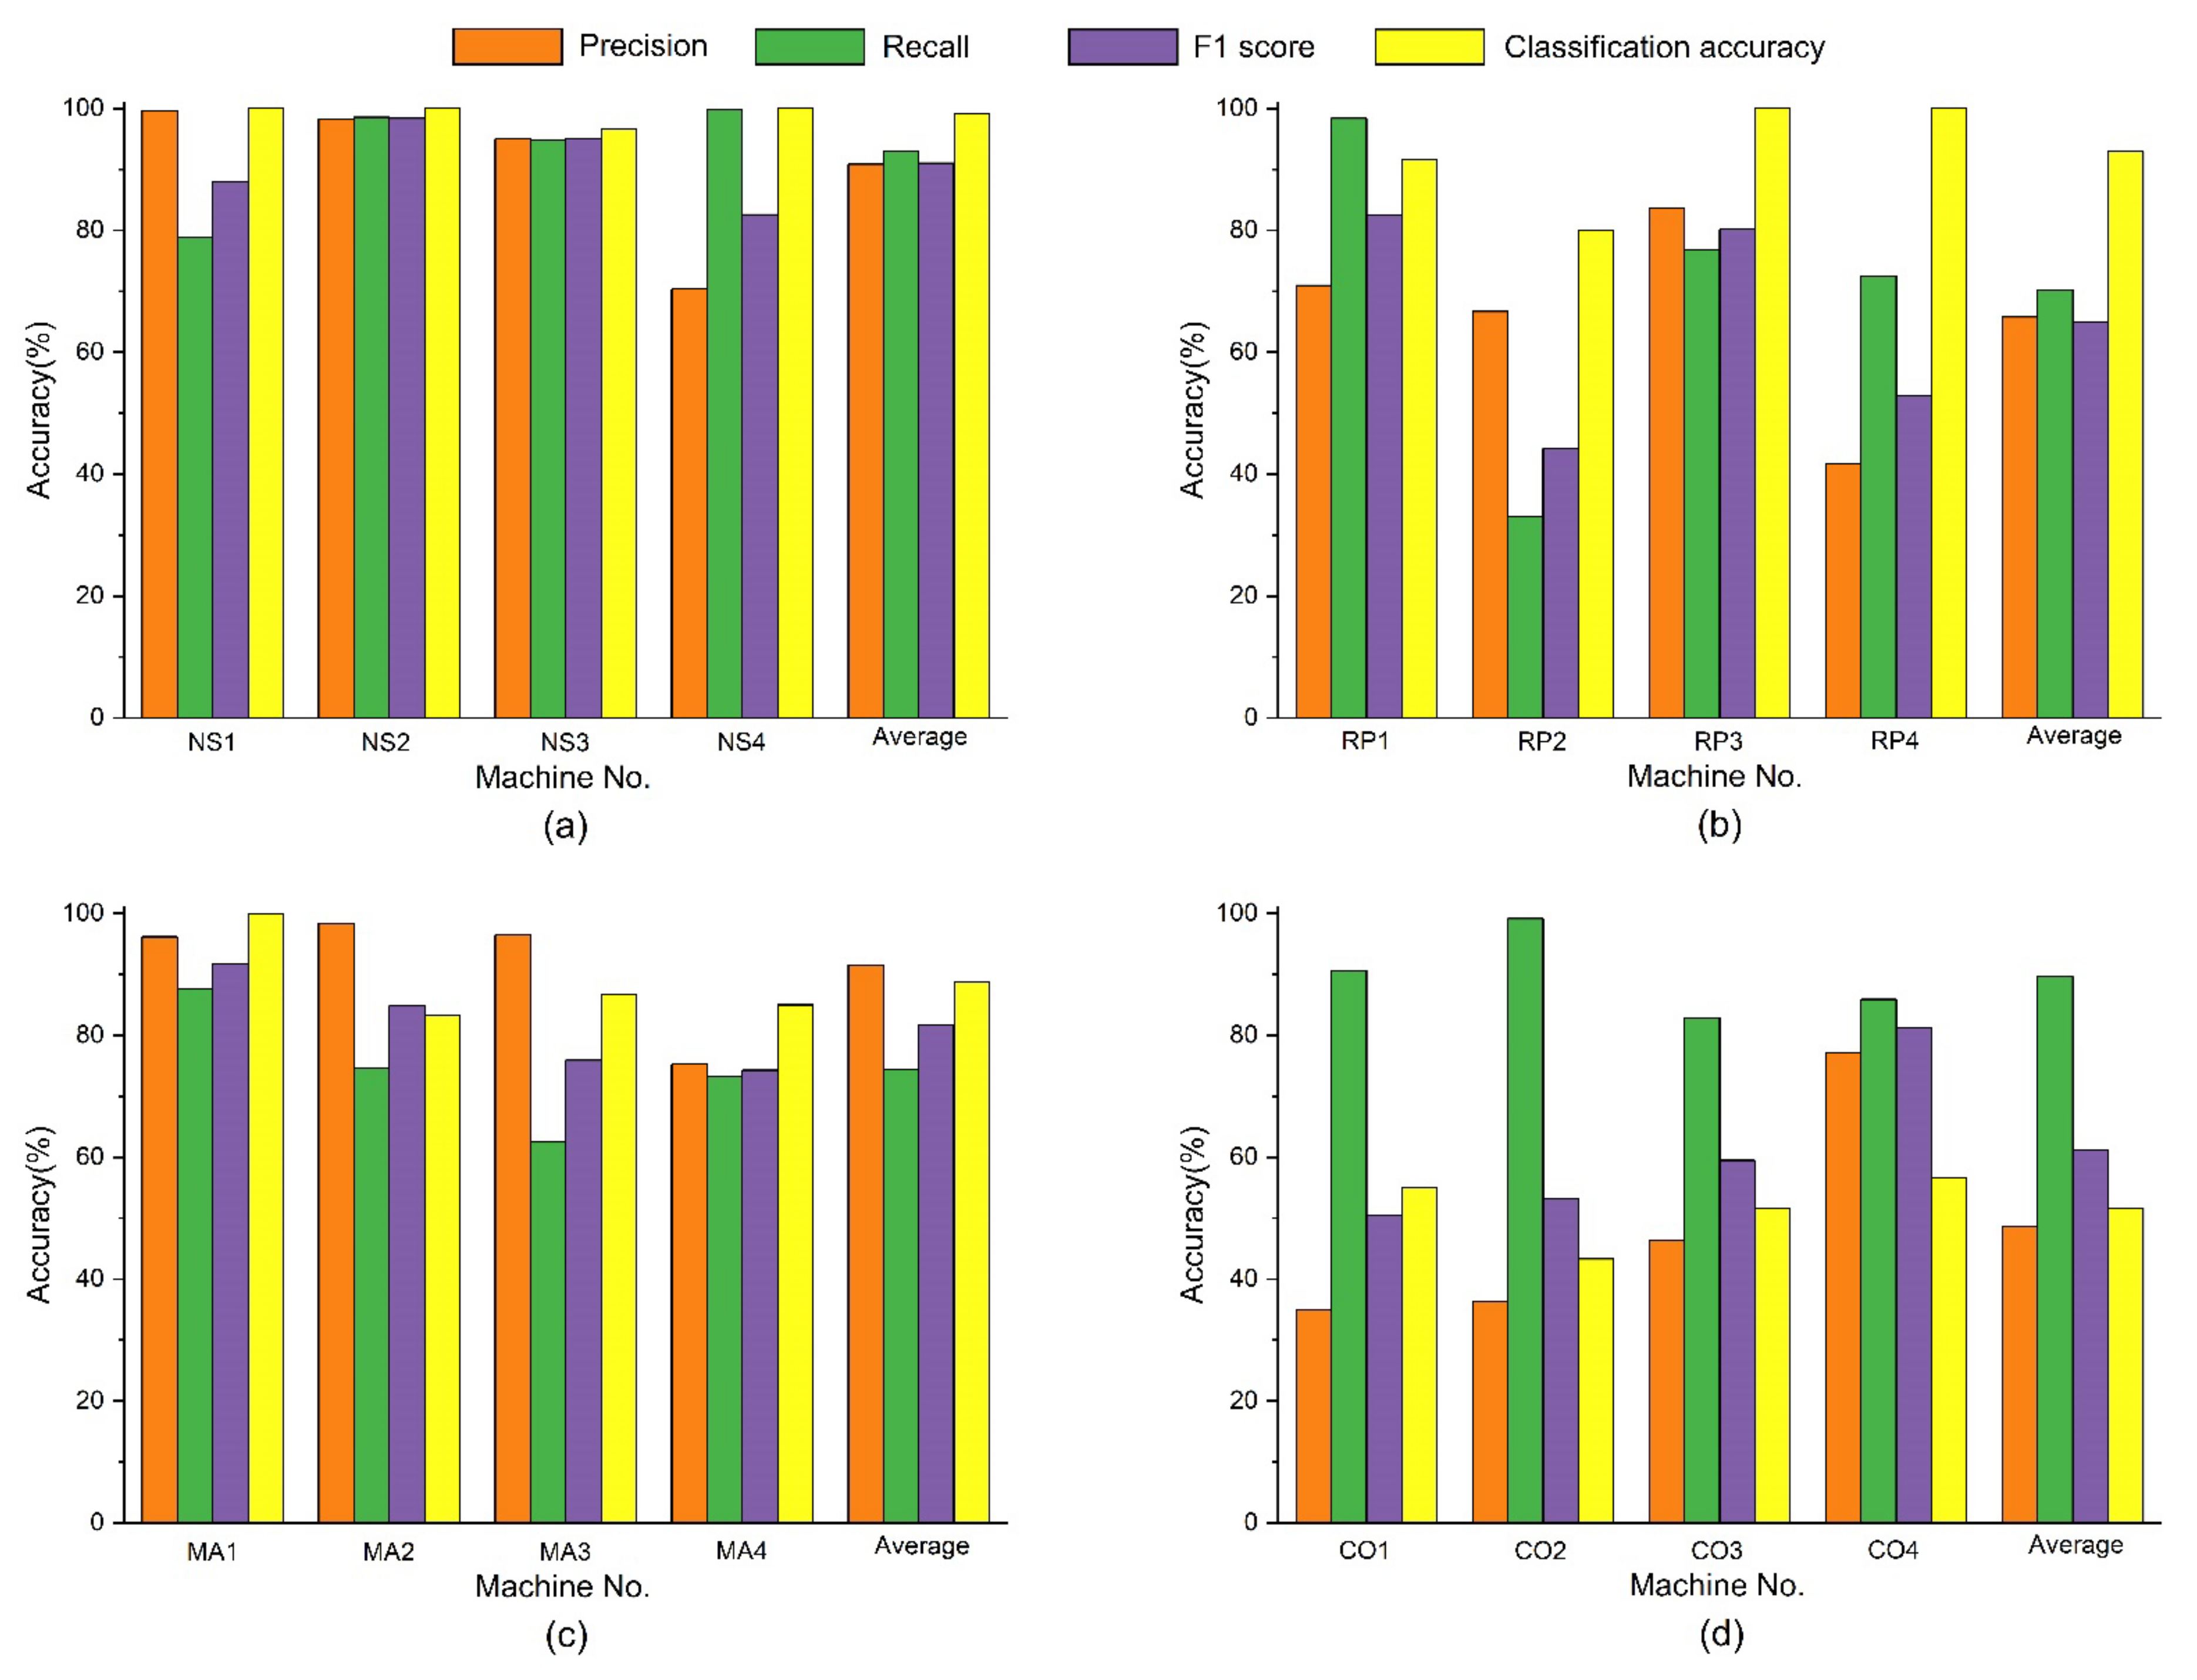
4.2. Performance Validation
4.3. Robustness against Variable Operating Environment
5. Conclusions
Author Contributions
Funding
Institutional Review Board Statement
Informed Consent Statement
Data Availability Statement
Conflicts of Interest
References
- Zhao, M.; Kang, M.; Tang, B.; Pecht, M. Deep Residual Networks with Dynamically Weighted Wavelet Coefficients for Fault Diagnosis of Planetary Gearboxes. IEEE Trans. Ind. Electron. 2018, 65, 4290–4300. [Google Scholar] [CrossRef]
- Wang, T.; Han, Q.; Chu, F.; Feng, Z. Vibration based condition monitoring and fault diagnosis of wind turbine planetary gearbox: A review. Mech. Syst. Signal Process. 2019, 126, 662–685. [Google Scholar] [CrossRef]
- Feng, Z.; Gao, A.; Li, K.; Ma, H. Planetary gearbox fault diagnosis via rotary encoder signal analysis. Mech. Syst. Signal Process. 2021, 149, 107325. [Google Scholar] [CrossRef]
- Fu, Y.; Liu, Y.; Yang, Y. Multi-Sensor GA-BP Algorithm Based Gearbox Fault Diagnosis. Appl. Sci. 2022, 12, 3106. [Google Scholar] [CrossRef]
- Hameed, S.S.; Muralidharan, V.; Ane, B.K. Comparative analysis of fuzzy classifier and ANN with histogram features for defect detection and classification in planetary gearbox. Appl. Soft Comput. 2021, 106, 107306. [Google Scholar] [CrossRef]
- Liu, T.; Cui, L.; Zhang, J.; Zhang, C. Research on fault diagnosis of planetary gearbox based on variable multi-scale morphological filtering and improved symbol dynamic entropy. Int. J. Adv. Manuf. Technol. 2022, 124, 3947–3961. [Google Scholar] [CrossRef]
- Malla, C.; Panigrahi, I. Review of Condition Monitoring of Rolling Element Bearing Using Vibration Analysis and Other Techniques. J. Vib. Eng. Technol. 2019, 7, 407–414. [Google Scholar] [CrossRef]
- Chen, X.; Feng, Z. Iterative generalized time-frequency reassignment for planetary gearbox fault diagnosis under nonstationary conditions. Mech. Syst. Signal Process. 2016, 80, 429–444. [Google Scholar] [CrossRef]
- Han, S.; Feng, Z. Deep subclass alignment transfer network based on time-frequency features for intelligent fault diagnosis of planetary gearboxes under time-varying speeds. Meas. Sci. Technol. 2022, 33, 105010. [Google Scholar] [CrossRef]
- Yuan, H.; Chen, J.; Dong, G. Machinery fault diagnosis based on time-frequency images and label consistent K-SVD. Proc. Inst. Mech. Eng. Part C J. Eng. Mech. Eng. Sci. 2018, 232, 1317–1330. [Google Scholar] [CrossRef]
- Tu, X.; Hu, Y.; Abbas, S.; Li, F. Generalized wavelet-based synchrosqueezing transform: Algorithm and applications. Struct. Health Monit. 2020, 19, 2051–2062. [Google Scholar] [CrossRef]
- Dhamande, L.S.; Chaudhari, M.B. Compound gear-bearing fault feature extraction using statistical features based on time-frequency method. Measurement 2018, 125, 63–77. [Google Scholar] [CrossRef]
- Sharma, A.; Kumar, S.; Singh, S.N. Brain tumor segmentation using DE embedded OTSU method and neural network. Multidimens. Syst. Signal Process. 2019, 30, 1263–1291. [Google Scholar] [CrossRef]
- Martinez-Aroza, J.; Gomez-Lopera, J.F.; Blanco-Navarro, D.; Rodriguez-Camacho, J. Clustered entropy for edge detection. Math. Comput. Simul. 2021, 182, 620–645. [Google Scholar] [CrossRef]
- Yang, W.; Cai, L.; Wu, F. Image segmentation based on gray level and local relative entropy two dimensional histogram. PLoS ONE 2020, 15, e0229651. [Google Scholar] [CrossRef]
- Zhang, Y.; Li, J.; Wei, S.; Zhou, F.; Li, D. Heartbeats classification using hybrid time-frequency analysis and transfer learning based on ResNet. IEEE J. Biomed. Health Inform. 2021, 25, 4175–4184. [Google Scholar] [CrossRef]
- Cheng, P.; Chen, Z.; Li, Q.; Gong, Q.; Zhu, J.; Liang, Y. Atrial fibrillation identification with PPG signals using a combination of time-frequency analysis and deep learning. IEEE Access 2020, 8, 172692–172706. [Google Scholar] [CrossRef]
- Yan, B.; Wang, B.; Zhou, F.; Li, W.; Xu, B. Sparse decomposition method based on time-frequency spectrum segmentation for fault signals in rotating machinery. ISA Trans. 2018, 83, 142–153. [Google Scholar] [CrossRef] [PubMed]
- Saulig, N.; Milanovic, Z.; Ioana, C. A local entropy-based algorithm for information content extraction from time-frequency distributions of noisy signals. Digit. Signal Prog. 2017, 70, 155–165. [Google Scholar] [CrossRef]
- Wang, Y.; Fan, Z.; Liu, H.; Gao, X. Planetary Gearbox Fault Diagnosis Based on ICEEMD-Time-Frequency Information Entropy and VPMCD. Appl. Sci. 2020, 10, 6376. [Google Scholar] [CrossRef]
- Zhao, D.; Wang, T.; Chu, F. Deep convolutional neural network based planet bearing fault classification. Comput. Ind. 2019, 107, 59–66. [Google Scholar] [CrossRef]
- Ma, S.; Chu, F.; Han, Q. Deep residual learning with demodulated time-frequency features for fault diagnosis of planetary gearbox under nonstationary running conditions. Mech. Syst. Signal Process. 2019, 127, 190–201. [Google Scholar] [CrossRef]
- Chen, R.; Huang, X.; Yang, L.; Xu, X.; Zhang, X.; Zhang, Y. Intelligent fault diagnosis method of planetary gearboxes based on convolution neural network and discrete wavelet transform. Comput. Ind. 2019, 106, 48–59. [Google Scholar] [CrossRef]
- Wang, H.; Xu, J.; Sun, C.; Yan, R.; Chen, X. Intelligent Fault Diagnosis for Planetary Gearbox Using Time-Frequency Representation and Deep Reinforcement Learning. IEEE ASME Trans. Mechatron. 2022, 27, 985–998. [Google Scholar] [CrossRef]
- Vibration Time-Frequency Images of Wind Turbine Planetary Gearboxes. Available online: https://ieee-dataport.org/documents/vibration-time-frequency-images-planetary-gearboxes (accessed on 2 May 2022).
- Ronneberger, O.; Fischer, P.; Brox, T. U-Net: Convolutional Networks for Biomedical Image Segmentation. In Proceedings of the 18th International Conference on Medical Image Computing and Computer Assisted Intervention, Munich, Germany, 5–9 October 2015. [Google Scholar]
- Falk, T.; Mai, D.; Bensch, R.; Cicek, O.; Abdulkadir, A.; Marrakchi, Y.; Bohm, A.; Deubner, J.; Jackel, Z.; Seiwald, K.; et al. U-Net: Deep learning for cell counting, detection, and morphometry. Nat. Methods 2019, 16, 67–72. [Google Scholar] [CrossRef] [PubMed]
- Liu, Z.; Cao, Y.; Wang, Y.; Wang, W. Computer vision-based concrete crack detection using U-net fully convolutional networks. Autom. Constr. 2019, 104, 129–139. [Google Scholar] [CrossRef]
- Gao, K.; Huang, L.; Zheng, Y. Fault Detection on Seismic Structural Images Using a Nested Residual U-Net. IEEE Trans. Geosci. Remote Sens. 2022, 60, 4502215. [Google Scholar] [CrossRef]
- Lau, M.; Lim, K. Review of Adaptive Activation Function in Deep Neural Network. In Proceedings of the IEEE-EMBS Conference on Biomedical Engineering and Sciences, Sarawak, Malaysia, 3–6 December 2018. [Google Scholar]
- Zhang, D. Shape Representation. In Fundamentals of Image Data Mining, 2nd ed.; Springer: Gewerbestrasse, Switzerland, 2021; pp. 133–175. [Google Scholar]
- Quinlan, J.R. C4.5: Programs for Machine Learning; Morgan Kaufmann: San Mateo, CA, USA, 1993; pp. 1–10. [Google Scholar]
- Breiman, L.; Friedman, J.; Olshen, R. Classification and Regression Trees; Wadsworth: Monterey, CA, USA, 1984; pp. 1–5. [Google Scholar]
- Gehrke, J.; Ganti, V.; Ramakrishnan, R.; Loh, W.Y. BOAT-Optimistic decision tree construction. In Proceedings of the ACM SIGMOD International Conference on Management of Data, Philadelphia, PA, USA, 31 May–3 June 1999. [Google Scholar]
- Shafer, J.; Agrawal, R.; Mehta, M. SPRINT: A scalable parallel classifier for data mining. In Proceedings of the 22nd International Conference on Very Large Data Bases, Mumbai, India, 3–6 September 1996. [Google Scholar]
- Xu, Y.; Shmaliy, Y.S.; Hua, L.; Ma, L.; Zhuang, Y. Decision tree-extended finite impulse response filtering for pedestrian tracking over tightly integrated inertial navigation system/ultra wide band data. Meas. Sci. Technol. 2021, 33, 034007. [Google Scholar] [CrossRef]
- Young, W.A.; Weckman, G.R.; Hari, V.; Whiting, H.S.; Snow, A.P. Using artificial neural networks to enhance CART. Neural Comput. Appl. 2012, 21, 1477–1489. [Google Scholar] [CrossRef]
- Luna, J.M.; Gennatas, E.D.; Ungar, L.H.; Eaton, E.; Diffenderfer, E.S.; Jensen, S.T.; Simone, C.B.; Friedman, J.H.; Solberg, T.D.; Valdes, G. Building more accurate decision trees with the additive tree. Proc. Natl. Acad. Sci. USA 2019, 116, 19887–19893. [Google Scholar] [CrossRef] [PubMed]
- Pytorch. Available online: https://pytorch.org (accessed on 16 June 2021).
- Pedregosa, F.; Varoquaux, G.; Gramfort, A.; Michel, V.; Thirion, B.; Grisel, O.; Blondel, M.; Prettenhofer, P.; Weiss, R.; Dubourg, V.; et al. Scikit-learn: Machine Learning in Python. J. Mach. Learn. Res. 2011, 12, 2825–2830. [Google Scholar]
- Adams, M.D.; Kossentini, F.; Ward, R.K. Generalized S transform. IEEE Trans. Signal Process. 2002, 50, 2831–2842. [Google Scholar] [CrossRef]
- Bloice, M.D.; Roth, P.M.; Holzinger, A. Biomedical image augmentation using Augmentor. Bioinformatics 2019, 35, 4522–4524. [Google Scholar] [CrossRef] [PubMed]
- Groschner, C.K.; Choi, C.; Scott, M.C. Machine Learning Pipeline for Segmentation and Defect Identification from High-Resolution Transmission Electron Microscopy Data. Microsc. Microanal. 2021, 27, 549–556. [Google Scholar] [CrossRef] [PubMed]


| Component | Planet | Ring Gear | Sun Gear |
|---|---|---|---|
| Teeth | 39 | 101 | 22 |
| Data | Precision | Recall | F1-Score |
|---|---|---|---|
| Test Dataset | 0.933 | 0.951 | 0.942 |
| NS | 0.943 | 0.953 | 0.948 |
| RP | 0.886 | 0.897 | 0.891 |
| MA | 0.955 | 0.955 | 0.955 |
| CO | 0.801 | 0.952 | 0.87 |
Disclaimer/Publisher’s Note: The statements, opinions and data contained in all publications are solely those of the individual author(s) and contributor(s) and not of MDPI and/or the editor(s). MDPI and/or the editor(s) disclaim responsibility for any injury to people or property resulting from any ideas, methods, instructions or products referred to in the content. |
© 2023 by the authors. Licensee MDPI, Basel, Switzerland. This article is an open access article distributed under the terms and conditions of the Creative Commons Attribution (CC BY) license (https://creativecommons.org/licenses/by/4.0/).
Share and Cite
Zhang, P.; Chen, C. A Two-Stage Framework for Time-Frequency Analysis and Fault Diagnosis of Planetary Gearboxes. Appl. Sci. 2023, 13, 5202. https://doi.org/10.3390/app13085202
Zhang P, Chen C. A Two-Stage Framework for Time-Frequency Analysis and Fault Diagnosis of Planetary Gearboxes. Applied Sciences. 2023; 13(8):5202. https://doi.org/10.3390/app13085202
Chicago/Turabian StyleZhang, Pinyang, and Changzheng Chen. 2023. "A Two-Stage Framework for Time-Frequency Analysis and Fault Diagnosis of Planetary Gearboxes" Applied Sciences 13, no. 8: 5202. https://doi.org/10.3390/app13085202