1. Introduction
The growth of large-scale assessment (LSA) data worldwide has presented a number of quantitative research studies in the educational assessment discipline [
1]. Although traditional statistical and econometric analysis is widespread, techniques such as data mining (DM) and machine learning (ML) have become increasingly prevalent [
2,
3,
4,
5], encompassing the so-called educational data mining (EDM) field [
6]. One of the most tackled problems by previous EDM researchers is identifying factors that contribute to educational performance. These studies often use the traditional educational production function (EPF) [
7] in which inputs lead to better outputs. Therefore, the strongest correlation between contextual variables and academic performance is explored by means of a supervised learning paradigm to derive insights about educational determinants [
2,
3,
5,
8,
9,
10,
11,
12,
13].
Most of these studies lack causal reasoning, limiting their adoption in the decision-making process. Causality is a fundamental scientific concept and randomized controlled trials (RCTs) are widely considered the gold standard in this direction. However, RCT can be expensive or may not be ethical to conduct. As a result, a large body of the literature has been developed around the use of observational data.
In recent decades, this topic has been increasingly coupled with DM and ML with the goal of creating more generalized models [
14]. Despite this, these researchers have yet few implications for social science problems [
15]. Conversely, in the social sciences, a set of canonical methods for causal inference has been used for decades [
16]. Unlike theoretical math and those that are strongly data-driven from the ML paradigm, these methods are design-based with assumptions based on domain knowledge. These methods are specific and often referred to as identification strategies [
15].
To achieve more actionable results in data analysis, a promising approach involves combining the flexibility of DM and ML with the robustness of traditional models from economics. This combination has been recently discussed, but little attention has been paid to the education assessment discipline. By leveraging the strengths of both EDM and traditional models, researchers in this field may be able to produce more accurate and actionable insights into student learning and achievement.
Additionally, an essential aspect of the literature on causality is the concept of intervention. Interventions can be understood as data variations that change the system [
17]. From a temporal perspective, intervention can be modeled in conditional probability, where previous inputs change subsequent outputs [
18]. In this paper, we utilize simple economics and machine learning models within a causal framework to identify which interventions have improved educational performance over time. By analyzing interventions in this way, we aim to provide insights into the most impactful strategies for enhancing student learning outcomes.
It is important to note that while a causal framework can open a path to reduce bias in results, it does not guarantee recovery of the true interventions, as causal inference in observational data is complex and requires many assumptions. Nevertheless, this paper goes beyond most previous EDM studies on LSA data by attempting to find more actionable results that are difficult to see in a purely data-driven approach due to unobserved confounders.
This work offers a two-fold contribution. Firstly, from a methodological perspective, it introduces a novel interdisciplinary approach to mining interventions associated with educational achievement within a causal framework. This approach combines economics and EDM techniques, presenting a simple and effective solution for presenting new knowledge and informing future policies and practices. Secondly, it provides valuable insights into Brazilian secondary education, utilizing data from the national test (ENEM) and the school census from 2009 to 2019. Brazil is a continent-sized country with a significant economy and the world’s second-largest secondary LSA [
19], which has received little attention from the scientific community.
The structure of this paper is as follows.
Section 2 describes a brief literature review, while
Section 3 introduces an inherent and required background. After that, the overall method is explained in
Section 4, and the results are summarized in
Section 5. Finally, in
Section 6, the conclusion and directions for further work are discussed.
2. Literature Review
Educational assessment using quantitative methods in the policy arena emerged in 1960 [
20] and various topics have been present since then. Recently, a collection of fast-growing articles in the literature has developed, bringing new tools such as algorithms, data preprocessing techniques, frameworks, and model validation methods [
21]. The integration of these novelties with traditional analysis techniques has been discussed for at least two decades [
22], with some contributions in the educational domain [
2,
10]. This section briefly describes the use of DM and causal framework in education while presenting some works using LSA data.
2.1. Educational Data Mining
Despite the advances in EDM and the evolution of frontiers using ML methods in the educational environment, most research in this field has only focused on data from information systems or learning management systems from specific institutions [
23]. However, EDM is still in its early stages when applied in the context of LSA.
Existing works in this direction often advocate for the novelties of EDM as an alternative framework to traditional statistical techniques due to their flexibility in handling the sheer volume of data in a strong data-driven approach [
4,
9,
24]. Additionally, EDM partially fills an important gap in the education literature. Often, policymakers and educational practitioners ask questions in broad terms (e.g., What are the factors related to academic achievement? How can we improve academic achievement?) [
25], while researchers have been addressing a narrower hypothesis (e.g., What is the effect of ICT on math achievement?). Therefore, using DM can be helpful to validate existing theories or leverage new knowledge to be further investigated.
The most common approach is the supervised learning paradigm in which student achievement is predicted in the function of contextual variables [
10,
11,
26]. The findings reporting is often featured by ranking feature importance [
3,
26]. Additionally, some studies probed their results by exploring additional explainable techniques such as partial dependence plots [
2,
27,
28,
29], decision trees, and rules [
30,
31].
2.2. Traditional Causal Strategies
Traditional causality identification strategies from the economics and psychology literature are well-established and widespread in applied studies [
15]. Under LSA data, design-based techniques such as propensity score [
32], difference-in-difference [
33], instrumental variables [
34], regression discontinuity [
35], and its fixed-effects variation [
36] have been used for decades to infer causal effects of specific hypotheses empirically. They often rely on the potential outcomes (PO) framework [
37]. The PO, in the simplest case with a binary treatment, consists of computing the difference between effects from data points assigned with the treatment and those that do not.
2.3. Causality in ML
The causality literature has received significant attention in recent decades within the ML community, and many methods have been developed. These methods are often referred to as causal inference and causal discovery [
38]. Generally, there is a big difference in how the questions are asked. For example, to infer a causal relationship, the investigator seeks to discover the extent to which some variables would change if the value of another variable were changed [
39]. On the other hand, to discover causal relationships, the investigator seeks to infer rules automatically from data rather than relying on humans to conceive a prior hypothesis [
40].
Most of these methods are shaped by the Judea Pearl framework [
41], which gave rise to graphical models. These graphs, under strong assumptions [
42] and through sequences of conditional independence tests, try to recover aspects of the system from the relationships in the data. Despite considerable advances in certain tasks, such as graph computing, and still considered fundamental in the artificial intelligence field [
40] they have little practical use in social science and high-stakes problems. This is mainly due to their underlying assumptions, which are hard to meet in the real world [
15]. For example, in a recent study under LSA data, the differences in achievements between rural and urban schools in China were described [
43]. The author relied on assumptions of unconfoundedness and the ability of a sequence of statistical independence to infer causality.
A promissory causal strategy is a framework that connects invariance to causality [
44,
45]. The theory behind these approaches is to split the dataset into different environments drawn from the same distribution and learn stable relationships across them. This process assumes that the causal structure remains the same for different subpopulations. Therefore, it highlights potential causal relationships of the heterogeneous environments that persist regardless of differences in the unobserved effects. However, this strategy has challenges in the learning process [
46,
47] and has little practical use [
48].
2.4. ML in Causality
Canonical econometrics models have also taken advantage of the advancements in supervised machine learning (ML) methods [
14,
49]. The main reason is the ability of ML to reduce the risk of misspecifications and bias in the potential outcome predictions [
16,
50]. For example, [
51] used the random forest algorithm [
52] to split the data into subgroups and propensity scores to investigate the effects of heterogeneous treatment under the assumption of no hidden confounder. Furthermore, [
53] developed a causal method that relies upon independence tests and PSM to discover causal relationships, which are then represented in a tree structure. In this context, a promising research direction within the field of LSA would be to apply these new methods as a plugin, with relevant modifications, to estimate the influence of specific variables on student outcomes.
In [
54], the authors used a modified causal forest [
51], to handle the hierarchical structure of the LSA data. The authors sought to investigate the effect of private math lessons on student achievement. Additionally, in [
50], the authors instanced the double machine learning method [
55] that, in an ML manner, extends the idea of the doubly robust estimation from economics [
56] to study the effects of musical practice on child development under the German National Economic Panel Study.
2.5. Summary
Previous works that use EDM to explore LSA data can be divided into two categories: (1) those that use ML to reduce the misspecification of traditional causal theory-based models and (2) those that use ML to uncover new hypotheses about the data. Studies in the first category aim to estimate the causal effects of pre-defined treatments in an underlying population, while studies in the second category, similar to this paper, aim to extract variable effects based on feature importance, often using a supervised learning paradigm. To the best of our knowledge, among previous work in the second category, only [
43] uses a causal framework to uncover the effects of variables related to academic performance. However, Lee’s methodology based on [
57] requires assumptions of unconfoundedness, which is the primary concern of this paper.
In doing so, this paper does not provide a new method, but it contributes to the literature by presenting a novel approach that combines simple econometrics and EDM methods within a causal framework. This approach aims to mitigate bias caused by unobserved confounders and identify factors associated with gains in educational performance.
3. Theory Background
3.1. Structured Equation Model
Causal reasoning requires causal models. This study relies on the structural causal models (SCM) to provide a comprehensive theory of the causal structure of performance in Brazilian public secondary schools. The fundamental concept of SCM traces back to [
58], who championed the use of structural equations and paths to depict the direction of effects between variables. The modern theory of SCMs emerged more recently in the computer science discipline [
17] and typically comprises two components: causal graphs and mathematical representations of structural equations.
3.2. Causal Graphs
Causal graphs , also known as directed acyclic graphs (DAGs), represent direct and non-cyclical relationships among system variables. The graph is composed of a node set V, and an edge set (). Each node represents a variable inherent to the underlying phenomenon and a direct edge denotes a causal effect of X on Y. The absence of a link between two variables may be interpreted as the absence of a direct causal effect with respect to the other variables in the graph. Any variable is a cause of its descendants. The causal Markov assumption supports this interpretation, and a variable, when conditioned on its direct causes (parents), is independent of any other variable for which it is not a cause (non-descendants).
The concept of conditional independence is related to dependency-separation (d-separation), which involves blocking all paths (back-door criterion) between two variables (e.g., from X to Y) through a set of nodes S, written X⊥⊥ Y| S. This conditional independence provides ample information to determine if S is a sufficient set of variables to adjust in order to infer the causal relationship between X and Y by applying a particular causal inference method.
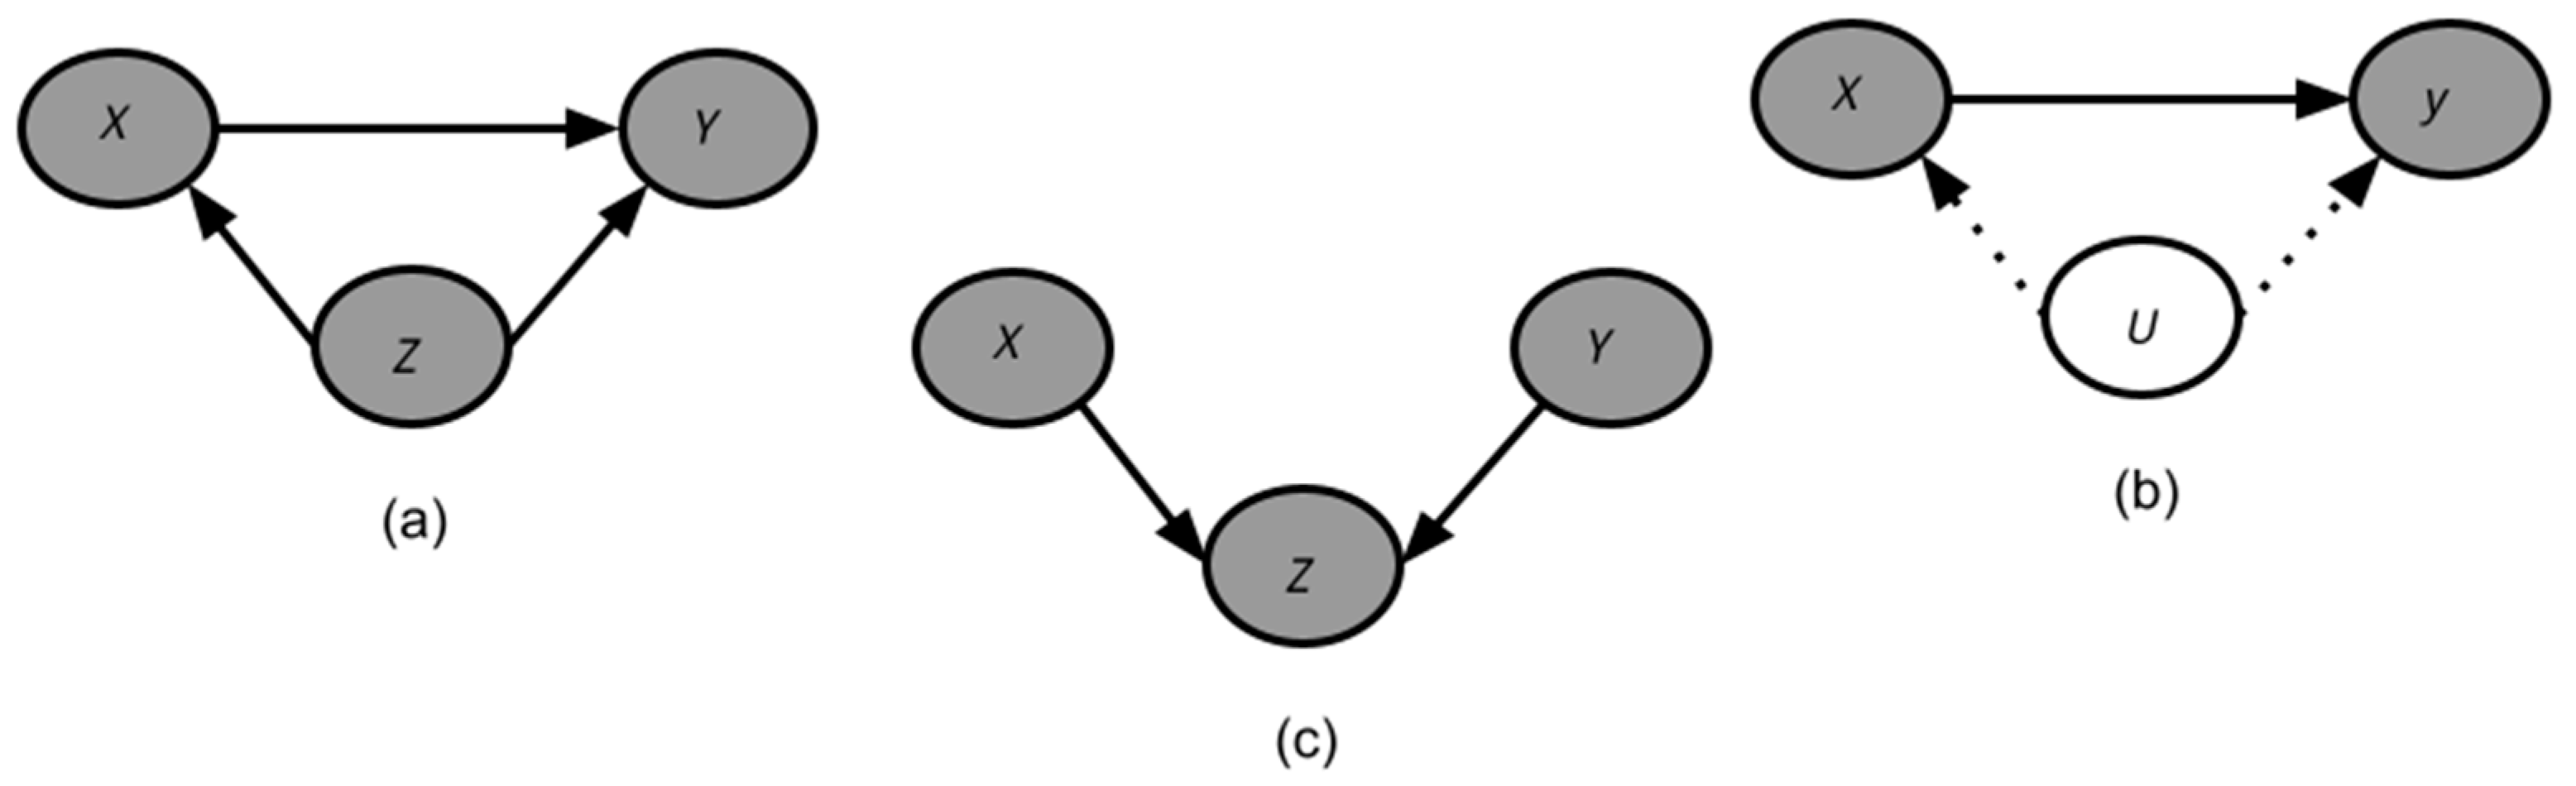
Definition 1. Back-door criterion: given a cause-effect pair (X, Y), a set of variables S satisfies the back-door criterion of (X, Y) if and only if conditioning on S blocks all paths, except for the direct path, which ends with an arrow pointing to X. In Figure 1a, in order to infer the causal effect of X → Y, it is necessary to block the back-door path X → Z → Y by adjusting for Z, or the results will be biased. Therefore, Z can be referred to as a confounder. Definition 2. Confounder: given a cause-effect pair (X, Y), a variable Z ∉ X, Y is a confounder if it plays a central role in a fork and is on a back-door path of (X, Y).
According to
Figure 1b, it is not possible to block the back-door path
X → U → Y since the confounder
U is unobserved. Specifically, the computed effect of
X → Y will be biased due to the unobserved effect of
U, requiring a specific causal identification to address the confounder effects of
U. In
Figure 1c, both
X and
Y cause
C, and there is no causal effect or association between
X and
Y. However, adjusting for Z incorrectly will introduce bias since a non-existent association between
X will be inferred. Therefore,
C is a collider and cannot be on back-door paths even when it is a confounder.
4. Methodology
This paper combines eleven surveys of secondary students’ background information and academic performance from the second-largest secondary education test worldwide to investigate what has been improving Brazilian schools´ performance from 2009 to 2019. Specifically, we are interested in the potential interventions over time that may have led to variations in outcomes, after controlling for the primary sources of unobserved confounders in an underlying period. The methodology has three main components: (1) the theoretical modeling of educational outcomes in Brazilian secondary education to map the main sources of unobservable confounders; (2) the estimation of the strength of the relationship between changes in contextual variables and outcomes; (3) the investigation of a more detailed picture of the relationships identified in the previous step.
4.1. Theory-Modeling
Academic performance is a multi-causal phenomenon that is influenced by a range of factors from multiple levels. In the context of Brazilian basic education in [
59], the authors propose a conceptual framework where student performance is directly linked to the characteristic of the students, family, school, and the educational system in which they are involved. While a significant amount of data has been collected as a result of government efforts, many factors that impact academic performance cannot be accurately measured and can bias the data analysis.
Brazil has many differences that distinguish how the educational system works across the country. Data-driven analysis that considers all data as drawn for the same distribution can be biased and misleading. A more effective approach may be to analyze educational achievement separately by region, state, microregion, or city. However, this can limit the main potential of data mining and machine learning techniques, which are specifically designed to extract knowledge from extensive databases. Therefore, the findings are powerful enough to support further in-depth investigations, enabling researchers to reassess and refine existing theoretical models [
24]. Another challenge of cohort analysis is the difficulties in interpreting and summarizing multiple outputs aiming for national policy implications.
As in every federal nation-state, Brazilian secondary schooling is mainly the legal responsibility of the constituent states with different politics and state bureaucracies [
60,
61] and certainly differs in how each one influences its own educational system. Although public secondary schools could be at a municipal level, most of the schools (99%) in our final dataset are from the state level. In addition, studies have shown that even in municipal schools, the impact of state-level efforts is significantly greater than that of efforts made at the municipal level [
60]. Therefore, state-level interventions seem to be an important source of bias when analyzing national data.
In addition to the state effects, the education literature has discussed the bias in the level of the schools, which is not captured in the data collection [
4,
62]. These studies explore the degree to which an underlying school performs better than expected due to its inherent unmeasured pedagogical strategies. Thus, assuming that all schools within the same state have been drawn from the same distribution may be another important source of bias. Finally, at the student level, the student motivation, commitment, and previous skills, which cannot be measured in the observed data, could embed bias in national models, as is acknowledged in existing educational research [
63,
64].
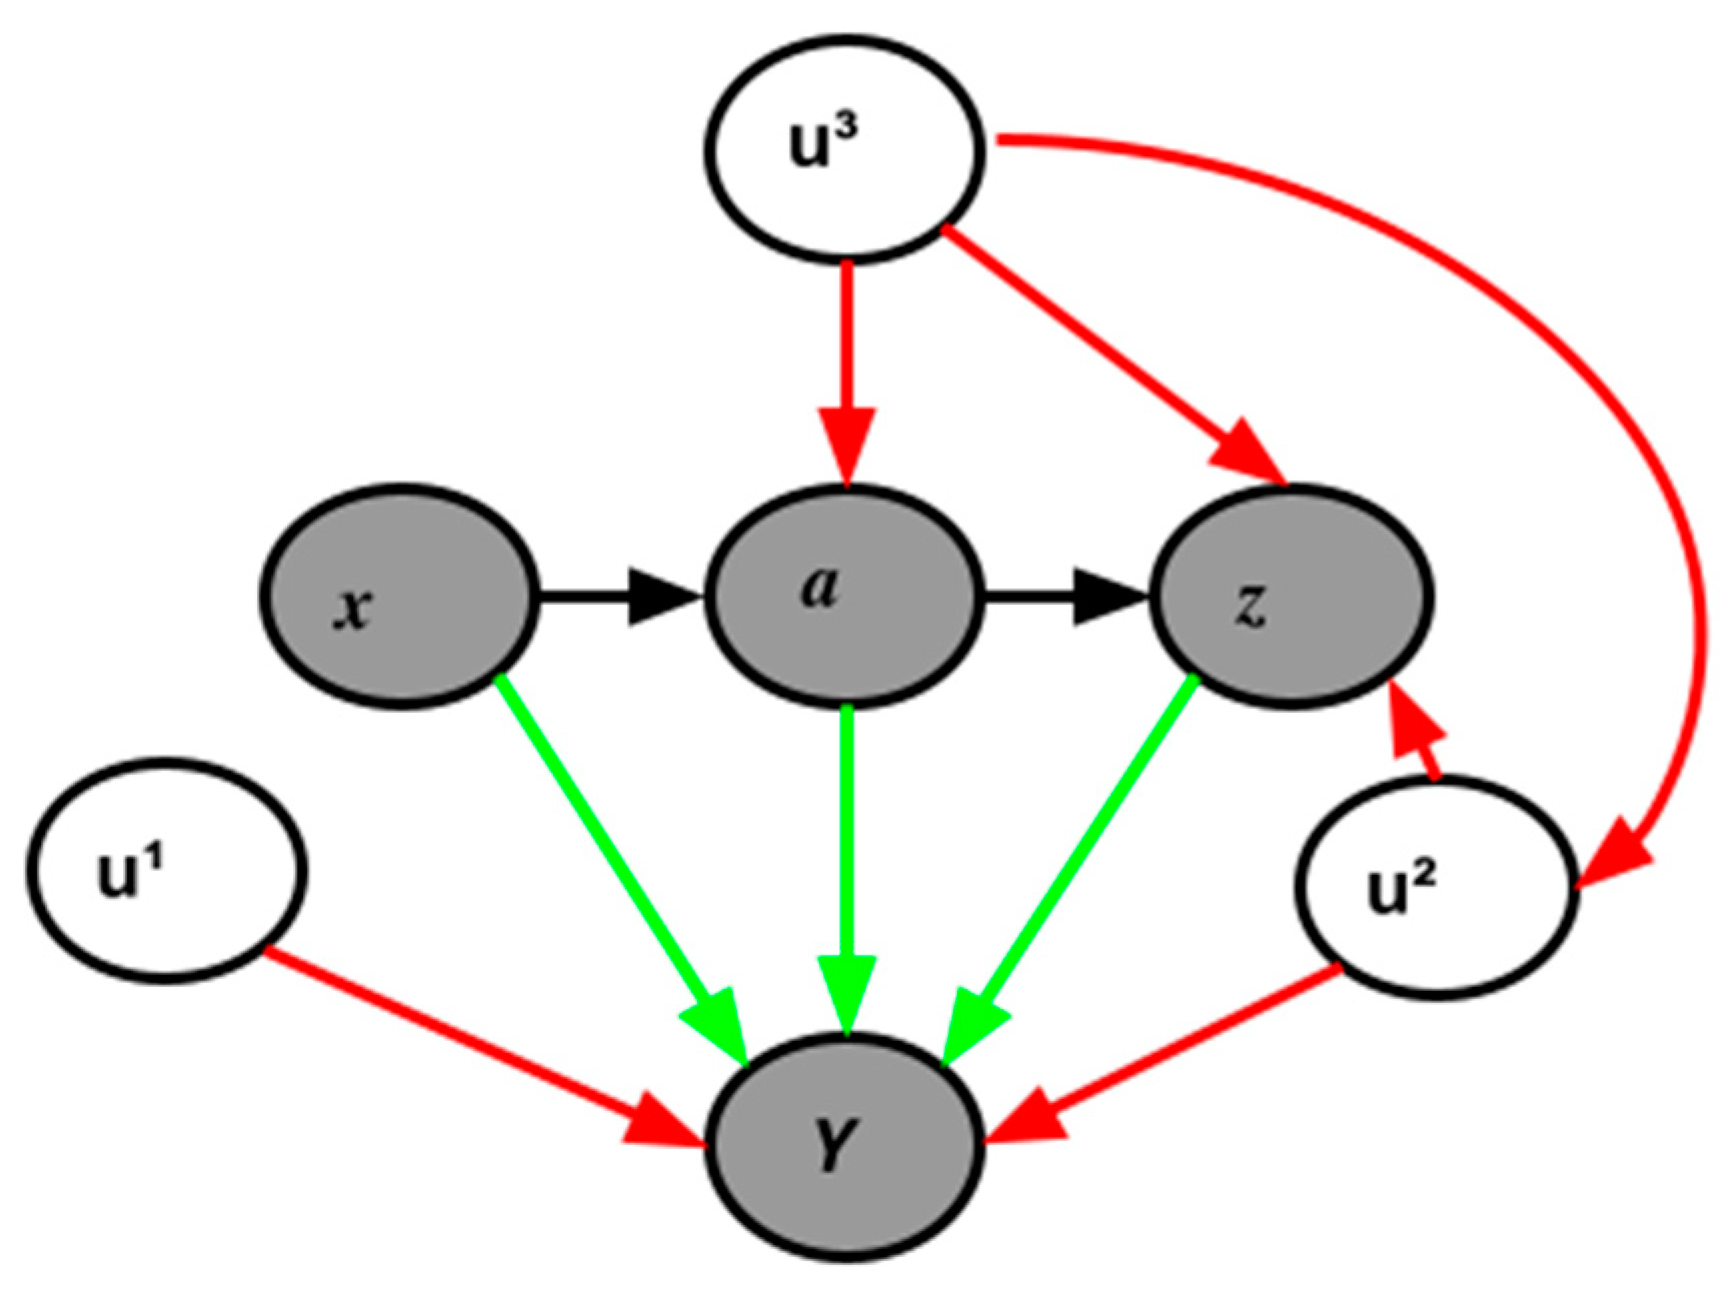
Taking into account these theoretical constructs related to educational achievement and the interactions among these variables,
Figure 2 presents a potential causal diagram based on DAG for the performance of public Brazilian secondary education. For the sake of simplicity, the variables present in the dataset have been grouped into categories.
Grey nodes denote the observed variables, where X is the student´s non-actionable features, such as sex and race, A is the student´s socioeconomics, including parent’s education, and Z is the variables related to schools, including infrastructure, teacher characteristics, and class information. The white nodes denote the unobservable variables U, where the exponents represent the level, with 1 representing student-level variables such as self-confidence, commitment, and cognitive skills, 2 school-level variables related to specific practices, and 3 representing state-level variables related to specific policies. Y represents the final indicator of performance. The red arrows indicate the effects of the unobserved variables on the other variables, and the blue and green arrows indicate the direct effects on performance.
Understanding how these variables interact within the educational system is a complex task, as with most social science problems, and although it is not possible to establish exactly the causal pathways, identifying key points is essential to reduce biases from knowledge extraction. In doing so,
Figure 2 illustrates the influence of students´ socioeconomics on the school variables, as students with better social conditions tend to attend better schools {
A → Z}. Additionally, schools located in poor neighborhoods tend to have the worst conditions. The non-actionable factors are linked with socioeconomic factors due to the strong bias from historically disadvantaged groups {
X → A}. Finally, the unobservable variables at the student level are independent of other variables, as it is plausible to assume that these characteristics are homogenous across the country.
4.2. Predicting and Explaining Changes in the Outcomes
This study aims to identify interventions related to school improvement in Brazilian public secondary education. We argue that these interventions may be represented by shifts in the values of certain observed variables over time. By examining the statistical relationship between these shifts and changes in school performance over a given period, we can gain insights into the effectiveness of educational policies. Specifically, we are interested in a model that can determine changes in the direct effect of contextual variables X, A, and Z on changes in outcome Y, while controlling for the unobserved variables U.
Following the backdoor criterium and the proposed causal graph, to compute the direct effect of , it is necessary to close the indirect path X A Y, by adjusting for A. This will open a new indirect path X A U3 {Z, U2} Y due to the collider role of U3, thus making it necessary to adjust at least for A and U3. To compute the direct effect of A Y, it is necessary to close the indirect paths A X Y, A Z Y, and A U3 {Z, U2} Y by adjusting at least for X, Z, and U3. Lastly, to compute the direct effect of Z Y, it is necessary to close the indirect paths Z U2 Y, Z A Y, Z A X Y and Z U3 U2 Y by adjusting for at least for A and U2.
Therefore, a model seeking to compute the effects of {
X,
Z A}
Y might adjust for all observed variables, as well as the unobservable effects of states (
U3) and schools (
U2). However, since
U2 and
U3 are unknown, assumptions must be made about them in order to adjust correctly. Assuming they are time-independent and constant over a given time period, it is possible to control for them using a two-way fixed-effects (TWFE) econometric approach. This technique has been established and extensively used to treat unobserved heterogeneity [
65,
66], including in some research using LSA data [
67,
68]. Under these assumptions, TWFE is a powerful statistical tool for causal inference under observational data due to its ability to control for unobserved and time-invariant confounders [
69,
70].
Assumption 1. The effects of policies on each state and school are invariant and constant over a specific period.
It is plausible that state policies hold in the medium or long term. The last Brazilian Educational Plan, which is expected to strongly influence state strategies, established its goals for the ten-year period of 2014 to 2024. Additionally, institutional changes occur gradually and evolutionarily rather than radically, particularly in democratic societies [
71]. The minimum expected term of office for school principals and Brazilian politicians, which often head the implementation of new policies, is three and four years, respectively. Consequently, the institutional structures of education systems remain relatively similar during the time a student spends in secondary school.
Assumption 2. The structural education models follow a parametric and additive linear function.
To adjust correctly to the effects of the unobservable effects is necessary to assume a parametric linear distribution of the structural equation. Therefore, they can be straightforwardly modeled as follows:
where
is the average performance for school
i state
j, and time
t, which are “de-meaned” in the first place to the school level and next at the state level
is the set of contextual variables,
U are the unobservables, and
ε is the random error term. To effectively systematize the objective of this study, it was transformed into a binary classification problem. The target variable
, where 1 represents schools with performance gains (differences over the mean in the two levels) in upper quartile of the distribution and 0 represents the remaining schools. Quartiles of the distributions are robust against extreme values (outliers) (Johnson et al., 2002) and provide a higher level of abstraction.
Lastly, a logistic regression technique was used to generate the propensity score for a school being in the third quartile, as indicated in Equation (1). The logistic models explicitly present the knowledge extracted from data in terms of the coefficients (
β) validated by their statistical significance (
p-value). The model was carried out in ten different time windows, which end in the last year of the period (varying their start from the first year of the period to
− 1.
4.3. Model Evaluation
The models were evaluated in a 10-fold cross-validation setting using the Area Under Receiver Operating Characteristic Curve (AUC_ROC). The AUC_ROC is a widely used tool to assess binary classifiers across the entire continuous domain of decision (the score range). The bigger the area, the closer the system is to the optimum decision curve, with the ideal decision system having an AUC_ROC equal to one.
4.4. Detailing Specific Policies
An important aspect of this research is to leverage new insights about the data to support the validation, proposition, or improvement of educational policies. In this direction, an important exercise is to understand deeper the role of variables highlighted in the previous model as the most predictive and which can be directly linked to the effectiveness of policies. In this step, the use of posterior information from the predictive model allows for the validation and extraction of more knowledge about data patterns and potential heterogeneity. This exercise using high-level interpretable techniques such as classification rules and decision trees can further support the understanding of settings that lead to gains in performance.
4.5. Data
The data utilized in this study is sourced from the Brazilian National Secondary School Exam (Exame Nacional do Ensino Médio—ENEM). The ENEM data includes socioeconomic information on students collected through self-questionnaires, as well as the student performance (our measure of performance) from five different tests (math, languages, natural sciences, human science, and an essay). Additionally, the national school census, which provides information on the conditions of Brazilian schools, including physical infrastructure and faculty details, is also utilized. Together, these databases offer a wealth of information on Brazilian secondary education and are publicly available [
72]. The data covers the period from 2009, when the ENEM was reframed to make it comparable over time, to 2019, the latest year for which data is available for both databases during the study’s timeframe.
4.5.1. Scope Definition
This study focuses only on secondary public schools, which represent the vast majority of Brazilian secondary school enrollments. The dataset refers to over 40 million students in thousands of schools across the country. However, only a fraction of these students is in the last year of secondary education when students take the ENEM test. We used a set of filter criteria to define the scope of this study and these further reduced the number of students composing the sample in our analysis:
As the school “id” will be the primary key for ENEM and school census dataset fusion, all students who do not attend a school that has been assigned were removed;
Students were not included if they were not in the last secondary year of municipal or state public schools;
Students were not included if they did not follow a regular curriculum;
As a double-checker, students not in the most probable age range meeting criteria 1 and 2 (17–19 years old) were also discarded;
In order to obtain a critical mass, only schools with ten or more students were selected;
To ensure that all schools had at least a minimum infrastructure to function, schools with no electric energy, sanitation, or piped water were discarded.
The same criteria were applied for each year of the dataset.
Table 1 presents the number of students and schools before and after defining the scope. As the teacher table is present only in the school census, which includes every teacher from every school in Brazil (including non-secondary), only the final number of teachers related to school at the ENEM level is presented. All variables were transformed to the school level, which is the level of the analysis (decision grain).
Since some schools are not present during the whole period due to the lack of ENEM attendees in a specific year or not following the filter rules established in the scope definition to a specific year, the number of schools changed over time as described in
Table 2.
4.5.2. Data Preprocessing
The data have gone through several changes over time. As an illustration, there were 293 variables in the ENEM questionnaire in 2009, while in the following year, 2010, only 57. Added to this difference in the number of variables collected, and there were also changes related to the variables representation, such as: (1) features were binary for some years and quantity for others; (2) categories were represented by numbers in some years and by strings in others; and (3) categorical features with i options were transformed into i binary features for different years.
It is important to standardize the data to overcome these issues and to allow us to compare the findings over the years. First, we select only variables present in all waves. Next, the data were standardized regarding content and meaning. A variable with less information was used as a reference for mapping the others. For instance, if a variable was binary in one year and multiple categorical in the others, the binary version was adopted for all years. The income features were normalized using a contemporary minimum wage. The variable related to the use of technological devices were individually treated. For example, before 2019, the available information on technology devices at school was measured by just one variable (student’s computer), whereas in 2019, the questions also asked about notebooks and tablets, which were unified. The missing values were analyzed separately since there were not many and were used as the most probable value. Alternatively, the mean was used for those that did not have a clear explanation. To reduce the influence of outliers, all numerical features were normalized for each year separately, using the α-winsorized values of the distribution (α/2 = 0.025 at each tail) as their minimum and maximum.
As a strategy to enhance the discriminant power of data, some variables frequently brought to the fore in discussions on the quality of secondary education (39), which were not initially present in the databases, were created. These were: (a) appropriate training of faculty members (measured by the ratio of teachers with the right background for the subject they teach); (b) the number of jobs held by the teacher (the average number of schools in which teachers work); (c) faculty pedagogical training (the proportion of faculty with pedagogical training); (d) faculty *DOMAIN* (the proportion of teachers in the school teaching in each *DOMAIN* covered on the ENEM); and (e) faculty workload (the ratio of teachers to the number of subjects covered in the school). In the end, as mentioned above, 40 input variables compose the final dataset.
The final dataset was presented at the school level, and variables from students and teachers were aggregated. Overall, the central tendency for each school, such as median and mode, was adopted. For categorical variables with an ordinal relation, such as faculty and parent’s education, domain knowledge was incorporated by using the number of years of schooling as a weight in the average calculation. Higher weight was given to advanced degrees such as a Ph.D. and lower to lower degrees such as a B.Sc. The variables were normalized to obtain a normal distribution and fall within a range of 0 and 1.
The chosen variable to indicate the outcomes was the arithmetic mean of the students within schools in all areas of knowledge covered in the tests. The median was adopted as a threshold for labeling schools as high and low achievement, balancing the distribution of classes across the administrative units and increasing the range of potential analysis. The final dataset variables, along with the descriptive statistics, can be found in
Appendix A. Additionally, the code of all experiments is available at:
http://www.github.com/rogerioluizsi/tw-fixed_effects_enem, accessed on 1 January 2023.
5. Results
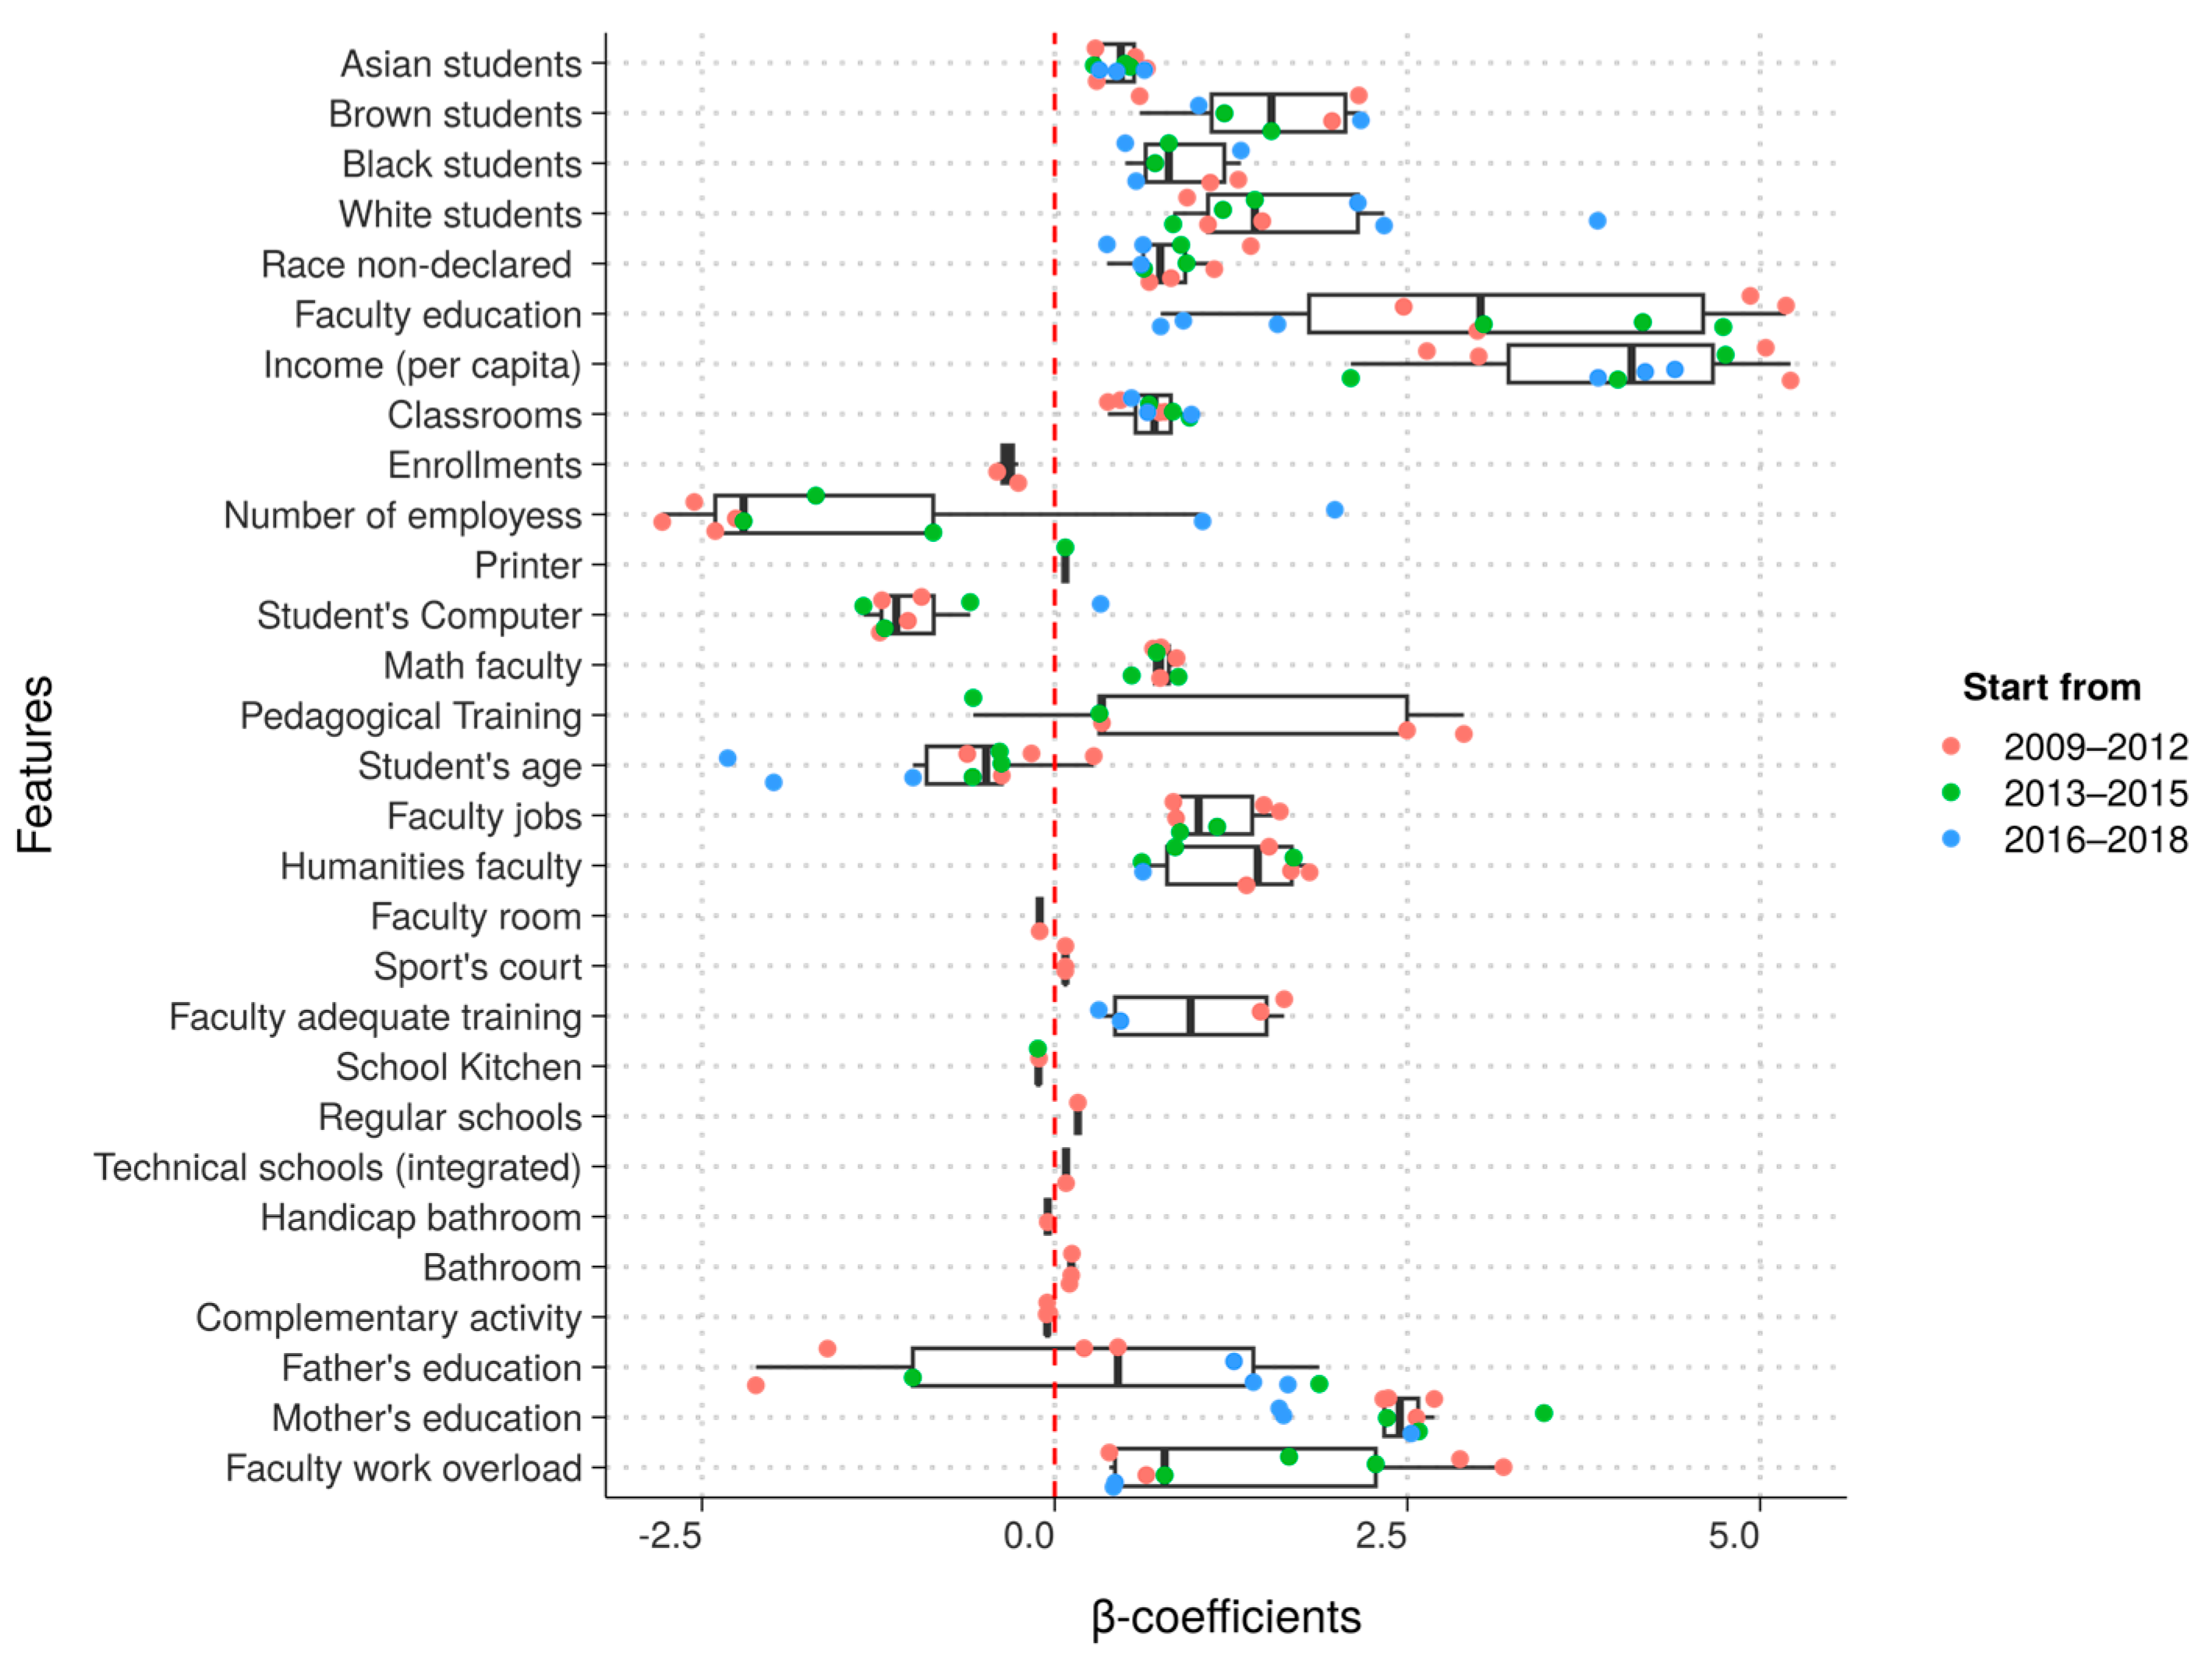
As shown in
Figure 3, the coefficients of each significant variable at a level of 0.05 are presented for all years. To better visualize the difference of the coefficients over time, they were separated into three different ranges: from 2009 to 2012, 2013 to 2015, and 2016 to 2018. Variables with lower variance in the period must have coefficients close to zero, regardless of whether they are school success determinants. One interesting aspect of the model is the substantial impact of demographic variables, such as those related to race, on performance. These variables are well-known as related to performance in Brazil, but it was expected that their coefficient would be close to zero, as their values tend to remain stable over time. However, they were highlighted as significant in various periods. This suggests that Brazilian students may be changing how they self-declare their race, which is consistent with findings from a recent longitudinal study by INEP at the student level [
73].
Some variables, such as faculty education and father’s education, have coefficients with different signals across different time periods. This calls for caution in the analysis, as models with a small time window tend to be low in information due to the expected lack of variance in the contextual variables.
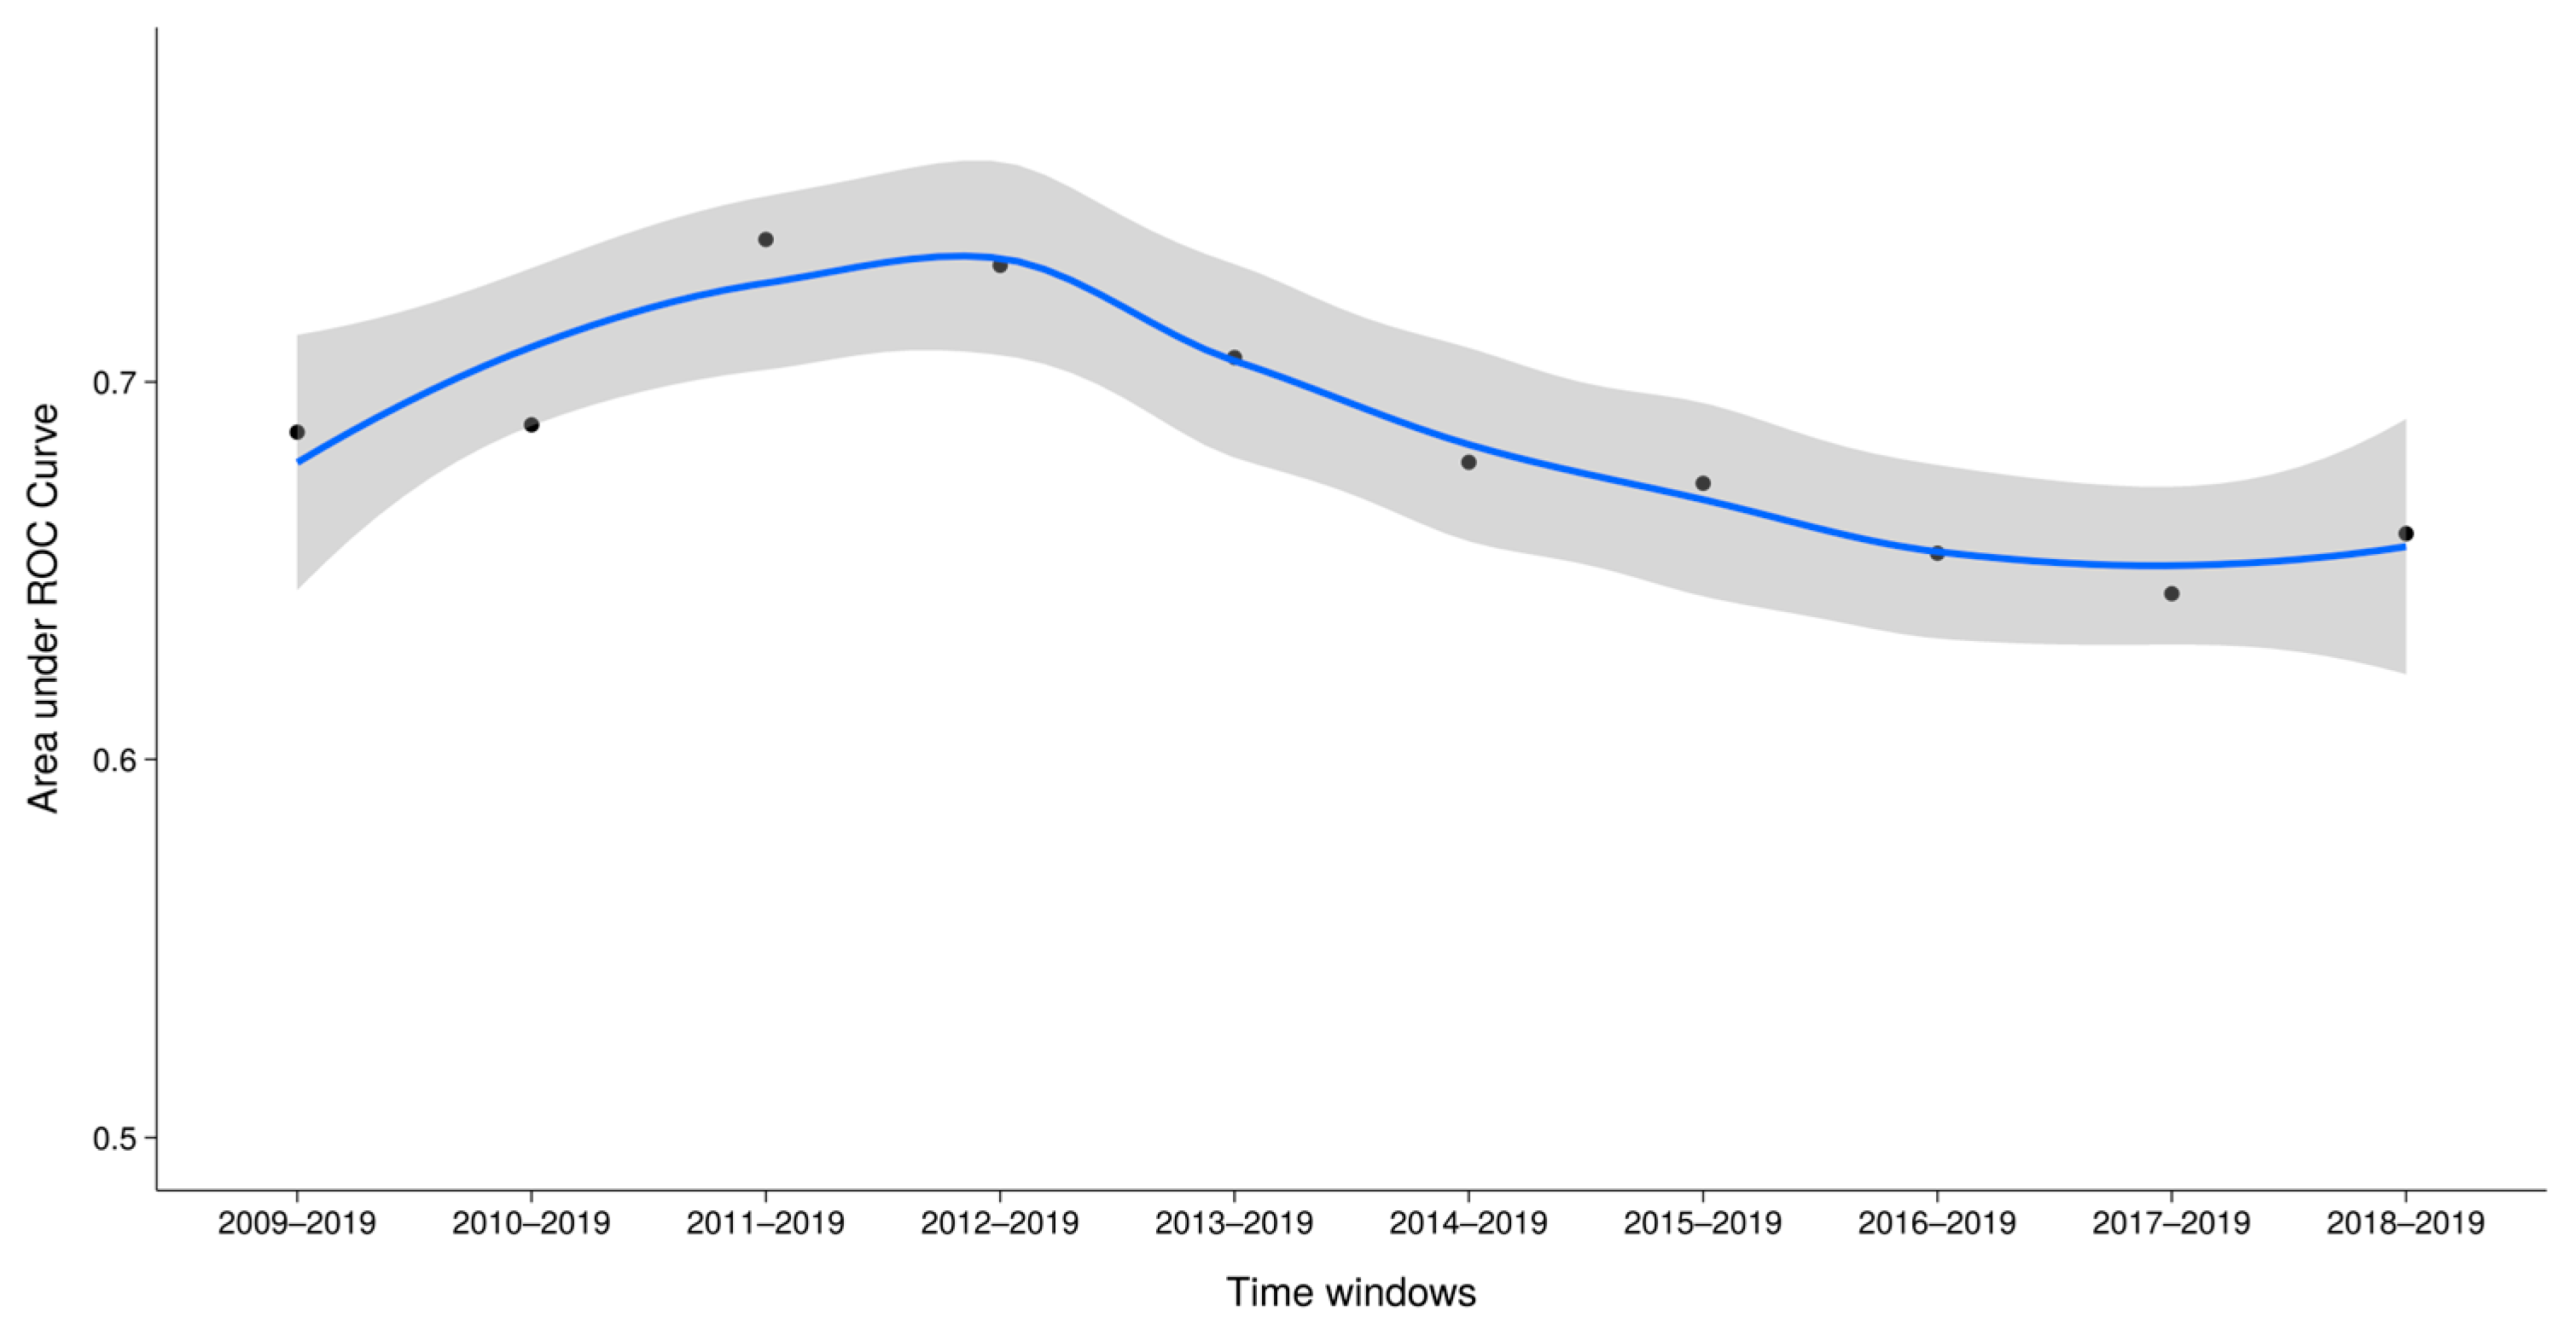
Figure 4 demonstrates the performance of the models by plotting their AUC_ROC values alongside their respective confidence intervals. The results indicate a significant decrease in AUC_ROC as the time window narrows. The best models are those starting in 2011, 2012, and 2013, respectively.
Table 3 displays the coefficients of the top variables in the best model (2011–2019). To evaluate consistency, the number of times each variable was significant in the top seven with higher effects, regardless of the direction, is depicted, as well as their averages within parentheses.
Income per capita, faculty education, faculty work overload, and mother´s education were the four most important positive variables during the period of 2011–2019. The relationship between students’ socioeconomic status and educational outcomes is well-established in the literature [
74,
75,
76], including previous research using this same dataset with a slightly different methodology [
3]. Nevertheless, our methodology can provide new insights into the relationship between socioeconomic status and educational outcomes. Our model suggests variations in this effect concerning the top quartile, which opens the path for further research to explore whether these variations lead to a narrowing or widening of socioeconomic inequalities.
Regarding parents’ education, as expected, the mother’s education is directly linked to good performance, while father’s education has a negative coefficient. This negative effect on the period of 2011–2019 is not consistent with other periods in which father’s education was significant into the top seven, since having a positive average. This can also be observed in
Figure 3, in which father’s education has positive effects for some periods. Therefore, this adverse effects interpretation requires caution, as there is no theoretical evidence to support it.
Interestingly, we found that faculty education and faculty work overload, which had little relevance in our previous investigation of this same dataset [
77] without causal reasoning, received higher coefficients. Faculty education is a school index that accounts for the average teacher education level, with weights based on years of schooling. Faculty work overload is the ratio of teachers to subjects offered in the school and aims to measure the volume of work. In Brazilian public secondary education, there is a low rate of teachers with additional years of education beyond graduation, particularly those with advanced degrees (in 2019, only 4.8% of teachers had an M.S., and 1.1% had a Ph.D). Additionally, teachers often have heavy schedules. The analysis suggests that efforts to boost these indices are positively related to gains in ENEM scores. These results are promising as evidence of the relevance of teacher policies in achieving improved outcomes in the context of Brazilian secondary education.
The number of employees is a direct indicator of school size and is related to negative results. Additionally, the provision of more computers to students, which has a controversial effect in the educational literature [
2,
31,
78], was highlighted as a negative policy in all periods. As a result, policies aimed at increasing the number of computers or other technological devices (such as tablets, which were considered as computers in 2019 in the data harmonization) in schools, should be carefully evaluated to identify the specific uses and contexts in which they lead to positive effects.
Going Back and Looking at the Data
A set of classification rules were created through online analytical processing (OLAP) queries to validate the knowledge extracted by the logistic regression coefficients. The rules were created over the top seven variables highlighted in the models and the outcomes. The rules are one conditional where the variables are the ascendent and the outcomes the consequence. The data used are two new versions of the original preprocessed dataset in which each variable, including the scores, was replaced by its trend value representing variable and outcome gains. Two different measures of trends were considered: (1) the slope, representing the linear tendency of variables from 2009 to 2019 and (2) the average difference from 2009. The goal is to confirm the influence and statistical significance of the ascendant variables in classify scores over time. For a meaningful interpretation, the variables were normalized between zero and one.
Table 4 presents the best rules with the associated quality metrics. Expressed in percentages, the support (S) indicates the size of the data slice covered by the rule condition, and the confidence (C) indicates the concentration of schools within this slice that follows the second condition. Finally, the relevance of the feature is assessed by the departure of the lift (L) from the sample average [
79]. Lifts close to one indicate low relevance of the antecedent variable regarding the consequent and lifts close to zero represent high negative effects.
Overall, the variables highlighted as positive in
Table 3 are strongly related to ENEM scores with lift higher than one. Additionally, corroborating with the logistic models, the variables with negative effects, student’s computer and number of employees, have lifts lower than one. The variable student’s computer has a lift close to zero, indicating a very low concentration of schools with average changes greater than 0.66 in the top quartile of score trends, confirming their negative effects on student outcomes. Father’s education had a controversial result in the logistic models, with positive and negative effects in different periods, and it has a lift above one, indicating that a variable has a positive effect in the trend dataset when assessed by the classification rule.
The potential of faculty education as a factor in classifying schools with higher gains in ENEM scores is significant, yet there is a scarcity of quantitative research in this area within the Brazilian secondary education system. This highlights the need for further investigation to better understand the relationship between faculty education and improved ENEM scores, and how this knowledge can inform policies and practices to support schools in achieving higher gains in this area.
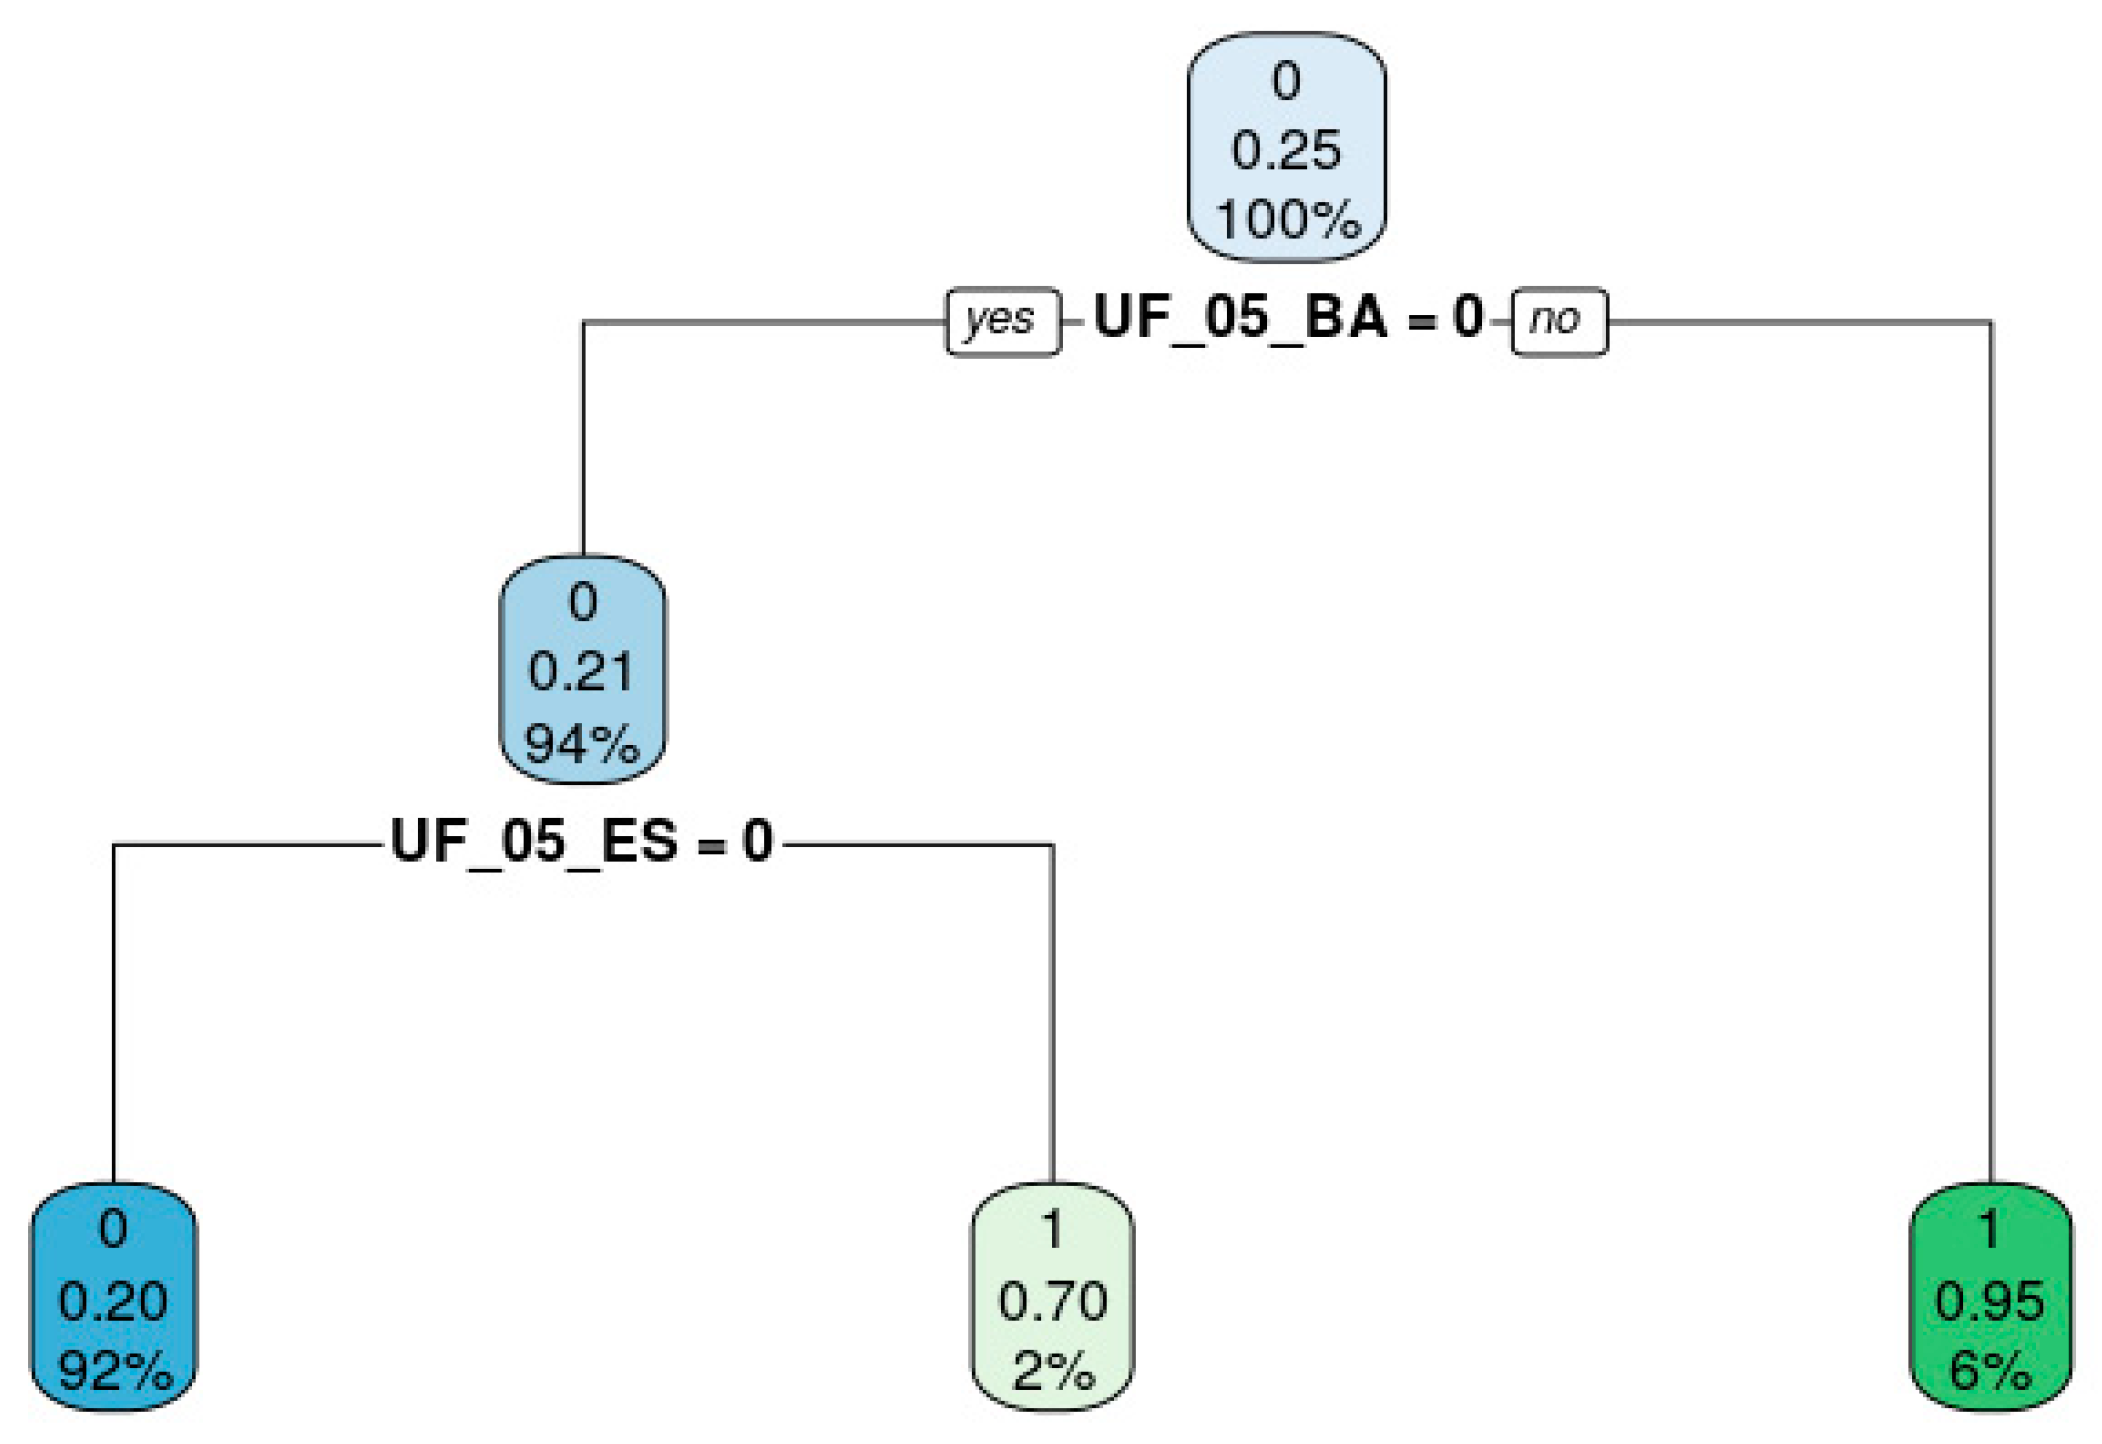
Figure 5 uses decision tree gains to classify schools in those with higher gains (third quartile) and lower gains (remains quartile) in order to describe schools which achieve higher gains in the variable faculty education. The trend version of the dataset which has the average change over time was used.
The decision paths, represented by the tree’s branches, express the knowledge embedded in the data in a humanly understandable format through “if-then” rules [
80]. The leaves of the tree, located at the bottom, represent the outcomes of the decision paths (higher and lower gains), while the most important attributes are found at the top of the tree. The first number in each node represents the majority class present in the rule defined in the node, while the second represents the fraction of positive class (confidence) and the third the coverage of the rule (support). Only the dummy variables representing Brazilian states (UF_05_<
STATE>) were used in the tree, suggesting the protagonism of state-specific practices and policies in improving faculty education polices in secondary education. The state of Bahia (BA) concentrates 6% of schools with higher gains, followed by Espírito Santo (ES), which was chosen by the algorithm. Further in-depth investigation of these state policies must derive some clues as to the improvement of education from a national perspective.
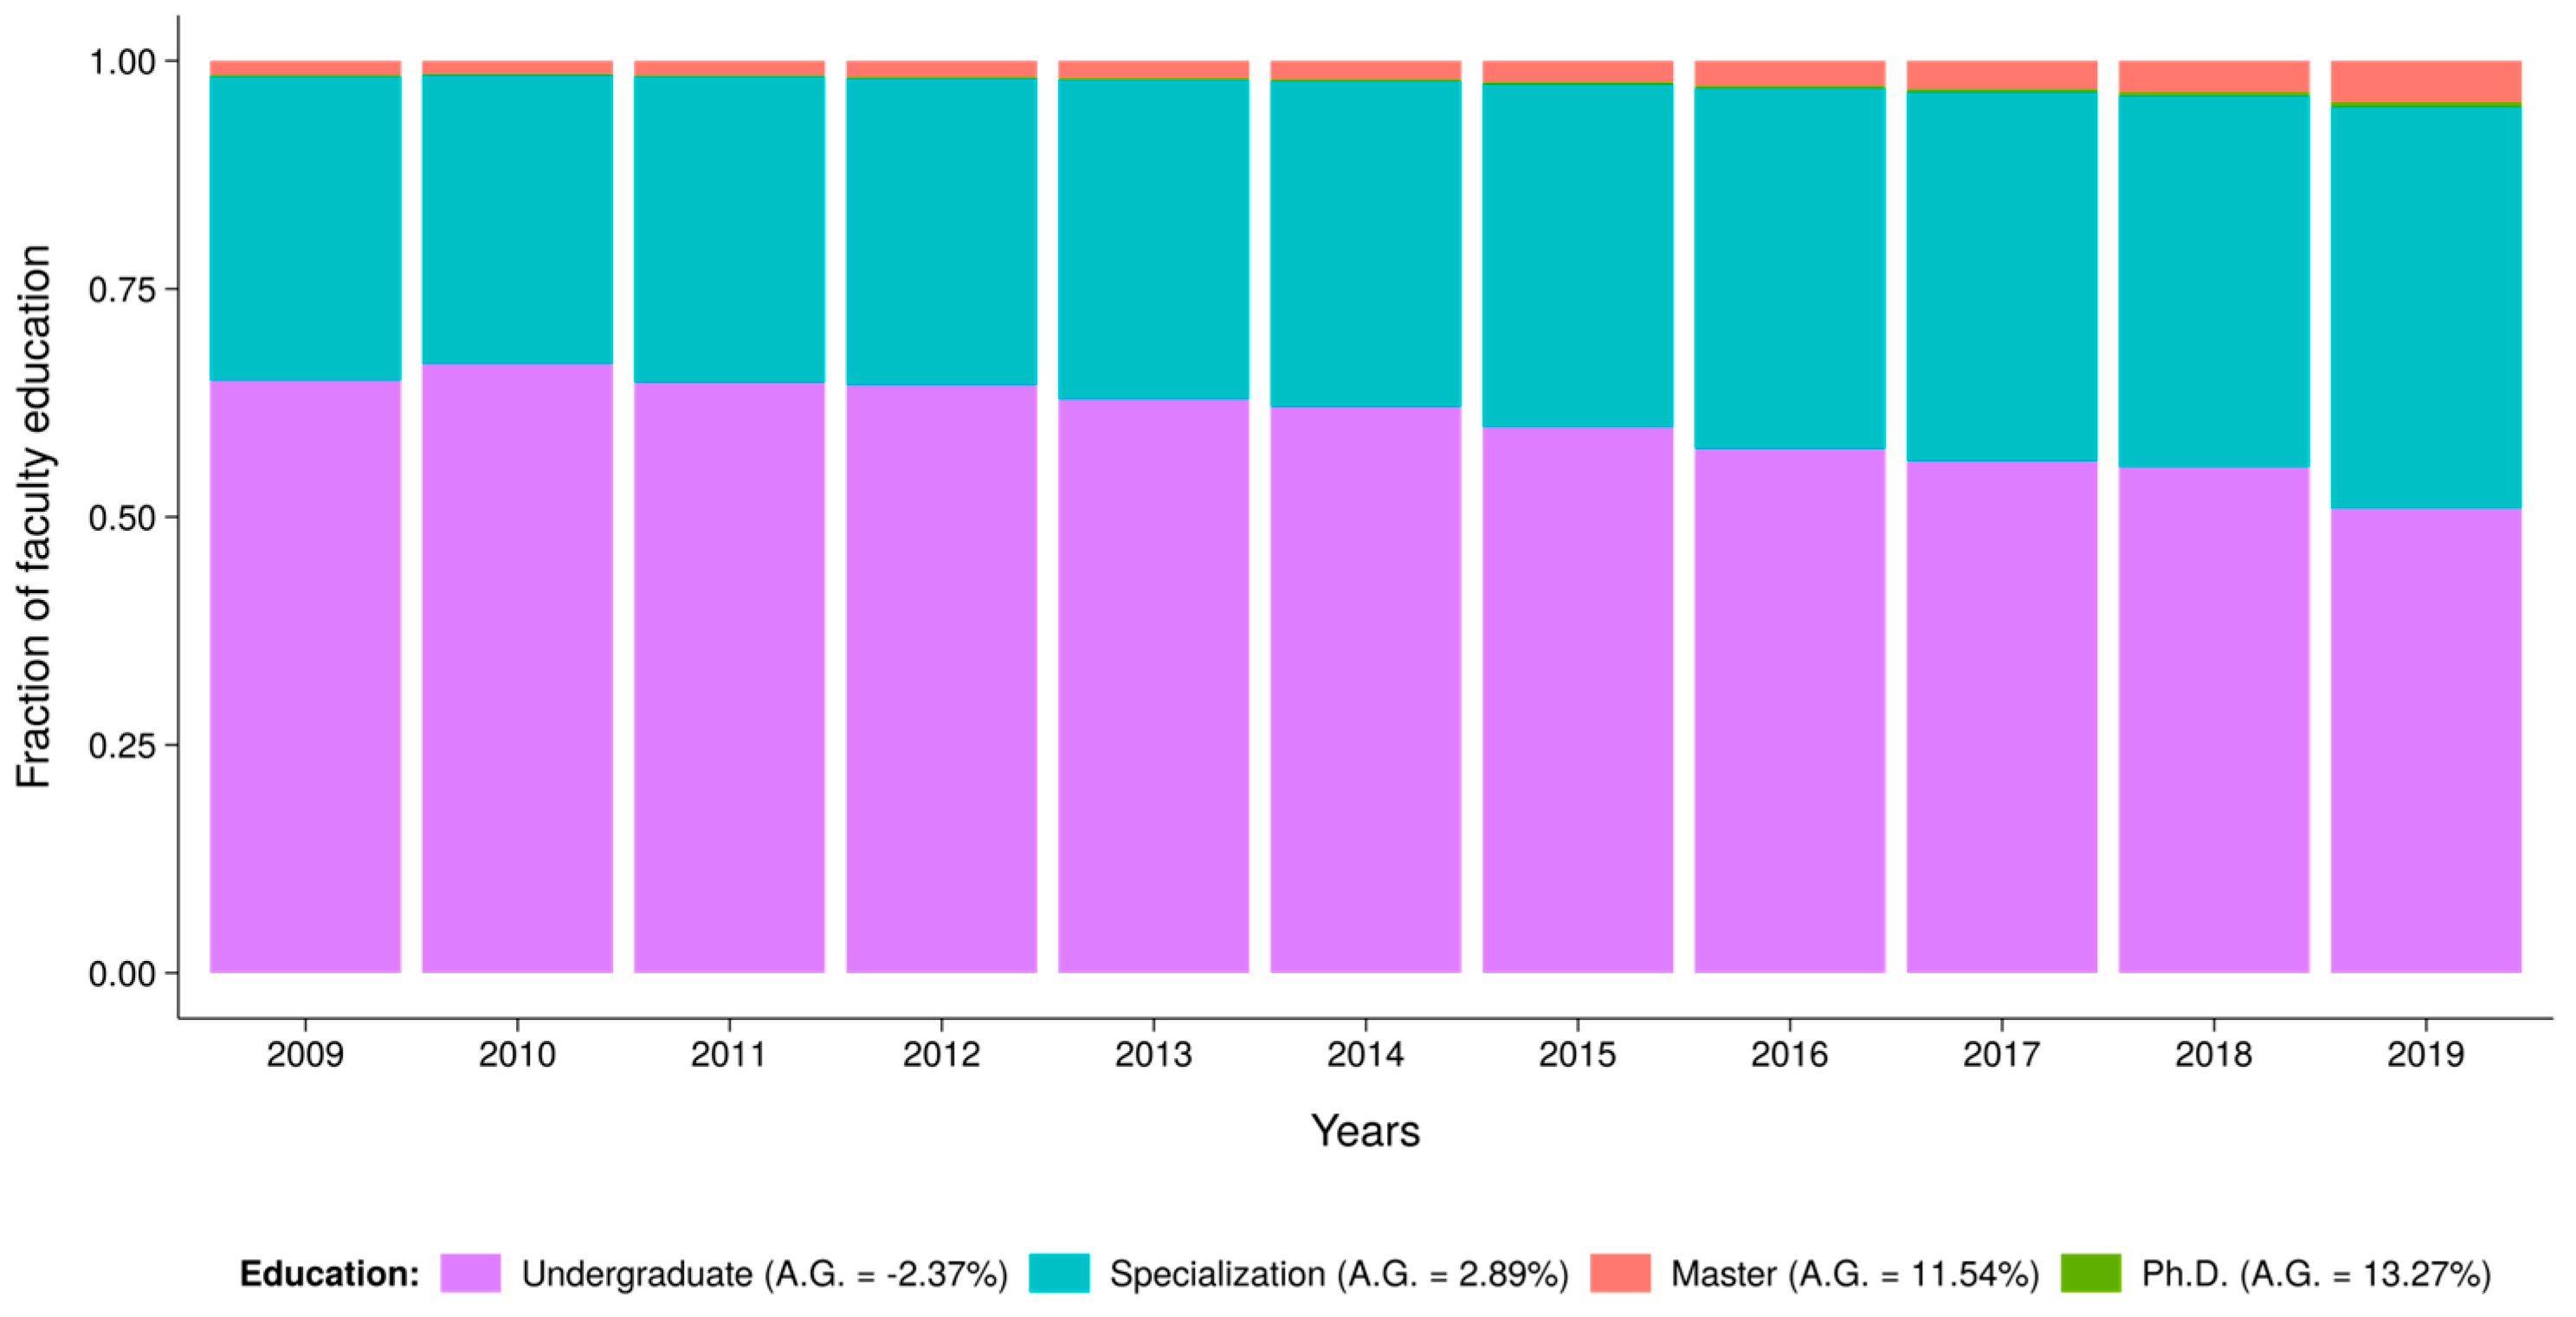
Finally, since faculty education is an index derived from the different level of teachers in school,
Figure 6 analyzes the raw dataset to identify the levels of education that have increased in schools with higher average gains (third quartile) in the faculty education index. The proportion of teachers with specializations, master’s degrees, and Ph.D.s has been increasing over time. Although the number of teachers with advanced degrees exhibits higher growth rates, they remain a small fraction of the total number of teachers, making it difficult to attribute the good results solely to them. For instance, in 2009, only 0.002% of Brazilian teachers held Ph.D.s (795 individuals), while in 2019, the number increased to 0.005% (2976 individuals), resulting in a 274% increase in the number of teachers with Ph.D.s and a 150% increase in the proportion.
Figure 6 illustrates the increasing proportion of teachers by degree over time, and the legend displays the average growth rate of the proportion for the entire period. The average growth (A.G.) is the average of growth rate computed for each year.
6. Discussion
Whereas computer scientists in EDM are typically experienced with predictions to derive knowledge from data, they lack experience when it comes to theory-driven approaches to resolve social science problems. In contrast, social scientists typically do not work on predictions but are knowledgeable regarding statistical tools to uncover causal mechanisms and derive models from theory [
81]. Combining EDM and traditional statistical approaches can put forward research on LSA data, as the former is a well-equipped tool for finding generalizable patterns, while the latter is helpful for embedding domain knowledge to make causal analyses [
2]. How the analyst can take advantage of both disciplines depends on the study aims and the dataset characteristics.
In this study, we combine two-way fixed-effects and EDM tools to explore longitudinal LSA data. The methodology consisted of three steps. First, using domain expert knowledge about the data and the relevant literature, potential causal relationships in the Brazilian education system were structured by DAGs, supporting the identification of the primary sources of bias. Next, a two-way logistic regression fixed effects was used to control for the unobserved effects of schools and states. The AUC_ROC evaluated the models, and the predictive contribution of variables in the best models was assumed to be a less-biased estimation of the influence of variables in outcomes gains at the school level. Finally, additional data mining techniques described the data using posterior information to add knowledge about the relevance of the main variables highlighted in the first models.
The initial models consist of a series of models applied to different time windows of the dataset, with the end period held constant at the last year for all windows and the start year ranging from the first year to the previous years before the last. This approach provides a more in-depth understanding of changes in certain variables and their relationship with gains in the ENEM. Some variables, such as students’ access to computers, faculty education, and adequate pedagogical training, show greater relevance to the models when covering larger time periods than the small ones. It is likely due to the gradual persistence of interventions in these variables over time. Other variables, including father’s education, students’ race, and income, exhibited more mixed effects across the periods. These mixed results pose challenges for interpreting these variables, as they could be due to the dynamic complexities of the variables or noise in the data collection. This dual interpretation reinforces the need to match the results with the existing literature and conduct further investigations using other techniques, as was reported in this paper.
The following analysis employed rules and decision trees to investigate two versions of temporal data, wherein all variables were replaced by a single value representing their trends. The rules aimed to identify relevant patterns that matched previous findings in logistic regression models. In contrast, the trees focus on exploring what was related to the interventions as detected in prior models. This exercise yields valuable insights for informing policies and practices related to these interventions. Although rules and trees are commonly used in the machine learning literature for predictive tasks, this paper only used them descriptively without concern for data reuse or predictive evaluation. Moreover, the trend versions of the dataset rely on assumptions that may not hold in reality. The transformations assume independence and linearity across variables, which may also not hold in reality.
The knowledge extraction also raises an additional contribution of this paper, due to the scarcity of temporal and multivariate analysis in Brazilian secondary education. Overall, the results align with previous research from the educational field and could highlight the importance of well-known variables such as those related to socioeconomics. An exception is the negative effect of father’s education when analyzing the models from the 2011–2019 period. However, the father’s education had a positive impact when averaging all periods. Additionally, the classification rules did not confirm the negative effect when using a new version of the dataset, where variables were replaced by their trends. Our methodology also brings new insights to the forum of educational policies such as the relevance of policies related to faculty, students’ computers, and the changes in how Brazilian students have self-declared their races. Regarding the faculty, policies to boost the level of education and reduce workload were highlighted as the most effective interventions observed in the data.
To derive these results, a sequence of assumptions was required to control for the primary sources of unobservable confounding, raising limitations and threats to the internal and external validity of this study. Assumptions are unavoidable when exploring observable data, and future works using other design models can verify specifically the effects of the main variables highlighted in the results. Another limitation is the required longitudinal data at the school level, which limits the use of the presented tools in other LSA data, such as from PISA (
https://www.oecd.org/pisa/, accessed on 12 January 2023 ), which uses random samples of schools. An adaptive alternative is pseudo-longitudinal data [
68], where estimates can be carried out by tracking groups of interest over time, instead of observations. Finally, causal time-series models can reveal relationships in the temporal data that our models may have missed due to assumptions made during the analysis process.
7. Conclusions
This study represents a novel approach by integrating methodologies from different disciplines to examine educational data through a causal framework. This causal perspective allows for the identification and mitigation of potential sources of bias, resulting in more accurate and reliable findings. We demonstrate that this combination of tools can be a valuable way to leverage insights using data released from large-scale assessments. Specifically, our analysis uses practical contexts using Brazilian secondary education data to inform decision making and support the design of effective educational policies. The study’s results emphasize the significance of socio-economic factors and demonstrate the substantial influence of faculty education policies, particularly the shift towards specialized and master’s degree programs. Additionally, they highlight the critical role played by Brazilian states in implementing these policies.
Author Contributions
R.L.C.S.F.: conceptualization, methodology, software, investigation, data curation, writing—original draft, writing—review and editing, visualization. K.B.: conceptualization, methodology, writing—review and editing, supervision. P.J.L.A.: conceptualization, methodology, writing—review and editing, supervision. All authors have read and agreed to the published version of the manuscript.
Funding
The authors would like to thank the Instituto Federal do Norte de Minas Gerais for the financial support through the PBQS (Grant: 23414.003681/2022-15).
Data Availability Statement
Acknowledgments
We appreciate the support and constructive feedback from Stanford’s Lemann Center team, particularly Martin Carnoy, for his invaluable guidance and insightful conversations. A part of this study was conducted during Silva Filho’s visiting period at Stanford University’s Graduate School of Education.
Conflicts of Interest
The authors declare no conflict of interest.
Appendix A
| ID | Variable | Mean | S.D. | Min | Max | Source | Type |
| 1 | Computer lab | 0.89 | 0.31 | 0.00 | 1.00 | School | Binary |
| 2 | Science lab | 0.55 | 0.50 | 0.00 | 1.00 | School | Binary |
| 3 | Special attendance room | 0.22 | 0.41 | 0.00 | 1.00 | School | Binary |
| 4 | School library | 0.74 | 0.44 | 0.00 | 1.00 | School | Binary |
| 5 | Reading room | 0.37 | 0.48 | 0.00 | 1.00 | School | Binary |
| 6 | W.C. | 0.97 | 0.17 | 0.00 | 1.00 | School | Binary |
| 7 | Disabled W.C. | 0.54 | 0.50 | 0.00 | 1.00 | School | Binary |
| 8 | Classrooms | 14.96 | 8.18 | 4.00 | 42.00 | School | Numeric |
| 9 | Television | 0.96 | 0.20 | 0.00 | 1.00 | School | Binary |
| 10 | DVD player | 0.88 | 0.32 | 0.00 | 1.00 | School | Binary |
| 11 | Copy machine | 0.71 | 0.45 | 0.00 | 1.00 | School | Binary |
| 12 | Printer | 0.93 | 0.26 | 0.00 | 1.00 | School | Binary |
| 13 | Student’s computer | 21.48 | 19.86 | 0.00 | 102.00 | School | Numeric |
| 14 | Fast internet | 0.87 | 0.33 | 0.00 | 1.00 | School | Binary |
| 15 | Number of employees | 65.09 | 36.20 | 12.00 | 175.00 | School | Numeric |
| 16 | School lunch | 0.74 | 0.44 | 0.00 | 1.00 | School | Binary |
| 17 | Faculty room | 0.97 | 0.18 | 0.00 | 1.00 | School | Binary |
| 18 | School kitchen | 0.91 | 0.28 | 0.00 | 1.00 | School | Binary |
| 19 | Satellite dish | 0.48 | 0.50 | 0.00 | 1.00 | School | Binary |
| 20 | Sports court | 0.89 | 0.32 | 0.00 | 1.00 | School | Binary |
| 21 | Complementary activity | 0.25 | 0.43 | 0.00 | 1.00 | School | Binary |
| 22 | Father’s education | 2.00 | 0.79 | 0.65 | 3.77 | Student | Numeric |
| 23 | Mother’s education | 2.41 | 0.73 | 1.11 | 3.97 | Student | Numeric |
| 24 | Faculty education | 0.14 | 0.08 | 0.02 | 0.34 | Teacher | Numeric |
| 25 | Income (USD per capita) * | 418.63 | 282.42 | 88.75 | 1190.17 | Student | Numeric |
| 26 | White students (fraction) | 0.47 | 0.26 | 0.05 | 0.95 | Student ** | Numeric |
| 27 | Black students (fraction) | 0.09 | 0.08 | 0.00 | 0.33 | Student ** | Numeric |
| 28 | Brown students (fraction) | 0.38 | 0.22 | 0.00 | 0.82 | Student ** | Numeric |
| 29 | Asian students (fraction) | 0.02 | 0.03 | 0.00 | 0.11 | Student ** | Numeric |
| 30 | Indigenous students (fraction) | 0.00 | 0.01 | 0.00 | 0.05 | Student ** | Numeric |
| 31 | Student´s gender | 0.54 | 0.01 | 0.2 | 0 | Student ** | Numeric |
| 32 | Enrollments | 29.88 | 8.09 | 14.00 | 48.00 | School | Numeric |
| 33 | Natural Science faculty (fraction) | 0.16 | 0.08 | 0.03 | 0.33 | Teacher | Numeric |
| 34 | Humanities faculty (fraction) | 0.27 | 0.05 | 0.17 | 0.38 | Teacher | Numeric |
| 35 | Languages faculty (fraction) | 0.39 | 0.06 | 0.26 | 0.50 | Teacher | Numeric |
| 36 | Math faculty (fraction) | 0.18 | 0.05 | 0.07 | 0.28 | Teacher | Numeric |
| 37 | Faculty jobs | 1.38 | 0.32 | 1.00 | 2.36 | Teacher | Numeric |
| 38 | Pedagogical training | 0.90 | 0.11 | 0.57 | 1.00 | Teacher | Numeric |
| 39 | Faculty adequate training | 0.68 | 0.10 | 0.47 | 0.86 | Teacher | Numeric |
| 40 | Student’s age | 17.55 | 0.30 | 17.08 | 18.33 | Student | Numeric |
| 41 | Faculty work overload | 0.85 | 0.17 | 0.47 | 1.00 | Teacher | Numeric |
| * Converted from Brazilian Real to United States Dollar using the average rate in the period (2.67). ** Students features grouped in the non-actionable features. |
References
- Hernández-Torrano, D.; Courtney, M.G.R. Modern International Large-Scale Assessment in Education: An Integrative Review and Mapping of the Literature. Large-Scale Assess. Educ. 2021, 9, 17. [Google Scholar] [CrossRef]
- Lezhnina, O.; Kismihók, G. Combining Statistical and Machine Learning Methods to Explore German Students’ Attitudes towards ICT in PISA. Int. J. Res. Method Educ. 2022, 45, 180–199. [Google Scholar] [CrossRef]
- Maia, J.D.S.Z.; Bueno, A.P.A.; Sato, J.R. Assessing the Educational Performance of Different Brazilian School Cycles Using Data Science Methods. PLoS ONE 2021, 16, e0248525. [Google Scholar] [CrossRef] [PubMed]
- Martínez-Abad, F. Identification of Factors Associated With School Effectiveness With Data Mining Techniques: Testing a New Approach. Front. Psychol. 2019, 10, 2583. [Google Scholar] [CrossRef]
- Saarela, M.; Yener, B.; Zaki, M.J.; Kärkkäinen, T. Predicting Math Performance from Raw Large-Scale Educational Assessments Data: A Machine Learning Approach. In Proceedings of the JMLR Workshop and Conference Proceedings, New York, NY, USA, 19–24 June 2016; Volume 48, pp. 1–8. [Google Scholar]
- Romero, C.; Ventura, S. Data Mining in Education. Wiley Interdiscip. Rev. Data Min. Knowl. Discov. 2013, 3, 12–27. [Google Scholar] [CrossRef]
- Bowles, S. Towards an Educational Production Function. In Education, Income, and Human Capital; NBER: Cambridge, MA, USA, 1970; pp. 11–70. ISBN 0-87014-218-6. [Google Scholar]
- Chow, K.F.; Kennedy, K.J. Secondary Analysis of Large-Scale Assessment Data: An Alternative to Variable-Centred Analysis. Educ. Res. Eval. 2014, 20, 469–493. [Google Scholar] [CrossRef]
- Gomes, C.M.A.; Jelihovschi, E. Presenting the Regression Tree Method and Its Application in a Large-Scale Educational Dataset. Int. J. Res. Method Educ. 2020, 43, 201–221. [Google Scholar] [CrossRef]
- Gorostiaga, A.; Rojo-Álvarez, J.L. On the Use of Conventional and Statistical-Learning Techniques for the Analysis of PISA Results in Spain. Neurocomputing 2016, 171, 625–637. [Google Scholar] [CrossRef]
- Hu, J.; Dong, X.; Peng, Y. Discovery of the Key Contextual Factors Relevant to the Reading Performance of Elementary School Students from 61 Countries/Regions: Insight from a Machine Learning-Based Approach. Read. Writ. 2022, 35, 93–127. [Google Scholar] [CrossRef]
- Liu, X.; Whitford, M. Opportunities-to-Learn at Home: Profiles of Students With and Without Reaching Science Proficiency. J. Sci. Educ. Technol. 2011, 20, 375–387. [Google Scholar] [CrossRef]
- Pejic, A.; Molcer, P.S.; Gulaci, K. Math Proficiency Prediction in Computer-Based International Large-Scale Assessments Using a Multi-Class Machine Learning Model. In Proceedings of the SISY 2021—IEEE 19th International Symposium on Intelligent Systems and Informatics, Subotica, Serbia, 16–18 September 2021; pp. 49–54. [Google Scholar] [CrossRef]
- Yao, L.; Chu, Z.; Li, S.; Li, Y.; Gao, J.; Zhang, A. A Survey on Causal Inference. ACM Trans. Knowl. Discov. Data 2021, 15, 1–46. [Google Scholar] [CrossRef]
- Imbens, G.W. Potential Outcome and Directed Acyclic Graph Approaches to Causality: Relevance for Empirical Practice in Economics. J. Econ. Lit. 2020, 58, 1129–1179. [Google Scholar] [CrossRef]
- Athey, S. Machine Learning and Causal Inference for Policy Evaluation. In Proceedings of the 21th ACM SIGKDD International Conference on Knowledge Discovery and Data Mining, Association for Computing Machinery, Sydney, NSW, Australia, 10–13 August 2015; pp. 5–6. [Google Scholar] [CrossRef]
- Pearl, J. Comment: Graphical Models, Causality and Intervention. Stat. Sci. 1993, 8, 266–269. [Google Scholar] [CrossRef]
- Goodman-Bacon, A. Difference-in-Differences with Variation in Treatment Timing. J. Econom. 2021, 225, 254–277. [Google Scholar] [CrossRef]
- Travitzki, R.; Calero, J.; Boto, C. What Does the National High School Exam (ENEM) Tell Brazilian Society? CEPAL Rev. 2014, 2014, 157–174. [Google Scholar] [CrossRef]
- Noah, H.J.; Eckstein, M.A. Towards a Science of Comparative Education. Br. J. Educ. Stud. 1969, 17, 334. [Google Scholar]
- Athey, S.; Imbens, G.W. Machine Learning Methods That Economists Should Know About. Annu. Rev. Econ. 2019, 11, 685–725. [Google Scholar] [CrossRef]
- Breiman, L. Statistical Modeling: The Two Cultures. Stat. Sci. 2001, 16, 199–215. [Google Scholar] [CrossRef]
- Fischer, C.; Pardos, Z.A.; Baker, R.S.; Williams, J.J.; Smyth, P.; Yu, R.; Slater, S.; Baker, R.; Warschauer, M. Mining Big Data in Education: Affordances and Challenges. Rev. Res. Educ. 2020, 44, 130–160. [Google Scholar] [CrossRef]
- Martínez-Abad, F.; Gamazo, A.; Rodríguez-Conde, M.-J. Educational Data Mining: Identification of Factors Associated with School Effectiveness in PISA Assessment. Stud. Educ. Eval. 2020, 66, 100875. [Google Scholar] [CrossRef]
- Huang, G.; Reiser, M.; Parker, A.; Muniec, J.; Salvucci, S.; Ralph, J. Institute of Education Science Findings from Interviews with Education Policymakers 2003. Available online: https://files.eric.ed.gov/fulltext/ED480144.pdf (accessed on 1 January 2023).
- Dong, X.; Hu, J. An Exploration of Impact Factors Influencing Students’ Reading Literacy in Singapore with Machine Learning Approaches. Int. J. Engl. Linguist. 2019, 9, 52. [Google Scholar] [CrossRef]
- Masci, C.; Johnes, G.; Agasisti, T. Student and School Performance across Countries: A Machine Learning Approach. Eur. J. Oper. Res. 2018, 269, 1072–1085. [Google Scholar] [CrossRef]
- Rebai, S.; Ben Yahia, F.; Essid, H. A Graphically Based Machine Learning Approach to Predict Secondary Schools Performance in Tunisia. Socioecon. Plann. Sci. 2020, 70, 100724. [Google Scholar] [CrossRef]
- Schiltz, F.; Masci, C.; Agasisti, T.; Horn, D. Using Regression Tree Ensembles to Model Interaction Effects: A Graphical Approach. Appl. Econ. 2018, 50, 6341–6354. [Google Scholar] [CrossRef]
- Adeodato, P.J.L. Data Mining Solution for Assessing Brazilian Secondary School Quality Based on Enem and Census Data. In Proceedings of the 13th CONTECSI International Conference on Information Systems and Technology Management, online, 1 June 2016; pp. 1112–1124. [Google Scholar]
- Silva Filho, R.L.C.; Adeodato, P.J.L. Data Mining Solution for Assessing the Secondary School Students of Brazilian Federal Institutes. In Proceedings of the 2019 8th Brazilian Conference on Intelligent Systems (BRACIS), Salvador, Brazil, 15–18 October 2019; pp. 574–579. [Google Scholar]
- Kaplan, D.; Huang, M. Bayesian Probabilistic Forecasting with Large-Scale Educational Trend Data: A Case Study Using NAEP. Large-Scale Assess. Educ. 2021, 9, 1–31. [Google Scholar] [CrossRef]
- Strello, A.; Strietholt, R.; Steinmann, I.; Siepmann, C. Early Tracking and Different Types of Inequalities in Achievement: Difference-in-Differences Evidence from 20 Years of Large-Scale Assessments. Educ. Assess. Eval. Account. 2021, 33, 139–167. [Google Scholar] [CrossRef]
- Pokropek, A. Introduction to Instrumental Variables and Their Application to Large-Scale Assessment Data. Large-Scale Assess. Educ. 2016, 4, 1–20. [Google Scholar] [CrossRef]
- Wossmann, L. Educational Production in Europe. Econ. Policy 2005, 20, 446–504. [Google Scholar] [CrossRef]
- Ammermueller, A.; Pischke, J. Peer Effects in European Primary Schools: Evidence from the Progress in International Reading Literacy Study. J. Labor Econ. 2009, 27, 315–348. [Google Scholar] [CrossRef]
- Rubin, D. B Estimating Causal Effects of Treatment in Randomized and Nonrandomized Studies. J. Educ. Psychol. 1974, 66, 688–701. [Google Scholar] [CrossRef]
- Peters, J.; Janzing, D.; Schölkopf, B. Elements of Causal Inference; MIT Press: Cambridge, MA, USA; London, UK, 2017; ISBN 978-0-262-03731-0. [Google Scholar]
- Prosperi, M.; Guo, Y.; Sperrin, M.; Koopman, J.S.; Min, J.S.; He, X.; Rich, S.; Wang, M.; Buchan, I.E.; Bian, J. Causal Inference and Counterfactual Prediction in Machine Learning for Actionable Healthcare. Nat. Mach. Intell. 2020, 2, 369–375. [Google Scholar] [CrossRef]
- Schölkopf, B. Causality for Machine Learning. arXiv 2019, arXiv:1911.10500. [Google Scholar] [CrossRef]
- Pearl, J. Probabilistic Reasoning in Intelligent Systems: Networks of Plausible Inference; Morgan kaufmann: Burlington, MA, USA, 1988. [Google Scholar]
- Freedman, D. From Association to Causation via Regression. Adv. Appl. Math. 1997, 18, 59–110. [Google Scholar] [CrossRef]
- Lee, H. What Drives the Performance of Chinese Urban and Rural Secondary Schools: A Machine Learning Approach Using PISA 2018. Cities 2022, 123, 103609. [Google Scholar] [CrossRef]
- Ahuja, K.; Shanmugam, K.; Varshney, K.R.; Dhurandhar, A. Invariant Risk Minimization Games. arXiv 2020, arXiv:2002.04692. [Google Scholar]
- Peters, J.; Bühlmann, P.; Meinshausen, N. Causal Inference by Using Invariant Prediction: Identification and Confidence Intervals. J. R. Stat. Soc. Ser. B Stat. Methodol. 2016, 78, 947–1012. [Google Scholar] [CrossRef]
- Kamath, P.; Tangella, A.; Sutherland, D.J.; Srebro, N. Does Invariant Risk Minimization Capture Invariance? arXiv 2021, arXiv:2101.01134. [Google Scholar]
- Rosenfeld, E.; Ravikumar, P.; Risteski, A. The Risks of Invariant Risk Minimization. arXiv 2020, arXiv:2010.05761. [Google Scholar]
- Dranker, Y.; He, H.; Belinkov, Y. IRM when it works and when it doesn t: A test case of natural language inference. In Advances in Neural Information Processing Systems; Ranzato, M., Beygelzimer, A., Dauphin, Y., Liang, P.S., Vaughan, J.W., Eds.; Curran Associates, Inc.: Nice, France, 2021; Volume 34, pp. 18212–18224. [Google Scholar]
- Guo, R.; Cheng, L.; Li, J.; Hahn, P.R.; Liu, H. A Survey of Learning Causality with Data: Problems and Methods. ACM Comput. Surv. 2020, 53, 1–36. [Google Scholar] [CrossRef]
- Knaus, M.C. A Double Machine Learning Approach to Estimate the Effects of Musical Practice on Student’s Skills. J. R. Stat. Soc. Ser. A Stat. Soc. 2021, 184, 282–300. [Google Scholar] [CrossRef]
- Wager, S.; Athey, S. Estimation and Inference of Heterogeneous Treatment Effects Using Random Forests. J. Am. Stat. Assoc. 2018, 113, 1228–1242. [Google Scholar] [CrossRef]
- Breiman, L. Random Forests. Mach. Learn. 2001, 45, 5–32. [Google Scholar] [CrossRef]
- Li, J.; Ma, S.; Le, T.; Liu, L.; Liu, J. Causal Decision Trees. IEEE Trans. Knowl. Data Eng. 2017, 29, 257–271. [Google Scholar] [CrossRef]
- Suk, Y.; Kang, H.; Kim, J.S. Random Forests Approach for Causal Inference with Clustered Observational Data. Multivar. Behav. Res. 2020, 56, 829–852. [Google Scholar] [CrossRef]
- Chernozhukov, V.; Chetverikov, D.; Demirer, M.; Duflo, E.; Hansen, C.; Newey, W.; Robins, J. Double/Debiased Machine Learning for Treatment and Structural Parameters. Econom. J. 2018, 21, C1–C68. [Google Scholar] [CrossRef]
- Funk, M.J.; Westreich, D.; Wiesen, C.; Stürmer, T.; Brookhart, M.A.; Davidian, M. Doubly Robust Estimation of Causal Effects. Am. J. Epidemiol. 2011, 173, 761–767. [Google Scholar] [CrossRef] [PubMed]
- Wang, J.; Wiens, J.; Lundberg, S. Shapley Flow: A Graph-Based Approach to Interpreting Model Predictions. arXiv 2020, arXiv:2010.14592. [Google Scholar]
- Wright, S. Correlation and Causation. J. Agric. Res. 1921, 20, 557–585. [Google Scholar]
- Andrade, R.J.D.; Soares, J.F. O Efeito Da Escola Básica Brasileira. Estud. Em Aval. Educ. 2008, 19, 379. [Google Scholar] [CrossRef]
- Carnoy, M.; Marotta, L.; Louzano, P.; Khavenson, T.; Guimarães, F.R.F.; Carnauba, F. Intranational Comparative Education: What State Differences in Student Achievement Can Teach Us about Improving Education—The Case of Brazil. Comp. Educ. Rev. 2017, 61, 726–759. [Google Scholar] [CrossRef]
- Elmore, R.F. Building a New Structure for School Leadership; Albert Shanker Institute: Washington, DC, USA, 2000. [Google Scholar]
- Soares, J.F.; Alves, M.T.G. Efeitos de escolas e municipios na qualidade do ensino fundamental. Cad. Pesqui. 2013, 43, 492–517. [Google Scholar] [CrossRef]
- Korpershoek, H. Relationships among Motivation, Commitment, Cognitive Capacities, and Achievement in Secondary Education. Frontline Learn. Res. 2016, 4, 28–43. [Google Scholar] [CrossRef]
- Soares, J.F. O Efeito Da Escola No Desempenho Cognitivo de Seus Alunos. REICE-Rev. Electrónica Iberoam. Sobre Calid. Efic. Cambio En Educ. 2004, 2, 83–104. [Google Scholar]
- Arellano, M. Panel Data Econometrics; OUP: Oxford, UK, 2003; ISBN 0-19-152967-2. [Google Scholar]
- Wooldridge, J.M. Econometric Analysis of Cross Section and Panel Data; MIT Press: Cambridge, MA, USA, 2010; ISBN 0-262-29679-9. [Google Scholar]
- Hanushek, E.A.; Link, S.; Woessmann, L. Does School Autonomy Make Sense Everywhere ? Panel Estimates from PISA ☆. J. Dev. Econ. 2013, 104, 212–232. [Google Scholar] [CrossRef]
- Hooper, M. Applying the Pseudo-Panel Approach to International Large-Scale Assessments: A Methodology for Analyzing Subpopulation Trend Data. Ph.D. Thesis, Boston College, Chestnut Hill, MA, USA, 2017. Available online: https://www.iea.nl/sites/default/files/2019-05/Award_Choppin_pseduo-panel_approach_ilsa_Hooper.pdf (accessed on 1 January 2023).
- Arkhangelsky, D.; Imbens, G.W.; Lei, L.; Luo, X. Double-Robust Two-Way-Fixed-Effects Regression For Panel Data. arXiv 2021, arXiv:2107.13737. [Google Scholar]
- Imai, K.; Kim, I.S. On the Use of Two-Way Fixed Effects Regression Models for Causal Inference with Panel Data. Polit. Anal. 2021, 29, 405–415. [Google Scholar] [CrossRef]
- Fuchs, T.; Wößmann, L. What Accounts for International Differences in Student Performance? A Re-Examination Using PISA Data. Empir. Econ. 2007, 32, 433–464. [Google Scholar] [CrossRef]
- Silva Filho, R.L. EnemCensus2009-2019 2022. Harvard Dataverse, V1, UNF:6:lvdu04mKdagEgl70si/7bA== [fileUNF]. Available online: https://dataverse.harvard.edu/dataset.xhtml?persistentId=doi:10.7910/DVN/WEWDHL (accessed on 1 January 2023). [CrossRef]
- Senkevics, A.S. De Brancos Para Negros? Uma Análise Longitudinal Da Reclassificação Racial No Enem 2010-2016. Dados 2022, 65, 1–40. [Google Scholar] [CrossRef]
- Caldas, S.J.; Bankston, C. Effect of School Population Socioeconomic Status on Individual Academic Achievement. J. Educ. Res. 1997, 90, 269–277. [Google Scholar] [CrossRef]
- Coleman, J.S. Equality of Educational Opportunity. Integr. Educ. 1968, 6, 19–28. [Google Scholar] [CrossRef]
- Coleman, J.S. Equality and Achievement in Education; Routledge: London, UK, 2019. [Google Scholar]
- Silva Filho, R.L.C.; Brito, K.; Adeodato, P.J.L. A Data Mining Framework for Reporting Trends in the Predictive Contribution of Factors Related to Educational Achievement. Expert Syst. Appl. 2023, 221, 119729. [Google Scholar] [CrossRef]
- Zhang, D.; Liu, L. How Does ICT Use Influence Students’ Achievements in Math and Science over Time? Evidence from PISA 2000 to 2012. Eurasia J. Math. Sci. Technol. Educ. 2016, 12, 2431–2449. [Google Scholar] [CrossRef]
- Han, J.; Kamber, M.; Pei, J. Data Mining: Concepts and Techniques; Morgan Kaufmann Publishers Inc.: San Francisco, CA, USA, 2011; ISBN 0-12-381479-0. [Google Scholar]
- Safavian, S.R.; Landgrebe, D. A Survey of Decision Tree Classifier Methodology. IEEE Trans. Syst. Man Cybern. 1991, 21, 660–674. [Google Scholar] [CrossRef]
- Cohausz, L. Towards Real Interpretability of Student Success Prediction Combining Methods of XAI and Social Science; International Educational Data Mining Society: Durham, UK, 2022; pp. 361–367. [Google Scholar]
| Disclaimer/Publisher’s Note: The statements, opinions and data contained in all publications are solely those of the individual author(s) and contributor(s) and not of MDPI and/or the editor(s). MDPI and/or the editor(s) disclaim responsibility for any injury to people or property resulting from any ideas, methods, instructions or products referred to in the content. |
© 2023 by the authors. Licensee MDPI, Basel, Switzerland. This article is an open access article distributed under the terms and conditions of the Creative Commons Attribution (CC BY) license (https://creativecommons.org/licenses/by/4.0/).


