1. Introduction
Urban transportation has changed significantly in recent years, given the fast development of innovative technologies. New app-based mobility services such as ride-hailing are becoming more and more popular because of the consumer behavior shift from ownership to accessibility [
1]. Ride-hailing has recently exploded in popularity, as indicated by the business success of transportation network companies (TNCs) such as Uber and Lyft [
2].
The popularity of these companies can be explained in part by the fact that they often provide cheap, comfortable, on-demand door-to-door transportation options in urban areas [
3]. In many cities, this service has thus become an essential part of the transportation system. In tandem with the global rise of this mobility alternative, several scholars have investigated the impact of ride-hailing services on individuals’ travel behavior and mode choice, pricing structure, etc. Nevertheless, the findings are still uncertain in several aspects, particularly regarding the pricing scheme.
Ride-hailing companies use real-time dynamic algorithms to adjust their fares at any moment, whereas taxi fares are usually fixed and regulated [
4]. Dynamic pricing, also known as surge pricing, is an automated system based on demand and supply principles. While it is unclear how these rates are adjusted at any given time, understanding the behavior of the ride-hailing fares will be valuable to (i) users, to anticipate fares in advance; (ii) drivers, to monitor and be prepared for fare rises and hence determine in advance potential opportunities to collect additional revenue; and (iii) policymakers, to apply regulatory measures to improve the overall transport system.
The main objective of this paper is to better understand, explain and predict the behavior of ride-hailing fares by combining statistical and supervised machine learning models for informing transport policymaking. To that end, data from Uber (one of the most popular TNCs in the world) were gathered in order to make predictions and explain its fares as a function of a range of explanatory variables. The Uber Application Programming Interface (API) was utilized to collect data on Uber ride supply in the city of Madrid over 10 months (from September 2018 to June 2019). This paper addresses the following research question: “Can existing open (big) data be combined with statistical and supervised machine learning techniques to help predict ride-hailing fares?”.
This paper also sets forth a conceptual and methodological framework for combining open (big) data of ride-hailing fares and additional information with predictive modeling for understanding the pricing mechanisms and incorporating them with the decision-making processes of agencies, stakeholders, and policymakers for the ride-hailing market.
In Spain, the ride-hailing market is limited, as is the number of ride-hailing licenses [
5]. The city of Madrid was chosen for this paper because it is one of the most populous cities in the European Union and has a variety of transport modes. There has also been a big conflict between ride-hailing companies and conventional taxi services over the last few years [
5,
6]. In addition, the authors were able to build a large dataset in that city, which is not easy to find in other locations. Rangel et al. (2021) [
5] used part of this dataset in a previous study in the city of Madrid considering only those origin-destination routes where fares experience notable variations over time (dynamic prices are effective). The authors explored ride-hailing fares using an econometric model—a Generalized Linear Model. The current paper goes further in the application of machine learning models (more robust models), applied in this city, and considers the complete dataset thus working with fixed and dynamic prices. The current dataset is 240% larger than the dataset used by Rangel et al. (2021) [
5].
This research contributes to understanding and predicting ride-hailing fares, by combining supervised and unsupervised techniques. Three statistical and supervised machine learning models were used for short-term prediction, using scikit-learn’s open-source machine learning library (such as Linear Regression, Decision Tree, and Random Forest). Each model predicts Uber fares using different algorithms that can be compared in terms of performance metrics. The unsupervised technique of cluster analysis (using the k-means clustering method) was also applied to verify the difficulties of predicting Uber fares according to the prediction errors of the models.
Besides this introductory section, the paper has six additional sections. The background and literature review are presented in
Section 2. The case study selection is described in
Section 3, which is followed by data collection and analysis in
Section 4. The methodology used to obtain the results of this research is detailed in
Section 5. The results and discussion are presented in the
Section 6, followed by conclusions and policy recommendations.
2. Background and Literature Review
Uber, Lyft, Cabify, and Didi are examples of ride-hailing services that use information and communication technologies (ICT). Ride-hailing companies typically use smartphone apps to provide their services, allowing the users to request a ride and receive information about the pick-up time, vehicle location, and the fare they will pay in advance.
The pricing strategy of ride-hailing companies is needed for their long-term success [
7]. Dynamic pricing is a strategy by which products or services prices are adjusted in response to real-time supply–demand imbalances using a dynamic algorithm [
8]. Up to about ten years ago, dynamic pricing was primarily limited to a few industries, such as airlines and hotels. Now dynamic pricing is used by companies in many other sectors, such as ride-hailing companies. The regular fare for a ride might, for example, increase during rainy conditions, trip delays (congestion), morning and evening peak hours, and leisure days [
5], which influence supply or demand.
The flexibility of dynamic pricing should increase the global welfare for society if the industry market is perfect, and thus externalities are internalized. However, the significance and distributions of welfare gains are unclear. Many critics suggest that dynamic pricing can decrease welfare gains for riders [
9] or drivers [
10].
The advent of ride-hailing services has significantly impacted the taxi market. Its real impact is difficult to measure due to the limited data. According to Chang (2017) [
11], Uber reduced regular taxi drivers’ income by 12% in Taiwan, and up to 18% after three years. Willis and Tranos (2021) [
12] conclude that traditional taxi trips in New York have decreased after the entry of Uber. Akimova et al. (2020) [
13] showed that ride-hailing services have had a significant negative impact on the profitability of taxi companies in Madrid and Barcelona. Besides, the taxi supply is limited by the municipalities in many countries such as Spain.
Ride-hailing and taxi services operate under different legal and regulatory frameworks in many countries [
5,
7]. The ride-hailing platforms retain a percentage of the total fare as commissions once the ride is completed and paid, and the rest is transferred to the driver. The Chinese Department of Transportation started to regulate in August 2021 the commissions charged by the ride-hailing platforms to standardize the business of those companies and reduce their excessive commissions. In addition, some cities in China, such as Beijing, Shanghai, and Hangzhou, have adopted regulatory measures to restrict the number of drivers registered in Didi [
5,
7].
In recent years, the competition between Uber, Cabify, and taxis has caused strong opposition from taxi drivers, who have organized protests and strikes in countries such as Spain [
5] and Chile [
7]. Currently, the Chilean government is discussing the definition of a basic framework to regulate the system in Congress [
7]. In New York, the government has taken regulatory measures to limit the number of Uber drivers in 2019 [
7]. In Spain, Denmark, Italy, and Sweden, Uber services have already been declared illegal at some point [
14].
Despite the increasing interest in ride-hailing topics, there are still some gaps in the literature that have motivated this research. Statistical models are the most common methodological tools used in ride-hailing studies. From the demand perspective, Faghih et al. (2019) [
15] used time series to predict ride-hailing demand. From the supply perspective, Rangel et al. (2021) [
5] used an econometric model to explore Uber fares in Madrid, based only on time-varying fare data. In recent years, there has been growing interest in applying machine learning methods in ride-hailing studies. For instance, Battifarano and Qian (2019) [
16] proposed a general real-time framework for predicting surge multipliers. Their approach was based on a log-linear model, and their model was able to predict Uber surge multipliers in Pittsburgh up to two hours in advance. Yan et al. (2020) [
17] applied Random Forest to model and predict the demand for ride-hailing services in Chicago. Chen et al. (2021) [
18] adopted deep learning networks for short-time prediction of demand for ride-hailing services. Silveira-Santos et al. (2022) [
19] analyzed Lyft fares in Atlanta and Boston before and during the COVID-19 pandemic, with a focus on applications of time series forecasting and machine learning models. However, the scientific literature on the prediction of ride-hailing fares is still limited. Short-term ride-hailing fares forecasting has room to be improved using machine learning models.
To sum up, this paper departs from previous studies and contributes to the prediction of ride-hailing fares in the following ways:
Total fares were predicted, not just the surge multiplier, as noted by Battifarano and Qian (2019) [
16]. This also made it possible to identify cases of low demand, in addition to cases of high demand.
Data from a European city were analyzed (most research had previously focused on American cities) and data were collected over an extended period, a total of ten months.
Statistical and machine learning models were applied and compared considering the complete dataset, thus working with fixed and dynamic prices, not only dynamic prices, as noted by Rangel et al. (2021) [
5].
A conceptual framework was described that can be adopted by interesting parties to better understand the pricing dynamics of the ride-hailing market.
Valuable information and policy recommendations for the ride-hailing market are provided.
3. Case Study Selection
The study was conducted in the city of Madrid, which is one of the most populated cities in the European Union and has a variety of transport modes, both public and private. For a detailed description of the case study, the reader is referred to reports such as Ayuntamiento de Madrid (2021) [
20] and Consorcio Regional de Transportes de Madrid (2019) [
21].
There has also been a major conflict between ride-hailing companies and conventional taxi services in recent years. Taxi drivers complained that ride-hailing companies did not pay taxes in Spain, did not follow labor laws, and benefited from the freedom to change their fares whenever they wanted. As a result, taxi sector protests and strikes have become common in Spain in recent years, particularly in the city of Madrid [
13].
In Spain, Uber and Cabify are the two largest ride-hailing companies [
6,
22]. Nevertheless, this paper only focuses on Uber services due to the lack of data available from its main competitor Cabify.
To better understand the cost of the ride, it is essential to know how Uber fares are estimated. The service fee
(total fare for a ride) for Uber is split into two parts (see Equation (1)).
The first component (base cost) includes regular fees, such as one-off fees, and trip fees proportional to the trip’s duration and distance. The second component (dynamic pricing) reflects the result of Uber’s surge pricing algorithm depending on supply and demand (S&D) imbalances [
8,
19].
Uber provides three different services in Spain (UberX, Uber Black, and Uber Van). UberX provides rides in regular vehicles for up to four people, while Uber Black is the premium service and Uber Van is a service for groups of up to 6 people. This paper primarily focuses on UberX rides because it is the most popular Uber product [
23,
24].
Table 1 describes the factors that influence UberX fares in Madrid during the period analyzed, based on multiple factors.
Uber fares are determined by the company’s policy, and the base cost considers three factors: (i) the one-off fee, which remains constant regardless of the length and duration of the ride; (ii) the cost per minute; (iii) the cost per kilometer. Dynamic pricing is applied depending on supply and demand through a real-time dynamic algorithm [
4,
26]. In addition, the minimum fare is also included, which is a minimum fare to compensate drivers for short rides.
It is worth mentioning that the real-time dynamic algorithm is not ‘open sourced’ from Uber (as well as other TNCs), and in most cases, information on fares is also not available. As a result, the underlying pricing mechanism is not known to transport professionals or policymakers. Given that fact, this research aims to better understand the behavior of ride-hailing fares, using applications of machine learning models that may be useful for transport policy purposes.
4. Data Collection and Analysis
Data collection was obtained using Uber’s Application Programming Interface (API). It was not possible to obtain information from other ride-hailing companies operating in the city (such as Cabify), since their APIs did not provide the availability of that information. Given the lack of up-to-date official empirical data on ride-hailing demand in Spain, ride-hailing prices can serve as a good proxy for estimating the level of demand, as the supply of ride-hailing services in Spain is very steady since car licenses are limited and most of the drivers work full time [
22,
27].
Using the web-scraping technique, a script was created in which the computer was taught to find the data that were deemed appropriate [
28]. These tools allow for the real-time collection of requested ride information while controlling for the latitude and longitude coordinates of the chosen OD points (as was conducted by Rangel et al., 2021 [
5], and Silveira-Santos et al., 2022 [
19]).
This study is not intended to compete with existing open tools for fare prediction (such as Uber’s Fare Estimator (
https://www.uber.com/global/en/price-estimate/, accessed on 10 January 2022) and UberFareFinder (
https://uberfarefinder.com/, accessed on 10 January 2022)), but rather to define a framework to identify the issues of ride-hailing fare prediction and the errors associated with it.
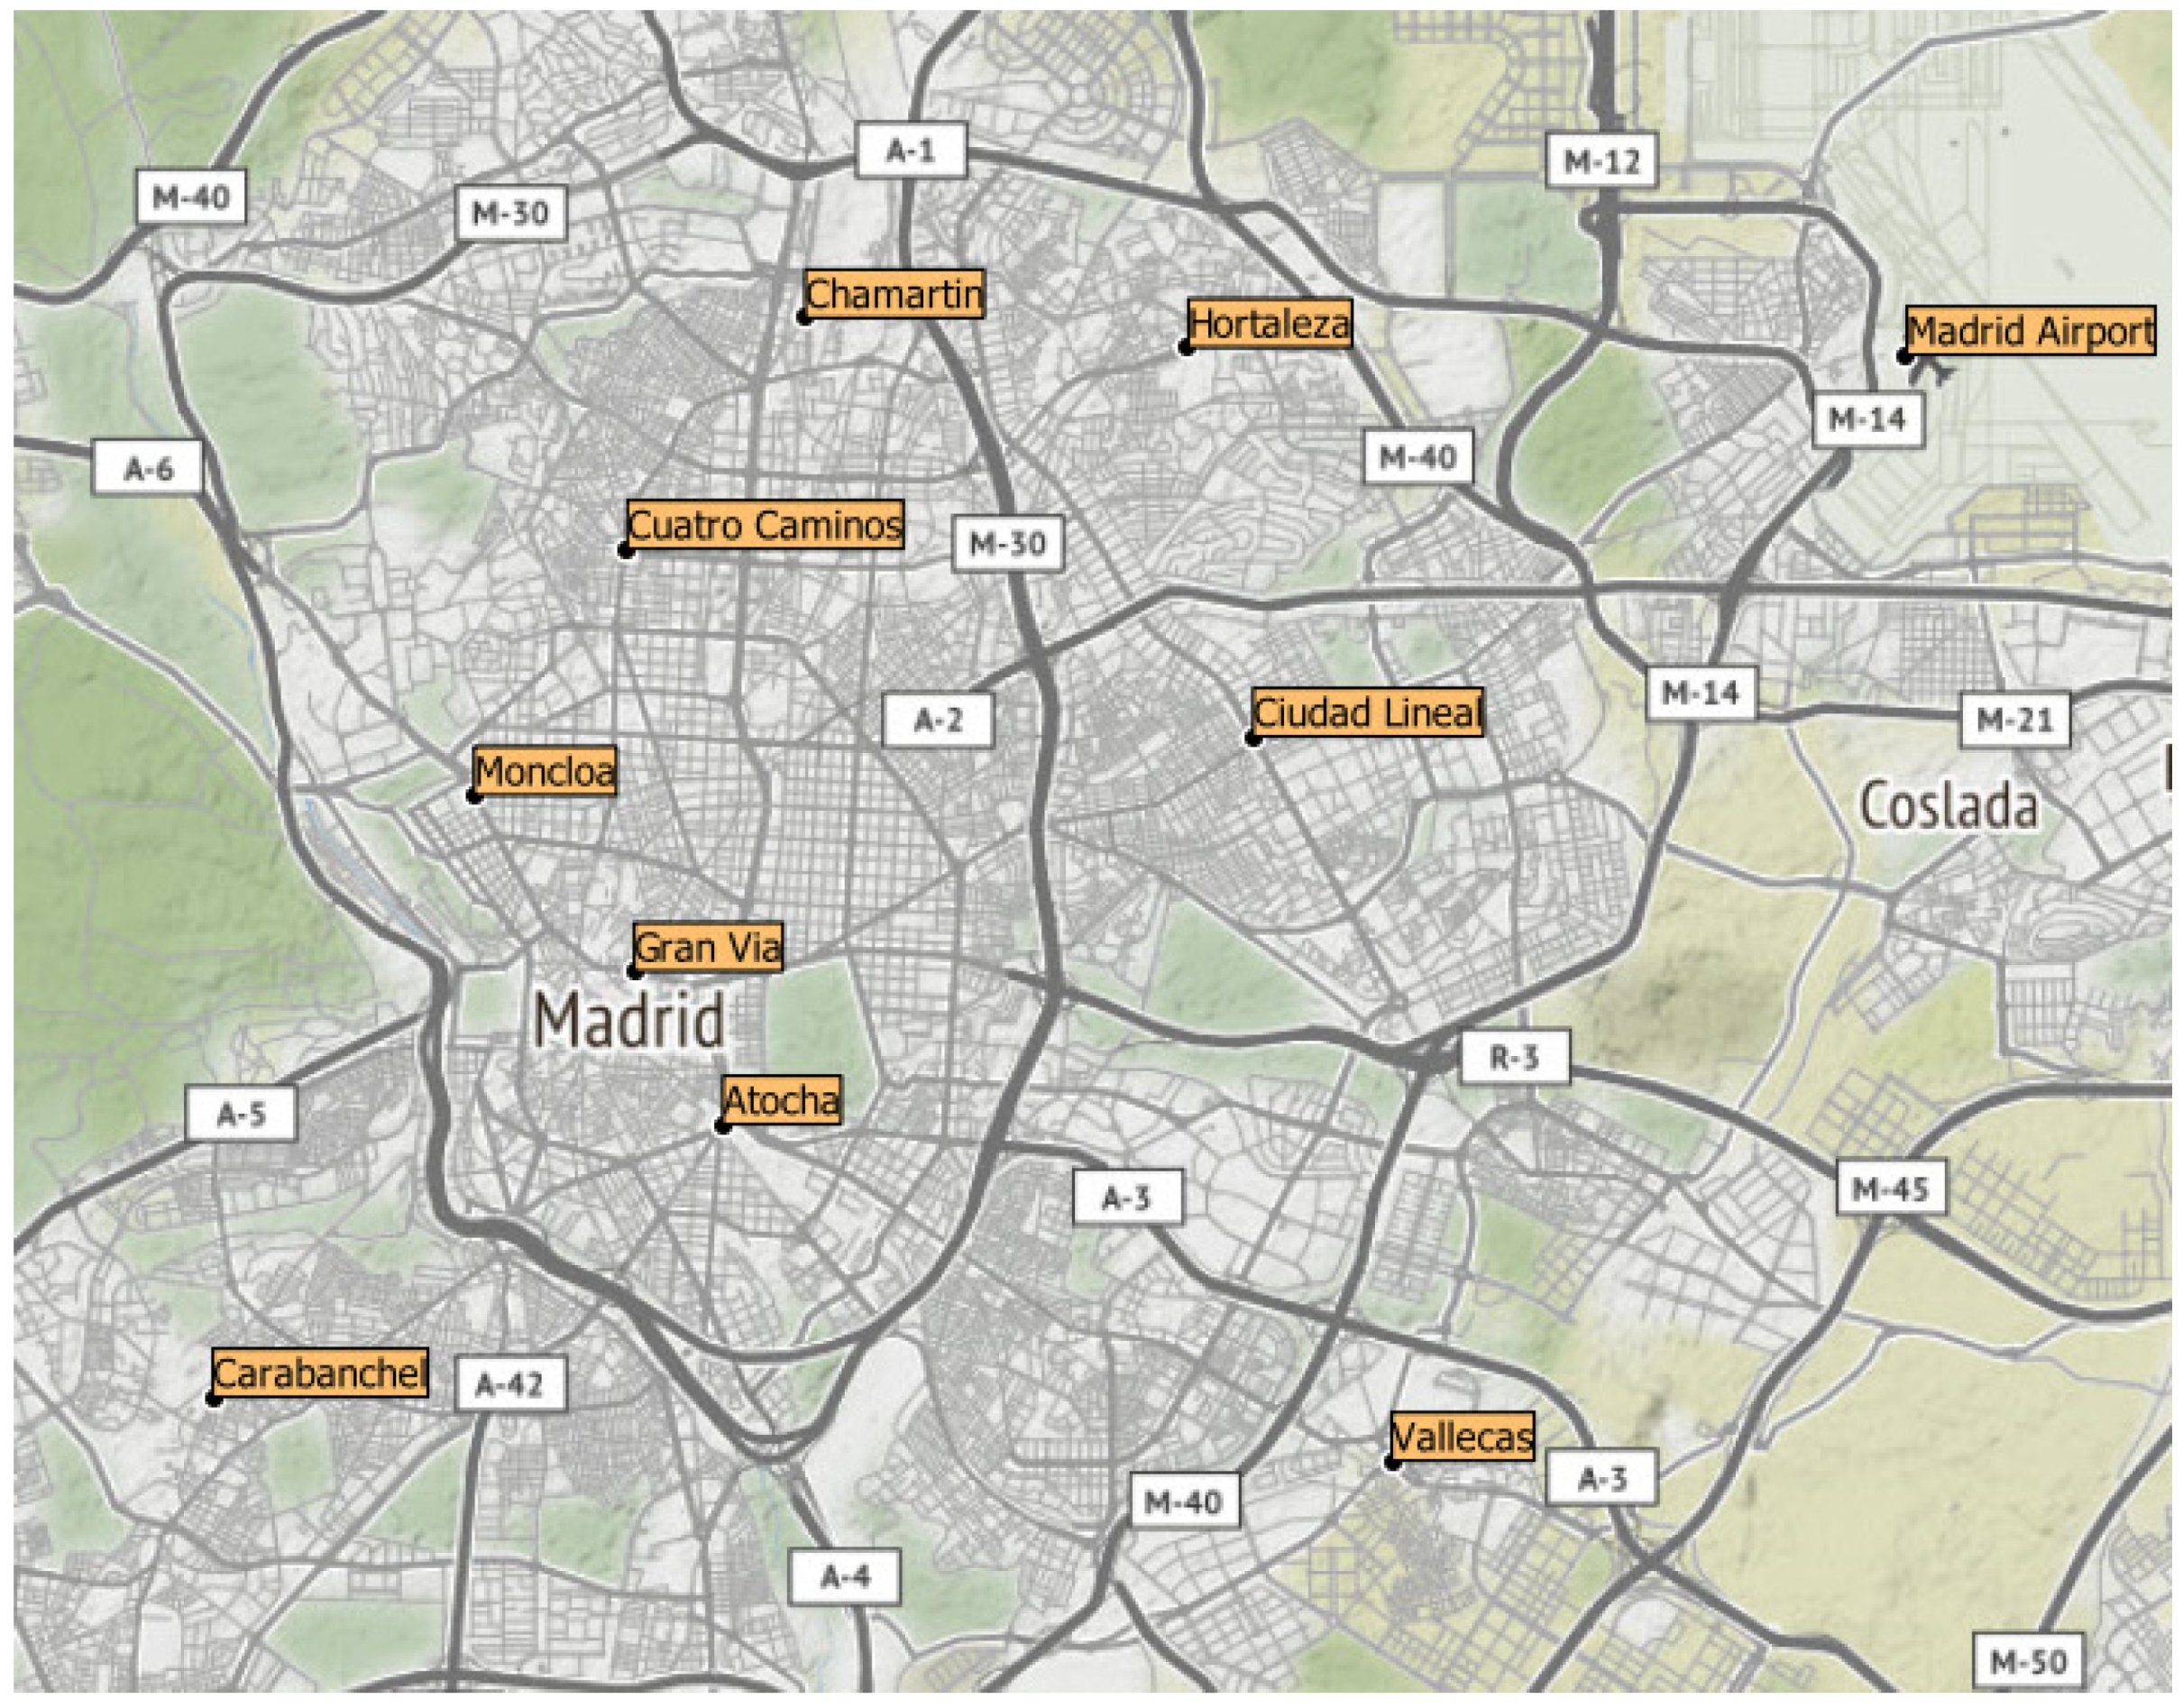
To collect information about ride-hailing fares, 10 locations in the city of Madrid were selected as the origin and destination (OD) of the requested rides (see
Figure 1). These locations were chosen to cover the city uniformly, including spots of high demand (e.g., airports, public transport stations, etc.). Ride-hailing demand is high at three special locations in the city of Madrid (i.e., Madrid-Barajas Airport, Atocha Train Station, and Chamartín Train Station). Then, using a GIS tool, another seven points were chosen to uniformly cover the city. In the end, 10 locations in the city of Madrid were defined (making up a network with 90 potential routes).
For each ride requested through the Uber API, the following data were gathered: (i) fare; (ii) trip distance; (iii) trip duration; and (iv) trip request time (with year, month, day, and hour information). The Uber fare represents the cost of the ride as displayed by the app. The trip distance and duration indicate the distance and travel time required to travel to a specific OD.
Data were collected through the Uber API and stored at 1 h intervals over 10 months (from September 2018 to June 2019), and 667,051 entries were collected. Data cleaning was required in cases where the fare, distance, and travel time variables had zero values. After the data cleaning process, the final dataset ended up containing 665,977 entries (99.84% of the original sample).
Additional exogenous variables were added using feature engineering techniques (the process of extracting characteristics, properties, and attributes from raw data using domain knowledge) and queries to other information sources in addition to the variables obtained via the Uber API. Specifically, information on delay, month, and hour (time of day) was extracted. Other sources of information were consulted to obtain additional data on variables that may influence demand, such as rain precipitation, business days and holidays, peak hours, and taxi strike periods. All these new variables were incorporated into the predictive models to better explain the results.
Since the Uber API’s travel time is estimated based on current traffic conditions, the delay variable was calculated as the difference between the travel time of an OD pair and the shortest travel time for that OD pair. This variable is a good indicator of the expected road congestion of each ride.
Categorical variables that control time-related features for requested trips, such as month and hour (time of day), were included to capture changes in ride-hailing fares at different times. In addition, holidays and peak hours in Madrid were verified, obtaining the variables of the business day (which does not include weekends and holidays) and peak hours (on business days from 07:00 to 09:00 and 18:00 to 20:00, according to EMESA, 2019 [
29]).
Weather conditions are included in the analysis because they can affect Uber demand and thus influence ride fares [
30]. Data on rain precipitation (measured in millimeters) was collected over 1 h. The State Meteorological Agency (AEMET) of Spain provided that information.
To account for special events that affect its main competitor’s transportation supply, the analysis also considers taxi strikes that occurred during the analysis period. A categorical variable was included to capture Madrid’s strike days from September 2018 to June 2019. Taxi strikes occurred for 20 days during the period studied.
Table 2 shows the descriptive statistics for the final data sample.
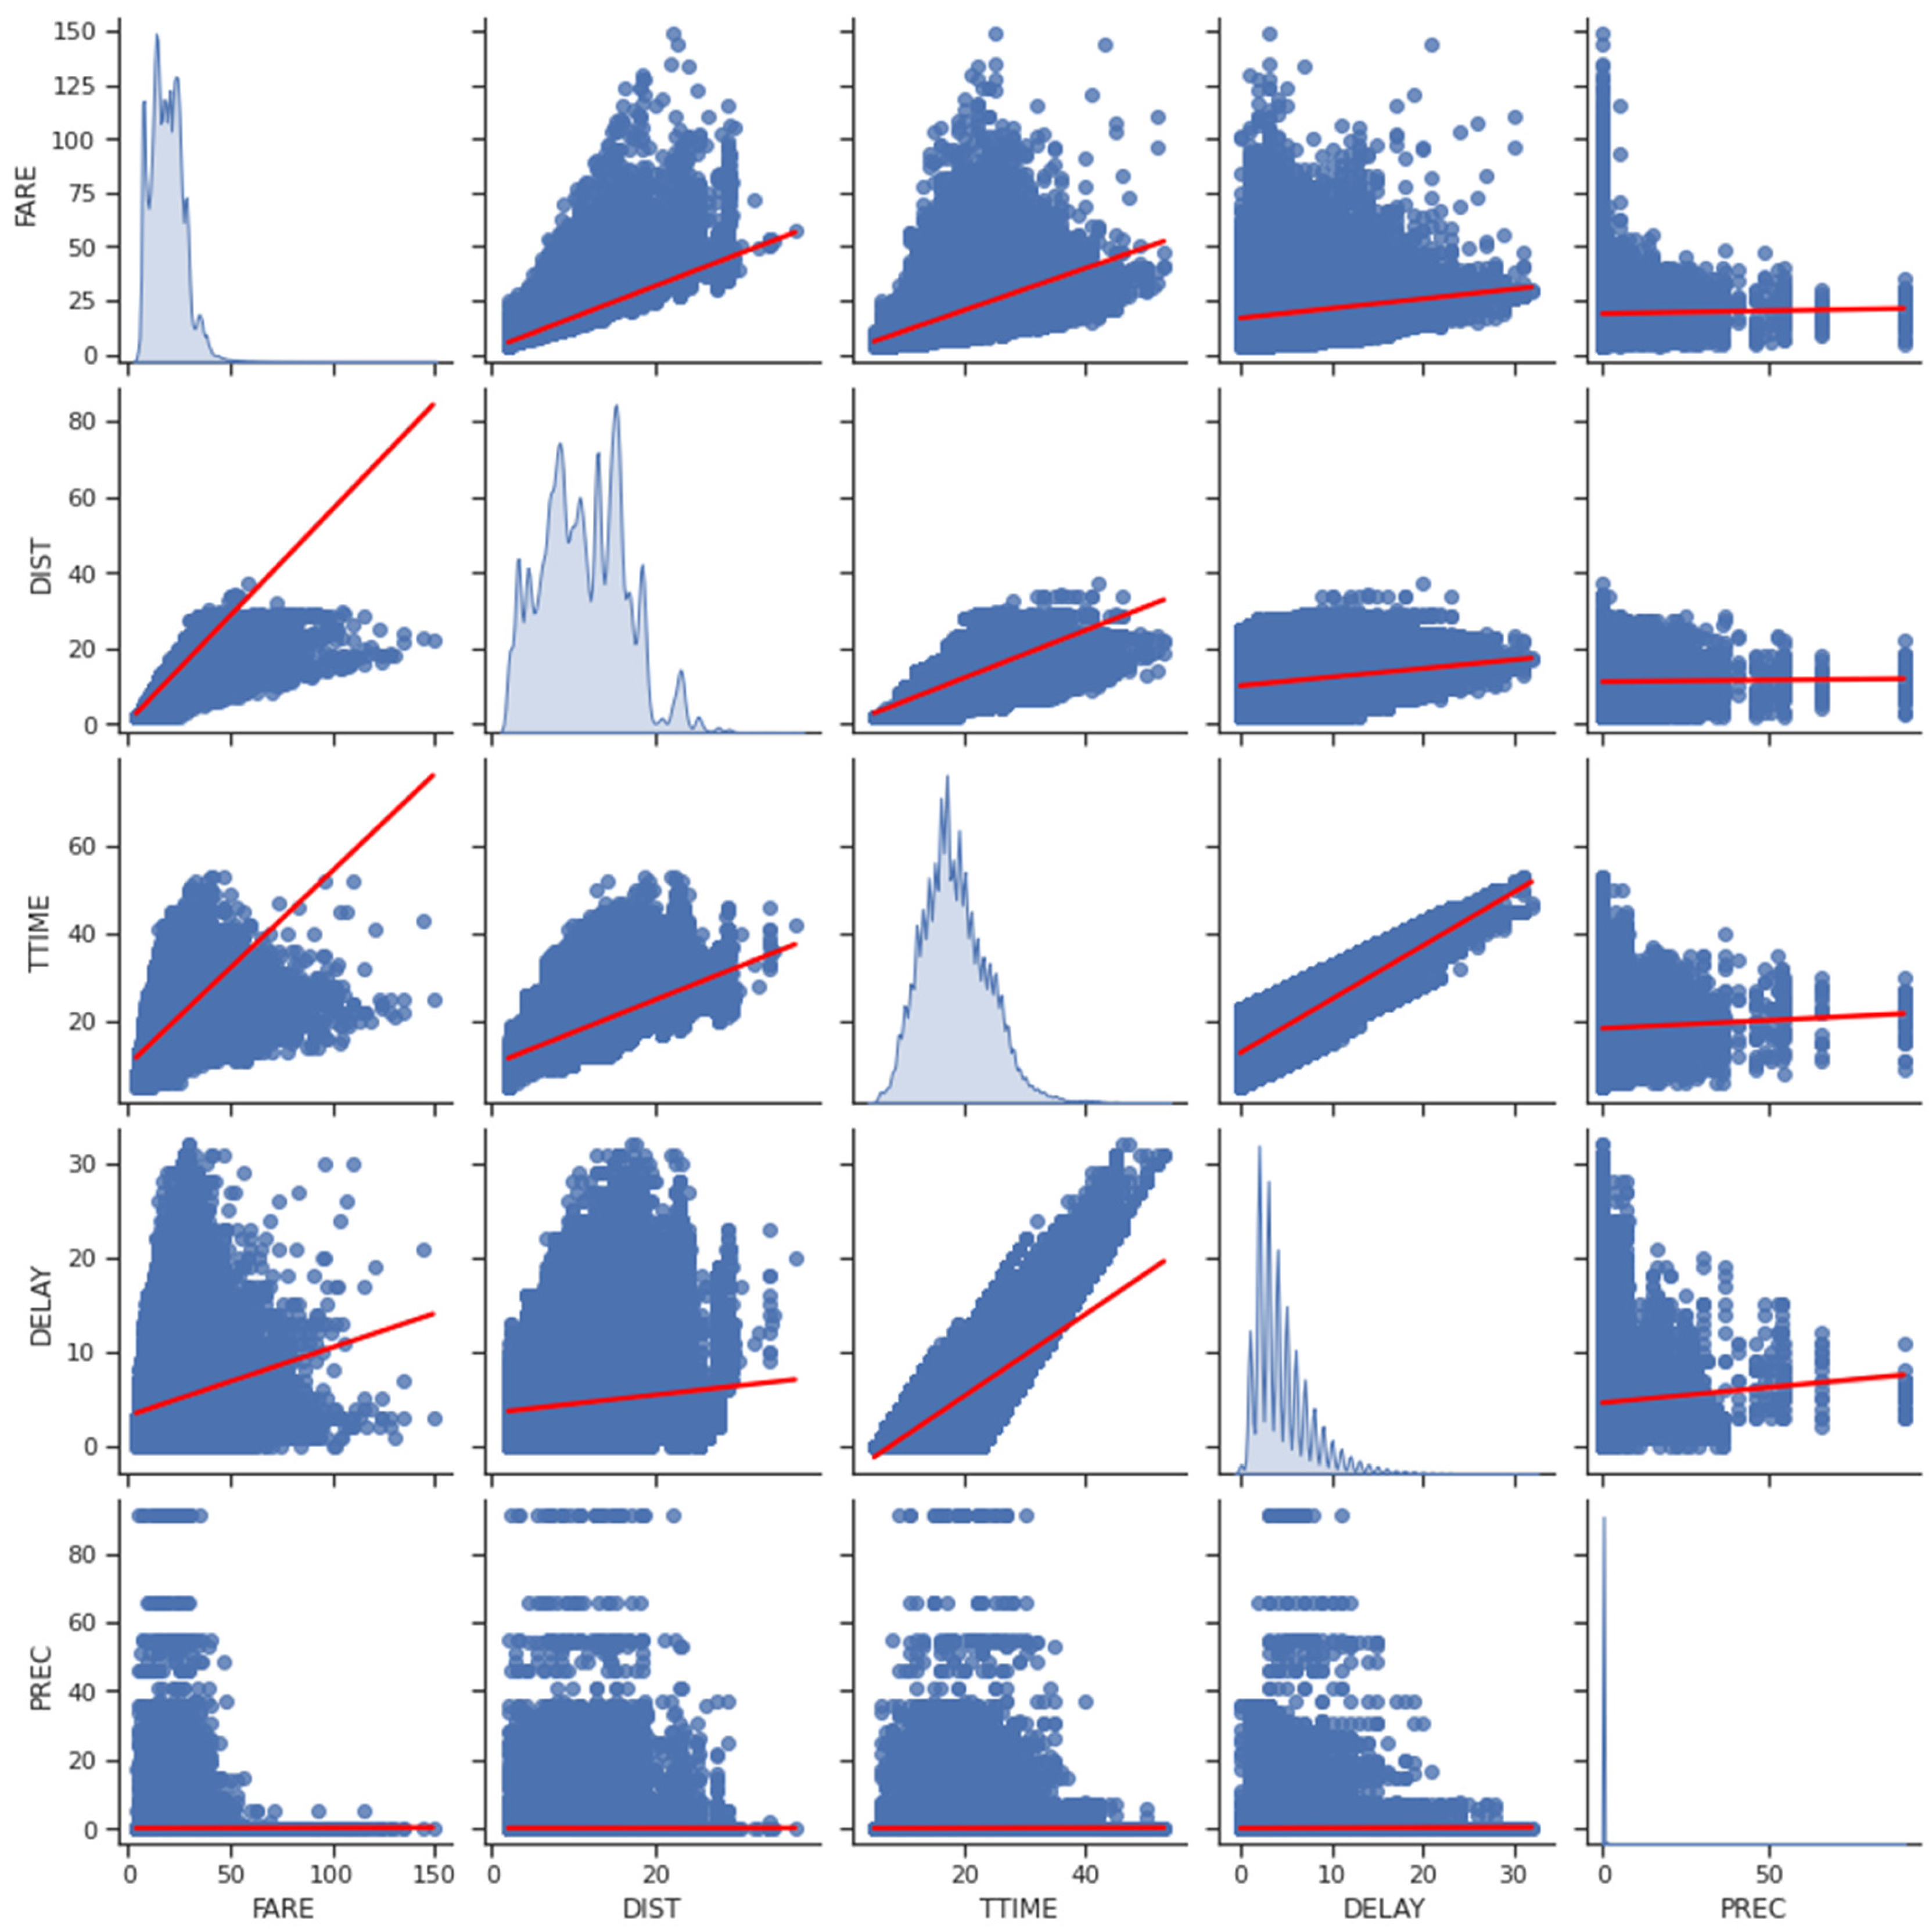
Figure 2 shows the pair plot of continuous variables.
The rain precipitation variable was highly skewed (γ1 = 23.59) and has 653,048 (98.1%) zeros. The data out of the main diagonal represent scatter plots of continuous variables, in which the correlation between them can also be observed.
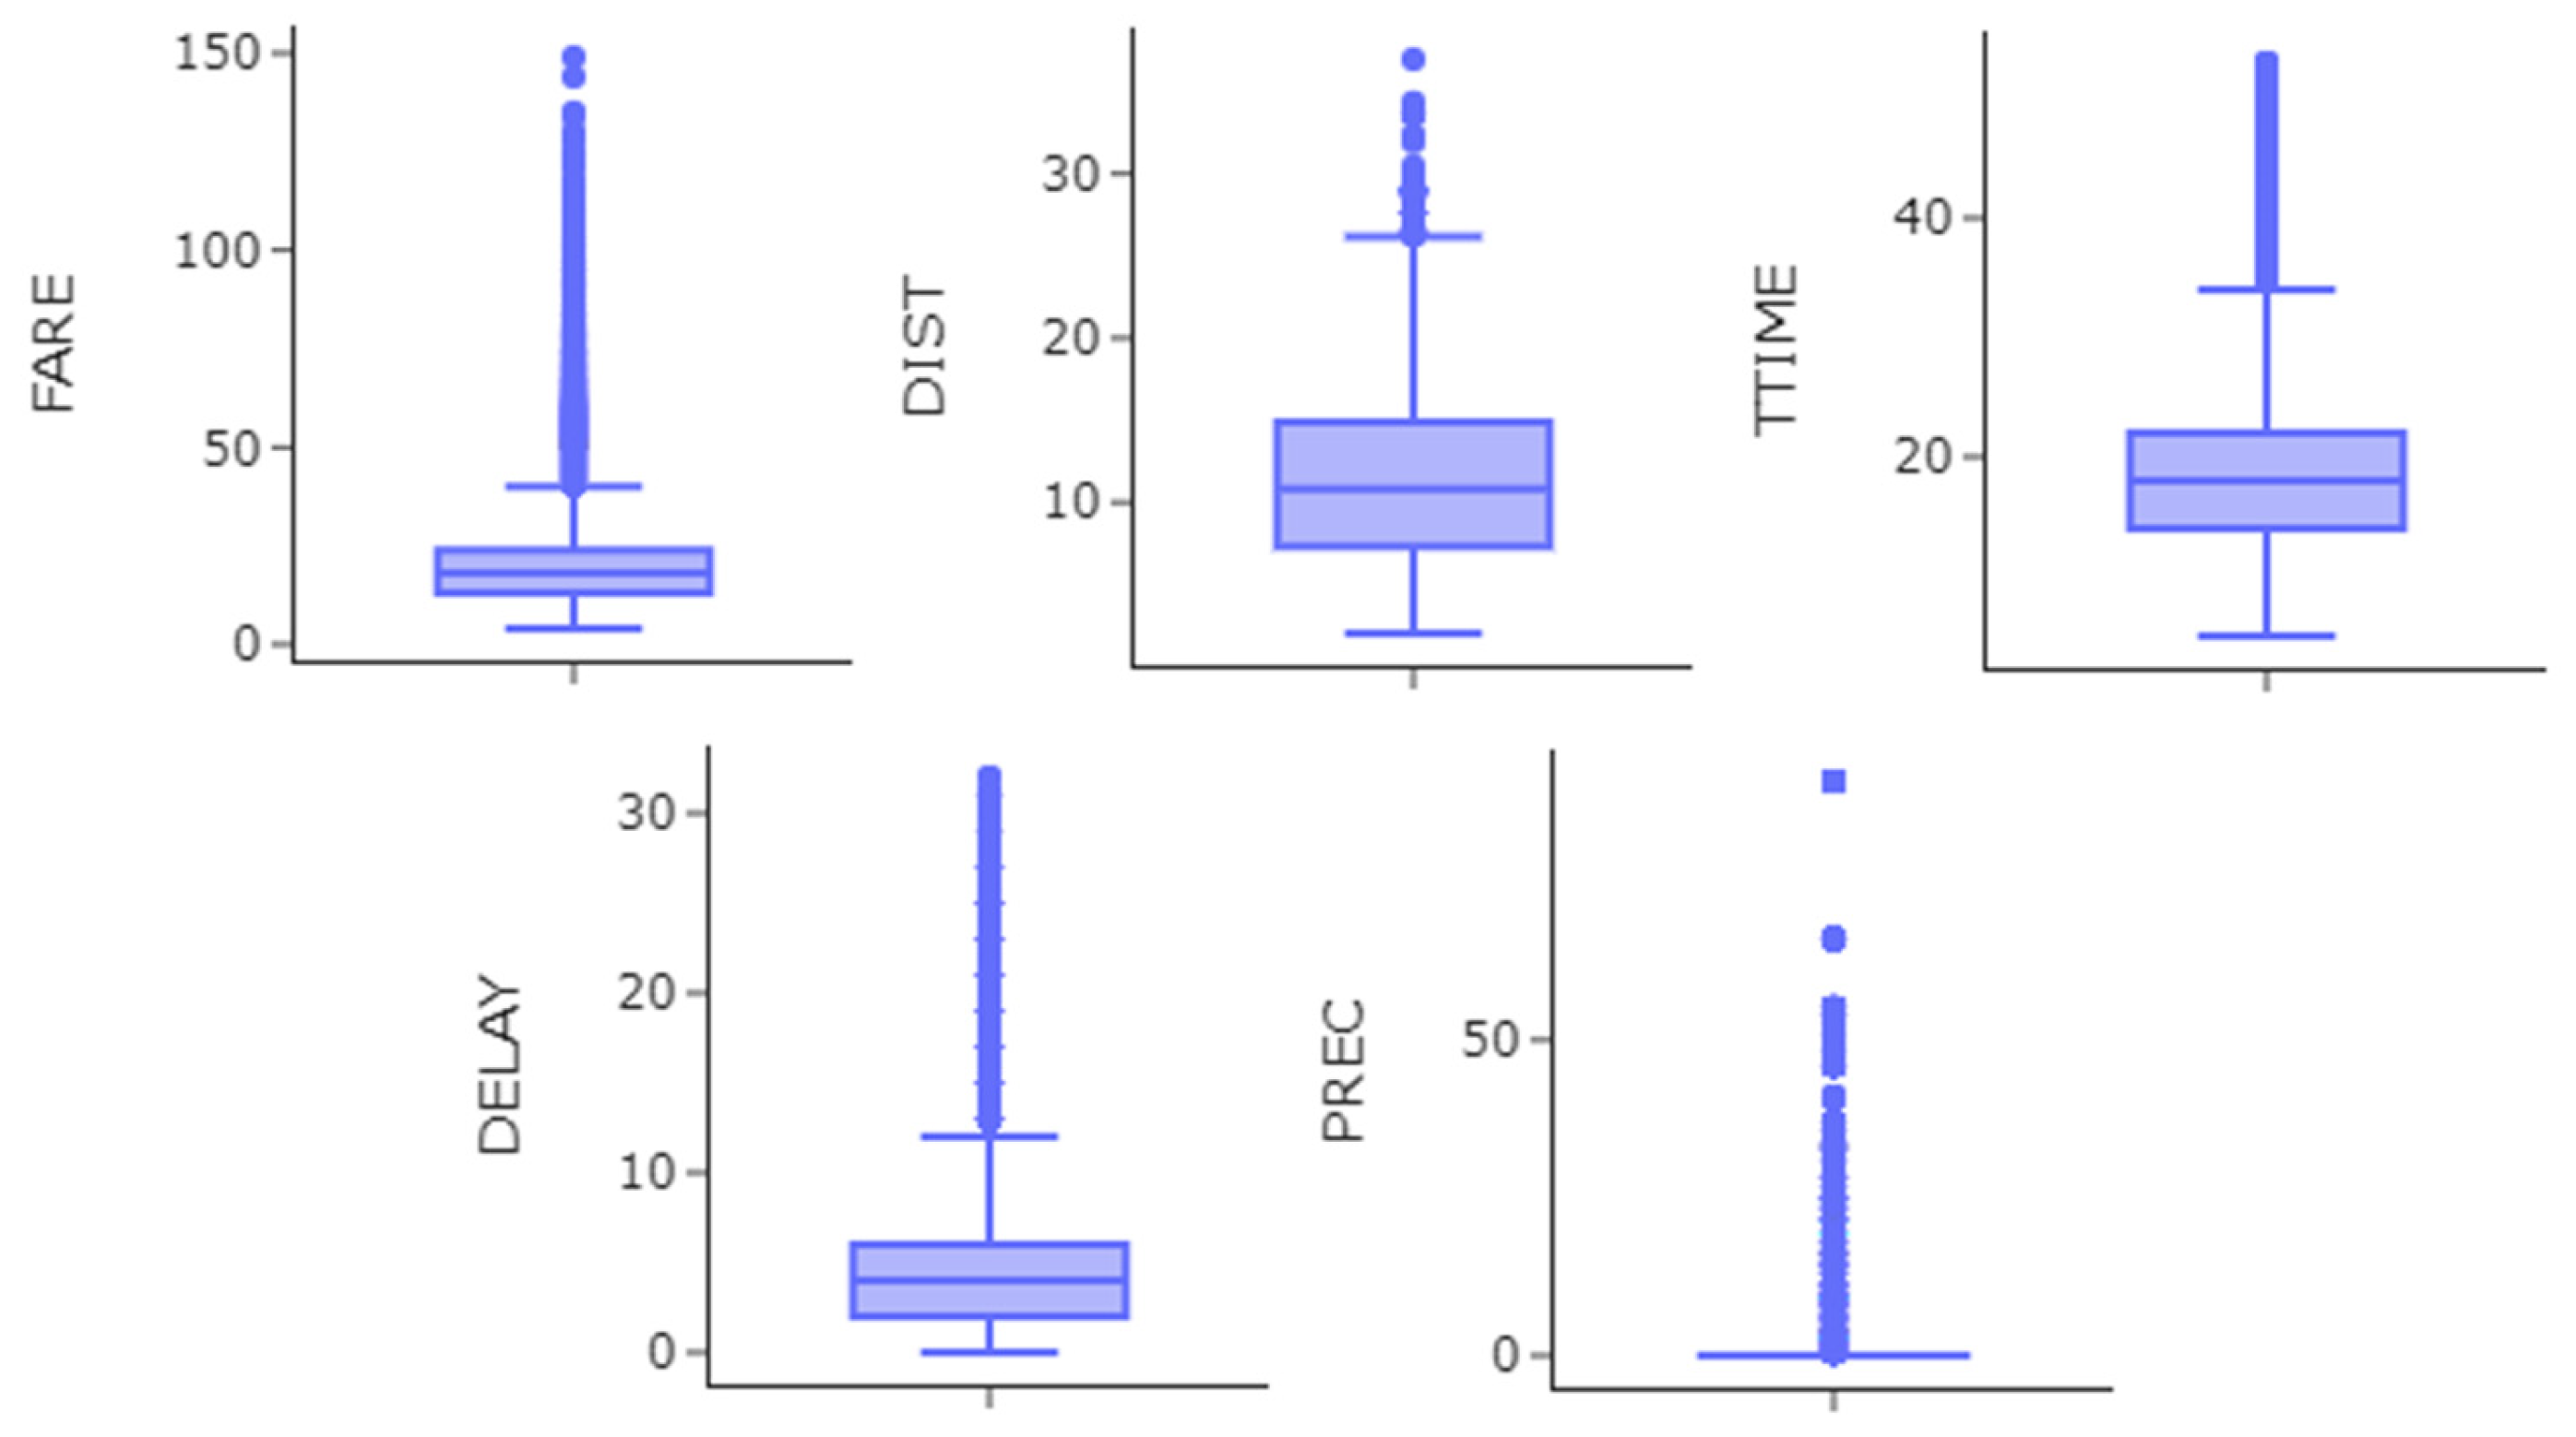
Figure 3 shows the boxplot of continuous variables.
It is worth noting that no outlier data were removed during the data cleaning process. “Extreme” ride-hailing fares were kept in the dataset because it is believed they represented some type of instant “market irregularity”, due to either low supply in cases of high demand or the opposite.
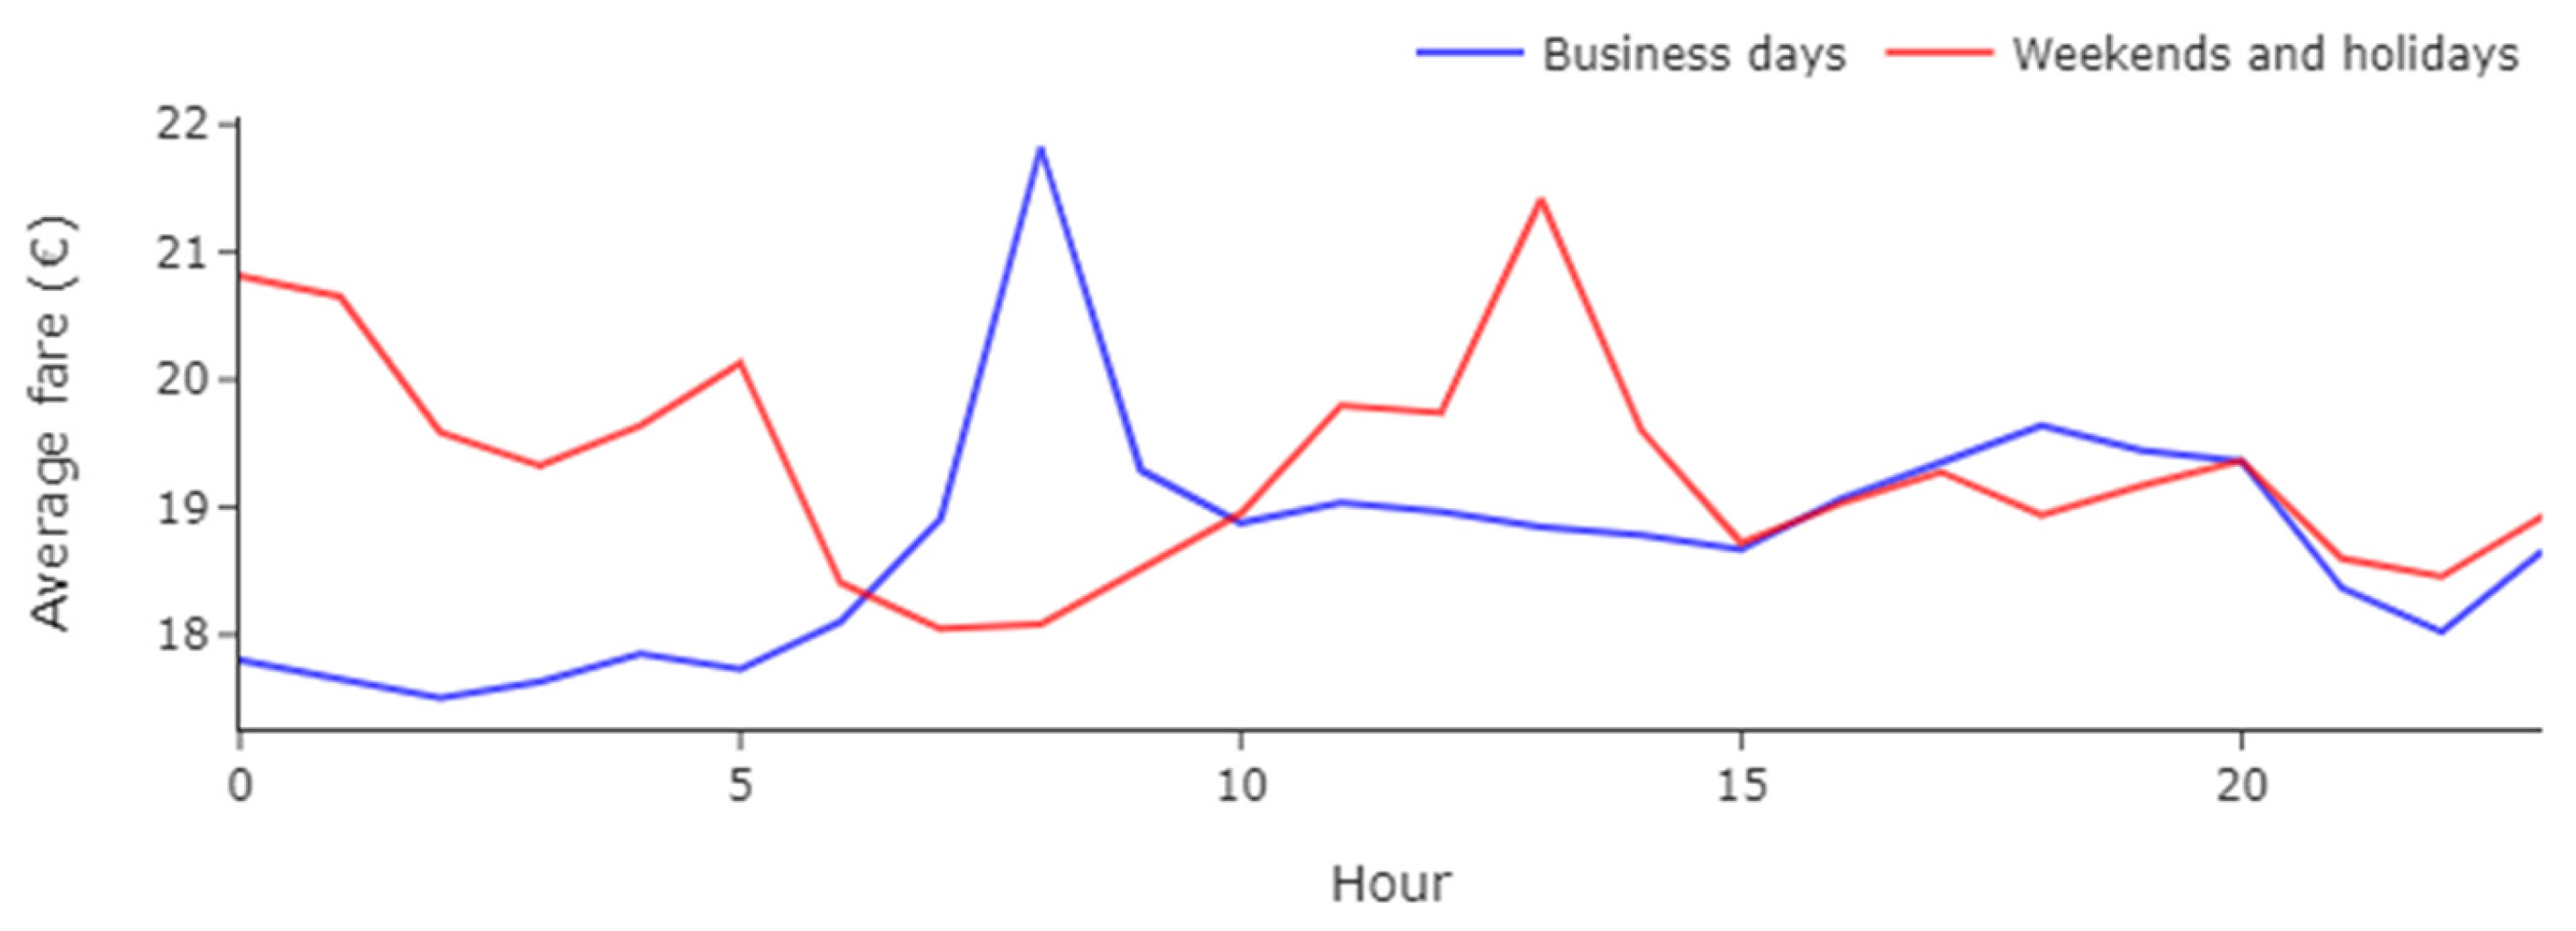
Figure 4 shows the average fare per hour and type of day (business, weekends, and holidays) for a better understanding of the fare trend throughout the day.
Uber fares on business days appear to have a morning peak at 08 h and a smoother and wider afternoon peak at around 18 h. Weekend and holiday fares, on the other hand, are more expensive late at night (which can be linked to leisure trips back home) and in the early afternoon (which can be linked to leisure activities such as dining, shopping, etc.). Uber fares are on average EUR 18.72 on business days and EUR 19.29 on weekends and holidays.
5. Methodology
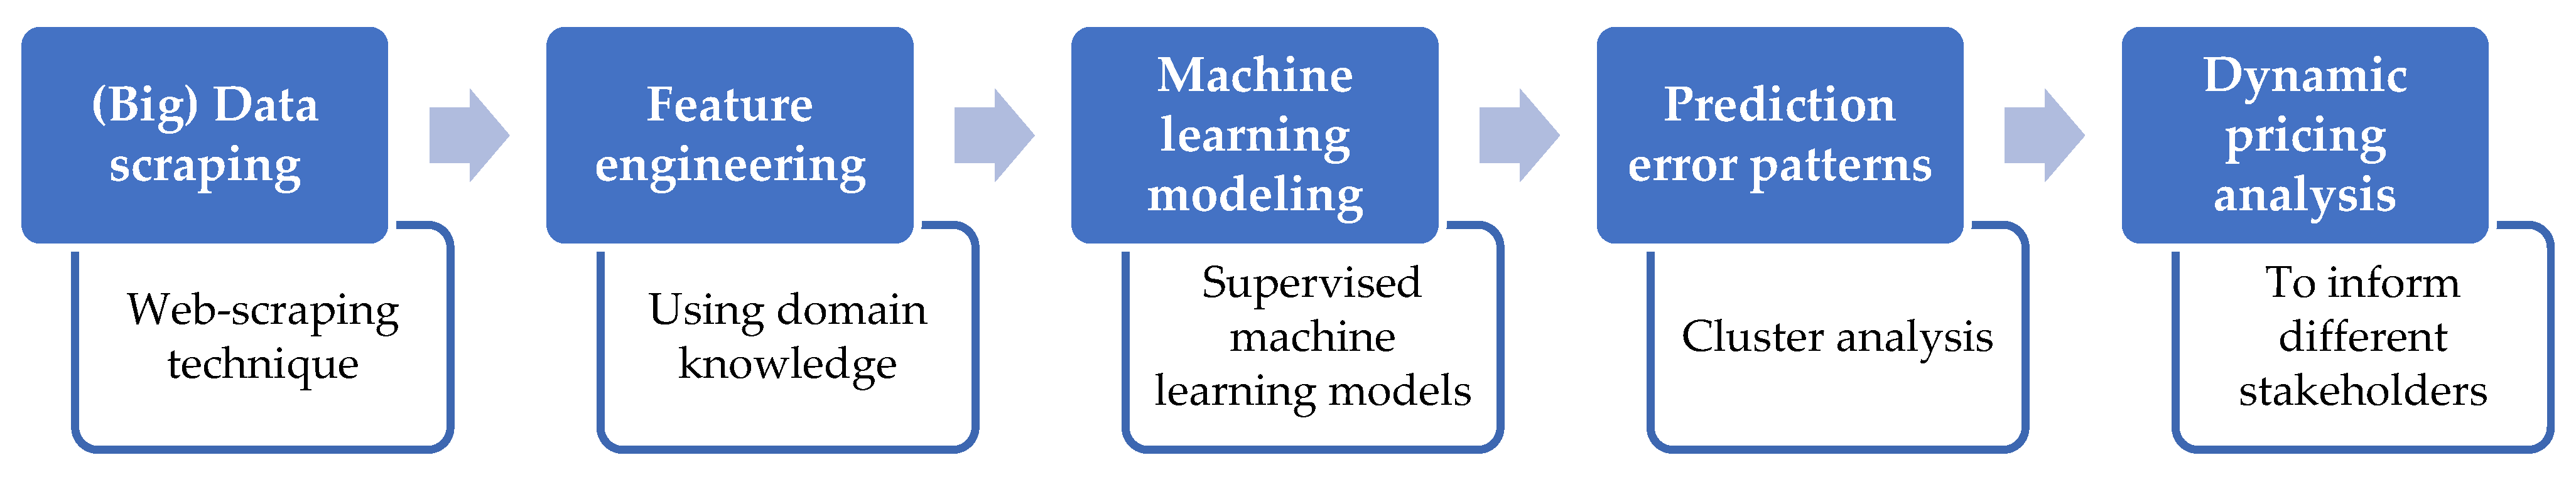
The conceptual methodological framework was developed in five sequential steps (see
Figure 5).
The first step includes (big) data scraping, which involves extracting information from a website and putting it into a database. The second stage includes the feature engineering technique, which involves the process of extracting characteristics, properties, and attributes from raw data using domain knowledge. These first two steps have already been presented in data collection and analysis (see
Section 4).
The third step describes the methods used to better understand and predict the behavior of ride-hailing fares, focusing on statistical and machine learning modeling. Supervised machine learning models were used for short-term prediction. All models were used to predict the expected ride-hailing fare for the case study of Madrid with a one-hour forecast horizon.
Machine learning is used as a technique to “learn” from data [
31,
32]. These techniques were proposed in this paper as a computational alternative to solve the problem of interest using standard prediction error metrics and model evaluation techniques. In total, three predictive models were trained on Uber data (see
Table 3), using scikit-learn’s open-source machine learning library (such as Linear Regression, Decision Tree, and Random Forest).
The predictive ability of the models can be verified in terms of some performance metrics. The Root Mean Squared Error (RMSE) and the Mean Absolute Percentage Error (MAPE) are two metrics commonly used to assess the accuracy of prediction models [
39].
The fourth step includes the analysis of error patterns, which involves analyzing the differences between the observed and predicted values of the models. To better understand the prediction results of the models, the unsupervised technique of cluster analysis was employed (using the models’ MAPE prediction errors as variables) to compare the profiles of each group with the other variables.
Capitalizing on the prediction errors analysis, the last step of the framework aims to highlight lessons learned from the behavior of dynamic pricing analysis and the behavior of misprediction (error) patterns caused by various supply–demand irregularities. Finally, the results of applying statistical and machine learning models to better understand the behavior of ride-hailing fares are linked to transport policies, highlighting the benefits of knowing/predicting fares for different stakeholders.
6. Results and Discussion
6.1. Statistical and Machine Learning Models
This subsection shows how statistical and machine learning models were used to predict the fare of the Uber service in Madrid with a one-hour prediction horizon (using scikit-learn’s open-source machine learning library). Several input features were used, which include Uber API data and the new exogenous variables imposed on the model (as shown in
Section 4).
The Uber fare variable (FARE) was used as the target variable explained by all the other variables listed in
Table 2 as features (e.g., trip distance, travel time, delay, etc.). In this study, the default hyperparameters for the three machine learning models were used. It is noteworthy that the same random data split of training and testing sets was used for all models (i.e., Train/Test equal to 80/20) for comparison purposes. Predictive accuracy is evaluated and compared across all models (see
Table 4).
The results show that the Random Forest model has the best average performance according to the RMSE (EUR3.40) and MAPE (6.32%) metrics. Although the RMSE results do not fluctuate as much, the MAPE results show that the Random Forest model performs better than the Decision Tree and Linear Regression models.
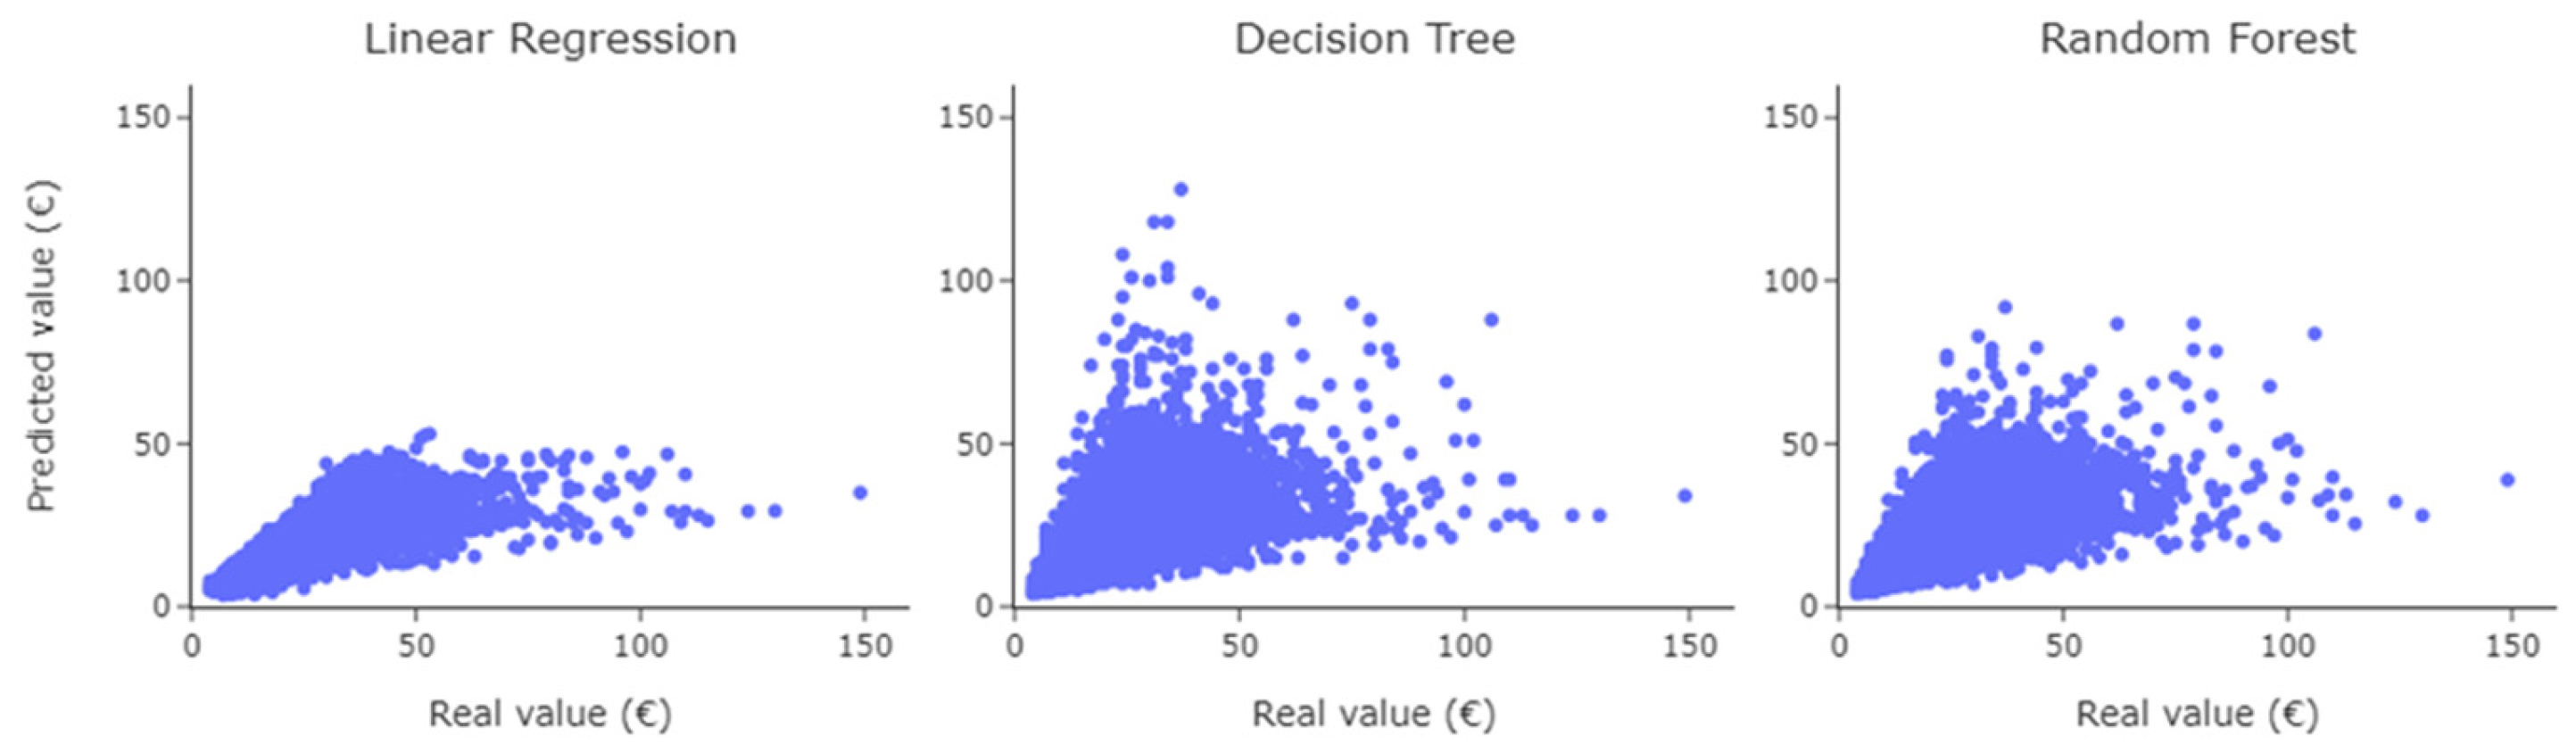
Figure 6 shows the scatterplots of real fare values versus predicted ones.
The Linear Regression model has difficulty in predicting higher fare values (mainly values above EUR 50), while the Decision Tree and Random Forest models show similar trends, and both predict better high fares (but it is the Random Forest that best predicts fares overall). However, it is still possible to observe some fare peaks in which the predicted values differ greatly. Thus, the next subsection presents the application of cluster analysis to highlight the differences in predicting Uber fares across the alternative models.
6.2. Cluster Analysis of the Prediction Errors
To inform policymaking, it is necessary to have an in-depth understanding of how Uber fares react concerning demand or supply shortages. To this end, in this subsection cluster analysis is applied using the prediction errors of the models as variables (namely, the distribution of MAPE prediction errors, which are mostly used for comparison purposes), identifying, for example, cases in which models overpredict or underpredict the observed fares.
Cluster analysis is a powerful technique for examining group features. Many studies based on clustering approaches have been conducted on feature recognition and analysis. Each observation belonging to one cluster is like the other ones belonging to it and different from all the other ones belonging to other clusters. The
k-means algorithm is one of the most frequently employed techniques in group division and feature analysis [
40].
This study applied the
k-means clustering method for which the number of clusters is one of the most critical decisions. In this analysis, the
cluster number was set to three, as was conducted by other authors, such as Kumar et al. (2016) [
41]. This study considers the number of clusters based on the distribution of MAPE prediction errors of the three models (i.e., Linear Regression, Decision Tree, and Random Forest), namely: (i) Low error; (ii) Medium error; and (iii) High error.
Fifty-nine iterations were necessary to achieve stability in the cluster centers.
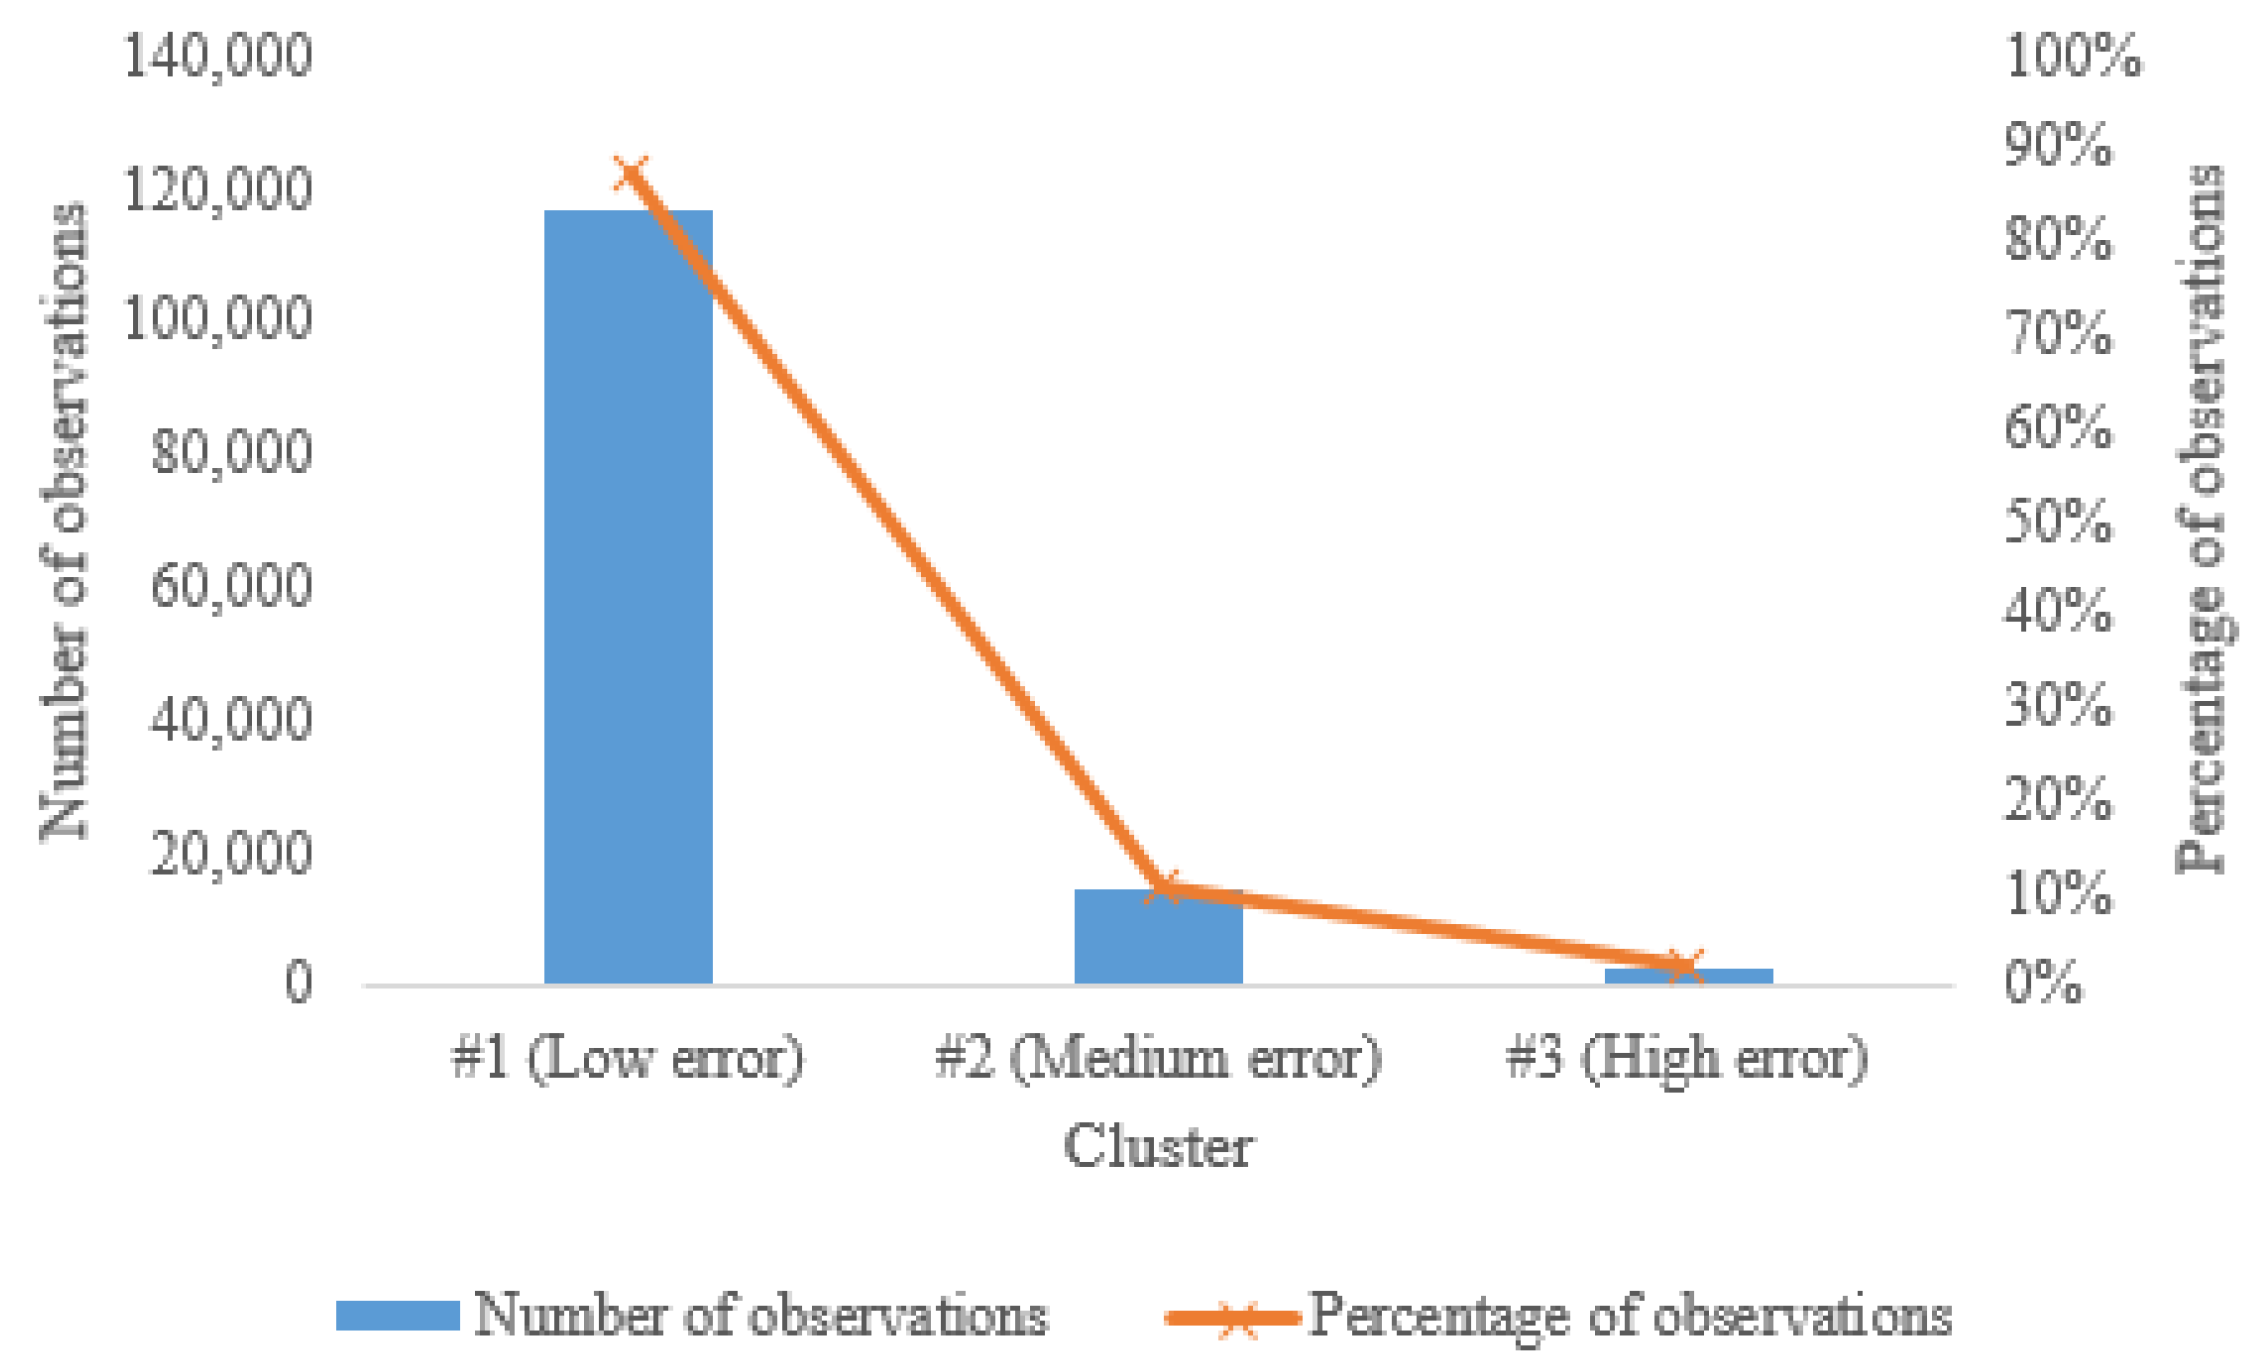
Table 5 shows the average distance of each variable (i.e., the MAPE prediction errors of the three machine learning models) to every cluster center and
Figure 7 shows the number and percentage of observations per cluster.
The characteristics of the clusters are described below:
Cluster #1 (Low error): This cluster has the smallest average distance values across all MAPE prediction error variables. The two smallest distances were found in the Decision Tree and Random Forest models, indicating that these models predict observations with smaller MAPE prediction errors than Linear Regression.
Cluster #2 (Medium error): This cluster has intermediate average distance values on all MAPE prediction error variables. The smallest distance was found in the Linear Regression model.
Cluster #3 (High error): This cluster has the highest average distance values across all MAPE prediction error variables. The smallest distance was found in the Linear Regression model, indicating that this model predicts the observations in the group with larger MAPE prediction errors better.
The number of observations in each cluster also shows that cluster #1 (Low error) contains 87.32% of the observations, followed by cluster #2 (Medium error) with 10.72% and cluster #3 (High error) with 1.96%. All valid observations are included in the clusters. The results show that a high share of the observations have small MAPE prediction errors (87.32%), which shows good accuracy of the machine learning models used to predict the UberX fare (the Random Forest is the machine learning model with the best performance metrics and is also one of the models contributing the most to the group with small MAPE prediction errors). Likewise, it shows a very small share of the observations with high MAPE prediction errors (only 1.96%), which can be caused by unexpected surges due to imbalances between supply and demand, as well as being related to outliers that were not removed and/or other variables (see
Section 4).
Table 6 presents a summary of the statistics of the clusters in terms of key continuous variables (e.g., UberX fare, trip distance, travel time, etc.).
Forecasting ride-hailing fares appears more difficult (high MAPE prediction errors) when the supply value of the fare variable (FARE) and when rain precipitation (PREC) is higher, but the high standard deviations of the errors overshadow this effect (due to the existence of outliers in all groups). It is also noteworthy there is no clear trend for the variables trip distance (DIST), travel time (TTIME), and delay (DELAY) concerning the errors across clusters, which means the models have already captured the statistical signal from these variables.
Table 7 shows the percentage of frequency of observations of the categorical variables within the three clusters.
The results of the percentages of frequency of observations of the categorical variables per cluster show how much they interfere with the MAPE prediction errors, mainly in cluster #3 (High error). The prediction of ride-hailing fares becomes slightly more complex when there is a taxi strike, as well as during peak hours (from 07:00 to 09:00 and from 18:00 to 20:00). The results also show that the forecasts are more accurate on business days, being thus less accurate on weekends and holidays, in which there is a high percentage of frequency of observations in clusters #2 (57.21%) and #3 (68.21%). The previous reasons appear to be related to potential demand peaks that cause an imbalance between supply and demand.
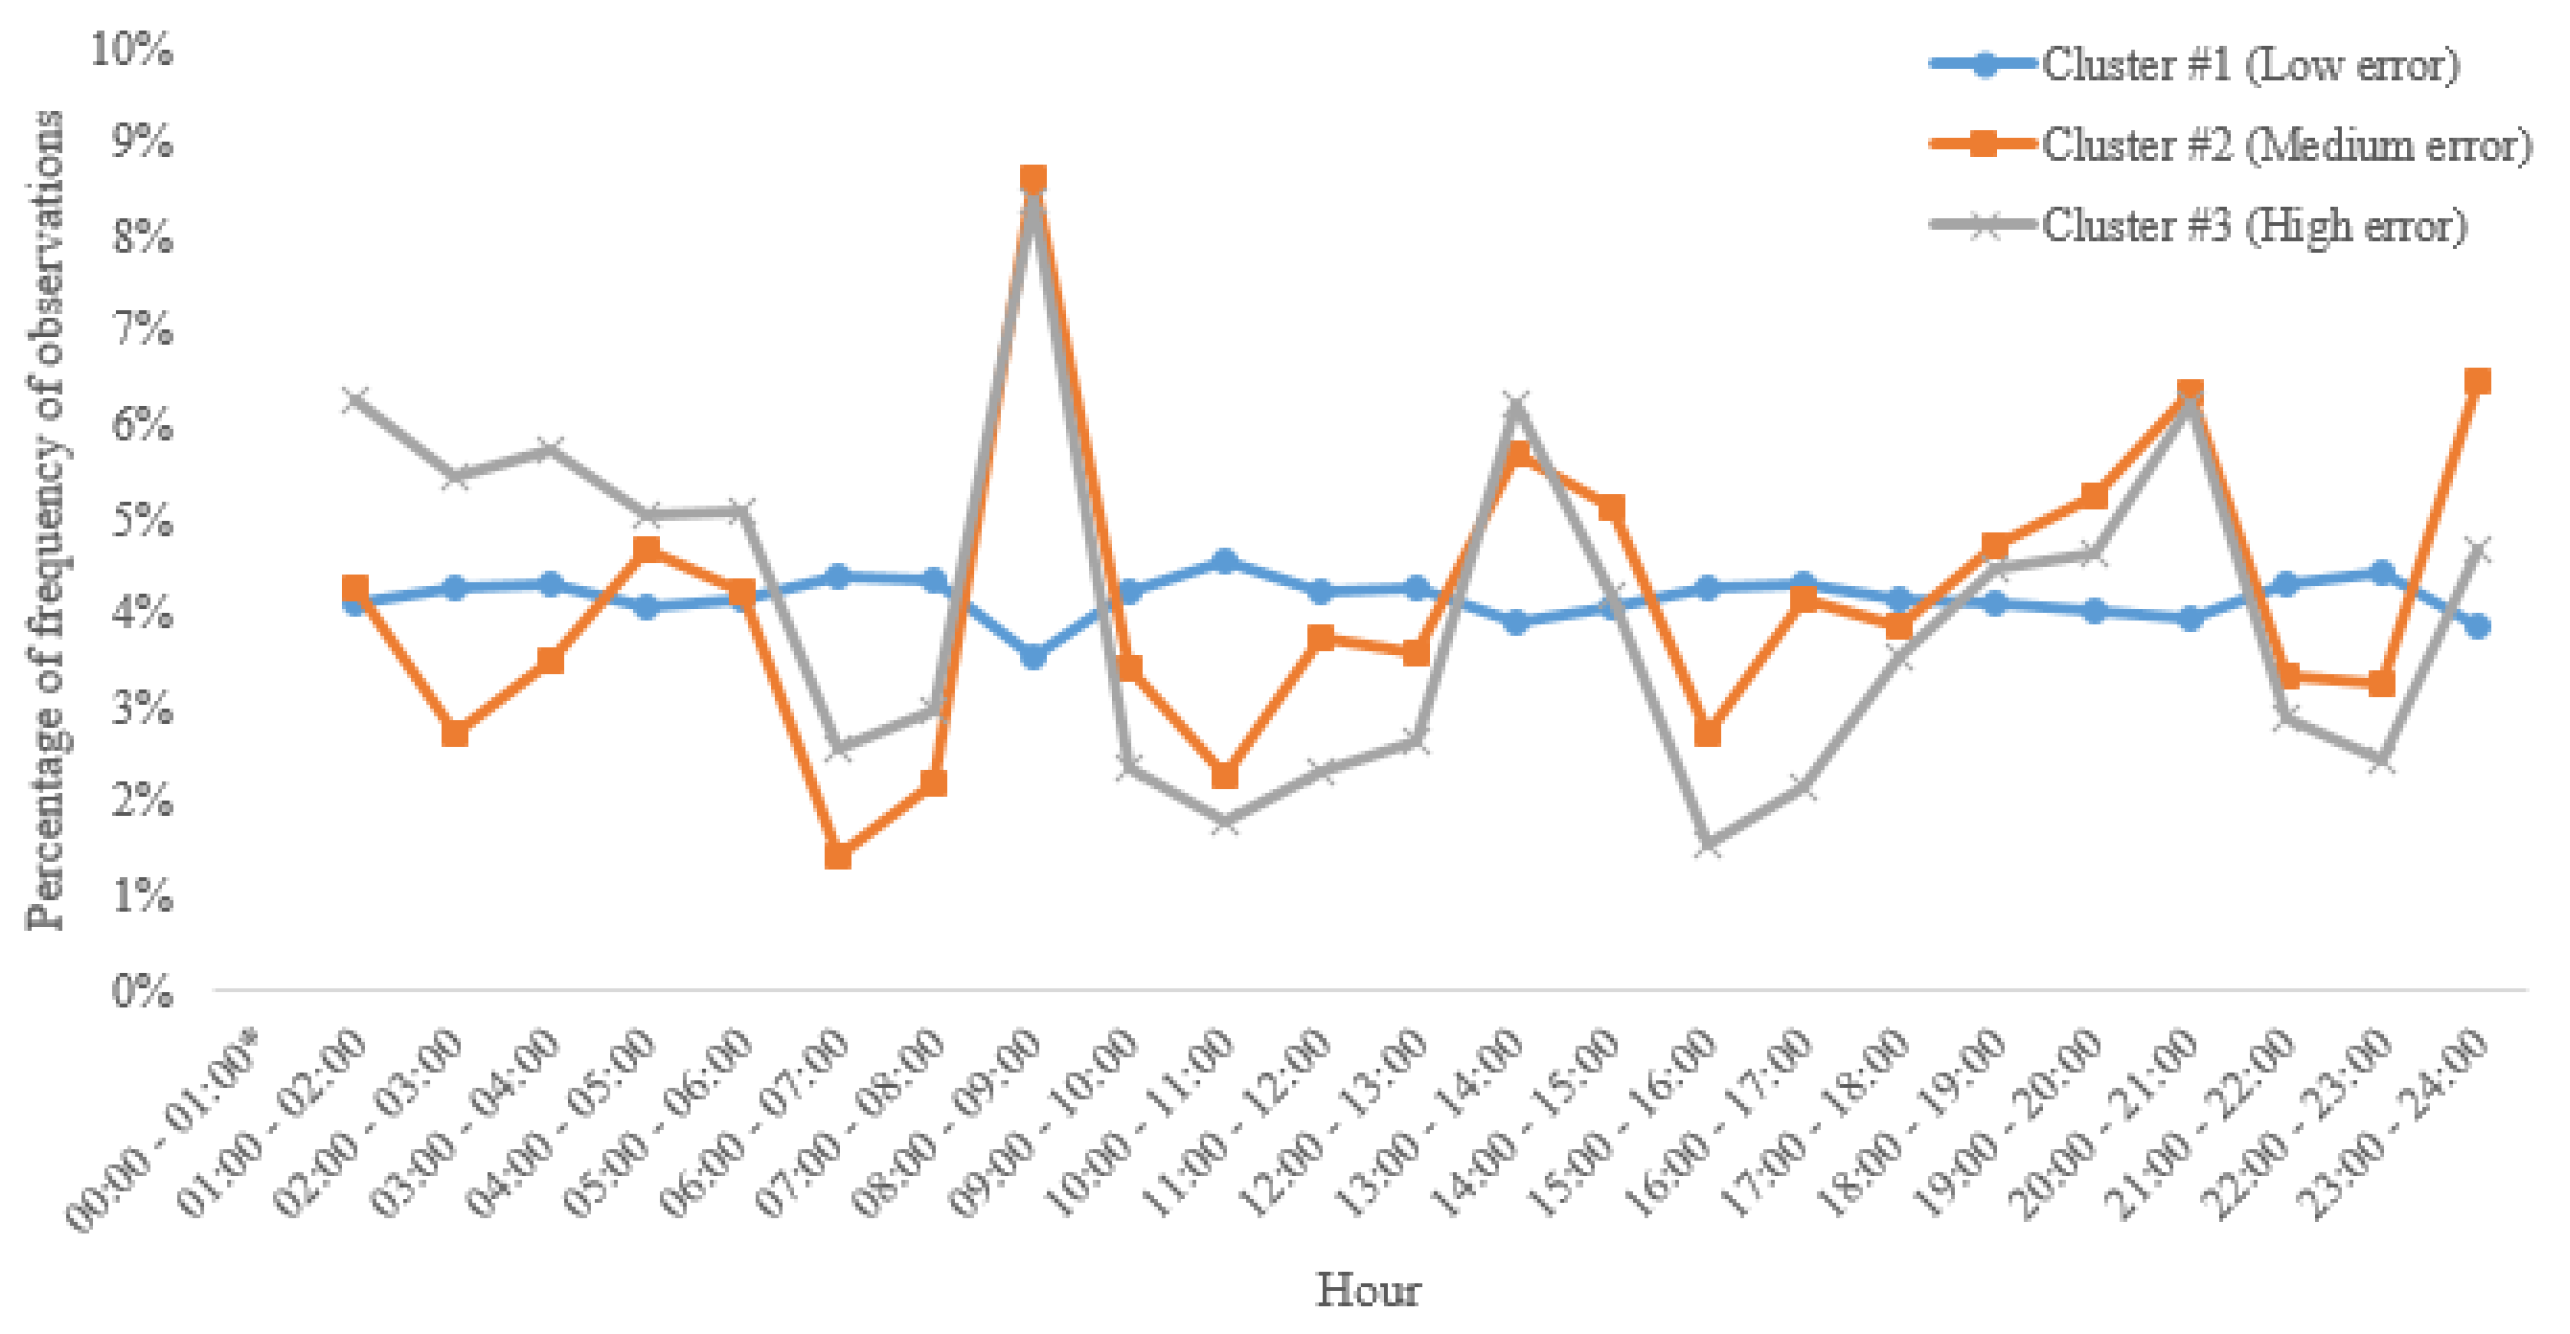
Figure 8 shows the percentage of frequency of observations per hour and cluster.
Cluster #1 (Low Error) is the one with the highest number of observations, being the frequency of observations almost constant across hours of the day, ranging from 3.52% to 4.56%. Clusters #2 (Medium error) and #3 (High error) behave in quite different ways. Despite having fewer observations, there is a greater share of high MAPE prediction errors in peak hours, the early afternoon, and late at night, which is also in line with what was presented in
Figure 4.
To verify the cases in which the models overestimate or underestimate the observed fares,
Table 8 presents the over-prediction and under-prediction by cluster and model.
The models show more over-prediction than under-prediction in all clusters, especially in clusters #1 (Low error) and #3 (High error). Cluster #2 (Medium error) presents similar percentages of over-prediction and under-prediction and is the only one where the Linear Regression model differs more from the tree-based models.
6.3. Discussion
The results show differences in prediction using different models, especially in MAPE prediction errors (see
Table 4) and in the scatterplots of real fare values versus predicted values (see
Figure 6).
To better understand and explore the reasons for ‘highly mispredicted’ fares, cluster analysis was applied, using only the MAPE prediction errors from the three models as variables (see
Section 6.2). The results of this analysis show that the prediction of ride-hailing fares become more difficult in the following cases: (i) the supply value of the fare variable is very high; (ii) there is higher rain precipitation; (iii) there is a taxi strike; (iv) during peak hours; and (v) during weekends and holidays. All the previous cases appear to be related to unexpected demand rises that produce an imbalance between supply and demand. The analysis thus helps identify in which circumstances there are imbalances between supply and demand.
As mentioned before, machine learning models were applied considering the complete dataset, thus working with fixed and dynamic prices, not only dynamic prices—as noted by Rangel et al. (2021) [
5]. It is also noteworthy that these authors explored ride-hailing fares using an econometric model (adopting the Generalized Linear Model—GLM) but decided to reduce the number of combinations to just 40 OD pairs (representing 42% of the entire sample of this research) by looking only at fare data with notable variations over time (i.e., dynamic prices). All Uber minimum fare data (fixed price equivalent to EUR 3.50) was excluded because the econometric model adopted did not work well with fixed prices. Although the sample is smaller than that of this research, these authors found similar prediction difficulties in the econometric model (such as the occurrence of taxi strikes and peak hours).
This research shows that machine learning methods can also handle the analysis of more data (which skewed the results of econometric models). The Random Forest model is the machine learning model with the best performance metrics (see
Table 4) and is also one of the models that most contribute to the group with small MAPE prediction errors (see
Table 5). The models also show more over-prediction than under-prediction in all clusters (see
Table 8).
7. Conclusions and Policy Recommendations
Three models were applied to better understand the behavior of ride-hailing fares, using scikit-learn’s open-source machine learning library (such as Linear Regression, Decision Tree, and Random Forest). The Random Forest was the one with the best performance metrics and is also one of the models that most contribute to the group with small MAPE prediction errors. The authors hence recommend combining statistical and supervised machine learning models with unsupervised techniques on the errors analysis to predict ride-hailing fares and better understand the conditions under which market imbalances occur, which lead to lower- or higher-than-expected ride-hailing fares.
From a transport policy point of view, the authors highlight several benefits of knowing/predicting the behavior of ride-hailing fares for different stakeholders: public authorities, regulatory authorities, users, and drivers.
Public authorities can take advantage of knowing and predicting ride-hailing fares to define and adopt policy measures to set a rational competition and coordination with the taxi industry and across ride-hailing companies. In Spain, for example, taxi services claim that they should be able to establish their prices with the same freedom as ride-hailing services to compete fairly with them [
5]. Knowing the fares can also help them understand imbalances between mobility supply and demand and promote greater coordination with other mobility options (e.g., through Mobility as a Service package).
Regulatory authorities can use the methodology and result coming out from this paper to safeguard fair competition among different ride-hailing operators. The results can also help them identify bad practices from operators aimed to obtain larger earnings through a dominant position, as happened in China, according to the literature review.
The findings can help users know the ride’s price in advance, thus facilitating them in choosing the most favorable option for their trips according to their priorities. They can also help drivers keep track of fare rises to secure higher pricing and hence more potential earnings.
Future research directions include: (i) adopting these methods to perform ride-hailing fare prediction using data from different stages of the COVID-19 pandemic; (ii) extending the research methods to other cities (as the ride-hailing market in Spain is restricted and the number of ride-hailing licenses is also limited); (iii) using other robust models for predicting ride-hailing fares, especially to better estimate unexpected surges; and (iv) collecting data from shorter intervals to more accurately capture peak fares.


