Article

Evaluation of an Eye-Tracking-Based Method for Assessing the Visual Performance with Progressive Lens Designs

by
Pablo Concepcion-Grande
1,*,
Eva Chamorro
1,
José Miguel Cleva
1,
José Alonso
1 and
Jose A. Gómez-Pedrero
2
1
Clinical Research Department, Indizen Optical Technologies, 28002 Madrid, Spain
2
Applied Optics Complutense Group, Optics Department, Optics and Optometry Faculty, Complutense University of Madrid, 28049 Madrid, Spain
*
Author to whom correspondence should be addressed.
Appl. Sci. 2023, 13(8), 5059; https://doi.org/10.3390/app13085059
Submission received: 10 March 2023 / Revised: 14 April 2023 / Accepted: 17 April 2023 / Published: 18 April 2023
(This article belongs to the Special Issue Eye-Tracking Technologies: Theory, Methods and Applications)

Abstract

:
Due to the lack of sensitivity of visual acuity (VA) measurement to quantify differences in visual performance between progressive power lenses (PPLs), in this study, we propose and evaluate an eye-tracking-based method to assess visual performance when wearing PPLs. A wearable eye-tracker system (Tobii-Pro Glasses 3) recorded the pupil position of 27 PPL users at near and distance vision during a VA test while wearing three PPL designs: a PPL for general use (PPL-Balance), a PPL optimized for near vision (PPL-Near), and a PPL optimized for distance vision (PPL-Distance). The participants were asked to recognize eye charts at both near and distance vision using centered and oblique gaze directions with each PPL design. The results showed no statistically significant differences between PPLs for VA. However, significant differences in eye-tracking parameters were observed between PPLs. Furthermore, PPL-Distance had a lower test duration, complete fixation time, and number of fixations at distance evaluation. PPL-Near has a lower test duration, complete fixation time, and number of fixations for near vision. In conclusion, the quality of vision with PPLs can be better characterized by incorporating eye movement parameters than the traditional evaluation method.

1. Introduction

Presbyopia is an age-related condition that prevents focusing on near objects; it is a natural part of the aging process and begins to develop around age 40 [1]. Progressive power lenses (PPLs) are a popular solution for presbyopes, as they provide a gradual transition of spherical power between distance and near vision, allowing wearers to see clearly at all distances by changing their gaze direction [2]. Due to the power variation along the vertical main meridian, usually an umbilical curve, unwanted astigmatic and spherical power variations appear in the lateral areas of the lens and affect the quality of vision [3,4]. Some proposed methods to evaluate the quality of vision with PPLs are based on the representation of theoretical power distribution maps obtained with lens mappers [5,6] or calculated using exact ray tracking to obtain user-perceived power distribution maps [7,8]. They are based on geometrical magnitude calculations that estimate the theoretical fields of view [5,6,9]. Although theoretical representations could be useful to characterize PPLs, the quality of vision varies depending on the subjective visual perception of the user. In order to gain a better understanding of this topic, several studies have been carried out to evaluate the quality of vision with PPLs using different methods such as satisfaction questionnaires [10,11,12,13], contrast sensitivity [14], reading performance [11,15], skew distortion [16], or high contrast visual acuity (VA) [12,17,18,19]. High-contrast VA is one of the main ways to assess the quality of vision with PPLs. VA refers to the ability to discern object details subtending a certain angle and is commonly employed in clinical practice to measure vision quality. It is also the standard measure to assess the quality of an optical correction [1]. The measurement of VA has been extensively used to evaluate the impact of lateral refractive errors in PPLs on visual performance. Legras et al. [17] evaluated differences in VA with 2 different PPLs and reported worse VA values when viewing through the lateral regions of the lens in comparison with the central region. Villegas et al. [19] also evaluated the effect of off-axis refractive errors in a PPL and showed a reduction in VA at off-axis gaze directions in comparison with centered gaze directions. However, these studies have not found significant differences in VA scores between different types of PPLs. This could be because the VA score does not consider other factors that impact visual perception, such as the time needed to recognize the optotypes. For this reason, this work proposes the assessment of the visual quality provided by PPLs by means of parameters such as recognition speed or the number of eye fixations while recognizing the optotypes.
Video-based ETs allow the monitoring and recording of gaze positions by sending infrared light to the subject’s eye and recording with a camera the light reflected from it [20,21]. The bright pupil and the corneal reflections are processed using advanced image-processing software to obtain the instantaneous gaze direction with high accuracy and to calculate eye movements as saccades and fixations [21,22,23]. Thanks to these systems, it is possible to study the influence of factors such as text characteristics [24] or blur on eye movements [25]. In the field of PPLs, this technology has been widely used to study how lateral refractive errors of PPLs affect eye fixations. Han et al. [26,27] analyzed differences in eye fixations when reading with PPLs vs. single-vision lenses. Concepcion-Grande et al. [28] studied differences in eye fixations while reading on a monitor screen with two different PPL designs. Rifai et al. [29] studied differences in eye fixations while driving between PPL users in comparison with non-PPL users. All of them demonstrated that lateral unwanted refractive errors of PPLs affect eye fixation characteristics. For that reason, this study aims to evaluate an eye-tracking-based method for assessing the quality of vision with progressive power lenses by analyzing test duration and eye fixation characteristics during a high-contrast visual acuity test.

2. Materials and Methods

Study Design: A prospective, observational, longitudinal, double-masked study was carried out to evaluate test duration and characteristics of eye fixation when performing VA tests with 3 different PPL types. The factors analyzed were eye chart size, gaze direction, and lens design. The study followed the principles of the Declaration of Helsinki. Full study approval was obtained from the Complutense University of Madrid Committee Review Board (CE_20210715-3_SAL). All participants provided written informed consent before the start of the study, and at the end of the study, subjects were compensated with one pair of glasses.
Participants: The study sample was made up of presbyopic participants of both genders who were older than 44 and had worn PPLs for at least six months before the start of the study. The inclusion criteria were: (1) Refractive error range of −6.00 D to +5.00 D with astigmatism less than or equal to 2.50 D. (2) Near addition power from +1.00 D to +3.00 D. (3) Best-corrected VA is better than 0.1 logMAR monocularly and 0.05 logMAR binocularly. (4) Anisometropia below 1.50 D. Subjects were rejected if they had any ocular diseases, non-compensated binocular vision anomalies, medical conditions that could affect vision, or if they were undergoing any pharmacological treatments that might have affected the subjects’ visual function. The sample size was calculated based on data from a preliminary study with five participants who met the same inclusion criteria as above. The calculation was performed using the GRANMO sample size calculator, version 7.12 (Institut Municipal d’Investigació Mèdica, Barcelona, Spain). Two-tailed testing with an alpha risk of 0.05, a beta risk of 0.1, and a dropout rate of 30% was set to estimate a sample size of 37 participants.
Procedure: All participants underwent a full optometric assessment to check whether they met the inclusion criteria. The visual examination included VA measurement using the PVVAT test (Precision Vision, La Salle, III), subjective refraction at a distance and near vision, stereo acuity assessment by the Titmus test, the Worth test, the Cover test, and ocular motility examination. After the optometrists determined the participant met the inclusion criteria, the fitting parameters and position of wear for the eye-tracker glasses were measured: pupillary position, segment height, back vertex distance, frame wrap angle, and pantoscopic tilt. Once these data were collected, the PPL study lenses were ordered. VA measurements incorporating an eye-tracking system for three different PPL designs at far and near distances were recorded in two different day visits with a duration of two hours. During the first visit, far-distance VA recordings were collected for the three different PPLs at three different gaze directions, and a two-minute break was taken between each experimental condition to minimize the participant’s fatigue. In a similar way, during the second visit, near-distance VA measurements were collected for the three different PPLs and three gaze directions, including two-minute breaks between each experimental condition to minimize visual fatigue.
Progressive Power Lenses: Three different individualized free-form PPL designs were used for this study: (1) a balanced design, PPL-Balance (Endless Steady Balance, IOT, Madrid, Spain); (2) a lens with a wider field of view for near vision, PPL-Near (Endless Steady Near, IOT, Madrid, Spain); and (3) a lens with a wider field of view for distance vision, PPL-Distance (Endless Steady Distance, IOT, Madrid, Spain). The PPL’s technical characteristics (cylinder and mean power distribution maps) for a plano prescription, addition 2D, using standard position-of-wear parameters are shown in Figure 1. The lenses were placed on a specific clip-on frame that was attached to the eye-tracker glasses. This configuration allows for direct pupil registration without any interference from the PPL. Lenses were calculated using an advanced lens calculation software (FreeForm Designer, IOT, Madrid, Spain) considering the fitting parameters of the PPLs attached to the ET glasses to reduce oblique aberrations and maintain a stable field of view regardless of the prescription and the additional power of each participant.
Eye tracking recording: Binocular pupil position was recorded using a wearable eye-tracker system (Tobii Pro Glasses 3, Tobii AB, Stockholm, Sweden) with a sampling rate of 50 Hz. Recordings were made while participants were performing VA tests at a distance and near vision using eye charts with logMAR (logarithm of the minimum angle of resolution) unit notation and a scoring criterion that assigns to the subject the VA corresponding to a given line when at least three letters are correctly recognized [31,32]. The eye charts were composed of black optotypes over a white background with a luminance of 160 cd/m2. Measurements were performed under photopic conditions (70 lux) in a uniformly illuminated room. Each eye chart was made up of a single row of five randomized optotypes (Sloan letters). The VA increments between eye charts were 0.10 logMAR. Subjects were asked to read the entire row of letters from left to right, beginning with an eye chart with a letter size two steps greater than their best-correction VA until the maximum VA was reached. VA measurements were done for each of the three PPLs at three different gaze directions in the following sequence: centered, 12.5° off-axis dominant eye side, and 12.5° off-axis non-dominant eye side. The order of measurements for each PPL was randomized. Far-distance VA was recorded using three eye charts shown on a screen monitor (Asus LCD Monitor VP228HE 21.5”) located at 5.25 m. Each of the letters on each eye chart was separated from the other by an angle of 1°. To evaluate off-axis positions, participants were seated on top of a big rotating platform with a chin rest to prevent head motion and ensure that all participants were looking through the same area of the lens. Near-distance VA was assessed at 0.37 m using three eye charts for each gaze direction displayed on a screen (Microsoft Surface PRO 4, 12.3”). The angular separation between letters in the same eye chart was 6.4°. Off-axis gaze directions were evaluated by moving the screen to three different positions. To prevent head motion and ensure participants used the central and lateral regions of the PPL, a table with a chin rest was used.
Recordings were processed to calculate fixations using Tobii Pro Lab software (Tobii AB, Stockholm, Sweden) and the Tobii I-VT fixation filter [33,34]. The velocity threshold was set according to a pilot study on 10 emmetropic non-presbyopic participants with the same experimental set-up as in the present work. Participants were asked to look at 5 optotypes of 0.4 logMAR size at 5.25 m and 0.37 m. A velocity threshold of 40°/s was set for the near-distance VA task, and 6°/s was set for the far-distance VA task (Figure 2). To ensure the quality of the recordings, a data quality analysis was performed. The data quality of each recording was calculated as the number of time points in each recording for which valid gaze data was collected, divided by the number of time points in the recording. The data quality of each recording was computed as the percentage of valid gaze data points relative to the total number of points recorded. As in other studies requiring very good quality in data recording [21,35], we set a threshold for data loss of 10%. Those participants with all recordings and valid data of 90% or more were included in the study.
Statistical Analysis: All the statistical analyses performed in this study were carried out with Python 3.8.8 software using the statsmodels library [36]. A three-way repeated measures ANOVA was used to assess differences in eye movements depending on the eye chart size, gaze direction, and PPL design, both for distance and near-distance VA measurements. To evaluate differences in VA scores depending on the gaze direction and the PPL design, a two-way repeated measure ANOVA was performed. The level of significance was set at 0.05 and the statistical power at 0.8. A Tukey HSD post-hoc test was used to determine which means differ significantly from each other. The variables analyzed were VA, test duration, complete fixation time, and the number of fixations.

3. Results

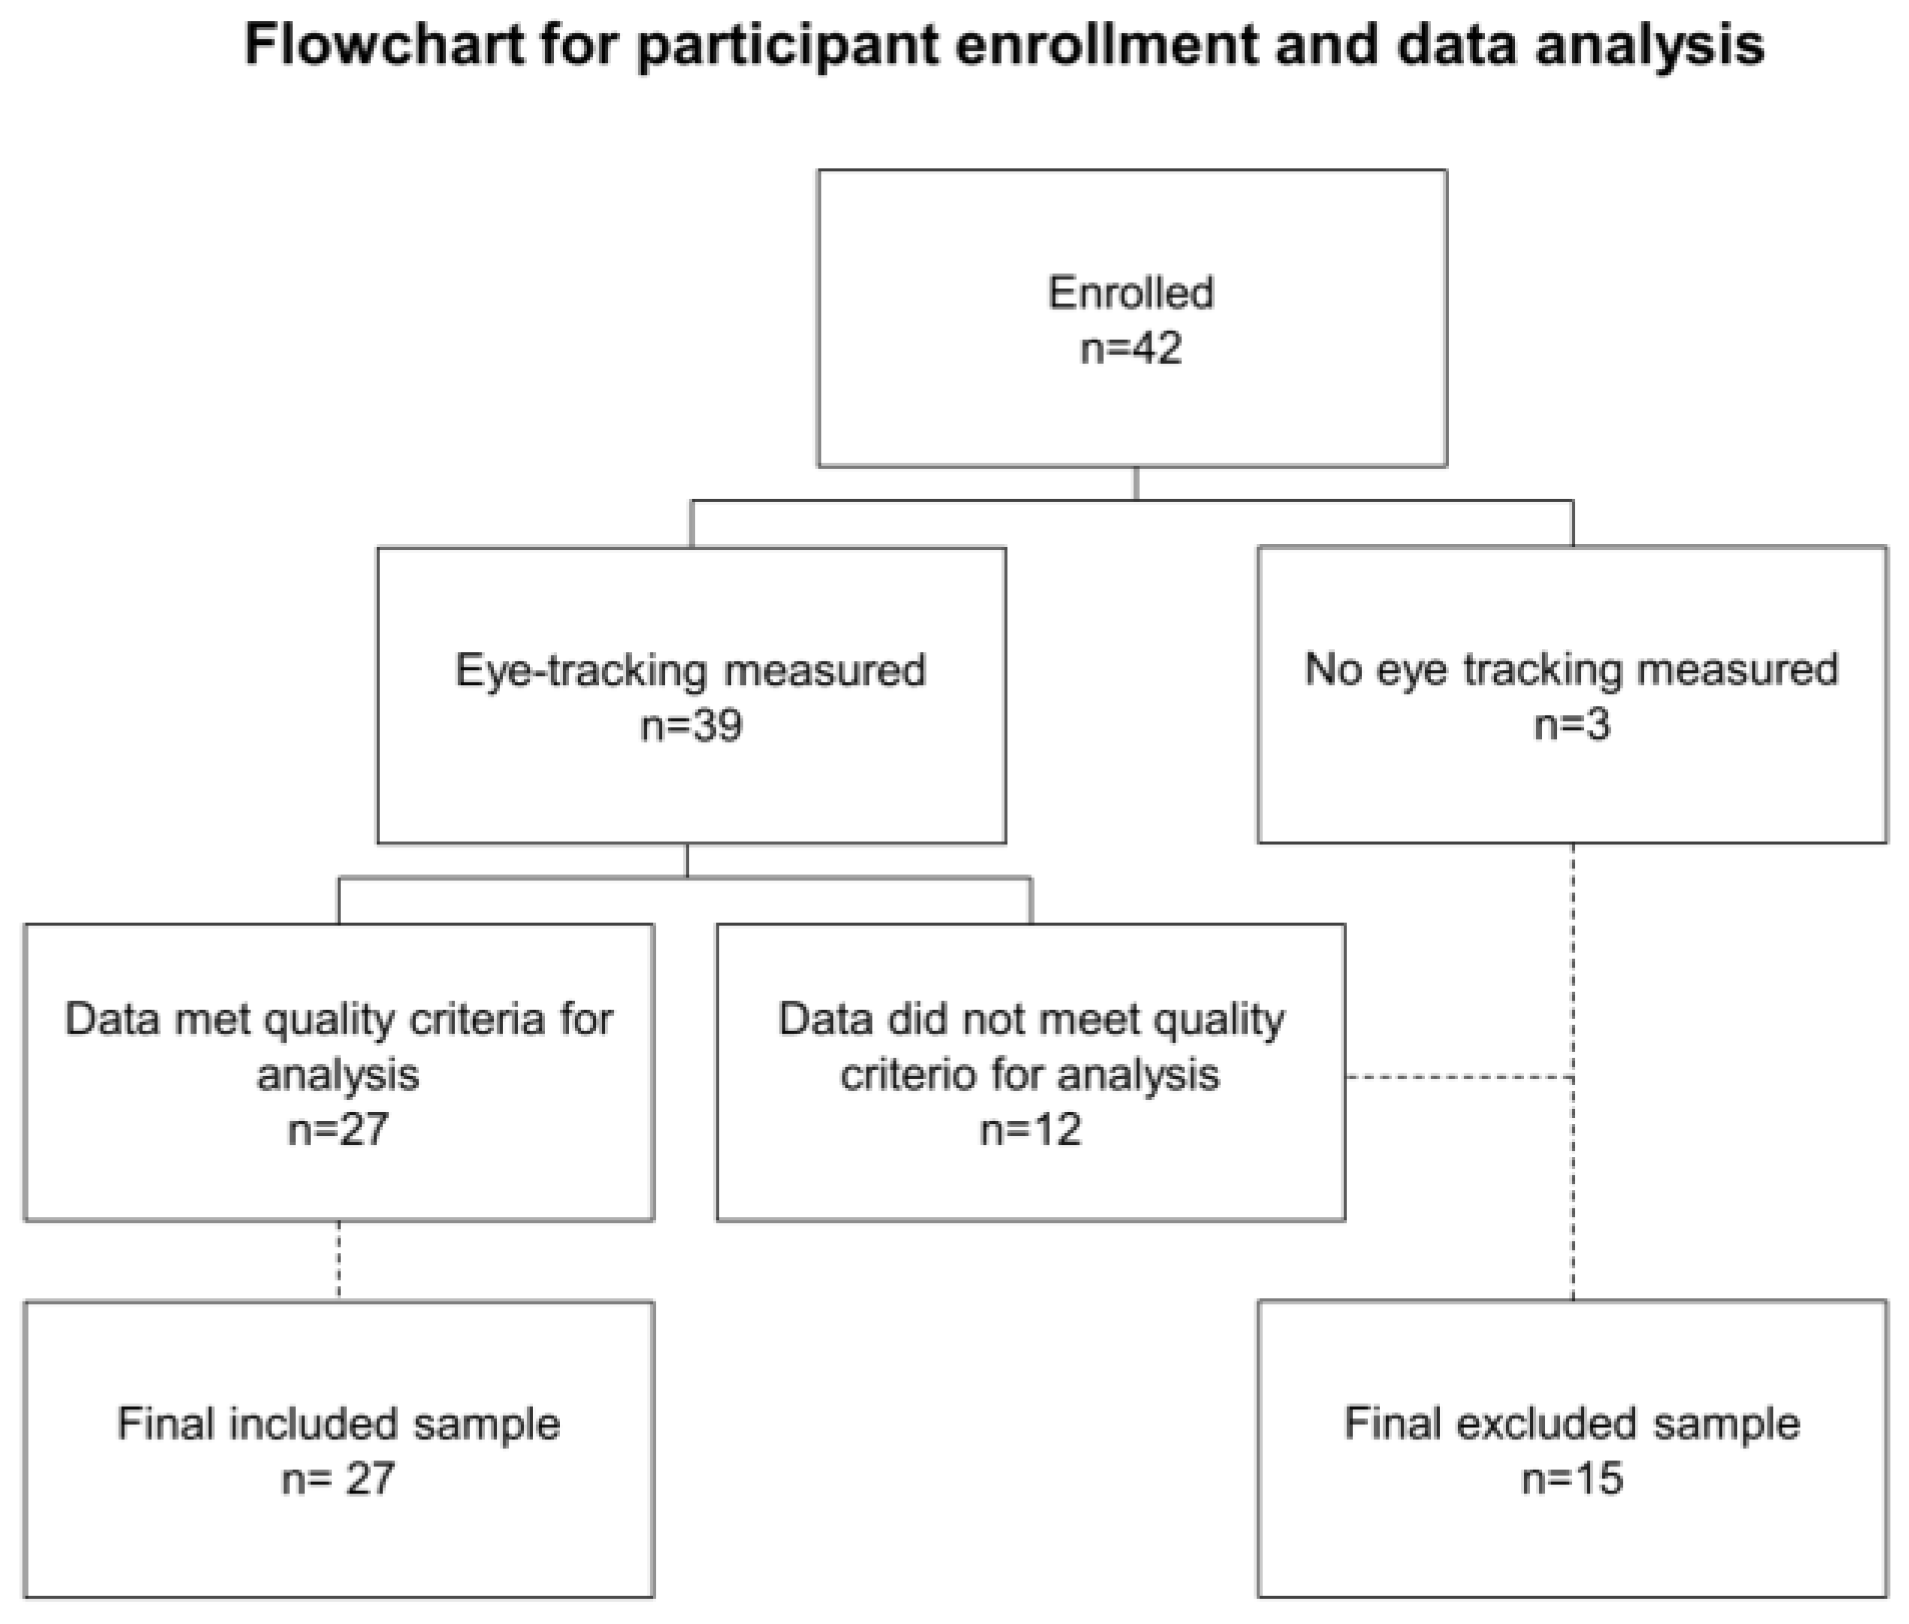
3.1. Sample Characteristics

A total of 42 subjects were enrolled in the study. Eye-tracking recordings were not attempted on 3 of them due to dry eyes (n = 1) and damaged lenses (n = 2). Eye-tracking recordings were collected from a total of 39 subjects; 13 of them did not meet the 90% valid data threshold for all recordings and were discarded from the data analysis (Figure 3). The final sample consisted of 27 subjects (15 men and 12 women), ranging in age from 44 to 65 years old (54 ± 6). The average mean refractive error of the participants was −0.8 ± 2.6 D (ranging from −6 D to +4.62 D). There were 12 myopic participants, 10 participants with hyperopia, and 5 emmetropic participants. The participants’ addition powers ranged from 0.75 D to 2.50 D, with an average of 1.9 ± 0.5 D. The average mean percentage of valid data was 99.6 ± 1.2 (ranging from 91.1 to 100) for far-distance VA recordings and 99.7 ± 1.1 (ranging from 90.8 to 100) for near-distance VA recordings.

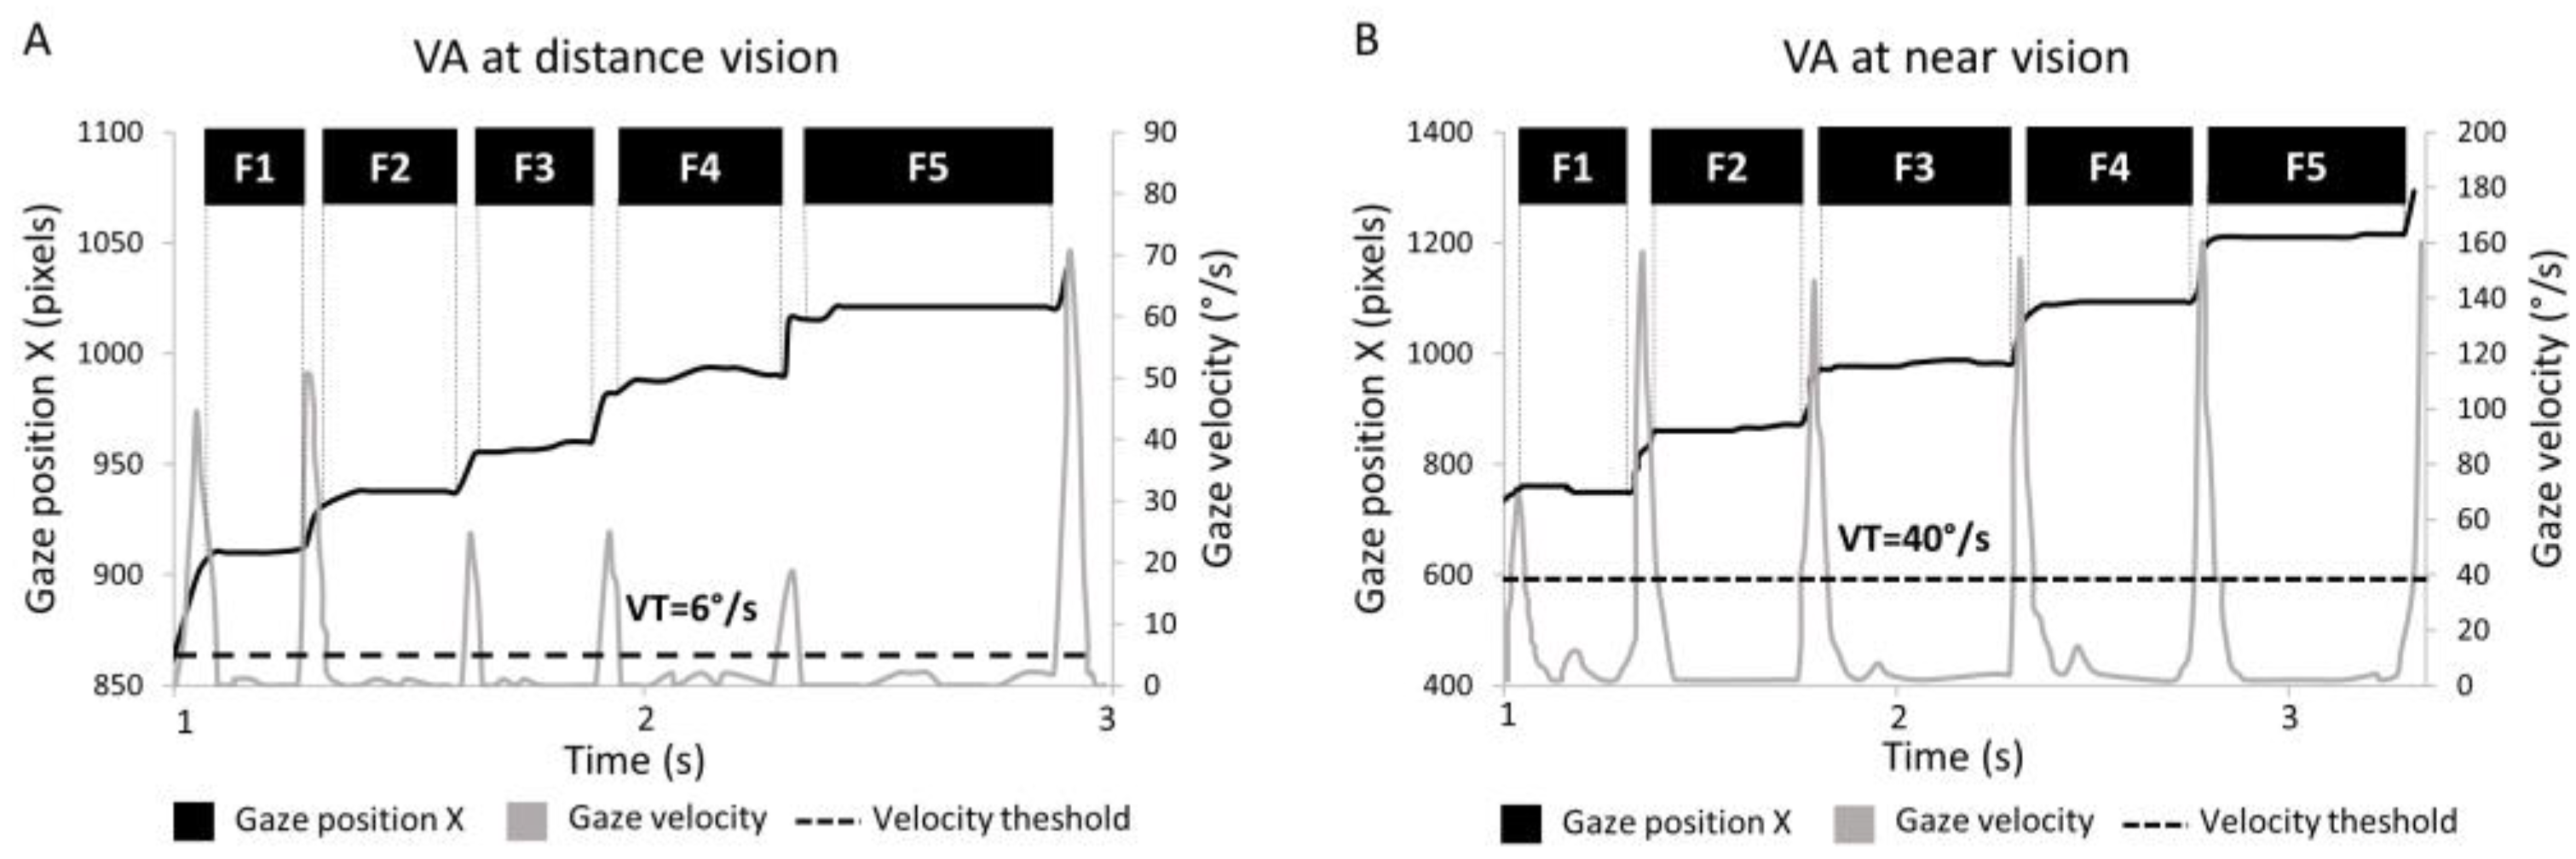
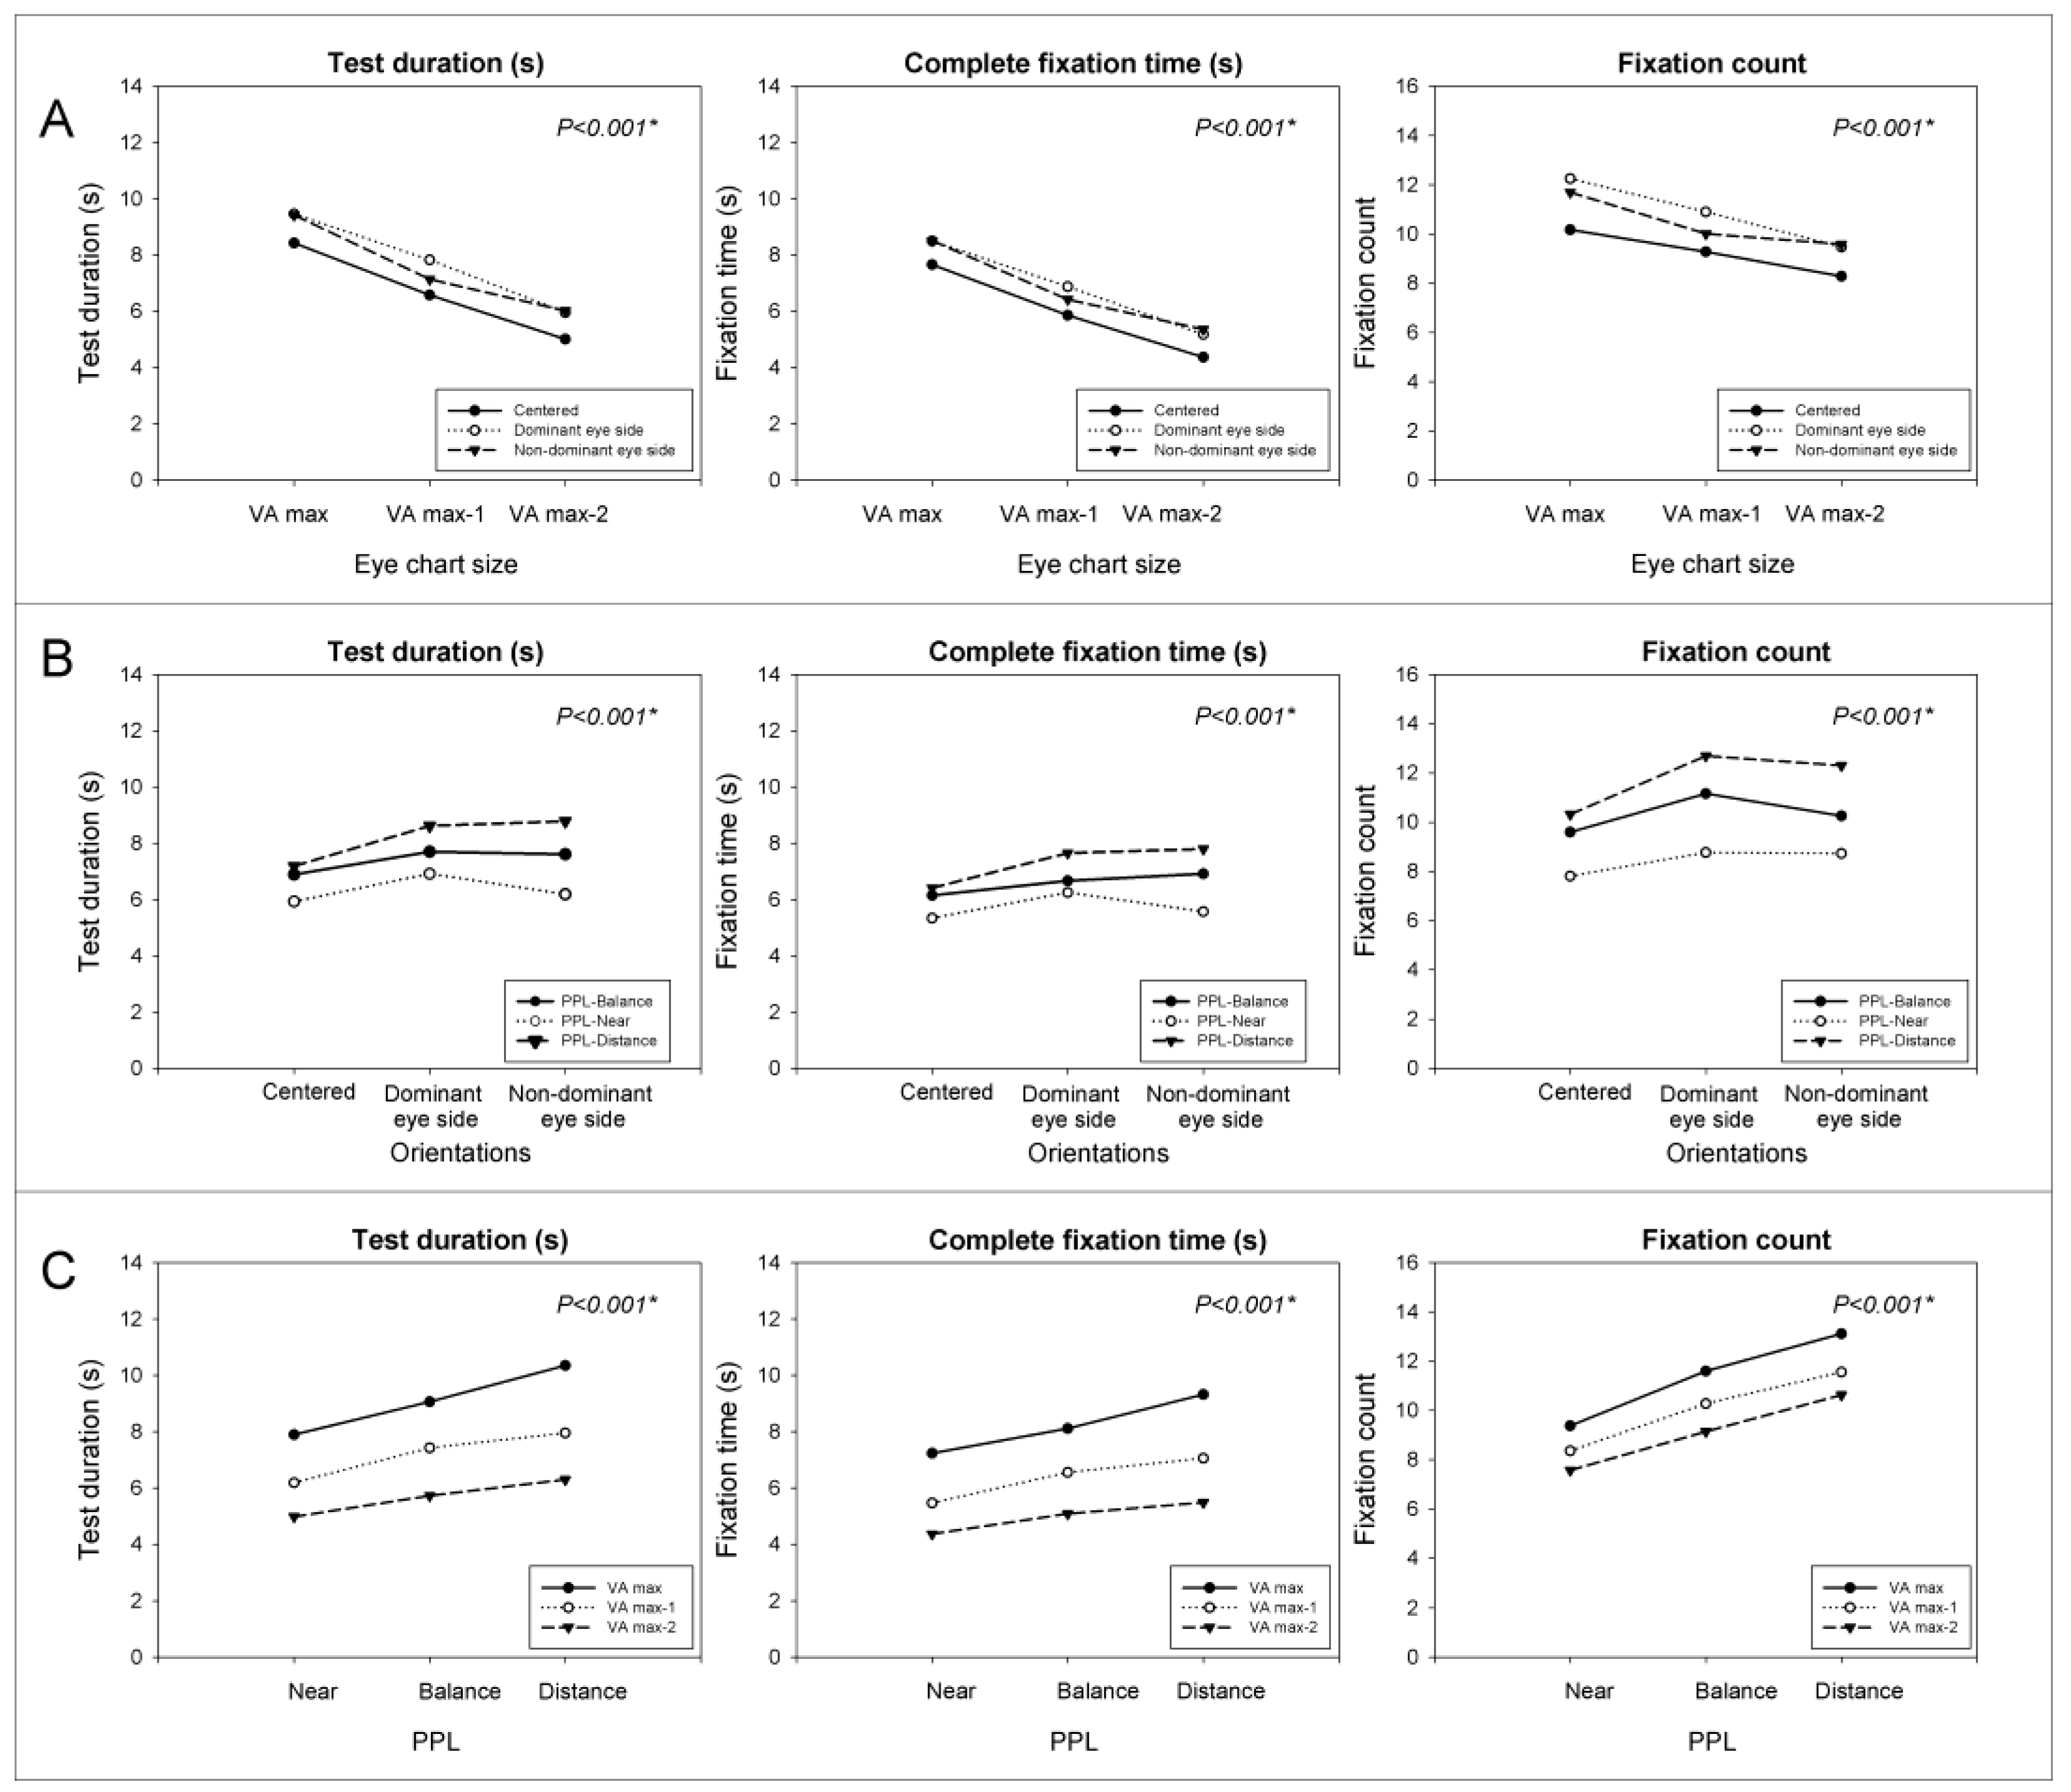
3.2. Far-Distance VA

The results showed no statistical differences in distance vision for VA between PPLs and gaze direction (Table 1).
However, statistically significant differences in eye movements were found for the three factors analyzed: eye chart size, gaze direction, and PPL design. No statistically significant interactions were found between the analyzed factors. For the eye chart size, it was expected that when the letter became smaller, the task difficulty increased, thus affecting the eye movements. The results confirmed that with a smaller optotype size, there was a statistically significant longer test duration, longer fixation time, and higher fixation count. Regarding the gaze directions, as the participant is forced to look through the lateral areas of the lens with blur, we would expect the increased recognition effort to affect eye movement. Statistically significant differences in longer test duration, longer complete fixation time, and a greater number of fixations were found for off-axis gaze directions relative to the central one. Finally, it was observed an effect of PPL design on eye movements. When the participants were using the PPL optimized for distance vision, statistically lower test durations, lower duration of fixations, and a lower number of fixations were found. (Figure 4 and Table 2).

3.3. Near-Distance VA

The results for near vision were similar to those for distance vision. No statistically significant differences for VA were found regarding PPL or gaze direction (Table 3).
However, eye-tracker data showed statistically significant differences for the three factors analyzed: eye chart size, gaze direction, and progressive lens design. No statistically significant interactions were found between factors. Smaller eye chart sizes resulted in longer test duration, longer fixation time, and more fixations compared to larger ones. Participants had more difficulty recognizing eye charts in off-axis gaze directions, resulting in longer test duration, complete fixation time, and more fixations compared to the central ones. Finally, regarding the PPL design, when participants used the PPL optimized for near vision, the results showed a reduction in test duration, total fixation time, and number of fixations compared to PPL-Balance and PPL-Near. (Figure 5 and Table 4).

4. Discussion

In this paper, we present a way of assessing the quality of vision provided by PPLs with different power distributions using an eye-tracking-based system during the VA measurement. It is important to note that VA is subjective and depends on the participant’s answer, whereas eye-tracking data is objective and provides quantitative data about eye movements, adding more information about the quality of vision with PPLs compared to the traditional VA evaluation method. The method proposed is based on the analysis of test duration, fixation time, and the number of fixations required to recognize the different optotypes of standard eye charts. The study showed that when evaluating the far-distance VA of participants using a PPL design with a wider far-distance visual area, the test duration, fixation time, and the number of fixations are reduced. Similarly, a PPL design with a wider near area provided a lower test duration, a lower fixation time, and a lower number of fixations during the evaluation of near-distance VA. It should be noted that the values of standard VA obtained with different PPL designs were not different with statistical significance.
Although VA is considered a gold standard for the evaluation of optical quality, it seems insufficient alone to evaluate the quality of vision [17]. It is well known that sometimes clinicians report patients with high VA complaining about poor vision quality. Specifically, regarding the performance of PPLs, several studies have tried to evaluate differences in VA between different PPL designs without success. Legras et al. [17] evaluated differences in VA at eight different off-axis positions on 20 presbyopic participants with two different PPL designs and did not find differences in VA between them. On the other hand, Han et al. [12] measured VA in the far and near regions in 95 presbyopic patients with a customized and a non-customized PPL design, and, once again, the results did not show differences in VA between both PPLs.
Additionally, having a method that can determine differences in the visual performance provided by different PPL designs could help lens designers develop better lenses. Based on previous studies, we presume that the evaluation of eye movements during the performance of a specific task could be a sensitive indicator of the quality of vision provided by these lenses. In another study, Han et al. [27] evaluated differences between single-vision lenses and PPLs on 11 presbyopes. The subjects were required to read aloud a copy of printed text placed along their midline at 0.60 m. Eye movements were analyzed using the ISCAN computer-based system. The results showed an increase in fixation numbers when participants used PPLs compared to single-vision lenses. On the other hand, the study from Concepcion-Grande et al. [28] recorded the eye movements of 38 presbyopes using the Tobii X3-120 eye tracking system while participants were using two different PPL designs. Participants were asked to read aloud a text displayed on a monitor screen at centered and off-axis gaze directions located at 0.67 m. The results showed greater fixation time and the number of fixations in off-axis gaze directions in comparison with the central position. Finally, the study from Concepción-Grande et al. [30] recorded eye movements using a Tobii Pro Glasses 3 device on 28 participants using different PPLs. Participants were asked to read the text at far and near distances. The results showed that fixation time and the number of fixations were affected by the PPL design. All of these studies showed statistically significant differences in eye movements associated with the unwanted refractive errors present in the lateral areas of the PPLs. However, all these methods are based on reading tasks whose difficulty could vary from one experiment to another. To eliminate this uncertainty, we have used, as a reading test, the standard eye charts that are used to evaluate visual acuity under the same standardized conditions in which VA is clinically measured. So, in this paper, we propose a simple way to enhance the gold standard evaluation of VA by incorporating new metrics based on the characteristics of eye movements. To our knowledge, this is the first time an eye-tracking system is used while measuring VA and while using different PPL designs, and this method has proven to be sensitive enough to identify differences between designs and gaze direction.
In this study, we also incorporated the analysis of two well-known factors that affect visual performance. Firstly, it is obvious that recognition difficulty depends on the eye chart size. In this sense, when the letter became smaller, the task difficulty increased. As expected, results confirmed that with a smaller optotype size, there was a statistically significant longer test duration, longer fixation time, and higher fixation count than eye charts with a larger optotype size. Secondly, it is well known that unwanted refractive results showed statistically significant longer test duration, longer complete fixation time, and a greater number of fixations for off-axis gaze directions in comparison with the central gaze direction.
Future studies could improve the experimental setup by incorporating changes that enable the evaluation of eye movements in a more natural setting. Currently, the assessment of far-distance VA involves using a 21.5-inch screen positioned 5.25 m away from the subject’s eyes, resulting in a narrow horizontal field of view of 4.2°. To assess a wider field of view, the subject must be rotated in three different gaze directions while using a chin rest to prevent head motion, which adds complexity to the experiment. Instead, a larger screen with a head tracking system would be a better alternative to the current rotation platform with a chin rest, as it would provide a wider field of view and eliminate the need for rotation. As explained in the flowchart for participant enrollment, 30% of participants were discarded because their recordings did not meet the quality criteria. It would be interesting to study the reasons for the data loss and account for them in future work and also to redefine a quality criterion that could be implemented in the optical practice without compromising the results.

5. Conclusions

In conclusion, the proposed eye-tracking method for assessing the quality of vision during a VA test can assess differences in test duration and eye fixation characteristics between PPL with different power distributions and is a more sensitive indicator of the quality of vision provided by the lenses than the standard VA evaluation. Although this method has been tested for the evaluation of the quality of vision provided by PPLs, it could be used in any other field in which the sheer capacity of letter recognition does not provide enough information about visual performance. Additionally, some examples could be the study of some visual conditions (i.e., cataracts) or specific visual tasks (i.e., night driving) in which the visual quality is reduced but the visual acuity does not decrease.

6. Patents

The results described in this manuscript have been the subject of a patent issued to José Miguel Cleva, Eva Chamorro, Pablo Concepcion-Grande, and José Alonso. The patent covers merit functions for lens optimization in which eye-tracker parameters describing visual performance are used, which is related to the research presented in this manuscript.

Author Contributions

Conceptualization, E.C. and J.M.C.; methodology, P.C.-G., E.C. and J.M.C.; formal analysis, P.C.-G., E.C. and J.M.C.; investigation, P.C.-G., E.C. and J.M.C.; data curation, P.C.-G.; writing—original draft preparation, P.C.-G.; writing—review and editing, J.A.G.-P., E.C., J.M.C. and J.A.; supervision, J.A.G.-P., E.C., J.M.C. and J.A.; project administration, E.C. and J.M.C. All authors have read and agreed to the published version of the manuscript.

Funding

The research was supported by Indizen Optical Technologies SL.

Institutional Review Board Statement

The study was conducted in accordance with the Declaration of Helsinki and approved by the Institutional Review Board of the Complutense University of Madrid (CE_20210715-3_SAL).

Informed Consent Statement

Informed consent was obtained from all subjects involved in the study.

Data Availability Statement

The data presented in this study are available on request from the corresponding author.

Acknowledgments

The authors acknowledge the support of Indizen Optical Technologies SL. They also thank the anonymous participants and the optometrists in charge of the measurements.

Conflicts of Interest

The authors of this work include P.C.-G., E.C., J.M.C. and J.A., who are all employees of Indizen Optical Technologies and have also authored the patent resulting from this research. The funders had no role in the study design, data collection, analysis, the decision to publish, or the preparation of the manuscript. The remaining authors do not have any conflict of interest to disclose.

References

  1. Millodot, M. Dictionary of Optometry and Visual Science E-Book, 7th ed.; Elsevier Health Sciences: London, UK, 2014. [Google Scholar]
  2. Raasch, T.W.; Lijuan, S.; Yi, A. Whole-Surface Characterization of Progressive Addition Lenses. Optom. Vis. Sci. 2011, 88, 217–226. [Google Scholar] [CrossRef] [PubMed]
  3. Alonso, J.; Gómez-Pedrero, J.A.; Quiroga, J.A. Modern Ophthalmic Optics, 1st ed.; Cambridge University Press: Cambridge, UK, 2019. [Google Scholar]
  4. Sheedy, J.E.; Campbell, C.; King-Smith, E.; Hayes, J.R. Progressive Powered Lenses: The Minkwitz Theorem. Optom. Vis. Sci. 2005, 82, 916–922. [Google Scholar] [CrossRef] [PubMed]
  5. Sheedy, J.E. Progressive addition lenses—Matching the specific lens to patient needs. Optometry 2004, 75, 83–102. [Google Scholar] [CrossRef] [PubMed]
  6. Sheedy, J.E. Correlation analysis of the optics of progressive addition lenses. Optom. Vis. Sci. 2004, 81, 350–361. [Google Scholar] [CrossRef]
  7. Arroyo, R.; Crespo, D.; Alonso, J. Influence of the Base Curve in the Performance of Customized and Classical Progressive Lenses. Optom. Vis. Sci. 2013, 90, 282–292. [Google Scholar] [CrossRef]
  8. Arroyo, R.; Crespo, D.; Alonso, J. Scoring of Progressive Power Lenses by Means of User Power Maps. Optom. Vis. Sci. 2012, 89, E489–E501. [Google Scholar] [CrossRef]
  9. Sheedy, J.E.; Hardy, R.F. The optics of occupational progressive lenses. Optom. J. Am. Optom. Assoc. 2005, 76, 432–441. [Google Scholar] [CrossRef]
  10. Boutron, I.; Touizer, C.; Pitrou, I.; Roy, C.; Ravaud, P. The VEPRO trial: A cross-over randomised controlled trial comparing 2 progressive lenses for patients with presbyopia. Trials 2009, 9, 54. [Google Scholar] [CrossRef]
  11. Mateo, B.; Porcar-Seder, R.; Solaz, J.S.; Dürsteler, J.C. Experimental procedure for measuring and comparing head–neck–trunk posture and movements caused by different progressive addition lens designs. Ergonomics 2010, 53, 904–913. [Google Scholar] [CrossRef]
  12. Han, S.C.; Graham, A.D.; Lin, M.C. Clinical Assessment of a Customized Free-Form Progressive Add Lens Spectacle. Optom. Vis. Sci. 2011, 88, 234–243. [Google Scholar] [CrossRef]
  13. Forkel, J.; Reiniger, J.L.; Muschielok, A.; Welk, A.; Seidemann, A.; Baumbach, P. Personalized Progressive Addition Lenses: Correlation between Performance and Design. Optom. Vis. Sci. 2017, 94, 208–218. [Google Scholar] [CrossRef]
  14. Selenow, A.; Bauer, E.A.; Ali, S.R.; Spencer, L.W.; Ciuffreda, K.J. Assessing Visual Performance with Progressive Addition Lenses. Optom. Vis. Sci. 2002, 79, 502–505. [Google Scholar] [CrossRef] [PubMed]
  15. Selenow, A. Progressive lenses: New techniques for assessing visual performance. In Vision Science and Its Applications; Optical Society of America: Washion, DC, USA, 2000; p. MD4. [Google Scholar]
  16. Habtegiorgis, S.W.; Rifai, K.; Lappe, M.; Wahl, S. Experience-dependent long-term facilitation of skew adaptation. J. Vis. 2018, 18, 7. [Google Scholar] [CrossRef] [PubMed]
  17. Legras, R.; Vincent, M.; Marin, G. Does visual acuity predict visual preference in progressive addition lenses? J. Optom. 2022. [CrossRef]
  18. Chamorro, E. Lens Design Techniques to Improve Satisfaction in Free-Form Progressive Addition Lens Users. J. Optom. 2018, 6, 91–99. [Google Scholar] [CrossRef]
  19. Villegas, E.A.; Artal, P. Visual Acuity and Optical Parameters in Progressive-Power Lenses. Optom. Vis. Sci. 2006, 83, 672–681. [Google Scholar] [CrossRef] [PubMed]
  20. Duchowski, A.T.; Duchowski, A.T. Eye Tracking Methodology: Theory and Practice; Springer: Berlin, Germany, 2017. [Google Scholar]
  21. Holmqvist, K.; Andersson, R. Eye-Tracking: A Comprehensive Guide to Methods, Paradigms and Measures, 2nd ed.; Lund Eye-Tracking Research Institute: Lund, Sweden, 2017. [Google Scholar]
  22. Hooge, I.T.C.; Niehorster, D.C.; Nyström, M.; Andersson, R.; Hessels, R.S. Fixation classification: How to merge and select fixation candidates. Behav. Res. Methods 2022, 54, 2765–2776. [Google Scholar] [CrossRef] [PubMed]
  23. Holmqvist, K.; Örbom, S.L.; Hooge, I.T.; Niehorster, D.C.; Alexander, R.G.; Andersson, R.; Benjamins, J.S.; Blignaut, P.; Brouwer, A.M.; Chuang, L.L.; et al. Eye tracking: Empirical foundations for a minimal reporting guideline. Behav. Res. Methods 2023, 55, 364–416. [Google Scholar] [CrossRef]
  24. Rayner, K.; Pollatsek, A.; Ashby, J.; Clifton, C., Jr. Psychology of Reading; Psychology Press: London, UK, 2012. [Google Scholar]
  25. Grisham, D.; Powers, M.; Riles, P. Visual skills of poor readers in high school. Optometry 2007, 78, 542–549. [Google Scholar] [CrossRef]
  26. Han, Y.; Ciuffreda, K.J.; Selenow, A.; Ali, S.R. Dynamic Interactions of Eye and Head Movements When Reading with Single-Vision and Progressive Lenses in a Simulated Computer-Based Environment. Investig. Ophthalmol. Vis. Sci. 2003, 44, 1534–1545. [Google Scholar] [CrossRef]
  27. Han, Y.; Ciuffreda, K.J.; Selenow, A.; Bauer, E.; Ali, S.R.; Spencer, W. Static Aspects of Eye and Head Movements during Reading in a Simulated Computer-Based Environment with Single-Vision and Progressive Lenses. Investig. Ophthalmol. Vis. Sci. 2003, 44, 145–153. [Google Scholar] [CrossRef] [PubMed]
  28. Concepcion-Grande, P.; González, A.; Chamorro, E.; Cleva, J.M.; Alonso, J.; Gómez-Pedrero, J.A. Eye movements as a predictor of preference for progressive power lenses. J. Eye Mov. Res. 2022, 15. [Google Scholar] [CrossRef] [PubMed]
  29. Rifai, K.; Wahl, S. Specific eye-head coordination enhances vision in progressive lens wearers. J. Vis. 2016, 16, 5. [Google Scholar] [CrossRef] [PubMed]
  30. Concepcion-Grande, P.; Chamorro, E.; Cleva, J.M.; Alonso, J.; Gómez-Pedrero, J.A. Correlation between reading time and characteristics of eye fixations and progressive lens design. PLoS ONE 2023, 18, e0281861. [Google Scholar] [CrossRef] [PubMed]
  31. Bailey, I.L.; Jackson, A.J. Changes in the clinical measurement of visual acuity. J. Phys. Conf. Ser. 2016, 772, 012046. [Google Scholar] [CrossRef]
  32. Ng, J.S.; Wong, A. Line-by-line visual acuity scoring equivalence with letter-by-letter visual acuity scoring. Clin. Exp. Optom. 2022, 105, 414–419. [Google Scholar] [CrossRef]
  33. Olsen, A. The Tobii I-VT fixation filter. Tobii Technol. 2012, 21, 4–19. [Google Scholar]
  34. Tobii Technology, A.B. Determining the Tobii I-VT Fixation Filter’s Default Values: Method Description and Results Discussion; Tobii® Technology: Danderyd Municipality, Sweden, 2012. [Google Scholar]
  35. Wass, S.V.; Forssman, L.; Leppänen, J. Robustness and precision: How data quality may influence key dependent variables in infant eye-tracker analyses. Infancy 2014, 19, 427–460. [Google Scholar] [CrossRef]
  36. Seabold, S.; Perktold, J. Statsmodels: Econometric and statistical modeling with python. In Proceedings of the 9th Python in Science Conference, Austin, TX, USA, 28 June–3 July 2010; pp. 10–25080. [Google Scholar]
Figure 1. Mean power, cylinder power maps distribution, and visual areas according to Sheedy’s criteria [6] for a Plano prescription, addition 2D with default parameters. (A) PPL-Balance. (B) PPL-Distance. (C) PPL-Near. Reprinted with permission from Ref. [30]. 2023, Concepcion-Grande et al.
Applsci 13 05059 g001
Figure 2. Fixation classification examples from a gaze position signal during VA test at distance vision (A) and near vision (B). The velocity threshold was set to allow the algorithm to recognize the five fixations corresponding to the five optotypes displayed on the screen (F1–F5).
Applsci 13 05059 g002
Figure 3. Flowchart for participant enrollment and data analysis.
Applsci 13 05059 g003
Figure 4. Variations in test duration, complete fixation time, and fixation count depend on the interactions of eye chart size and gaze direction (A), the gaze directions and PPL (B), and PPL and eye chart (C) for far-distance VA tasks. * Shows significance at the 0.05 level.
Applsci 13 05059 g004
Figure 5. Variations in test duration, complete fixation time, and fixation count depending on the interactions of eye chart size and gaze direction (A), the gaze directions and PPL (B), and PPL and eye chart (C) for near-distance VA task. * Shows significance at the 0.05 level.
Applsci 13 05059 g005
Table 1. Detailed statistics for visual acuity (VA) analysis at distance vision. Two-way repeated measures ANOVA.
PPL-Balance
VA (Mean ± SD)
PPL-Distance
VA (Mean ± SD)
PPL-Near
VA (Mean ± SD)
SSMSDfF-Ratiop-Value
−0.06 ± 0.06−0.06 ± 0.06−0.05 ± 0.070.0050.00222.2050.120
Centered
VA (Mean ± SD)
Dominant eye
VA (Mean ± SD)
Non Dominant Eye
VA (Mean ± SD)
SSMSDfF-Ratiop-Value
−0.06 ± 0.06−0.06 ± 0.06−0.05 ± 0.070.0040.00221.8330.170
Table 2. Detailed statistics for Figure 4. Three-way repeated measures ANOVA test with pos-hoc comparisons using Tukey HSD method. * Shows significance at the 0.05 level.
ANOVA Test for Eye Chart SizeTukey HSD Comparisons for Eye Chart Size (p-Value)
DfMean SquareF-Ratiop-ValueAVmax/Avmax-1AVmax/Avmax-2AVmax-1/Avmax-2
Test duration2725.67155.82<0.001 *<0.001 *<0.001 *<0.001 *
Fixation time2606.41361.16<0.001 *<0.001 *<0.001 *<0.001 *
Fixation count2628.89817.07<0.001 *<0.001 *<0.001 *0.1476
ANOVA test for gaze directionTukey HSD comparisons for gaze direction (p-value)
DfMean squareF-ratiop-valueCentered/dominantCentered/Non dominantDominant/Non
Test duration231.626.090.040 *0.0660.0790.996
Fixation time216.243.450.039 *0.1720.20690.995
Fixation count2252.4512.17<0.001 *0.003 *<0.001 *0.782
ANOVA test for lens designTukey HSD comparisons for lens design (p-value)
DfMean squareF-ratiop-valueBalance/DistanceBalance/NearDistance/Near
Test duration296.8713.82<0.001 *0.0660.065<0.001 *
Fixation time274.6214.86<0.001 *0.1630.031 *<0.001 *
Fixation count2211.798.18<0.001 *0.047 *0.331<0.001 *
Table 3. Detailed statistics for VA analysis at near vision. Two-way repeated measures ANOVA.
PPL-Balance
VA (Mean ± SD)
PPL-Distance
VA (Mean ± SD)
PPL-Near
VA (Mean ± SD)
SSMSDfF-Ratiop-Value
0.09 ± 0.090.09 ± 0.090.08 ± 0.090.0080.00421.1400.146
Centered
VA (mean ± SD)
Dominant eye
VA (mean ± SD)
Non dominant eye
VA (mean ± SD)
SSMSDfF-ratiop-value
0.08 ± 0.090.08 ± 0.080.09 ± 0.090.0040.00221.1500.330
Table 4. Detailed statistics for Figure 5. Three-way repeated measures ANOVA test with pos-hoc comparisons using Tukey HSD method. * Shows significance at the 0.05 level.
ANOVA Test for Eye Chart SizeTukey HSD Comparisons for Eye Chart Size (p-Value)
DfMean SquareF-Ratiop-ValueAVmax/Avmax-1AVmax/Avmax-2AVmax-1/Avmax-2
Test duration2722.4543.58<0.001 *<0.001 *<0.001 *<0.001 *
Fixation time2644.1947.40<0.001 *<0.001 *<0.001 *<0.001 *
Fixation count2312.5610.96<0.001 *0.040 *<0.001 *0.176
ANOVA Test for Gaze DirectionTukey HSD comparisons for gaze direction (p-value)
DfMean squareF-ratiop-valueCentered/dominantCentered/Non dominantDominant/Non dominant
Test duration278.879.19<0.001 *0.003 *0.024 *0.778
Fixation time258.057.94<0.001 *0.009 *0.021 *0.949
Fixation count2171.516.41<0.001 *0.007 *0.0730.687
ANOVA test for lens designTukey HSD comparisons for lens design (p-value)
DfMean squareF-ratiop-valueBalance/DistanceBalance/NearDistance/Near
Test duration2209.7313.71<0.001 *0.037 *0.003 *<0.001 *
Fixation time2150.0810.37<0.001 *0.045 *0.010 *<0.001 *
Fixation count2679.6227.38<0.001 *0.019 *0.001 *<0.001 *
Disclaimer/Publisher’s Note: The statements, opinions and data contained in all publications are solely those of the individual author(s) and contributor(s) and not of MDPI and/or the editor(s). MDPI and/or the editor(s) disclaim responsibility for any injury to people or property resulting from any ideas, methods, instructions or products referred to in the content.

