Article

A Theory of Slope Shear Scouring and the Failure Mechanism of PFC3D on a Gangue Slope

1
College of Environment and Civil Engineering, Chengdu University of Technology, Chengdu 610059, China
2
State Key Laboratory of Geohazard Prevention and Geoenvironment Protection, Chengdu 610059, China
3
Engineering Design & Research Institute of Sichuan University Co., Ltd., Chengdu 610065, China
*
Authors to whom correspondence should be addressed.
Appl. Sci. 2023, 13(8), 5066; https://doi.org/10.3390/app13085066
Submission received: 26 February 2023 / Revised: 19 March 2023 / Accepted: 11 April 2023 / Published: 18 April 2023

Abstract

:
In this paper, scouring shear failure theory is optimized based on the gangue slope near the thermal power field in Baiguo Town, Panzhou City, Guizhou Province. Based on the particle flow PFC (particle flow code) 3D fluid–solid coupling method, the scouring failure mechanism of ditch no. 5 of the gangue slope is comprehensively analyzed from the perspectives of the failure mode, displacement, motion track, and stress–strain. We consider the scouring shear theory in respect of (c, φ); this theory is dominated by two types of scouring intensity factors and can effectively explain the internal mechanisms of gully formation. The rainfall scouring failure of gangue slopes can be divided into four stages: (1) integral splash erosion and local pitting at the bottom of the slope; (2) erosion diversion and pitting in the slope; (3) the tributary–slope crest extension schist erosion stage; and (4) integral gully erosion and the landslide stage. The failure process is not only characterized by discontinuous failure but also occurs in the order of bottom–middle–branch–top. A three-section stepped effect is observed during the process in which the gangue is scoured and destroyed, which fully verifies the intermittent characteristics of the scouring and destruction of gangue slopes. During the whole process, the maximum displacement is concentrated at the top of the slope, and its proportions are as follows: top of the slope > tributary > middle of the slope > foot of the slope. The peak displacement of the slope crest in the horizontal Y-direction accounts for 41.76%, and that in the Z-direction accounts for 45.84%. Scouring deposits can be divided into the arc erosion deposit mode and the sector erosion deposit mode. Mainstream gullies primarily control whether deposits are characterized as arc or straight erosion deposits. The later stage of the second phase of scouring is the incubation period of the tributary gully. The large accumulation makes the stress at the bottom of the slope increase sharply, and the fluctuation value is between 2 and 6.8 MPa. The generation of the branch notch is mainly determined by X-direction stress, and 8.6 MPa is the critical stress. In efforts to prevent and control rainfall and landslide, the slope foot area should be preferentially protected, and the soil mass in the slope should be reduced to prevent the maximum energy fluctuation caused by scouring, so as to prevent significant displacement damage of the slope top.

1. Introduction

Gangue is the solid waste discharged during coal mining and washing. It refers to a black-gray rock with a low carbon content and a higher level of textural hardness than the coal associated with the coal seam during the coal-forming process [1]. There are now about 7 billion tons of gangue in China, and this value continues to increase year by year [2,3]. Gangue dumps discharged from mines are essentially formed by piling on the ground. There are more than 1600 gangue dumps formed by the long-term accumulation of gangue, and Guizhou accounts for about 65% of the country’s total output. The accumulation of gangue not only takes up a large amount of land resources but it also forms many gangue dump slopes [4,5]. The rainfall-induced instability of refuse hill slopes is one of the most dangerous features of refuse hill accidents, which affect the process of waste disposal and also threaten the lives and safety of on-site workers [6,7].
Guizhou is an area with a high incidence of hydrodynamic landslides. Many residents of the area live near gangue dumps. The rainfall scouring of gangue is likely to cause landslides, debris flows, and other geological disasters [8]. There is an urgent need to improve the monitoring and warning, comprehensive prevention and control, and emergency treatment of gangue hydrodynamic landslide disasters; among these issues, research into the intrinsic mechanisms of rainfall scouring damage is the most important. Under the action of rainfall scouring and seepage, gangue gradually produces deformation and destruction, forming large or small gullies, and stability also decreases continuously, finally leading to overall destabilization and destruction. At present, stability analysis of the high side slopes of gangue is an important research subject in geotechnical engineering, and the mechanisms whereby gangue gullies are formed have, until now, seldom been studied in any depth.
Many scholars have, from different perspectives, conducted theoretical analyses, numerical simulations, and model tests on the influence modes and mechanisms of rainfall infiltration on slope stability. Hurley et al. [9] illustrated the spatiotemporal evolution law of the groundwater level in slopes using a real-world example. Li Ning et al. [10] combined the visual geometry (VG) model of unsaturated soil with the modified Green–Ampt infiltration model, putting forward a simplified calculation model of a shallow landslide induced by rainfall. Chen Xiaodong [11] combined the rigid limit equilibrium method with the Mein–Larson infiltration model to establish a general model for the stability analysis of rainy slopes. Li Longqi et al. [12] studied the overall destabilization mode of the Zhulinggou landslide using PFC2D. It was concluded that the trailing edge of the slope is characterized by a creep pull-apart mode under the action of continuous rainfall, with the stress and displacement decreasing from the front edge to the rear edge as a whole. Li Shihai et al. [13] adopted the continuum–discontinuum element method (CDEM), taking the ground fissure of landslide mass as the basic parameter for analysis, and discussed the dynamic damage caused by landslide mass. Han Tingwen et al. [14] obtained slope stability and surface horizontal displacement variation data regularity under rainy conditions, taking into account groundwater and seismic forces. Wang Rubin et al. [15] carried out a numerical analysis of the seepage stability of landslide accumulation caused by rainfall infiltration under different conditions. Based on Richards’ equation and the finite element method, Tian Dongfang et al. [16]. discussed the influence of runoff recharge on the stability of rainfall-type landslides using a numerical example. Tong Xin et al. [17] analyzed the influence of rainfall infiltration on the stability of landslides with weak interlayers using the finite element method. Ye Tangjin et al. [18] carried out an experimental study on the destabilization mechanism of rolling-stone landslides under rainy conditions and derived a simple-step stability calculation formula for rolling-stone slopes under the conditions of rainfall infiltration. Wang Chenghua et al. [19] analyzed the non-orthogonal infiltration regularity of unsaturated sandy soils with the rainfall intensity, slope angle, and porosity ratio. Zeng Ling et al. [20] calculated one-dimensional seepage and the two-dimensional seepage process of rainy slopes using the finite element method. Shiau J et al. [21] proposed a study on the three-dimensional (3D) undrained slopes in anisotropic and heterogenous clay using advanced upper and lower bounds finite element limit analysis (FELA). Wittawat Yodsomjai [22] presents new plasticity solutions for the undrained stability of unsupported conical slopes in two-layered clays using an axisymmetric finite element limit analysis. Ho-Wen Chen et al. [23] analyzed climate change and landslides in Taiwan and put forward the combination of landslide warning models in the cumulative rainfall duration diagram with a rainfall intensity classification and an average rainfall intensity duration diagram with a rainfall intensity classification.
The mechanical analysis of rocks is also particularly important. Many scholars have conducted studies on the shear behavior of rocks and slopes, including simulations [24,25,26,27]. In addition, other scholars have focused on the characteristics of slope scouring [28,29], the mechanisms of gully erosion [30,31], and the impact factors of scouring [32,33,34,35]. Many scholars are committed to using continuous-medium methods (FEM, FDM, PFEM) in their research, but these methods have some drawbacks. In the process of calculation, it is often difficult to calculate convergence when plastic problems are encountered. In addition, continuous-medium calculation methods cannot effectively handle, calculate, or simulate dynamic movement and large deformation. The advantage of the PFC (particle flow code) is that it can simulate the material movement and stress transfer inside the soil body in a relatively simple way, as well as the deformation, expansion, and extension of the rock and soil body. The location and number of particles produced during sample failure, stress and strain in the sample, the shape of the soil deformation, and the strength of the model can be monitored. In this way, the mechanical testing of simulated soil material and model tests can be observed on the micro and macro scales. At the same time, the discrete element PFC method combines seepage with soil mass, considers the interaction between water and soil, and can dynamically evolve the large deformation characteristics of soil mass under the action of rainfall, as well as enabling micro-dynamic analysis. Therefore, the non-continuous discrete-element PFC is the most suitable method for determining the scouring mechanisms of gangue slopes. However, most scholars have not applied discrete-element technology to study the development and evolution of gullies, nor have they utilized a set of relatively mature shear-scouring theories. The fluid–solid coupling technology of the discrete element is not combined with this theory. Therefore, this research method is unique in the field of gangue slope studies. In this paper, we thus continue to optimize scouring the shear failure theory [36] and aim to explore the scouring failure mechanisms of gangue slopes by combining the PFC3D-improved fluid–solid coupling model.

2. Materials and Methods

2.1. Formula Improvement and Model Establishment

2.1.1. Improvement of the Rainfall Scouring Theory

Since scouring erosion mainly occurs during heavy rainstorms, the splash erosion caused by raindrops at the beginning of rainstorms is not included in this paper, only the scouring and penetration of the water flow in gully no. 5 on the slope surface are considered. The scouring and penetration model of gangue slopes is shown in Figure 1. In deriving the scouring theory, some scholars [37] consider the influence of cohesion c, while others [38] consider the influence of the internal friction angle, but the two factors have not been discussed further. In this paper, the two methods are combined to optimize the shear stress of particles attached to the flow, taking into account the change in the instantaneous velocity of particles in PFC particle flow.
It can be seen from the slope scouring phenomenon of viscous gravel soil that during a rainstorm, the flow pattern is turbulent. The flow is affected by soil particles on the slope and forms many vortices of different sizes. Their position, shape, and flow rate are constantly changing as they advance, and the shear stress of flow on the slope surface [39] is expressed as follows:
τ w = τ wa + τ wb
τ wa = - ρ v x v y
τ wa is the viscous shear stress in the laminar flow. τ wb is the turbulent shear stress. ρ is the density of the water flow, and v x and v y are fluctuating velocities in the X- and Y-directions, respectively, as shown in Figure 1. Defined by the pulsation velocity, it can be seen that:
v x = v x 0   v ¯ x v y = v y 0   v ¯ y
where v x 0 and v y 0 are instantaneous velocities of soil particles and   v ¯ x and VY are the average velocities of water flow. Due to the fast flow rate of scouring, according to the relationship between the flow rate and seepage rate, the pulsating seepage speed in the Y-direction can be expressed as:
v y = v x ξ = ( v x 0   v ¯ x ) ξ
where ξ is the effective porosity between particles. From Planter’s hypothesis and the Nikuradse hydraulic roughness test, it can be concluded that:
τ wb =   v ¯ x 2.5 ln R Δ x + 4.75 2 ρ
where R is the hydraulic radius, and Δ x is the spacing between Section 1 and Section 2 on the slope. Formulas (2)–(5) can be substituted for Formula (1) to obtain:
τ w =   v ¯ x 2.5 ln R Δ x + 4.75 2 ρ ( v x 0   v ¯ x ) 2 ξ ρ = ρ   v ¯ x 2.5 ln R Δ x + 4.75 2 ξ ( v x 0   v ¯ x ) 2
For rock and soil slopes, the scouring capacity of the slope surface should account for the scouring strength of the water flow. At the same time, the influence of the internal friction angle of the soil particles should be given priority in the analysis. Considering the internal friction angle, the bed washout rate g p can be expressed as:
g p = 0.015 ρ c gq s J 0.5 τ w + τ c τ w tan φ cos θ
q s = h c n R 2 3 J 1 2
τ c = γ h c J
where ρ c is the density of soil particles on the slope surface and q s is the flow rate per unit width; the Manning coefficient n = 0.025 is used. The hydraulic radius R = h c ; J = sin 45 ° = 0.706 . τ c is the critical pulling force. γ is the weight of water and is usually taken as 1 × 10⁴ N/m3. h c is the slope runoff depth. φ is the internal friction angle of the soil and θ is the gradient.
According to the continuous equation of soil particles on the slope, it can be seen that:
g p x + ρ c g y t = 0
where ρ c is the dry density of soil particles:
ρ c = ρ c 1 ξ
We differentiate Equation (10) to obtain the difference equation:
Δ g p Δ x + ρ c g Δ y Δ t = 0
It is assumed that the scouring depth obtained by the above method is Δ y 1 , considering the φ factor. Furthermore, the total scouring depth Δ y at Δ x spacing is:
Δ y = Δ y 1 + Δ y 2
where Δ y 2 is the scouring depth considering cohesion factor c. According to the progressive scouring strength of the entry–exit section, solution (12) can be obtained as follows:
Δ y 1 = Δ g p Δ t ρ c g Δ x = g p 2 g p 1 Δ t ρ c g Δ x
We substitute Formulas (7)–(9) into Formula (14) to obtain:
Δ y 1 = ω 1 τ w 1 1 τ w 2 Δ t Δ x
ω = 0.015 q s J 0.5 τ c 0.6 tan φ cos θ
In this equation, ω is the scouring coefficient, which is related to the water depth of the slope’s surface, the inclination angle of the slope body, and the friction angle of the soil body. τ w 1 and τ w 2 are the flow shear stresses of Section 1 and Section 2, respectively. Equation (15) is simplified to:
Δ y 1 = k 1 Δ t
k 1 = ω 1 τ w 1 1 τ w 2 1 Δ x
where k 1 is defined as a type I scouring intensity factor, which represents the thickness of the soil layer eroded by the water flow per unit of time, and is related to the internal friction angle φ and the slope position Δ x .
The c-value cannot be neglected when considering certain highly cohesive soils. In this situation, the scouring stress of runoff on soil particles on the slope surface is the sum of the impact-induced stress and flow shear stress, which is expressed as follows:
σ ω + τ w = ρ   v ¯ x 2 + ρ   v ¯ x 2.5 ln R   d ¯ + 4.75 2 ξ ( v x 0   v ¯ x ) 2  
  k 2 is defined as a type II scouring intensity factor. It is defined as the thickness of the soil layer eroded by the water flow per unit of time, taking into account the cohesion c between soil particles.
  K 2 = ω c σ ω + τ w  
In this equation, c is the cohesion of the soil, σ ω is the impact stress of water flow on soil particles, and ω is the erosion coefficient, which is the rate at which the cohesion of soil particles decreases to the critical stress of scouring under the action of water flow penetration per unit of time; it is a function related to soil characteristics that reflect the sensitivity of soil scouring erosion. By combining the scouring test with the fitting of the first pot global optimization algorithm, the following conclusions can be drawn:
ω = 0.01 cKB 2.3 sin θ μ   + 0.759  
where B is the compactness of the slope. The permeability coefficient K is:
K = 86.4 q s / h c
Then, we consider:
ω = 0.864 cq s B 2.3 sin θ   d ¯ + 0.759
By substituting Equation (23) into Equation (20), we obtain:
k 2 = 0.864 cq s B 2.3 sin θ + 0.759   d ¯   d ¯ c σ ω + τ w 1 + τ w 2 2
Δ y 2 = k 2 Δ t
Finally, according to the above formula, an expression for the scouring depth at any position of soil mass with a time variation can be obtained as follows:
Δ y = Δ t 0.025 q s J 0.5 τ c 1 τ w 1 1 τ w 2 tan φ cos θ Δ x + 0.864 cq s B 2.3 sin θ + 0.759   d ¯   d ¯ c σ ω + τ w 1 + τ w 2 2 τ w ( 1 , 2 ) = ρ   v ¯ x 2.5 ln R   d ¯ + 4.75 2 ξ ( v x 1 , 2   v ¯ x ) 2

2.1.2. Case Data

In this paper, we take the gangue slope near the Panzhou Electric Field in Guizhou Province, China, as an example. According to on-site reconnaissance, the upper lithological layer in the study area is black gangue with a loosely structured Quaternary Holocene artificial accumulation layer (Q4ml). The lower layer is grey-white limestone of the Lower Triassic Yongning Town Formation (T1yn) with an occurrence of 70–75 degrees and 40–45 degrees. Coal gangue piles in the tailings dam reservoir area are mainly located in the left tail slope area of the dam area, with a total area of about 670,000 m3 (as shown in Figure 2). The top elevation of the coal shale slope is about 1710 m, the height is about 40–60 m, and its slope is 25–40 degrees. It belongs to an unstable slope. It constitutes a major safety hazard to the ash yard and residential buildings under the hill. It can be seen that the lithology of the slope mainly comprises the manual accumulation of gangue with a very loose structure, especially at the corner of the slope (the red area in Figure 2). Under the scouring of rainwater, rainwater collects along the slope on both sides at the natural gully of the corner, forming the largest gully (no. 5) with a width of 3–10 m, a length of about 90 m, and a depth of up to 7 m (see Figure 3). The main focus of this study is the area near gully no. 5 at the corner of the accumulation body.

2.1.3. PFC Principle

The particle flow code (PFC) method is based on the mechanics of discontinuous media and is a mesoscopic discrete element method. This method defines the material as a particle assembly composed of finite particles, which are rigid bodies with a three-dimensional mass and spherical particles. Fine particles and different contact points on each particle have the characteristics of discontinuity. The particle flow method is mainly applied to scientific research on basic problems such as the basic characteristics of geotechnical materials and the material dynamic response. In the PFC3D numerical simulation, the constitutive relationship is the contact force–displacement relationship, the motion equation follows Newton’s second law, and the contact between particles is determined by the given contact model. In this paper, the contact model is a parallel bond model.

2.2. Clump Model of Gangue and Analysis of Its Meso-Parameters

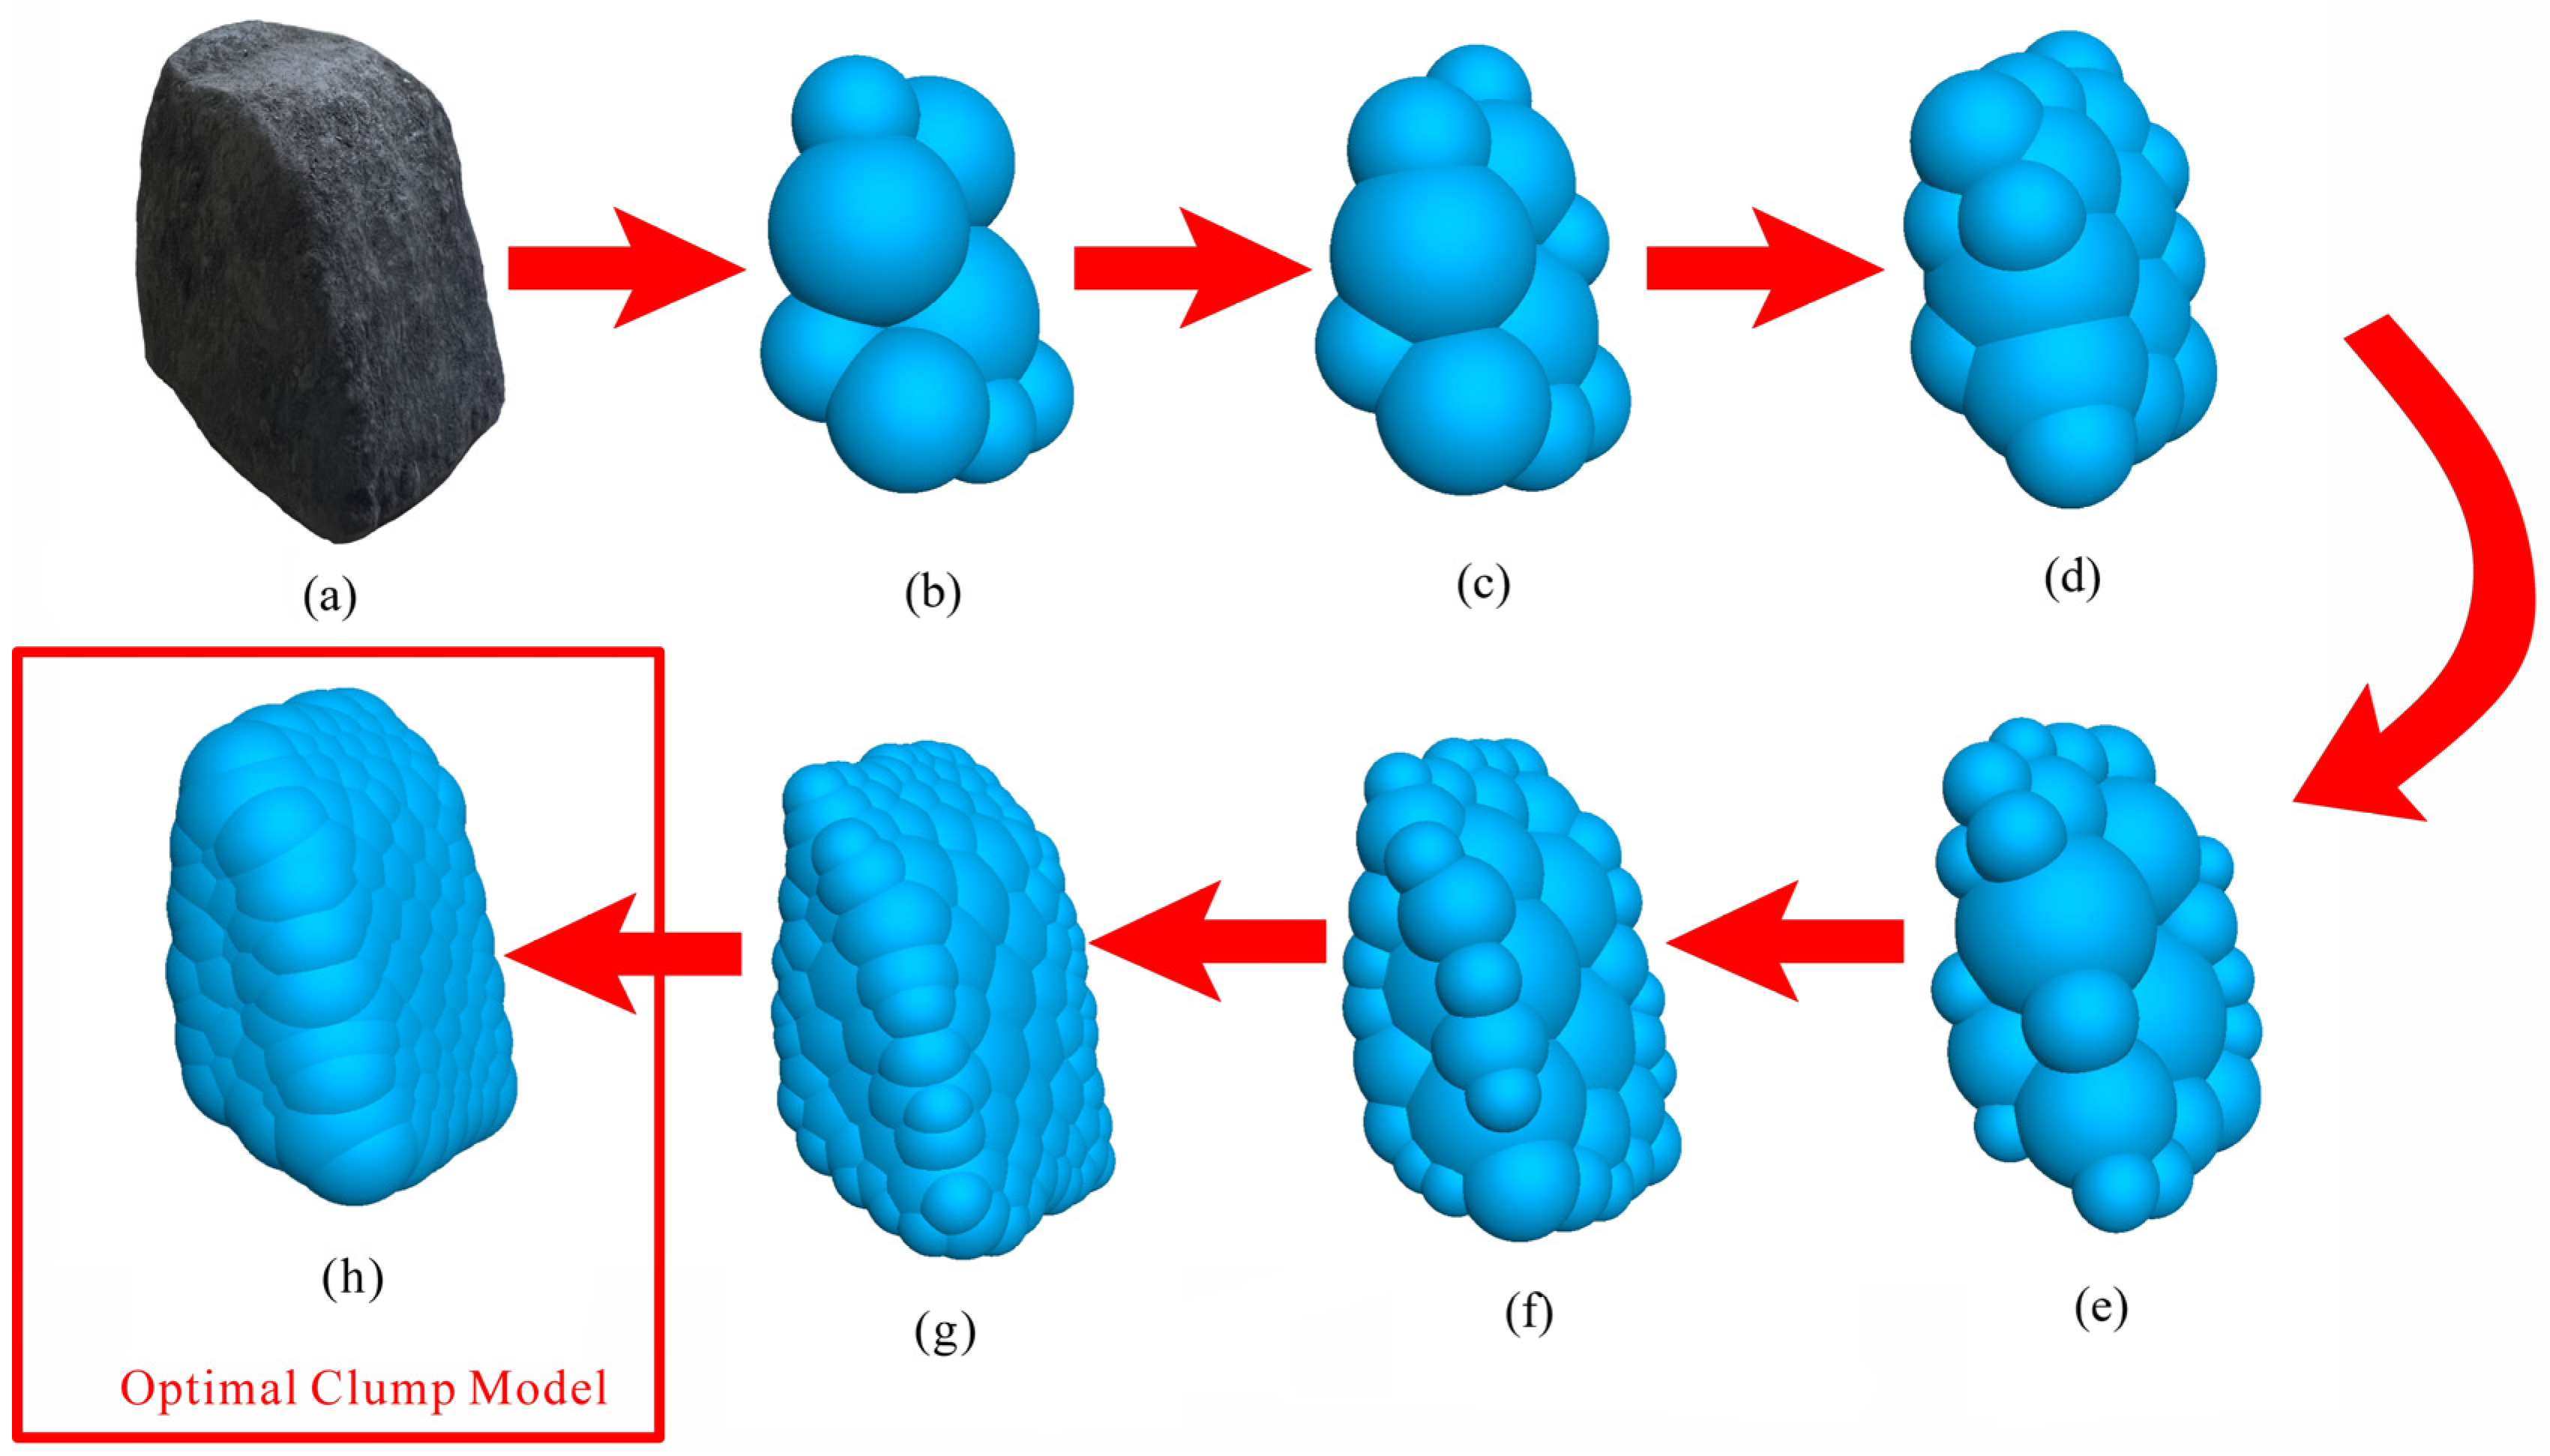
2.2.1. Simplified Model of Gangue Clump

The literature [40] shows that the appearance of gangue blocks is extremely irregular, with certain elongations and flat areas, which leads to an obvious biting action and stress concentration between gangue blocks. In order to simulate this characteristic of gangue as far as possible, and to improve the calculation efficiency, we use the basic unit “Ball” in PFC3D software to simulate particles in bulk materials such as crushed gangue, coarse-grained soil, and non-sticky sand. However, a ball is a rigid body with a rounded surface, which cannot simulate the biting action, stress concentration, and fracture between particles. Therefore, based on the clump command in PFC3D and two real shapes of a gangue block (block and sheet), a three-dimensional numerical model is simulated. First, it is imported into PFC3D using the geometry import command, which provides an enclosed restriction space for the generation of a gangue block in PFC3D. Then, the Pebble unit is used to fill the target restricted-space area. During the filling process, the Pebble continuously adjusts its radius and position in the filling area, according to the BubblePack algorithm, until the error between the filled volume of Pebbles and the target restricted-space volume is less than the set threshold, stopping filling and completing the generation of the clump aggregate. The final generated clump templates of the two shape categories of waste rock blocks and their shapes’ characteristic parameters are shown in Figure 4 and Figure 5. “Ratio” and “distance” are the two key words used in the BubblePack algorithm to control the effect of clump generation. “Ratio” controls the ratio of the Pebble’s minimum radius to the maximum radius used to generate the clump template, ranging from 0 to 1.0; “distance” controls the smoothness of the clump template generation, ranging from 0 to 180. The larger the value, the smoother the surface of the clump generated. When the value is 0, only point contact, with no overlap, is allowed between the PBBs used to generate the clump. When the value is 160, the PBBs used to generate the clump are allowed to overlap completely. From Figure 4 and Figure 5, it can be seen that when ratio = 0.5 and distance = 160, the clump template generated by the BubblePack algorithm not only restores the original appearance of the gangue block, but it also takes into account the basic external shape and calculation efficiency of the gangue block; therefore, this method was adopted.

2.2.2. Comparative Analysis of Triaxial Tests

In this study, a triaxial test was used to reasonably adjust the mesoscopic parameters of the PFC model. Rock samples were taken from the coal gangue slope near the Panzhou Electric Field in Guizhou Province, China, and an analysis was carried out using an SJ-IA mechanical testing system. The coal gangue sample was cut and polished to ensure that the test piece met the required accuracy. The test piece was a cylinder with a diameter of 50 mm and a height of 100 mm, and the error range was controlled within ±2 mm, as shown on the left of Figure 6.
For the simulation study of particle flow, the key condition to determine the rationality of the model is the selection of the model’s meso-parameters. The micro-parameters of a material cannot be directly assigned by real macro-mechanical parameters, so they need to be adjusted using an equivalent comparative test to ensure that the material’s behavior is close to the real effect. In this study, a large number of repeated triaxial tests were carried out by continuously changing the micro-parameter settings. At the same time, the numerical model of gangue specimens was established based on the servo principle of the PFC3D triaxial test; additionally, the stress–strain comparison analysis and micro-parameter calibration of the gangue were carried out. Finally, the appropriate micro-parameters were determined, as can be seen on the right of Figure 6. The model generates particles in the cylinder wall with a diameter of 5 m and a height of 10 m according to real triaxial testing. Considering the influence of the particle size effect on the test results [41], for a ratio of model size to average particle size >30, the appropriate change in the particle size does not affect the simulation results but it will improve the calculation efficiency. The particle size distribution of the PFC is shown in Table 1. The model established in this paper was repeatedly checked and adjusted. The average particle size is 1.9 m, the ratio of the minimum slope model size (66 m) to 1.9 m is 37, and the ratio of the maximum model size (160 m) to 1.8 m is 89. These ratios are much larger than the standard value of 30, so the particle size values in this model are reasonable. The three-axle confining pressure was loaded according to the values of 100 KPa, 200 KPa, and 300 KPa from the laboratory test.

2.2.3. Calibration of the Meso-Parameters of Gangue

The trend in the stress–strain curves is the key to determining the relationship between the meso-parameters and macro-parameters; this is also the micro-parameter calibration method adopted by most scholars. On this basis, the stress–strain curves were obtained, as shown in Figure 7. Compared with the indoor triaxial test, the trends of the two stress–strain curves obtained from the numerical triaxial test under the same ambient pressure are essentially the same as those of the indoor test, and the peak deviation stress error of the gangue is largely maintained within the range 0~1 KPa.
In terms of the mechanical properties, we added the attenuation value and attenuation coefficient of two kinds of coal gangue as reference factors to enrich the mesoscopic parameter calibration index so that the macro effect reflected by the final parameters is closer to that of the real material. This further reflects the brittleness of the coal gangue material. In this paper, we quote a mechanical index and a rock strength attenuation coefficient, which were proposed by Peng Jun et al. [42], to characterize the post-peak strength attenuation behaviors of rock samples. The specific algorithm is:
D s = σ 1 P σ r σ 1 P = Δ σ σ 1 P
Δ σ = σ 1 P σ r
where D s is the strength attenuation coefficient with a value range of [0, 1], Δ σ is the strength attenuation value, σ 1 P is the peak strength, and σ r is the residual strength.
According to Formulas (27) and (28), the attenuation value and attenuation coefficient of the gangue were calculated as shown in Figure 8. It can be seen that with the increase in the confining pressure, the attenuation value of gangue strength will gradually increase, but the attenuation coefficient will decrease with the increase in the confining pressure, so the brittleness will gradually decrease. It is determined that the confining pressure of 100 KPa~300 KPa characterizes a process of gradually weakening ductility development for the gangue. Although brittleness gradually decreases, from the trend of the increasing intensity attenuation value, the brittleness of the gangue increases. This is because the internal particle structure distribution of the gangue is looser than that of general rocks, and there are differently sized gangue particles. Small gangue particles are tightened first, which weakens the brittleness. The brittleness is enhanced by contact within a large-sized gangue. Between 100 KPa and 300 KPa, the inner part of the gangue is characterized by the contact shrinkage process of a small-sized gangue, so its brittleness is gradually smaller. The error of the attenuation value is controlled within 10 KPa, and the error of the attenuation coefficient is controlled within 0.025; both parameters are within a reasonable error range.
In conjunction with Table 2, which shows the macro-mechanical parameters obtained from numerical triaxial tests, it can be concluded that the macro-mechanical characteristics of the micro-mechanical parameters in this numerical triaxial test are essentially consistent with those of the laboratory test. In conclusion, the micro-parameters tested via the numerical triaxial test show that the macro-mechanical properties have a certain degree of reliability and that the PFC materials are available. The calibration values of the PFC micro-parameters are shown in Table 3.

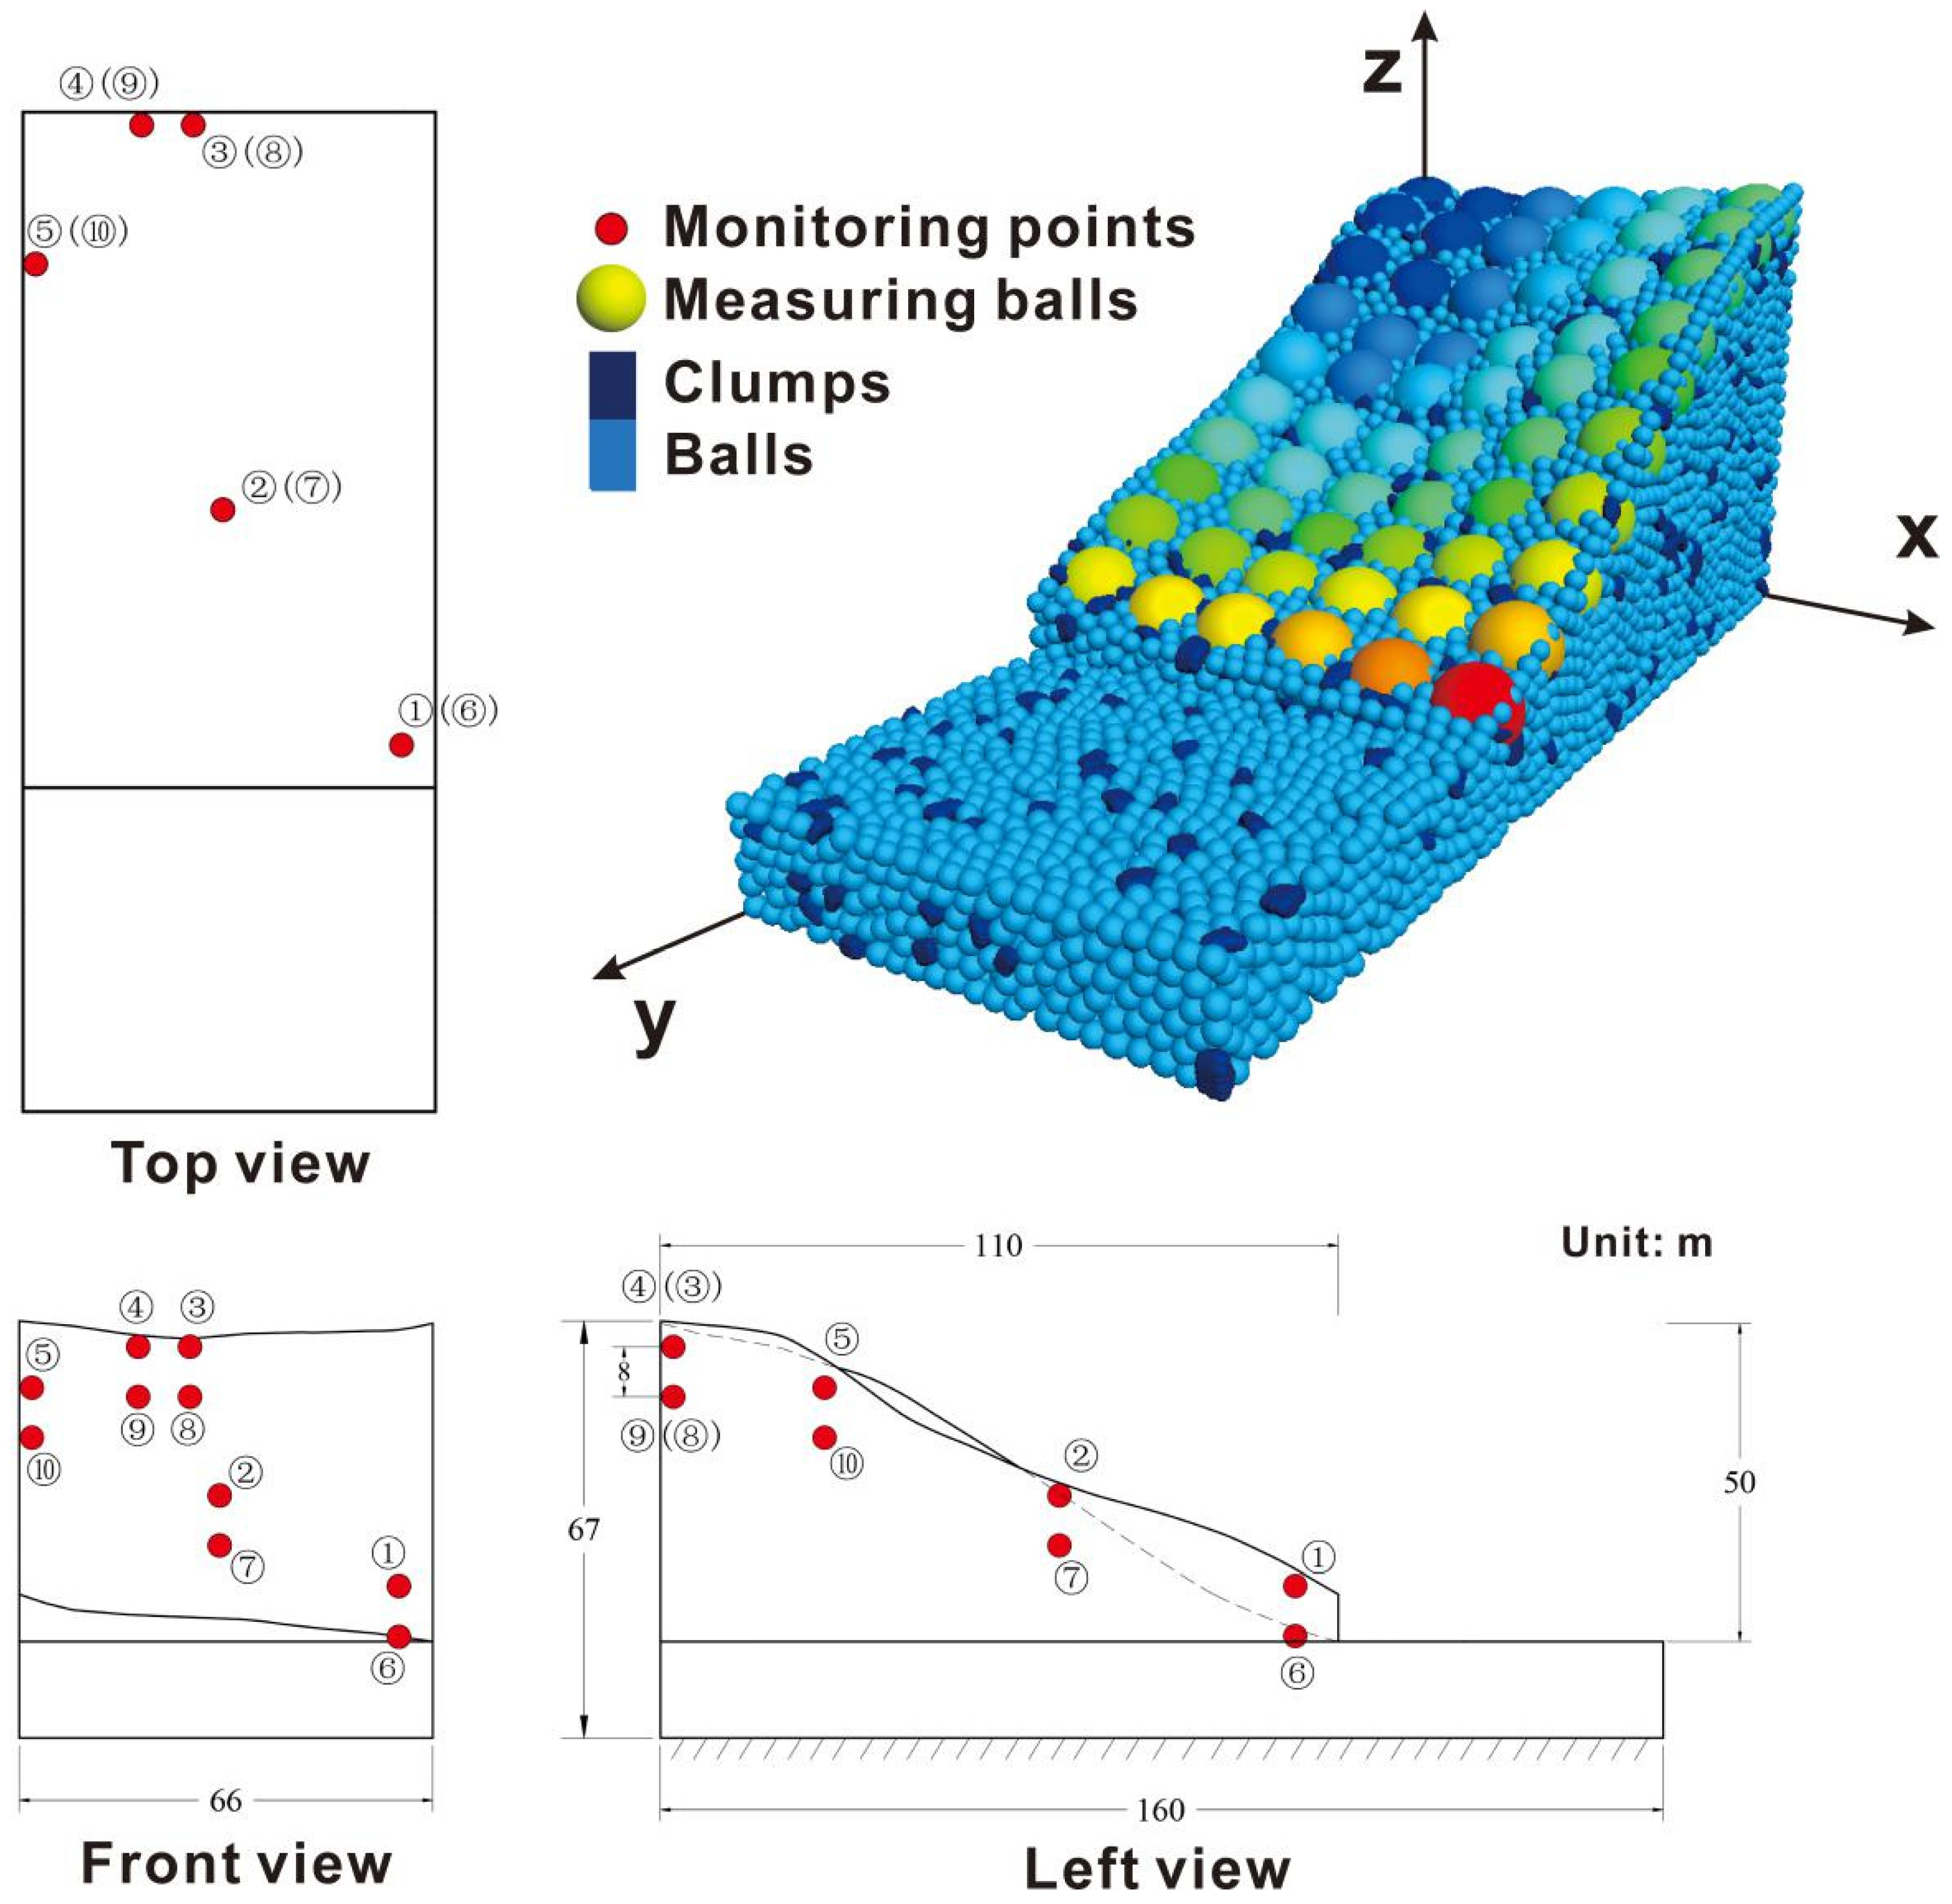
2.2.4. Clump Model of Gangue Slopes

(1) Monitoring points and measuring balls.
Based on the above research, we designed a PFC gangue slope model with a size of 160 × 66 × 67 m (length × width × height); the total number of clump models was 71,971, as shown in Figure 9. The monitoring of the calculated data shown in this paper was mainly realized using a measuring ball and a monitoring point. A measuring sphere with a radius of 5.5 m was set and evenly distributed over the entire slope surface to monitor the real-time changes in the stress and strain values of the soil mass across the entire slope surface. Regarding the monitoring points, based on the damage at the no. 5 gully site, monitoring points were set at the top, middle, and lower surfaces (monitoring points 1, 2, 3, and 4) and side surfaces (monitoring point 5). In order to explore the scouring depth, one vertical monitoring point was set at 8 m below each surface-level monitoring point. There were 10 monitoring points in total, so the layout can accurately monitor the displacement of the gully position and the change in the movement track.
(2) Fluid–solid coupling model.
When setting up the fluid–solid coupling model, the flow field was simulated as a fluid module, as shown in Figure 10. Many stability tests were carried out on the model to ensure that the imbalance force between particles was less than 10–5 N before the application of fluid. For the convenience of a later analysis, the slope area was divided into four areas: A, B, C, and D (catchment areas A and C; scouring area B; and permeation area D). In order to achieve a more realistic flushing simulation effect, based on previous scholars’ models of flow field action [43], the flow field was divided into two layers: the flushing layer and the permeable layer. The thickness of both layers is set at 1 m and moves downwards with the destruction depth of soil particles until the desired depth and a new equilibrium state are reached. In addition, the penetration layer weakens the bond strength between particles and accelerates the formation of gullies, assuming the flow rate is 0. Many scholars pay attention to the simplicity of the flow field and cannot perfectly restore the complex turbulent process in the flow field when they study the fluid–solid coupling of the PFC. If the flow field is not specifically laid out, the particles on the slope will disperse everywhere, affecting the final failure mode and disturbing the clarity of the data. In order to invert the shape of gully no. 5 as far as possible, and to achieve the aims of our research, the scouring layer was divided into the scouring area and the catchment area. The scouring area was set according to the area of gully no. 5; see the dark area in Figure 10. According to this logic, it is also necessary to reduce the intensity of the fluid meso-parameters in the catchment area. At the same time, the flow rate in the PFC will deviate from the actual slope runoff speed. If the flow rate is too high, the unevenness of the slope’s surface will cause particles to collide with each other and bounce off of the slope. If the velocity is too low, the expected effect will not be achieved due to the cohesion between the particles. After repeated trial calculations, the scouring speed was determined to be 2.3 m/s. When the slope particles are scoured, the original equilibrium state is broken, and the particles begin to gradually slide off the slope along with the fluid movement and accumulate at the foot of the slope until a new equilibrium state is reached. At this time, the particles are essentially stationary, and this is considered the end of the destruction process. After undertaking many trial calculations, it was found that when the calculation reaches 80 min, the particles are basically stationary, and the maximum velocity is less than 10−4 m/s.

3. Results

3.1. Failure Mode

Under the action of fluid scouring and penetration, weak bonds between the surface particles of the gangue slope are lost, and the slope’s mechanical strength characteristics are weakened, forming a gully, which affects the stability of the slope. Therefore, it is important to study the failure mode of the PFC gangue slope model of scouring under rainfall conditions to determine the gully formation mechanisms of such slopes and methods for slope protection and treatment.
We recorded the failure mode of the PFC gangue slope within 80 min of rainfall scouring; see Figure 11. The failure types of the whole process can be divided into four stages: (1) overall splash erosion and local schist erosion at the bottom of the slope; (2) erosion diversion and sheeting in the middle of the slope; (3) tributary–slope crest extension and the etching stage; and (4) integral gully erosion and the landslide stage.
(1) Integral splashing and local etching of the slope bottom.
This phase corresponds to the 10–20 min period shown in Figure 11. The early stage of rainfall occurs from 0 to 10 min and no obvious slope erosion occurs. Clump particles do not disengage from the slope. However, a displacement shape similar to that of gully 5 is formed in area B of the slope’s surface. At this time, the scouring condition of the slope’s surface is still in the early stage of catchment. The effect of hydraulic force on the clump particles is mainly concentrated in the valley. An arc-shaped radial flow channel is formed in the whole area (B), with the displacement of clump particles at 0–0.4 m and the maximum displacement concentrated at the bottom of the slope. As the hydraulic downward action destroys the particle contact model, the interaction between the particles at the bottom of the slope increases and the displacement increases. At 20 min, the clump particles on the surface of the slope begin to be destroyed and they disperse and disengage from the slope. The particles are taken away from the suspension module, and the maximum displacement is 9.79 m. This process is called sheet erosion, where rills appear on the bottom surface of the slope. At the same time, the catchment on the slope’s surface gradually transfers from Zone C to Zone A, and the particle displacement can reach 1.5 m due to catchment erosion.
(2) Erosion diversion and sheet erosion stages in the middle section of the slope.
The rainfall continues to progress, and the scouring time reaches 30 min. At this time, the denuded particles at the bottom of the slope gradually increase in number, forming a muddy shape and accumulating downward. At the same time, denudation develops upward and reaches the middle of the slope, leading to the start of the sheet erosion. It is not difficult to determine that the erosion resistance of the soil particles on the slope is less than the runoff scouring force, and the particles are in a local unstable state. At this time, the shear force between the runoff particles washes away the adjacent particles and forms a small erosion hole in the middle of the slope. Since the inter-particle hydraulic action gradually shifts to Zone A during the catchment stage, the main gully begins to flow in the direction of Zone A in the middle of the slope. It is interesting to note that the particles are eroded transversely in the direction of Zone A and form a Z-shaped scouring ditch with the rill at the bottom of the slope. After the rainfall scouring reaches 40 min, the downward scouring capacity of the main stream is greater than the lateral damage capacity of the catchment tributary. This results in the upward denudation speed of the main gully, which exceeds that of the lateral tributaries. With the progression of the rainfall, the runoff energy continues to increase. At the same time, due to the infiltration of the rainfall, the strength of the soil on the slope decreases, and the small erosion holes formed in the slope gradually deepen and widen towards the slope’s top, forming headward erosion. The accumulation at the bottom of the slope also gradually diffuses; the shape of the gully is not limited to the strip gully, and the width of the gully gradually expands outward. At this time, the direction and structure of the mainstream and tributaries are formed, and the runoff channel gradually becomes visible.
(3) Branch crest extension sheet erosion stage.
With the continuous development of rill erosion, the main gully continues to widen under the action of hydraulic force. Up to 50 min, the displacement of the accumulated particles can reach 98.32 m. At this time, the main stream’s erosion capacity is less than that of the tributaries. The upper part of the main stream gully is suspended from erosion, and the lower part is further accumulated downwards. The gully section is exposed (a fault phenomenon), forming a large erosion pit with a depth of about 8 m. At the same time, the denudation of the tributaries is ongoing, and the trend of the slope gully changes from two paths to one, forming a large closed Z-type gully. The flow path is diverted, so the scouring capacity is mainly concentrated in the direction of the branch in area A. Based on the tension between the hydraulic and particle forces, the tributary valleys extend and increase continuously. When the time point of 60 min is reached, the peak displacement of the accumulated particles reaches 122.23 m, the side valleys are penetrated, and the transverse particle tension is reduced. At this time, due to continuous rainfall, the force chain between particles near the section of the erosion pit in area B reaches the limit state. The direction of denudation changes from the branch direction in area A to the main direction in area B and continues to produce schistosity upwards, forming headward erosion at the top of the slope.
(4) Overall Gully Erosion and the Collapse Stage
According to the phenomenon whereby two scouring diversions occurred in the previous stage, the effect of hydraulic pressure on particles reaches its peak at 70 min, and the scouring intensity is the most intense at this point. When the top erosion pit section is gradually destroyed and collapses, the energy at the top of the slope is gradually released, the particles begin to accelerate the erosion, and a large number of particles are washed to the bottom of the slope and accumulate outward. At this time, the maximum displacement of the accumulated particles is 122.24 m, which is similar to the displacement observed in the previous stage, indicating that the whole model is in a state of gradual convergence at this time. Finally, the model tends to converge at 80 min, and, at this time, the gully of the lateral tributary in Zone A also reaches the maximum depth. The particles on the slope top of Zone B are completely connected through the pipe, forming a complete and continuous multidirectional gully with a peak displacement of 149.72 m.
In contrast to the failure mode, the process of the rain-erosion-induced failure of the coal gangue slope has the characteristics of discontinuous failure. Moreover, the failure sequence is bottom of the slope–middle of the slope–lateral tributary–top of the slope. The tributary gully in area A on the slope is determined by the water flow trend in the early catchment stage, and the whole gully trend is diverted in the middle and late stages of rainfall. However, the main stream’s hydraulic action soon causes the secondary diversion in area B and completes the penetration damage at the top. This phenomenon provides a favorable reference for proving the shear erosion theory and a further detailed analysis in the later stage.

3.2. Comparison between Theory and Simulation

After the PFC simulation calculations, the final gully failure pattern was obtained. The model angle was adjusted and the failure form of the coal gangue slope near Panzhou Electric Field in Guizhou Province was compared and observed, as shown in Figure 12. It can be seen from the figure that the shape of gully no. 5 simulated by the PFC is similar to the on-site failure shape of the slope, and the failure conditions of the main gully and the tributary gully are basically consistent. We achieved the preliminary aim of a PFC simulation. In order to further verify the rationality of the model and the theory, based on the rainfall scouring shear failure theory previously developed by our team, two types of scouring intensity factors were considered in depth, and the scouring depth optimization theory was further developed in combination with the characteristics of the PFC time effect calculations. Through a field survey, the data of one point every 10 m were input into Formula (22) to obtain the failure depth of each point after rainfall scouring and we compared it with the site failure depth and PFC simulation depth, as shown in Figure 13. Figure 14 shows the final failure critical line under three scouring failure conditions. Combining the two figures, we can see that the depth curve trends of the PFC calculation, the optimization theoretical calculations, and the actual data are consistent. The maximum damage point of gully no. 5 is located within the 30~50 m area in the middle of the slope, and the actual damage depth can reach 12 m. However, the peak depth calculated via the PFC and the optimization theory is relatively large and the curves are relatively close to each other. It can be seen from the profile that the scouring has formed a three-stage ladder effect, which is concentrated at the top of the slope, the middle of the slope, and the bottom of the slope (0~25 m, 25~65 m, and 65~110 m). This step effect fully verifies the intermittent characteristics of the erosion failure of the coal gangue slope. Since the diversion and fault phenomena of rainfall scouring are concentrated at the position of 30~60 m in the middle of the slope, the erosion pit here is the deepest. Finally, it can be seen that the depth calculated via the depth optimization scouring theory, the gully depth under the PFC simulation, and the actual failure depth have a good consistency, which proves the rationality of the simulation and the theoretical deduction. At the same time, the combination of these methods provides a valuable reference for early warnings and the hydrodynamic theory of coal gangue slope engineering disasters.

3.3. Displacement Analysis

The change in the displacement with the time of each monitoring point of the model is shown in Figure 15. The displacement curve can further elucidate the scouring and damage laws of the slope’s bottom, middle, top, and tributary areas. From the change in the surface displacement (Figure 15a,c), the trends for the displacement curves of each point in the horizontal Y-direction and the vertical Z-direction are essentially consistent, indicating that the surface soil particles in the scouring area are subject to more hydraulic scouring when they follow the flow and the constraints between soil particles are lower, and when the movement direction is consistent with the slope direction. From the perspective of deep particles, the particles at the bottom of the slope and at the top of the slope show similar curve trends in the process of comparing the horizontal displacement curve with the vertical displacement curve; however, the particle displacement curve trends in the middle of the slope and in the tributary region are quite different. This shows that when the rainfall infiltration reaches the deep soil particles, the internal disturbance of the particles in the middle of the slope is greatest, which causes the water flow to change in the middle of the slope, thus forming a gully tributary.
According to the analysis of the failure mode, we deduced that the coal gangue slope model is divided into four stages (0–20 min, 20–40 min, 40–60 min, and 60–80 min) in the process of scouring failure. Within the period 0–20 min, the surface particle displacement (MP1, MP2) at the bottom and middle of the slope increases linearly, reaches the maximum value, and tends to be flat at 10 min. The maximum horizontal displacement of the surface particle MP1 at the bottom of the slope during this period is 12 m, and the maximum vertical displacement is 2 m; the horizontal peak displacement of surface particle MP2 in the middle of the slope is 40 m, and the vertical peak displacement is 13 m. During this period, there is no change in displacement at the top of the slope and at the tributaries, which indicates that the first stage of scouring damage impacts the slope bottom first, but the damage trend is obviously more violent in the middle of the slope. When reaching the second stage (20–40 min), there is still no displacement change at the slope bottom, the slope top, or the tributaries. The particle displacement of the surface soil in the middle of the slope increases slowly, but the displacement of its deep particles (Figure 14d) fluctuates, indicating that the erosion damage is concentrated in the middle of the slope at this time. The surface particles are washed with the water flow, and the deep particles are damaged by turbulence. When the scouring reaches the third stage (40–60 min), the surface particle displacement curve between the slope top and the tributary area begins to increase sharply. The maximum horizontal displacement of the slope top can reach 102 m, accounting for 41.76% of the overall horizontal displacement, and the maximum vertical displacement of the slope top can reach 42 m, accounting for 45.85% (see Figure 16). It can be seen from the displacement curve that the displacement at the top of the slope changes prior to the displacement of the tributaries. This shows that after the scouring and accumulation in the middle of the slope, the tributary gap is formed, which is also the reason for the formation of multiple gullies caused by scouring. However, at this time, the stress is not concentrated in the direction of the tributary, but at the top of the slope, so the direction of the gully is not completely changed at this time. It can be seen from Figure 15b–d that the particle displacement curve in the deep part of the tributary changes slowly and is unstable, indicating that the scouring force of the tributary is not strong before the main gully is connected; this again verifies that the stress in the third stage is more highly concentrated at the top of the slope. In the fourth stage (60–80 min), except for the deep particles in the tributary, the particle displacement in other areas tends to be stable, and the particles in the monitoring area have largely been washed to the bottom of the slope with the rain and completed their accumulation. The deep particles in the tributary are still involved in the process of the continuous growth of displacement, which means that after the completion of the main gully’s penetration failure, the energy is completely transferred to the tributary and continues to complete the erosion failure of the tributary. The surface soil is damaged by laminar flow, the displacement of particles is large, and the curve changes in a stepwise manner. The deep soil is greatly affected by turbulence, and the displacement is relatively small, but the displacement curve fluctuates greatly; particles collide with each other and even rebound. During the whole process, the maximum displacement is concentrated at the top of the slope, and its proportions are as follows: top of the slope > tributaries > middle of the slope > bottom of the slope. The peak displacement of the slope top in the horizontal Y-direction accounts for 41.76%, and that in the Z-direction accounts for 45.84% (Figure 16). It is surmised that in the process of preventing and controlling rainfall-induced landslides, priority should be given to protecting the sliding soil mass at the bottom of the slope, and the soil mass in the middle of the slope should be reduced to prevent the maximum energy fluctuation caused by scouring, so as to prevent extensive displacement damage at the top of the slope.

3.4. Scour Tracking and Accumulation

During the numerical calculations, the positions of eight typical monitoring particles were selected, as shown in Figure 17, and the tracked particles were analyzed in combination with the results of the failure mode. At the bottom of the slope, MP1 is preferentially denuded by the thin-layer water flow, and MP6 is greatly affected by turbulence, but this effect is limited to the large particle resistance at the bottom of the slope; the movement tracks of the two are not obvious, and they are characterized by a slow creeping phenomenon, which is defined as a slow accumulation at the bottom of the slope. With the development of the main gully, particles MP2 and MP7 in the middle of the slope move along the main gully to the bottom of the slope under the scouring action, and then accumulate in the Y-direction along with the particles at the bottom of the slope. The mixing effect of the huge laminar flow and turbulent flow in the middle of the slope causes the development of tributaries. It can be seen that the MP5 and MP10 particles move from the side to the middle of the slope, then enter the mainstream gully and accumulate in the positive Y-direction at the bottom of the slope. We can clearly see that the particles at different depths in the tributary area have different stacking heights at the bottom of the slope, and the deep particles accumulate on the surface particles due to the later denudation sequence. Therefore, in the deposits at the bottom of the slope, the soil particles washed out from the deep layer cover the soil particles that originally accumulated on the surface layer. Finally, the two particles MP3 and MP4 are scoured at the top of the slope. They all move along the direction of the main gully from the top of the slope to the middle of the slope. However, due to the influence of height difference accumulation, when moving to the bottom of the slope, the two particles change their motion trajectory: the MP3 particles move diagonally in the XY-direction, while the MP4 particles move in the positive Y-direction. Therefore, we know that MP6 and MP1 tracks belong to slow accumulation movement, MP7 and MP2 and MP3 and MP4 tracks belong to fast scouring movement, and MP5 and MP10 belong to DC steering movement. Depending on the scouring location, the resulting particle trajectories vary considerably.
Interestingly, we combined several sets of motion trajectory curves and changed the perspective to obtain Figure 18. It can be seen from Figure 18a that there are two gullies in the whole scouring process, which are defined as the first and second gullies (i.e., tributary gullies and mainstream gullies) in order of completion. A further analysis shows that there are two modes of scouring pile integration, namely, the arc erosion accumulation mode (Figure 18b) and the fan erosion accumulation mode (Figure 18c). Arc erosion accumulation is mainly controlled by deep particles, namely, MP3, MP6, MP7, and MP10. Fan erosion accumulation is mainly affected by shallow particles, namely, MP1, MP2, MP4, and MP5. In the actual rainfall scouring process, the mainstream gullies rarely exist alone, and most of the slope erosion failure modes are characterized by the combination of multiple tributaries and the main stream, which is the effect of multiple gullies (only two gullies are considered in this model). The main stream gully mainly controls arc-shaped or linear erosion and accumulation. Due to their complex role in the slope, the interaction between laminar flow and turbulent flow is pronounced, which provides conditions for the development of tributaries and further forms the fan erosion and accumulation model. This provides favorable conditions for us to further study the internal mechanisms of coal gangue scouring and accumulation.

3.5. Stress–Strain Analysis

Finally, in order to elucidate the internal failure mechanism of the model, the four representative measuring balls in the model were selected, their stress–strain data were extracted, and the real-time stress–strain curves of the PFC scouring model were obtained, as shown in Figure 19. At the beginning of the scouring process, due to the initial contact between rainwater and the coal gangue particles, the overall stress on the slope surface increased, with a maximum of 4.9 MPa located at the bottom of the slope. In the later part of the first stage of scouring, the stress change in each area is not obvious, but the strain in the slope changes sharply, fluctuating between 5 and 8. When reaching the second stage (20–40 min), there are large stress fluctuation values at the bottom and middle of the slope, and the stress increases sharply at 20 min. At this time, a large number of particles in the middle of the slope accumulate towards the bottom of the slope. The large accumulation causes the stress at the bottom of the slope to increase sharply, with a fluctuation value between 2 and 6.8 MPa. It is worth noting that the stress generated by accumulation is greater than the stress caused by erosion and denudation. At this time, the stress and strain in the tributary area also begin to increase slightly, with the stress reaching 1.7 MPa and the strain reaching 5.1, indicating that the later part of the second stage is the incubation period of the tributary gully. After that, in the third stage (40–60 min), the bottom of the slope continues to accumulate, and the stress continues to fluctuate. However, due to the dense particles at the bottom of the slope, the particles are denuded less, and there is no obvious strain. At this time, the stress of the tributary increases sharply to 3.8 MPa, the tributary notch begins to form, and the strain reaches six. Then, the stress concentration is transferred from the tributary to the top of the slope, the stress of the tributary decreases to 0.4 MPa, and the stress at the top of the slope increases to 4.4 MPa. The trend of the strain curve is similar: the maximum strain at the top of the slope reaches 7.5, and then decreases sharply. At the fourth stage (60–80 min), the stress in the tributary area increases again, reaching 3.9 MPa, and the final scouring damage is completed. An alternation can be seen in the change in stress and strain at the top of the slope and in the tributary after the second stage of scouring. During the whole scouring process, the stress generated by the accumulation at the bottom of the slope is always the largest, but the damage it causes is the smallest. The strain fluctuation caused by the scouring in the middle of the slope is the largest, and the damage it causes is the strongest.
The peak values of the measurement ball data of the whole model were extracted, and the stress and strain were divided into the three directions of the XYZ data; the peak stress and strain curve is shown in Figure 20. It can be seen from the figure that the higher peak stress and strain values of the coal gangue slope scouring failure are distributed in the horizontal Y-direction of the middle of the slope, the horizontal X-direction of the tributary, and the vertical Z-direction of the slope bottom. From the peak data in the X-direction, it can be seen that the transverse peak stress increases from the top of the slope to the bottom of the slope, and the maximum value can reach 8.6 MPa in the tributary area. At this time, the peak strain also reaches the maximum value of 10.3 in the tributary region, and then decreases at the bottom of the slope (because the bottom of the slope is dense). This shows that the generation of the branch notch is mainly determined by the X-direction stress, and 8.6 MPa is the critical stress. According to the Y-direction curve, the scouring damage in the middle of the slope is the most severe, with a peak stress of 8.9 MPa and a peak strain of 14.3. The Y-direction peak stress at the top of the slope is close to that of the tributary, and both remain between 5.5 and 6.2 MPa. It can be observed that in the distance from the middle of the slope to the tributary to the bottom of the slope, the peak stress–strain curve in the Y-direction shows a “U”-type distribution feature. However, combined with the overall analysis, the stress response in the middle of the slope is stronger; this area can be described as the hub area for the development of scouring and destruction. The contact force chain of its internal particles is more likely to break and is more destructive. It can be seen from the Z-direction data that due to gravity and scouring, the energy reaching the bottom of the slope gradually increases; moreover, the peak stress gradually increases from the top of the slope to the bottom of the slope. The maximum Z-direction peak stress at the bottom of the slope can reach 10.3 MPa, but the peak strain here is only 4.6. According to the law of the stress–strain curve, the internal mechanisms of erosion failure in coal gangue slopes that were emphasized in the previous analysis are more clearly defined.

4. Discussion

This paper optimizes the wash shear failure theory and combines it with the discrete element PFC3D method to verify its rationality, which provides a new idea for the PFC flu-structure interaction method. In addition, the article enriches the modeling method of the PFC coal gangue slope model and provides a valuable reference for the early warning and simulation of coal gangue slope engineering disasters. However, when building the PFC3D model, this paper assumes that the model is an ideal boundary model, and the types of clusters are limited to three, and the relationship between the ratio of various clusters and the model parameters is not considered in depth. At the same time, the setting of the fluid module is too small, and the fluid–structure coupling design requires further improvement. Although only one kind of soil material (coal gangue) is considered in this study, the clump modeling method, the test process of particle flow meso-parameters and the fluid–structure coupling model of erosion damage can be further used for the simulation of clay and sand. Interestingly, we happened to have conducted a project on the improvement of red clay in Sichuan, China, recently, so the simulation method will be further improved. This paper is based on the real geometric shape of the scene to model, which is representative but not comparative. In the next research work, the rainfall erosion mechanism of different slopes with different angles and shapes will be the focus. The influence of pore water pressure on the failure mechanism of a coal gangue slope is not discussed in this paper, which requires further study.

5. Conclusions

(1)
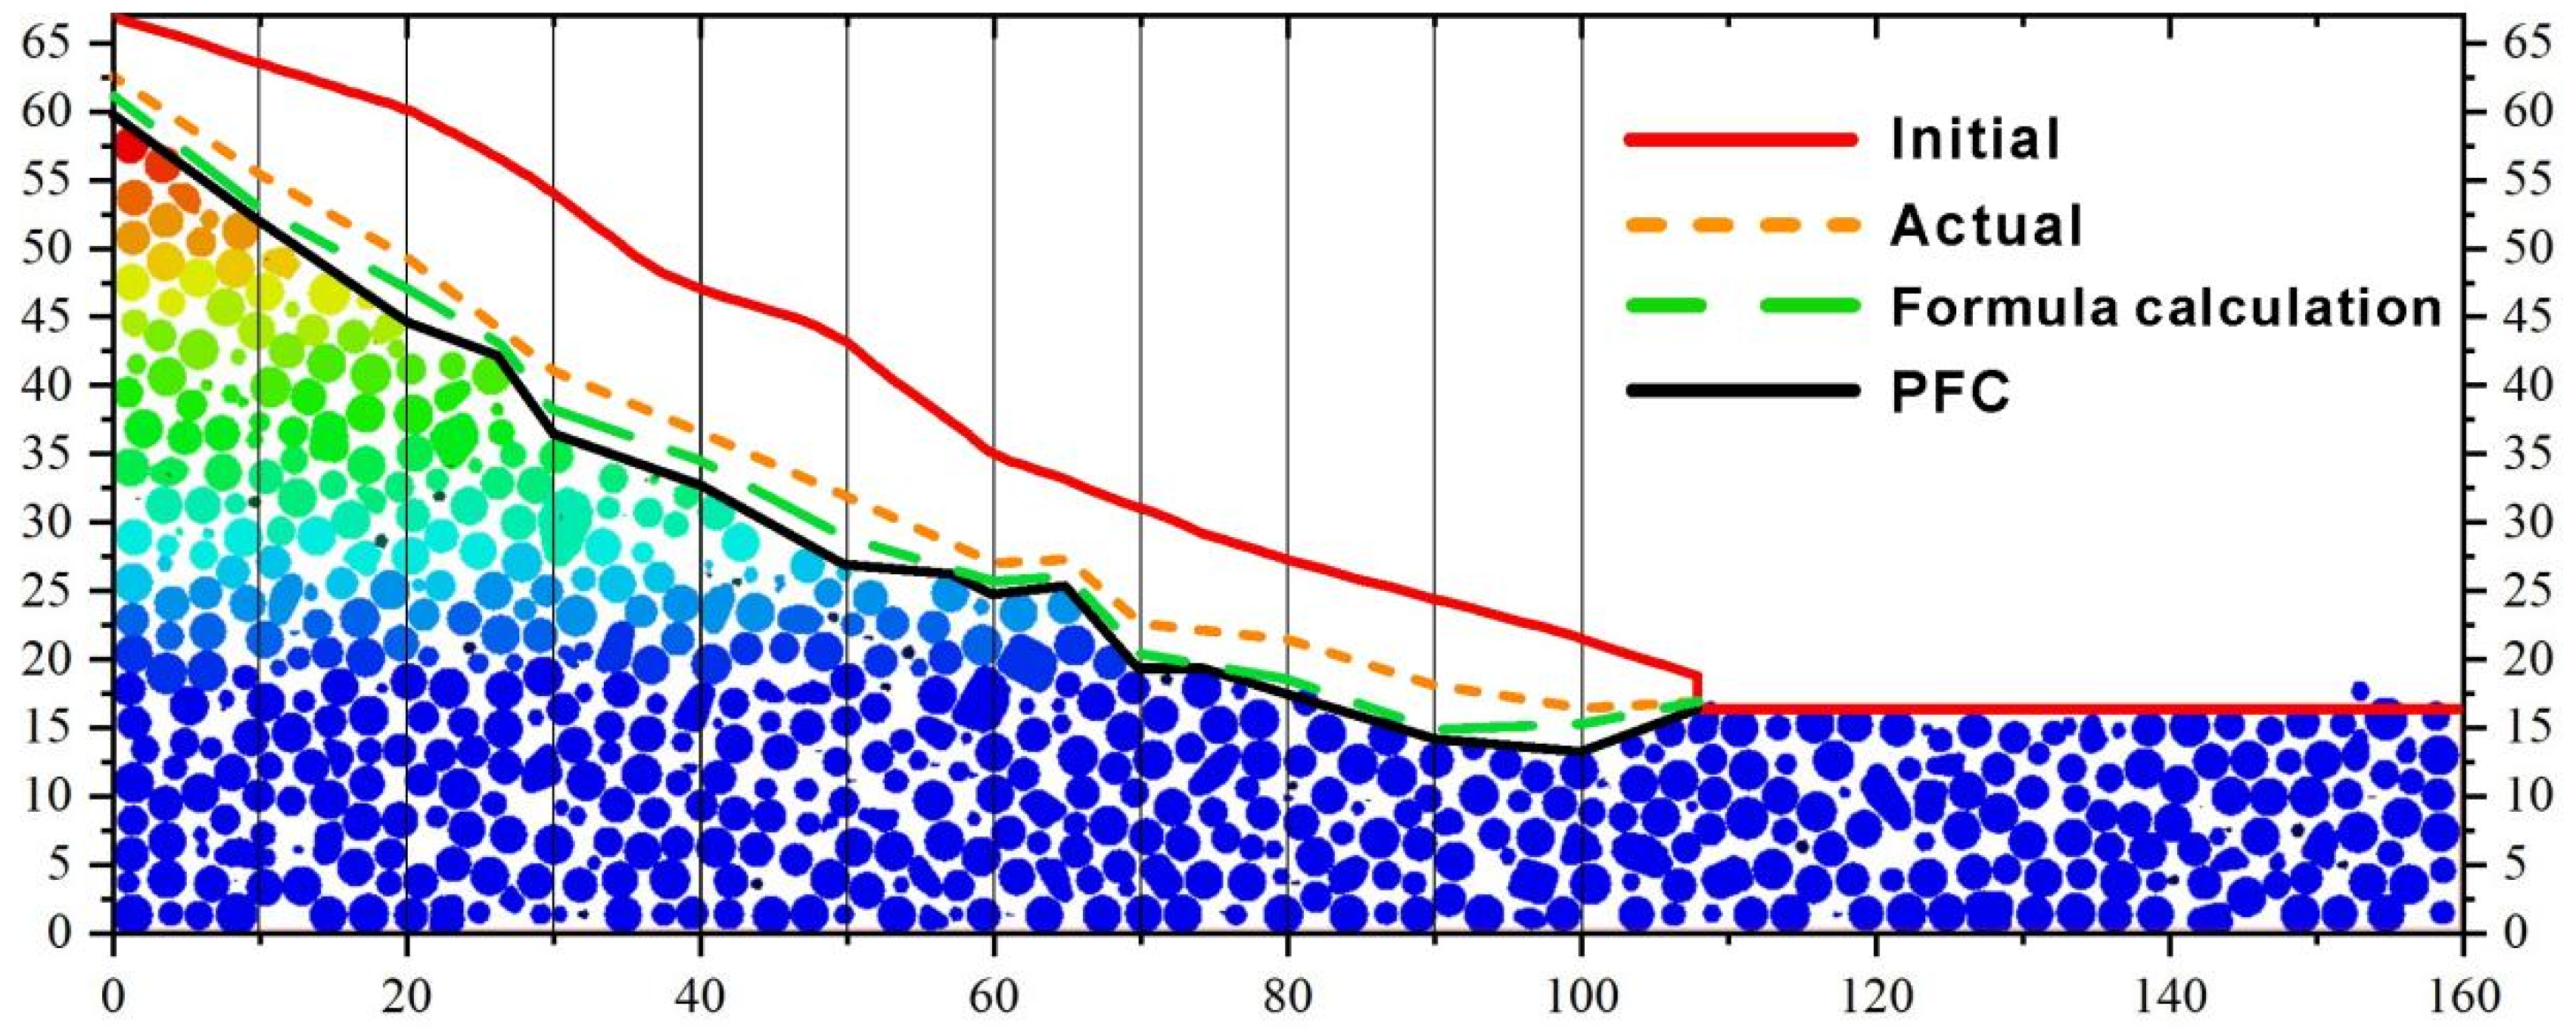
Based on the previously derived rainfall scouring shear failure theory, a scouring depth optimization theory was further developed by taking into account the two types of scouring intensity factors (c and φ) and combining the characteristics of the PFC time effect calculation. Verification shows that the curve trends of the PFC calculation, the optimization theory calculation, and the actual slope depth data are consistent. The combination of these methods provides a valuable reference for early warnings of coal gangue slope engineering disasters and for the hydrodynamic theory.
(2)
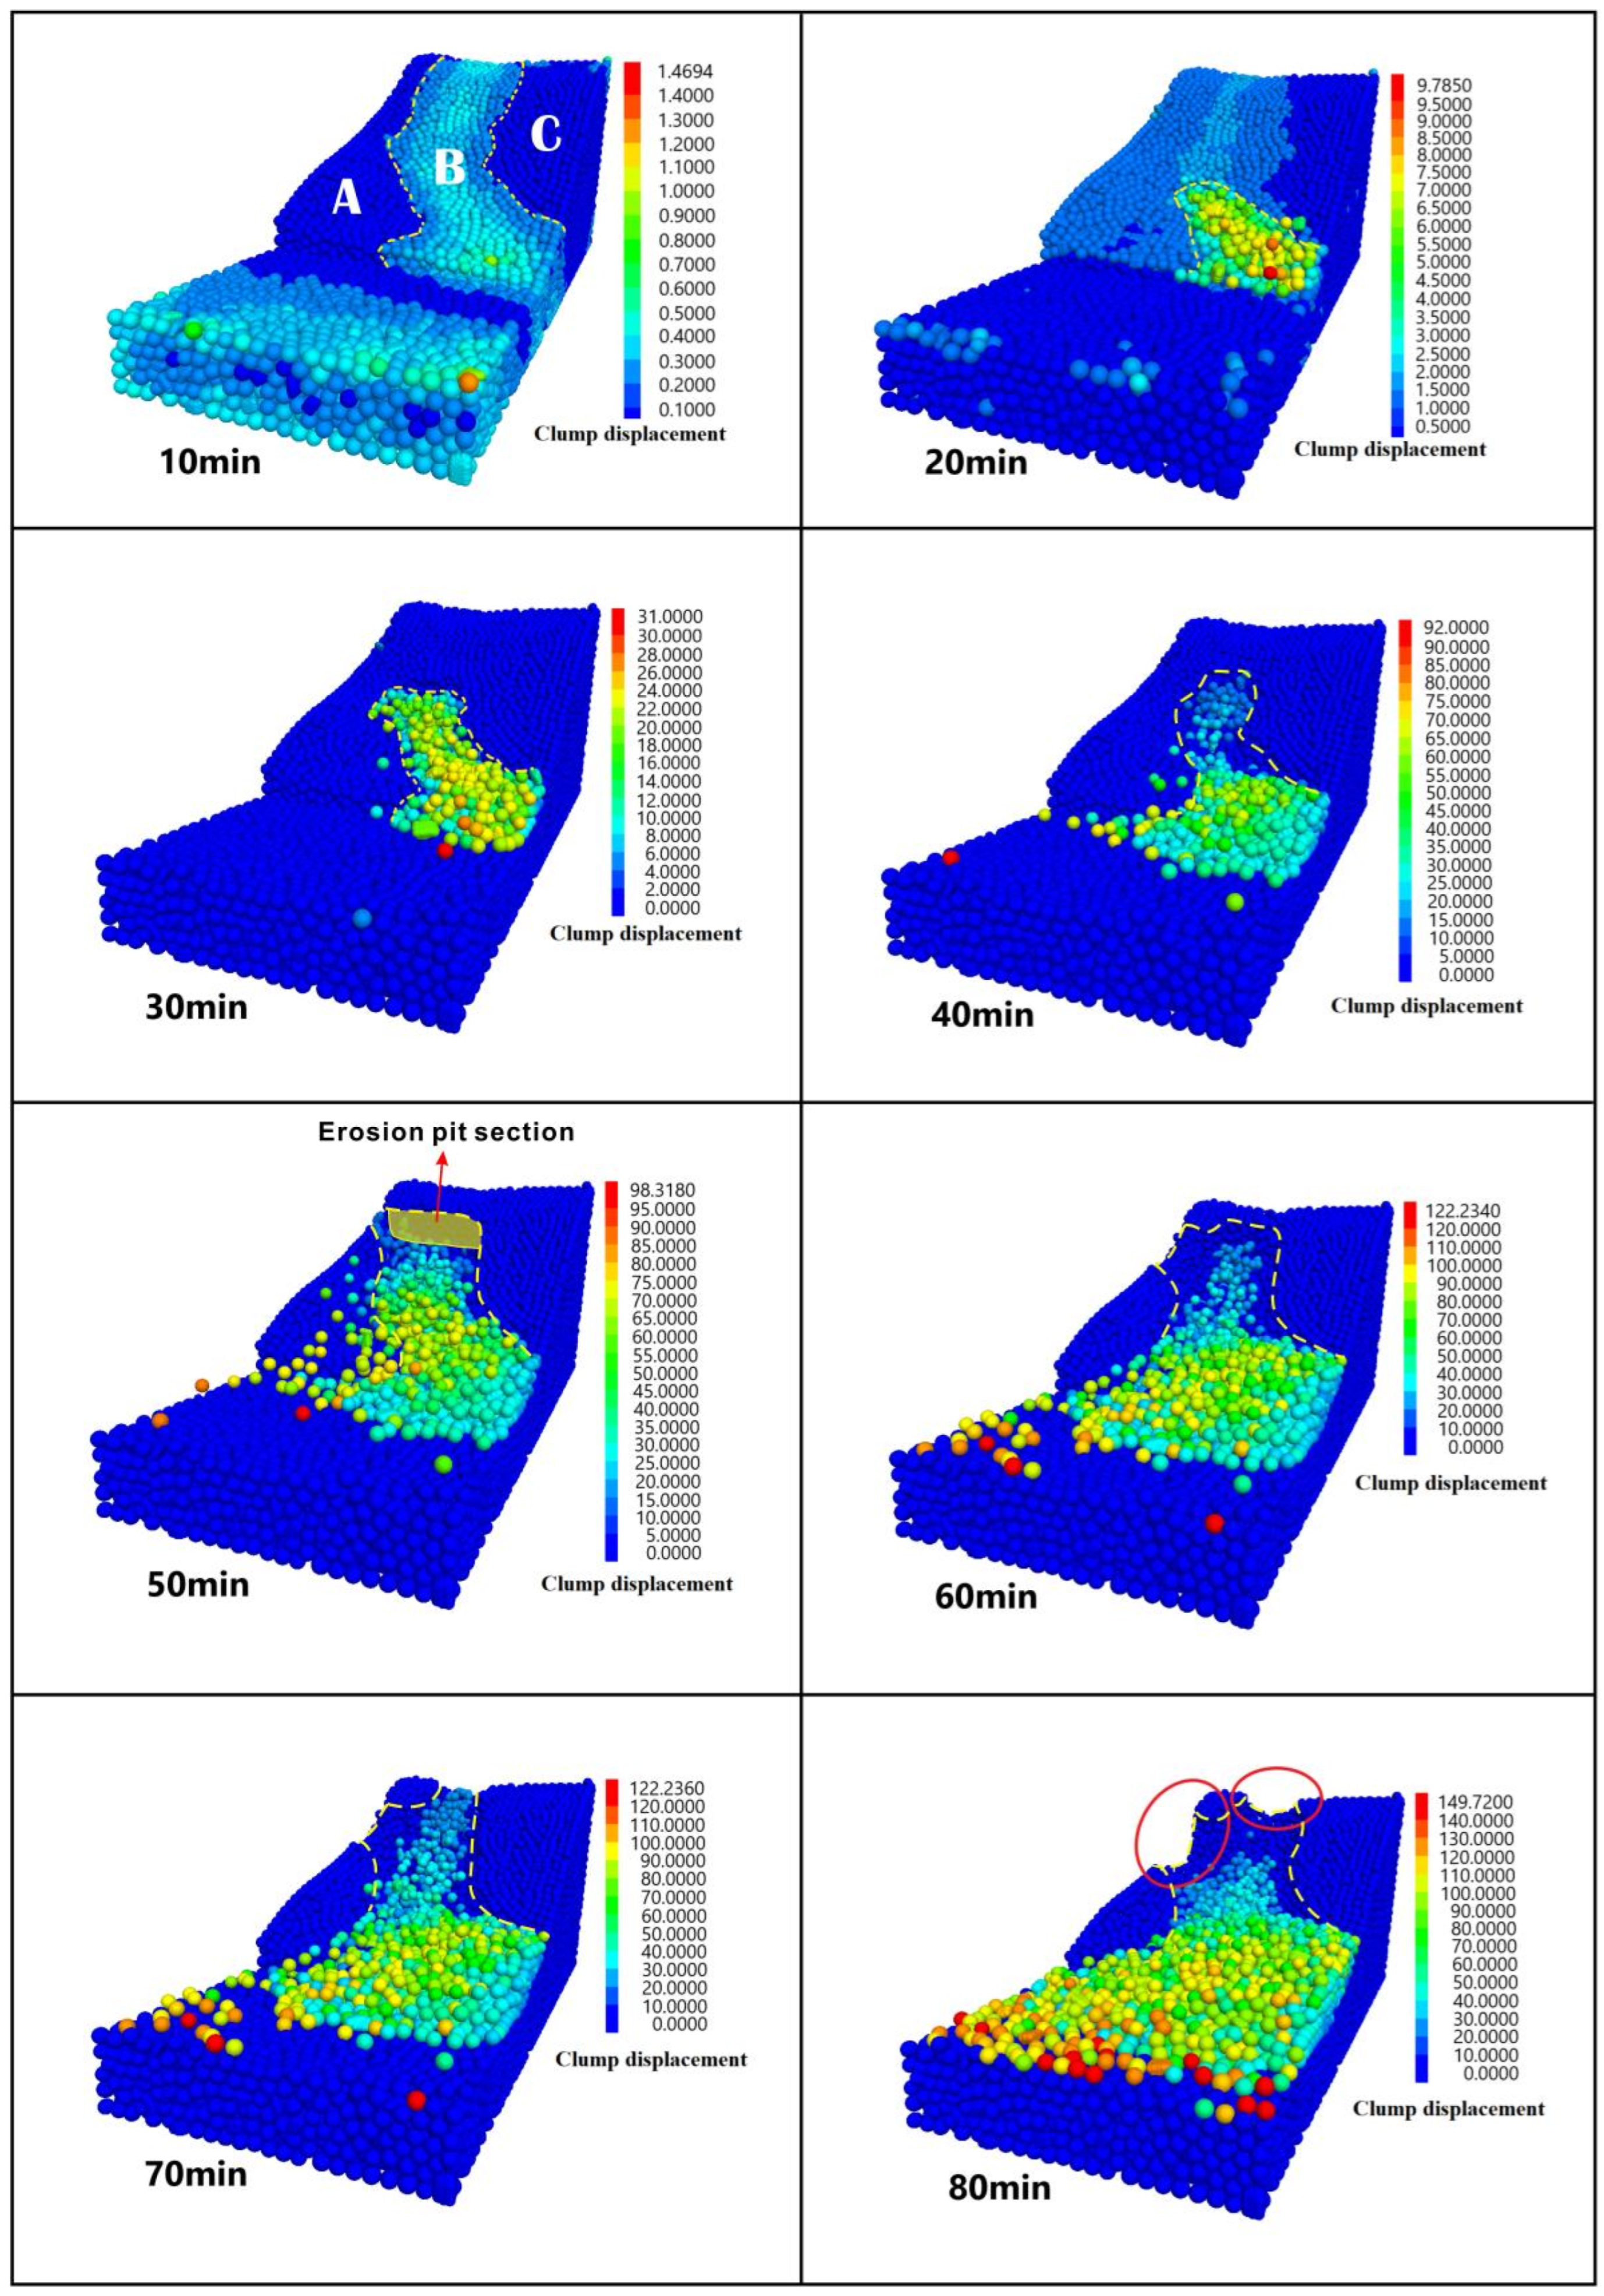
The rain erosion failure of the coal gangue slope can be divided into four stages: (1) overall splash erosion and local schist erosion at the bottom of the slope; (2) erosion diversion and sheeting in the middle of the slope; (3) the tributary–slope crest extension and etching stage; and (4) the integral gully erosion and landslide stage. The scouring failure process has the characteristics of a discontinuous failure. Moreover, the failure sequence is as follows: slope bottom–slope middle–lateral tributary–slope top. The tributary gully in area A on the slope is determined by the water flow trend in the early catchment stage. The process of coal gangue scouring and destruction forms a three-stage ladder effect, which is concentrated at the top of the slope, the middle of the slope, and the bottom of the slope (0~25 m, 25~65 m, and 65~110 m). This step effect fully verifies the intermittent characteristics of the erosion failure of the coal gangue slope.
(3)
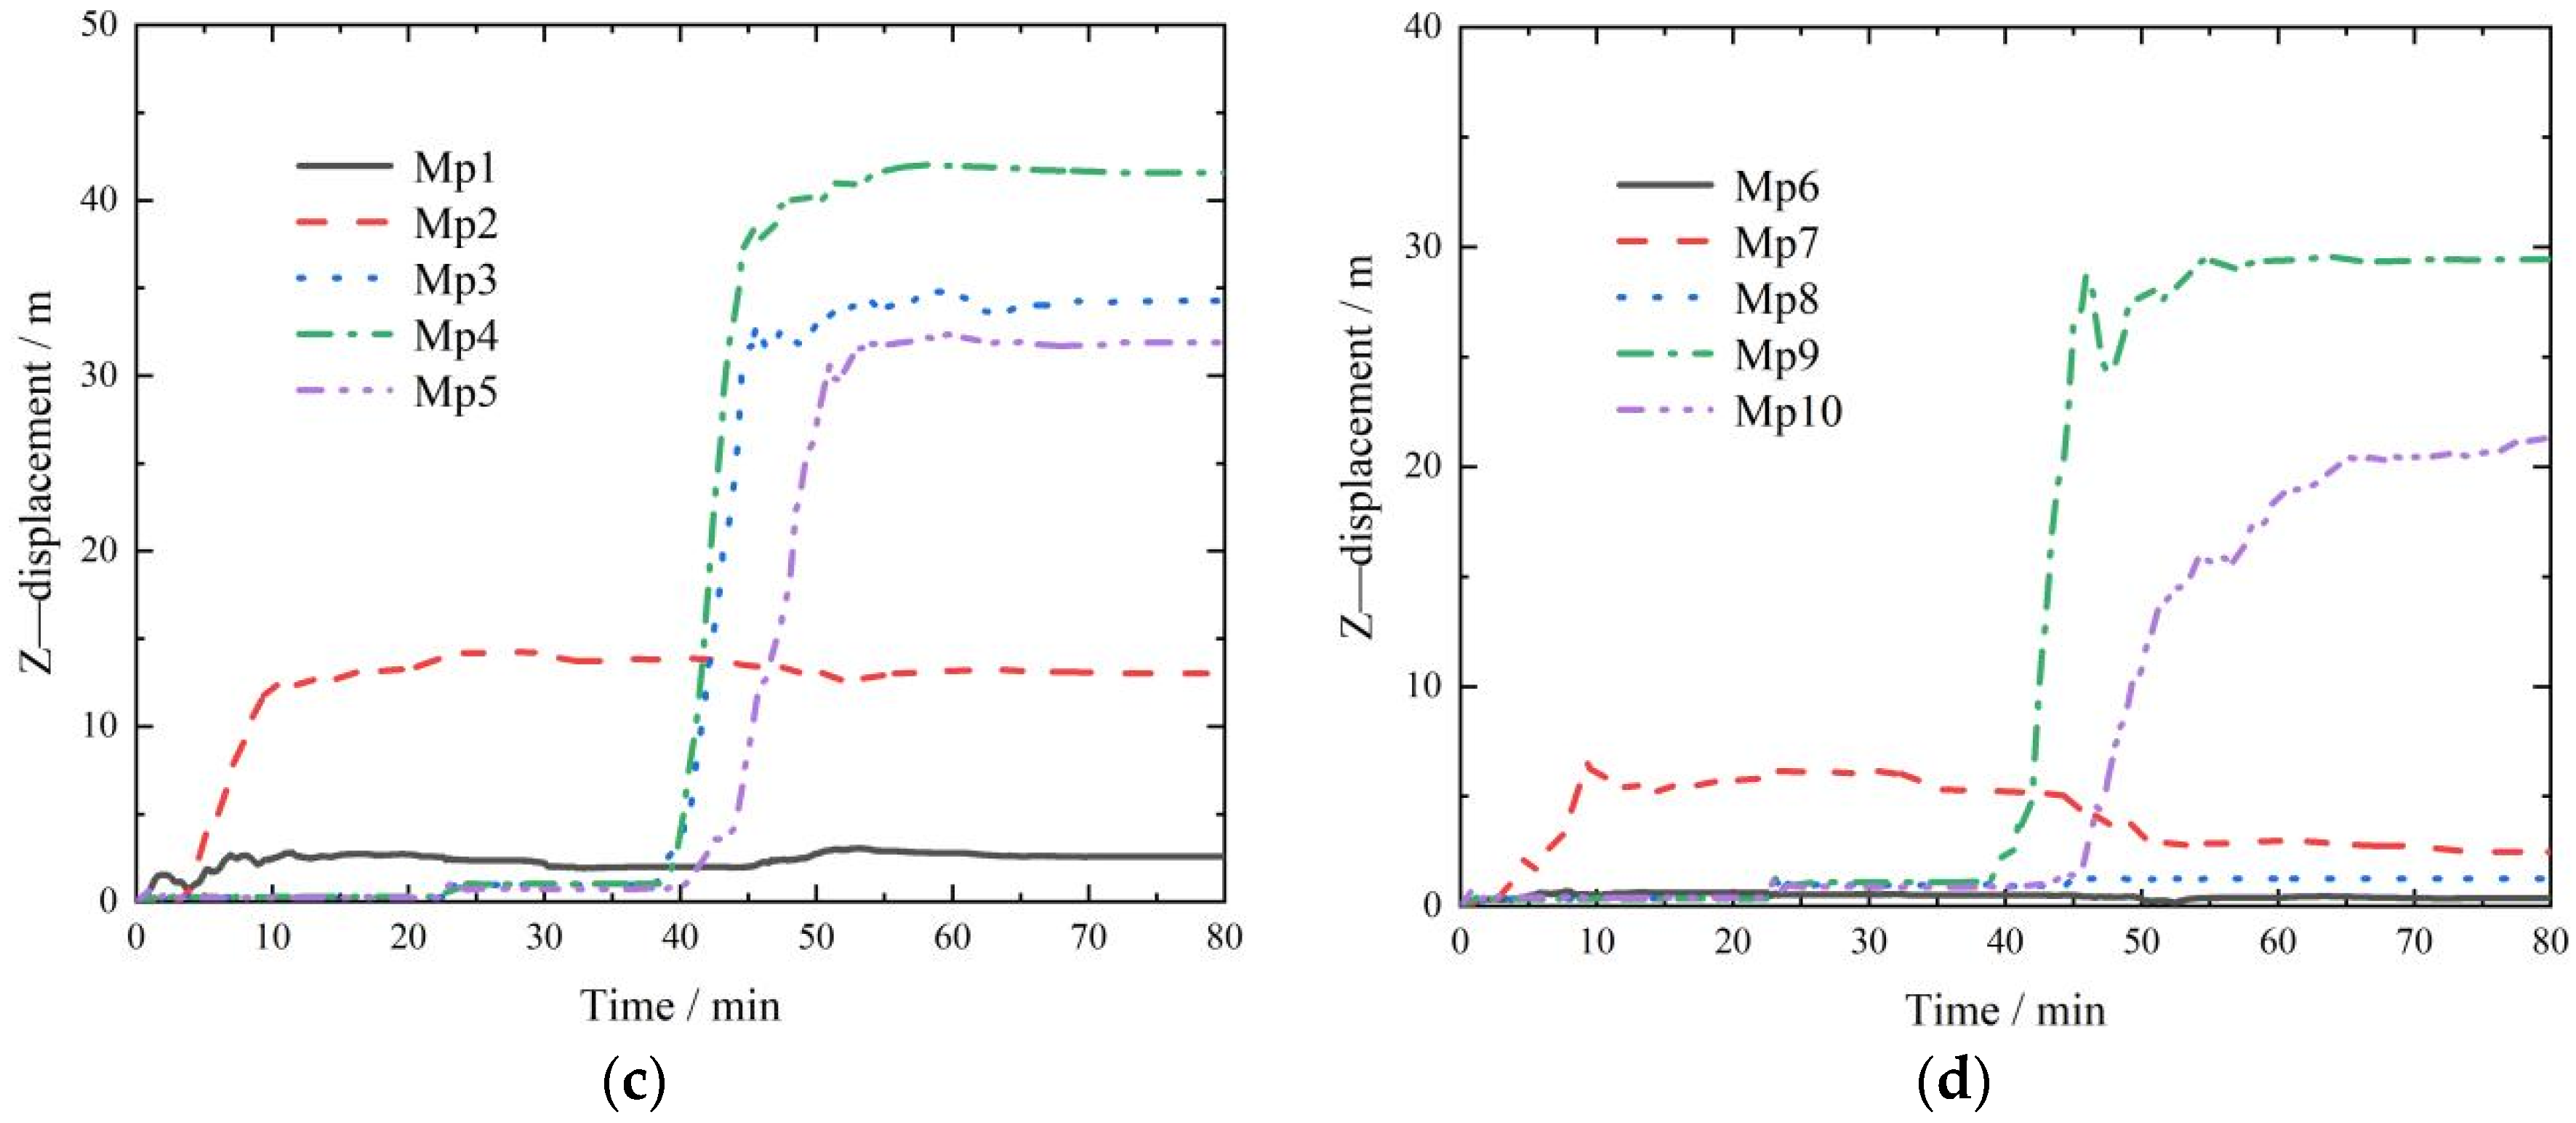
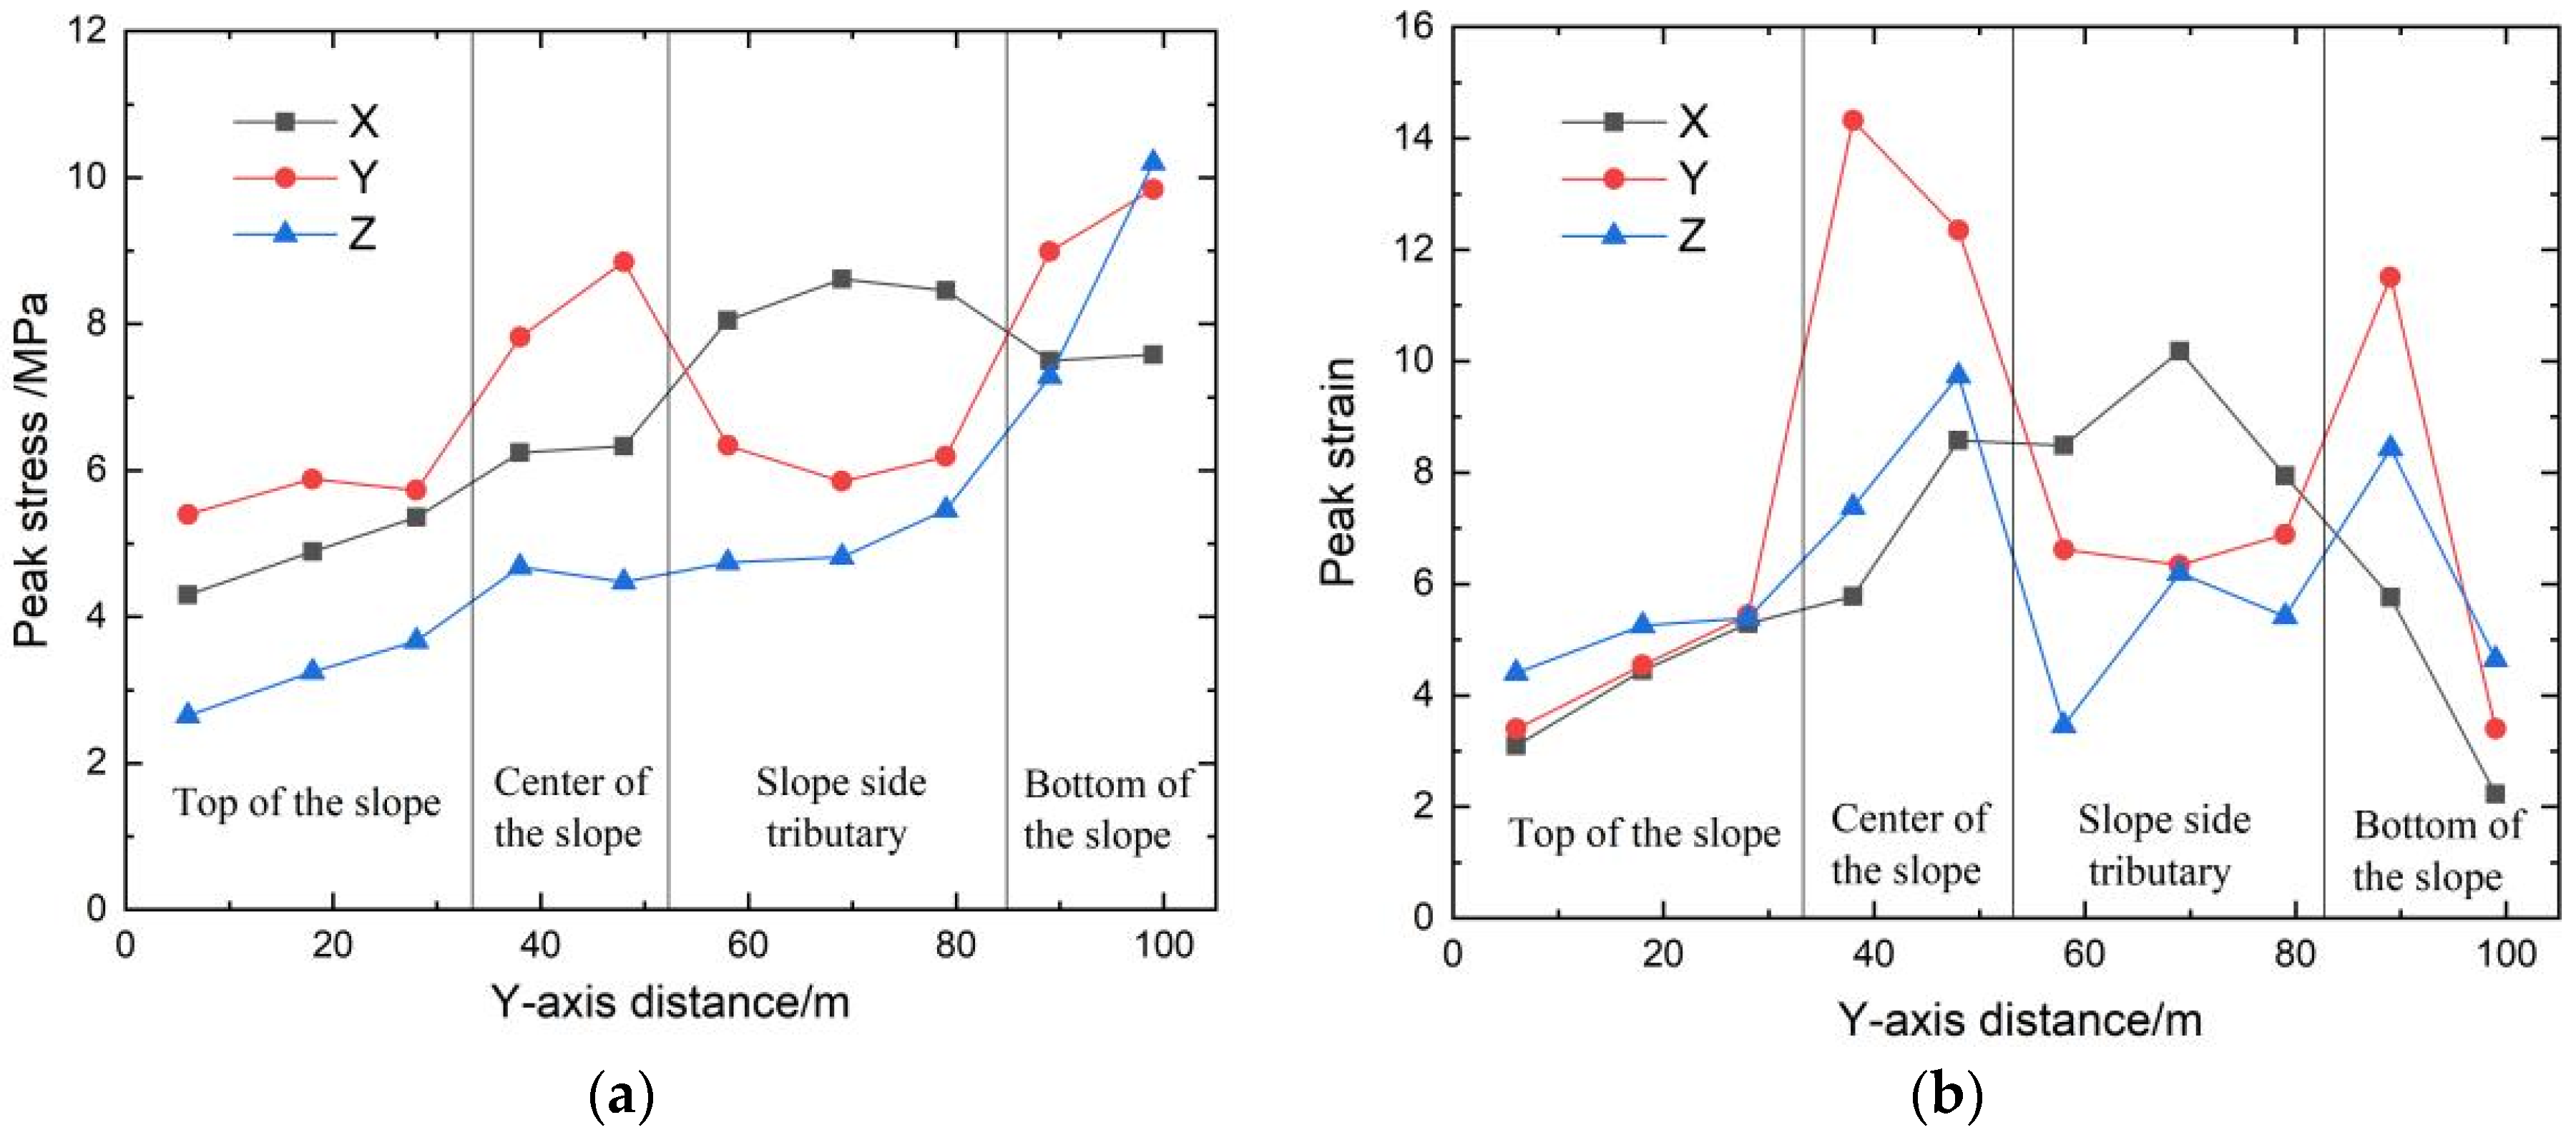
During the whole process, the maximum displacement is concentrated at the top of the slope, according to the following proportions: top of the slope > tributaries > middle of the slope > bottom of the slope. The peak displacement of the slope top in the horizontal Y-direction accounts for 41.76%, and that in the Z-direction accounts for 45.84%. In efforts to prevent and control rainfall-induced landslides, priority should be given to the protection of the sliding soil mass at the bottom of the slope, and the focus should be on reducing the soil mass in the middle of the slope to prevent the maximum energy fluctuation caused by scouring, so as to prevent extensive displacement damage at the top of the slope. The latter part of the second stage of scouring is the incubation period for the tributary gully. During the whole scouring process, the strain fluctuation caused by scouring in the middle of the slope is the largest; this is the hub area for the development of scouring damage. The peak stress is up to 8.9 MPa, the peak strain is up to 14.3, and the damage caused by scouring is the strongest. The larger peak stress and strain values of coal gangue slope scouring failure are distributed in the horizontal Y-direction of the middle of the slope, the horizontal X-direction for the tributary, and the vertical Z-direction for the slope bottom. The generation of the branch notch is mainly determined by the X-direction stress, and 8.6 MPa is the critical stress.
(4)
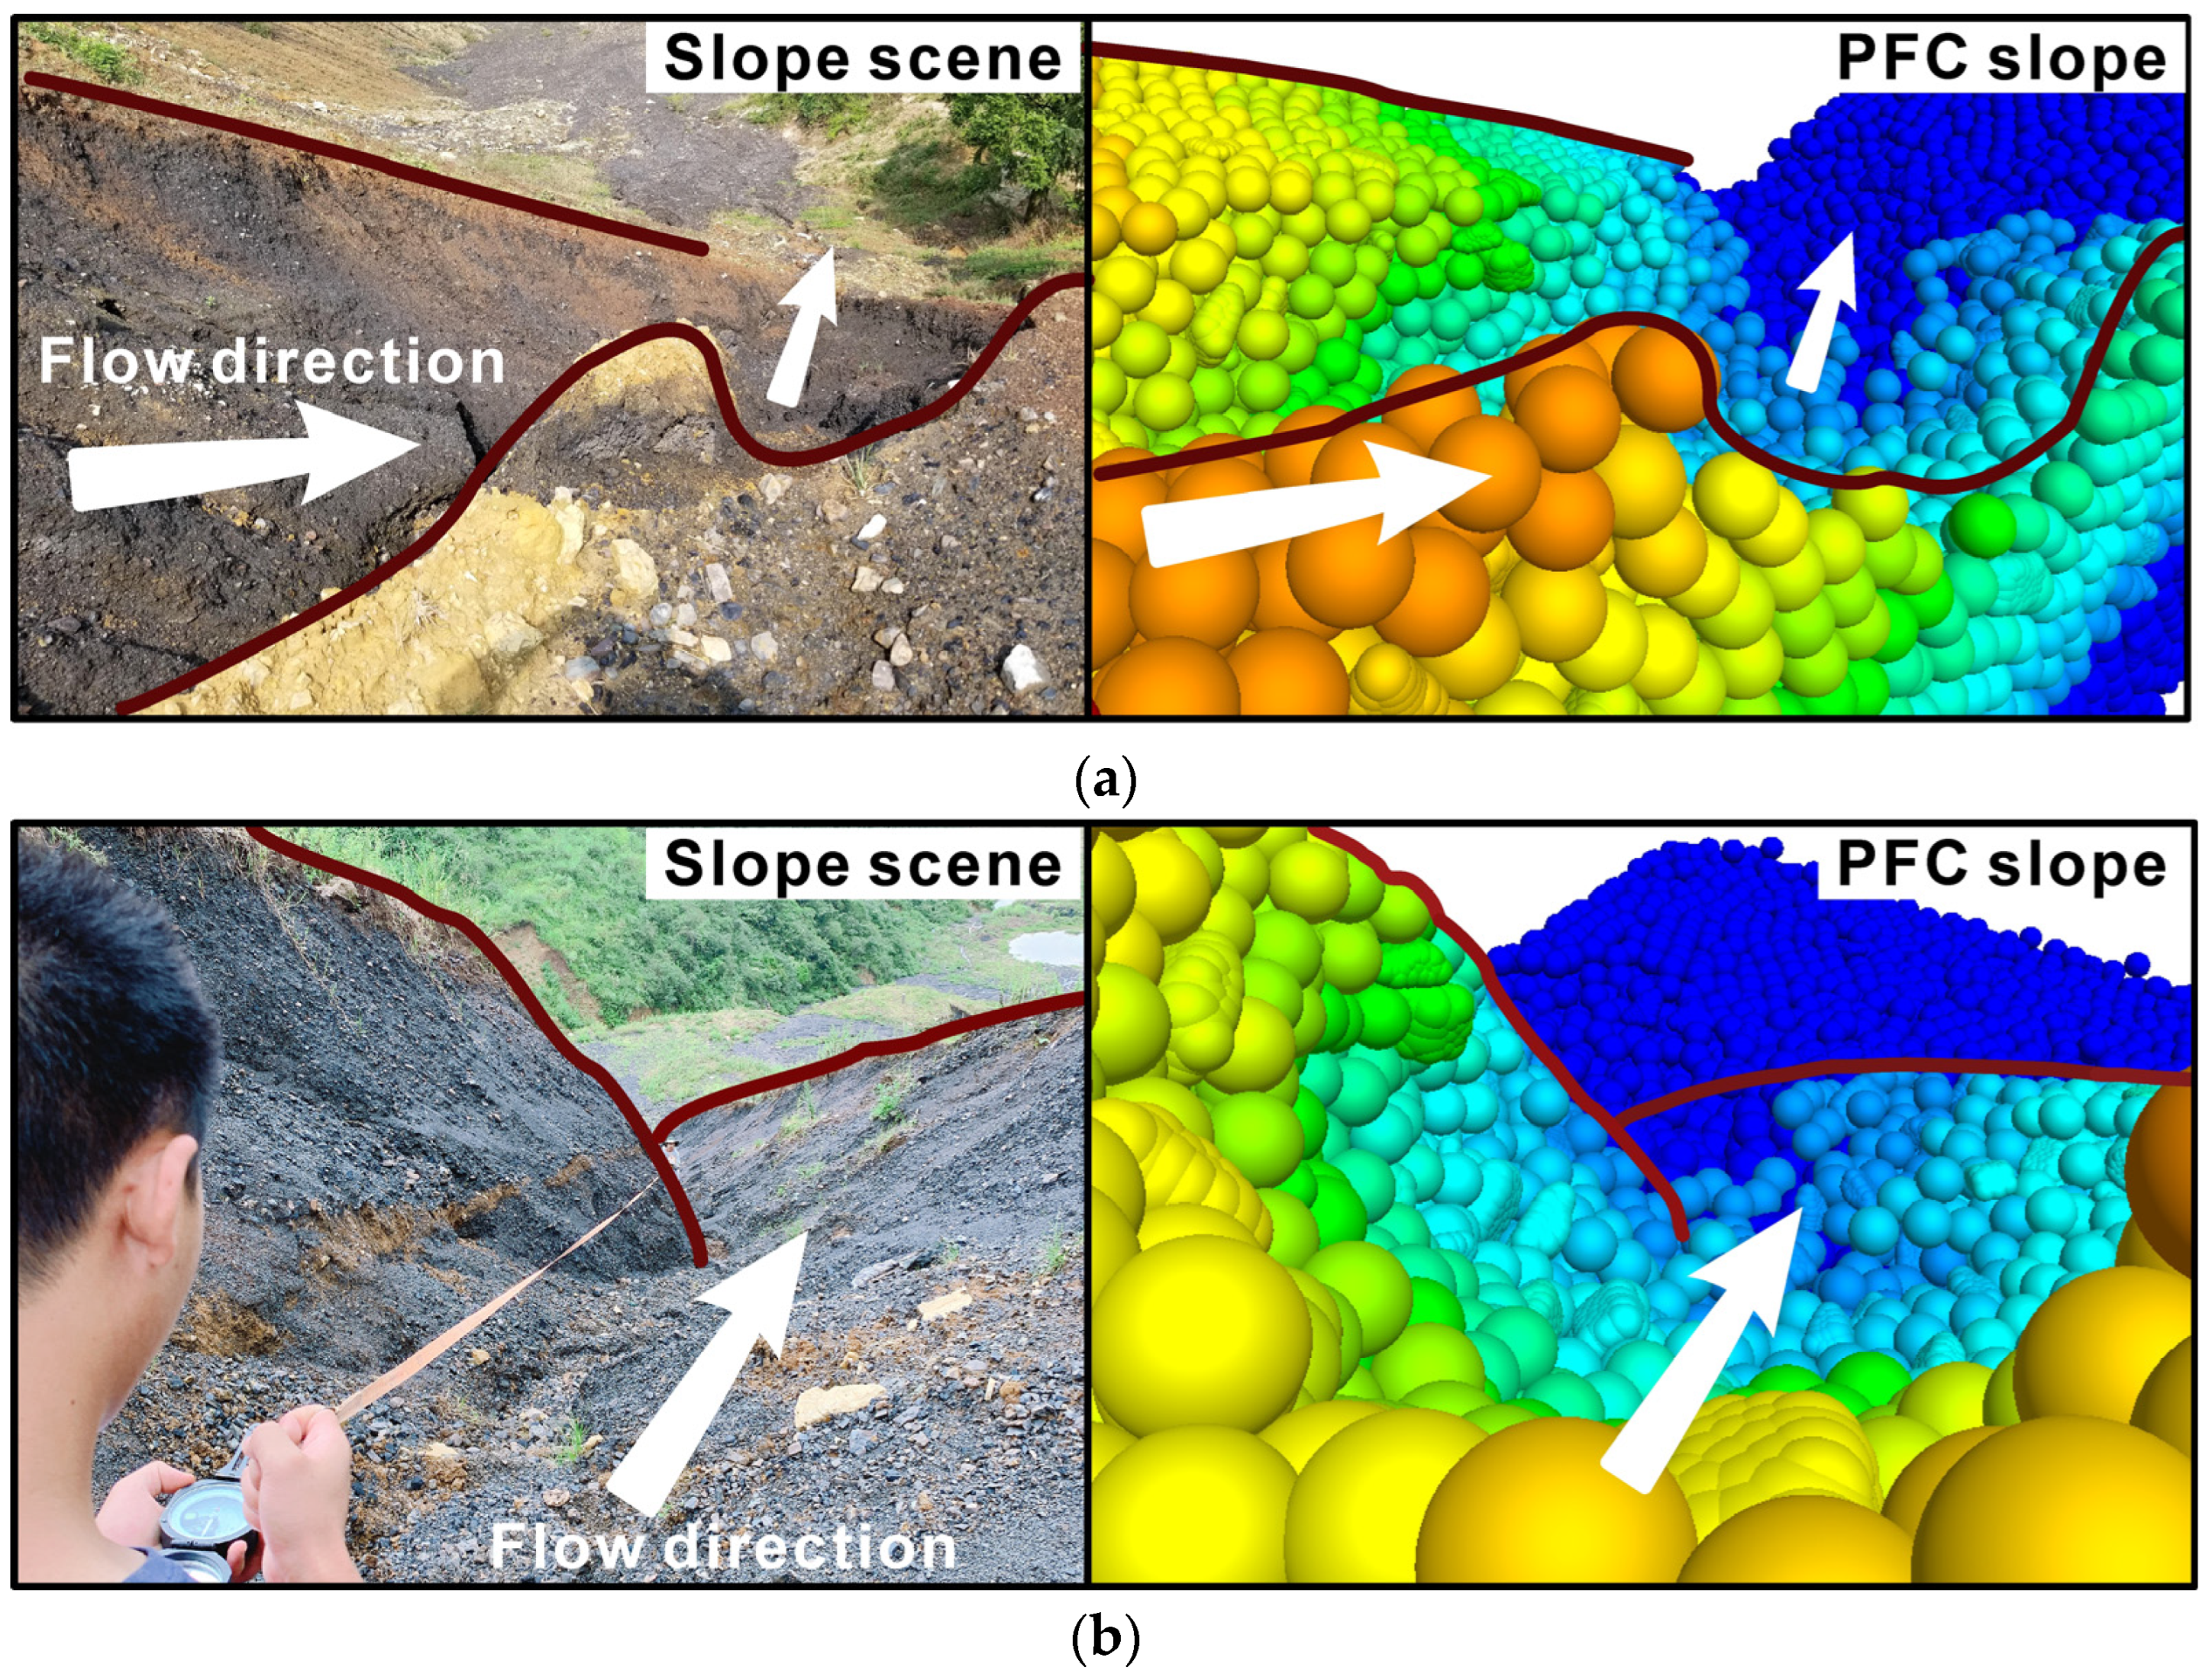
There are two modes of erosion accumulation integration, namely, the arc erosion accumulation mode and the fan erosion accumulation mode. Arc-shaped erosion and accumulation are mainly controlled by deep particles, and fan-shaped erosion and accumulation are mainly affected by shallow particles. In the actual process of rainfall erosion, most of the slope erosion and failure modes show the effect of multi-ditch collection. The main stream gully mainly controls arc-shaped or linear erosion and accumulation. Due to their complex roles in the slope, the interaction between laminar flow and turbulent flow is intense, providing conditions for the development of tributaries and further forming the fan erosion and accumulation model. This provides favorable conditions for a more effective study of the internal mechanisms of coal gangue scouring and accumulation.

Author Contributions

Conceptualization, Y.W.; Software, H.L.; Formal analysis, H.W. and H.Z.; Investigation, L.H.; Writing – original draft, Y.T. All authors have read and agreed to the published version of the manuscript.

Funding

This work has been supported by the Sichuan Provincial Science and Technology Plan Project - Key R&D Project "Research and Demonstration of Moderate Remediation and Comprehensive Treatment Technology for Surface Source Pollution in the Collapse Platform Area of Central Sichuan Hills" (2023YFS0365).

Data Availability Statement

The datasets generated for this study are available from the corresponding author upon reasonable request.

Acknowledgments

The authors of this work are grateful for the experimental help provided by the State Key Laboratory of Geohazard Prevention and Geoenvironment Protection. We also thank Yong Wu for his support for this research.

Conflicts of Interest

The authors declare that they have no conflict of interest.

References

  1. Liu, J. Reflection on lowcarbon development of coal energy in china. J. China Univ. Min. Technol. Soc. Sci. 2011, 13, 5–12. [Google Scholar]
  2. Zhou, H.C. The comprehensive utilization of coal gangue should pay attention to demand orientation. Environ. Life 2020, 12, 78–81. [Google Scholar]
  3. Jia, M. The current situation research on comprehensive utilization of coal gangue. Conserv. Util. Miner. Resour. 2019, 39, 46–52. [Google Scholar]
  4. Dong, Q.; Liu, D. Nonlinear plasticity limit analysis upper bound method of gangue hill stability. J. China Coal Soc. 2007, 32, 131–135. [Google Scholar]
  5. Li, D.; Liu, D.; Wang, Y. Plastic upper bound theory reliability analysis of coal gangue hills. J. Chongqing Univ. 2008, 31, 1441–1445. [Google Scholar]
  6. Ju, N.; He, X. Study on coal gangue stability and disaster prevention measures. Geol. Explor. 2010, 46, 142–146. [Google Scholar]
  7. Zang, Y.; Liu, D.; Jiang, K. Characteristics of rainfall infiltration and stability of gangue hills in Chongqing mountainous area. China Civ. Eng. J. 2009, 42, 85–89. [Google Scholar]
  8. Yang, M.; Wu, M.; Li, J.; Wu, R.; He, Y. Calibration of mechanical parameters of granular gangue and stability analysis of gangue dump slope. Saf. Coal Mines 2021, 52, 232–236. [Google Scholar]
  9. Hurly, D.G.; Pantelis, G. Unsaturated and saturated flow through a thin porous layer on a hillslope. Water Resour. Res. 1985, 21, 821–824. [Google Scholar] [CrossRef]
  10. Li, N.; Xu, J.; Qin, Y. Research on calculation model for stability evaluation of rainfall- -induced shallow landslides. Rock Soil Mech. 2012, 33, 1485–1490. [Google Scholar]
  11. Chen, X. Analysis Methods for Slope Stability and Prediction for Landslide Intensity. Ph.D. Thesis, Tsinghua University, Bejjing, China, 2007. [Google Scholar]
  12. Li, L.; Zhao, R.; Wang, T.; Zhao, H.; Wang, M. Simulation study on grain flow of soil slope deformation and failure under rainfall. Sci. Technol. Eng. 2020, 20, 8496–8502. [Google Scholar]
  13. Li, S.; Liu, T.; Liu, X. Analysis method for land-slide stability. Chin. J. Rock Mech. Eng. 2009, 28, 3309–3324. [Google Scholar]
  14. Tingwen, H.; Jun, L.; Xiaopeng, K. Stability analysis of high slope of jointed open-pit mine under rainfall conditions. Sci. Technol. Eng. 2019, 19, 75–80. [Google Scholar]
  15. Wang, R.B.; Xia, R.; Qi, J. Numerical analysis of seep-age stability of hydrodynamic-induced landslide deposits. J. China Three Gorges Univ. Nat. Sci. 2019, 41, 50–54. [Google Scholar]
  16. Dongfang, T.; Hong, Z.; Defu, L. 2D FEM numerical simulation of rainfall infiltration for landslide with considering runoff effect and its application. Rock Soil Mech. 2016, 37, 1179–1186. [Google Scholar]
  17. Xin, T.; Ran, F.; Hong, L. Effects analysis of rainfall on landslide stability and drainage measures suggestion. Geotech. Eng. Tech. 2021, 35, 52–55, 59. [Google Scholar]
  18. Tangjin, Y.; Yiyuan, L.; Zewen, W.; Junjie, L.; Yan, L. Study on instability mechanism of rolling slope under rainfall condition. Sci. Eng. 2021, 21, 3513–3519. [Google Scholar]
  19. Chenghua, W.; Zhengyi, W.; Chenglin, Z. Tests and numerical simulations of non-orthogonal rainfall infiltration on surfaces of unsaturated sand slopes. Chin. J. Geotech-Nical. Eng. 2015, 37, 1357–1364. [Google Scholar]
  20. Zeng, L.; Shi, Z.N.; Fu, H.Y.; Bian, H.B. Influence of rain-fall infiltration on distribution characteristics of slope transient saturated zone. China J. Highw. Transp. 2017, 30, 25–34. [Google Scholar]
  21. Shiau, J.; Lai, V.Q.; Keawsawasvong, S. Multivariate adaptive regression splines analysis for 3D slope stability in anisotropic and heterogenous clay. J. Rock Mech. Geotech. Eng. 2022, in press. [Google Scholar] [CrossRef]
  22. Yodsomjai, W.; Keawsawasvong, S.; Thongchom, C.; Lawongkerd, J. Undrained stability of unsupported conical slopes in two-layered clays. Innov. Infrastruct. Solut. 2020, 6, 15. [Google Scholar] [CrossRef]
  23. Chen, H.-W.; Chen, C.-Y. Warning Models for Landslide and Channelized Debris Flow under Climate Change Conditions in Taiwan. Water 2022, 14, 695. [Google Scholar] [CrossRef]
  24. Hai, W.; Qian, J.; Weijun, W.; Nong, Z.; Yiming, Z. Experimental Test on Nonuniform Deformation in the Tilted Strata of a Deep Coal Mine. Sustainability 2021, 13, 13280. [Google Scholar]
  25. Weijian, Y.; Ke, L.; Ze, L.; Baifu, A.; Ping, W.; Hai, W. Mechanical characteristics and deformation control of surrounding rock in weakly cemented siltstone. Environ. Earth Sci. 2021, 80, 337. [Google Scholar]
  26. Yanlin, Z.; Chunshun, Z.; Yixian, W.; Hang, L. Shear-related roughness classification and strength model of natural rock joint based on fuzzy comprehensive evaluation. Int. J. Rock Mech. Min. Sci. 2021, 137, 104550. [Google Scholar]
  27. Zhao, Y.; Wang, Y.; Wang, W.; Tang, L.; Liu, Q.; Cheng, G. Modeling of rheological fracture behavior of rock cracks subjected to hydraulic pressure and far field stresses. Theor. Appl. Fract. Mech. 2019, 101, 59–66. [Google Scholar] [CrossRef]
  28. Hu, M.J.; Wang, R.; Meng, Q.S.; Liu, G.S. Gravelly soil slope surface shape and criticality under rainfall conditions. Rock Soil Mech. 2006, 27, 1550–1553. [Google Scholar] [CrossRef]
  29. Liu, B.Y.; Nearing, M.A.; Risse, L. Slope gradient effects on soil loss for slopes. Trans. ASCE 1994, 37, 34–39. [Google Scholar]
  30. Luo, B.; Wang, B.G.; Wang, X.C. Basic theory of side slope surface scouring. J. Highw. Transp. Res. Dev. 2002, 19, 27–29. [Google Scholar]
  31. Khan, K.U.J.; Wang, C.-M.; Khan, M.W.J.; Liang, Z.; Li, S.; Li, B.-L. Influence of rainfall infiltration on the stability of unsaturated coal gangue accumulated slope. J. Mt. Sci. 2021, 18, 1696–1709. [Google Scholar] [CrossRef]
  32. Wu, G.Y.; Zhu, Z.H.; Cheng, J.; Wu, R.N.; Zhang, Y.S.; Wu, F.Q. Preliminary study on rainfall erosivity in the southern loess plateau. J. Soil Water Conserv. 2011, 25, 33–38. [Google Scholar] [CrossRef]
  33. Tang, D.; Li, D.Q.; Cao, Z.J. Slope stability analysis in the Three Gorges Reservoir area considering effect of antecedent rainfall. Georisk: Assess. Manag. Risk Eng. Syst. Geohazards 2017, 11, 161–172. [Google Scholar] [CrossRef]
  34. Shruti NaiduNaidu, S.; Sajinkumar, K.; Oommen, T.; Anuja, V.; Samuel, R.A.; Muraleedharan, C. Early warning system for shallow landslides using rainfall threshold and slope stability analysis. Geosci. Front. 2018, 9, 1871–1882. [Google Scholar] [CrossRef]
  35. Suradi, M.; Fourie, A.B.; Saynor, M.J. An experimental and numerical study of a landslide triggered by an extreme rainfall event in northern Australia. Landslides 2015, 13, 1125–1138. [Google Scholar] [CrossRef]
  36. Yun, T.; Yong, W.; Jiangyu, L.; Xueling, L.; Dafu, X.; Futao, Z.; Qi, F. Characterization of the Erosion Damage Mechanism of Coal Gangue Slopes through Rainwater Using a 3D Discrete Element Method: A Case Study of the Guizhou Coal Gangue Slope (Southwestern China). Appl. Sci. 2022, 12, 8548. [Google Scholar]
  37. Lin, J.Z.; Ruan, X.D.; Chen, B.G.; Wang, J.P.; Zhou, J.; Ren, A.L. Fluid Mechanics, 2nd ed.; Tsinghua University Press: Beijing, China, 2013. [Google Scholar]
  38. Shen, S.J.; Sun, H.Y.; Shang, Y.Q.; Zhong, J.; Huang, J. Scouring-Penetration Coupling Analysis Of Embankment Slope Under Rainfall Action. Chin. J. Rock Mech. Eng. 2011, 30, 2456–2462. [Google Scholar]
  39. Wu, C.G. Hydraulics; Higher Education Press: Beijing, China, 2003; pp. 268–281. (In Chinese) [Google Scholar]
  40. Li, J.M. 3D Fabric Spatiotemporal Evolution Characteristics and Transparent Characterization of Gangue Solid Waste Backfilling Material during Compression; China University of Mining and Technology: Xuzhou, China, 2020. [Google Scholar]
  41. Yong, R.; Qin, J.-B.; Huang, M.; Du, S.-G.; Liu, J.; Hu, G.-J. An Innovative Sampling Method for Determining the Scale Effect of Rock Joints. Rock Mech. Rock Eng. 2019, 52, 935–946. [Google Scholar] [CrossRef]
  42. Jun, P.; Guan, R.; Ming, C.; Kun, P. Determination of residual strength of rocks by abrittle index. Rock Soil Mech. 2015, 36, 403–408. [Google Scholar]
  43. Wu, Q.; Wang, C.M.; Song, P.R.; Zhu, H.B.; Ma, D.H. Rainfall erosion experiment for steep loess slope and fluid-soil coupling simulation with PFC3D. Rock Soil Mech. 2014, 35, 977–984. [Google Scholar] [CrossRef]
Figure 1. Principle of the washout assay.
Applsci 13 05066 g001
Figure 2. Top view of the site.
Applsci 13 05066 g002
Figure 3. Gully no. 5.
Applsci 13 05066 g003
Figure 4. Generation and evolution effects of clump 1. (a). Coal gangue real shot; (b). ratio = 0.5, distance = 100; (c). ratio = 0.5, distance = 110; (d). ratio = 0.5, distance = 130; (e). ratio = 0.3, distance = 100; (f). ratio = 0.3, distance = 120; (g). ratio = 0.3, distance = 145; (h). ratio = 0.5, distance = 160.
Applsci 13 05066 g004
Figure 5. Generation and evolution effects of clump 2. (a). Coal gangue real shot; (b). ratio = 0.5, distance = 100; (c). ratio = 0.5, distance = 110; (d). ratio = 0.5, distance = 130; (e). ratio = 0.3, distance = 100; (f). ratio = 0.3, distance = 120; (g). ratio = 0.3, distance = 145; (h). ratio = 0.5, distance = 160.
Applsci 13 05066 g005
Figure 6. Schematic diagram of the triaxial test.
Applsci 13 05066 g006
Figure 7. Stress–strain curves of the numerical triaxial tests of the gangue.
Applsci 13 05066 g007
Figure 8. Comparison between the attenuation value and attenuation coefficient of the coal gangue.
Applsci 13 05066 g008
Figure 9. PFC3D coal-waste slope model and monitoring arrangement.
Applsci 13 05066 g009
Figure 10. PFC3D fluid–solid coupling scouring scheme.
Applsci 13 05066 g010
Figure 11. Gully formation process. (A-Catchmentarea; B-Rainfallscouring area; C-Catchmentarea).
Applsci 13 05066 g011
Figure 12. Comparison of the gully simulated by the site and by the PFC. (a) comparison Figure 1, (b) comparison Figure 2.
Applsci 13 05066 g012
Figure 13. Comparison diagram of scouring depth curves.
Applsci 13 05066 g013
Figure 14. Comparison diagram of the final damage boundary.
Applsci 13 05066 g014
Figure 15. Displacement curves of monitoring points. (a) Y-direction horizontal displacement of the slope surface, (b) Y-direction horizontal displacement of the deep slope, (c) Z-direction horizontal displacement of the slope surface, and (d) Z-direction horizontal displacement of the deep slope.
Applsci 13 05066 g015aApplsci 13 05066 g015b
Figure 16. Percentage of the peak displacement of the monitoring points. (a) Proportion of peak displacement in the Y-direction. (b) Proportion of peak displacement in the Z-direction.
Applsci 13 05066 g016
Figure 17. Movement trajectories of the monitoring particles.
Applsci 13 05066 g017
Figure 18. Gully distribution and accumulation mode. (a). Two gully directions; (b). Erosion trend-arc trend; (c). Erosion trend-alluvialfan trend.
Applsci 13 05066 g018
Figure 19. Real-time stress–strain curves. (a) stress, (b) strain.
Applsci 13 05066 g019
Figure 20. Peak stress and strain. (a) peak stress, (b) peak strain.
Applsci 13 05066 g020
Table 1. PFC particle sizing.
Granule GroupCoarse ParticlesMedium ParticlesFine ParticlesClump 1Clump 2
Particle size (m)2.0–2.51.5–2.01.0–1.52.0–3.02.0–3.0
Content (%)1050101515
Table 2. Comparison of triaxial macroscopic mechanical parameters.
Test MethodConfining Pressure (Kpa)Peak Stress Difference (KPa)Peak Stress
(Kpa)
Residual Stress
(Kpa)
Attenuation Value (Kpa)Attenuation
Coefficient
Cohesion
(Kpa)
Real100300400250500.1733.17
200455650400550.12
300660960600600.09
PFC100280380240400.1430.18
200456670395610.13
300660960595650.10
Table 3. Mesoscopic parameters of the PFC model of gangue.(D is particle density; E * is contact elastic modulus; K * is stiffness ratio; μ is friction coefficient; λ is parallel bonding radius product factor; Kc * is parallel bonding stiffness ratio; Ec * is elastic modulus of parallel bonding; σ ¯ c is parallel bonding tensile strength; c ¯ is parallel bonding force; φ ¯ is parallel bonding friction angle; dw is fluid density; vs is fluid viscosity coefficient.)
D
/kg·m−3
E *
/Gpa
K *μλKc *Ec *
/Gpa
σ ¯ c
/Mpa
c ¯
/Mpa
φ ¯
dw
/kg·m−3
vs
30001.21.00.751.001.0108.611261.02.5 × 10−2
Disclaimer/Publisher’s Note: The statements, opinions and data contained in all publications are solely those of the individual author(s) and contributor(s) and not of MDPI and/or the editor(s). MDPI and/or the editor(s) disclaim responsibility for any injury to people or property resulting from any ideas, methods, instructions or products referred to in the content.

