1. Introduction
Outdoor advertising is a form of marketing that uses public spaces as a platform for advertising messages [
1,
2,
3]. It involves placing ads on outside structures, such as billboards, bus stops, and bus shelters, and in public spaces, such as parks, streets, and transit stations [
4,
5]. The aim of outdoor advertising is to capture the attention of potential customers, to create brand recognition, and to increase sales [
6,
7]. The main characteristic of outdoor advertising is its ability to reach a wide variety of people in a short amount of time. It is often used in combination with other forms of marketing channels, such as television, radio, and print. In other words, outdoor advertising can also be used to support other marketing activities such as digital, radio, and television by creating a unified message [
8,
9].
The main advantages of outdoor advertising for businesses are the following:
Cost-effective: Outdoor advertising is often more cost-effective than some forms of advertising. This is because the cost of producing the ad is lower than other forms of advertising, such as television and radio [
10,
11].
Reach: Outdoor advertising such as billboards and posters can reach a large and diverse audience [
12,
13].
Visibility: Outdoor ads are highly visible, especially if placed in a high-traffic area. This visibility helps to ensure that message reaches more people [
14,
15].
Flexibility: Outdoor advertising allows for considerable flexibility when it comes to design, content, and placement [
16].
Immediate: Outdoor advertising’s immediacy is one of its most attractive features. Message is seen immediately and can be changed quickly if needed [
17,
18].
Branding: Outdoor advertising can be used to reinforce brand identity and to create an impression on potential customers [
19,
20].
Considering the benefits mentioned, it is possible to list the drawbacks of outdoor advertising:
Cost: Even if it may be cost-effective in comparison with some forms of marketing, outdoor advertising is still a relatively expensive form of advertising and may not be affordable for some businesses [
21,
22].
Limited Reach: Outdoor advertising can only reach people who are within the vicinity of the advertisement. It is not possible to target a specific audience with outdoor advertising [
23,
24].
Short-Lived: Outdoor advertisements are often only visible for a few seconds or minutes before the person passes by. As a result, it is not possible to leave a lasting impression on the viewer [
25,
26].
Environmental Impact: Outdoor advertising can have a negative environmental impact if not managed properly. Excessive billboards and signs can create visual clutter and pollution in an area [
27,
28].
The history of outdoor advertising dates back to times when merchants used painted signs and other forms of advertising to promote their wares. Since the 1920s, billboard companies have used a variety of techniques to create eye-catching displays, including painted signs, neon lighting, and even 3D displays [
29].
In general, and as it was already mentioned, standard outdoor advertising includes billboards, bus wraps, bus benches, murals, neon signs, yard signs, street banners, digital displays, and vehicle wraps. Billboards are typically placed on major highways and are large and captivating. Bus wraps are one of the most popular forms of outdoor advertising, and involve wrapping a bus in an advertisement. Bus benches are placed in high-traffic areas and allow commuters to sit and observe the ad that is a part of the bench while they wait for the bus. Murals are large, eye-catching paintings that are placed in high-traffic areas. Neon signs, yard signs, and street banners are also popular forms of outdoor advertising and are usually part of the overall composition of city streets. Digital displays, such as digital billboards and digital signs, are also becoming increasingly popular. Vehicle wraps are used to turn cars and other vehicles into moving billboards [
30,
31].
There are several factors impacting the use of outdoor advertising from the point of view of advertisers. Most vocal are the following:
Location: Outdoor advertising is most effective when it is placed in areas where it will be seen by the largest number of people. High-traffic areas, such as major highways and intersections, are the most common location for outdoor advertising [
32,
33].
Visibility: Outdoor advertising must be seen in order to be effective. Factors such as size, brightness, and contrast can all influence how visible an advertisement is [
34,
35].
Weather: Weather can impact the visibility of outdoor advertising, as well as how long it lasts. Rain and wind can cause signs to fade or become damaged over time, reducing their effectiveness [
36].
Cost: Outdoor advertising can be expensive, and this can be a major factor in determining whether a company opts to use it [
21,
24].
Target Audience: Companies should consider the demographics and interests of their target audience when selecting their outdoor advertising locations. This will help ensure that the advertisement reaches the right people [
37,
38].
Outdoor advertising can have a powerful impact on consumer behaviour. It can serve as a reminder of brand presence, create brand awareness, and influence brand recognition and loyalty. Outdoor advertising can also encourage impulse buying and provide information about special offers, new products, and services. Additionally, it can be used to increase customer engagement and to create a sense of urgency. Outdoor advertising can also create positive associations with a brand, making it more likely that consumers will think of the brand when making purchase decisions. It can drive traffic to a website or physical location and increase overall sales [
39,
40].
Several determinants of outdoor advertising play a role in consumer decision making, including the location of the advertisement, the message conveyed, the size and design of the ad, and the target audience. The location of an advertisement can have a significant effect on the visibility of the ad, as well as its ability to reach the intended audience. The message an ad conveys is also important, as it helps to shape the consumer’s perception of the product or service being advertised. The size and design of an ad can also influence its effectiveness, as an ad that stands out and is easily recognizable can have a greater impact. The target audience of an ad is also critical, as it can influence the types of images, language, and overall message used to appeal to the intended demographic [
16,
41,
42].
Based on a review of the open access publications that we conducted in this article, we can summarize the scope of research regarding outdoor advertising as follows:
Many studies deal with the right placement of outdoor advertising, its visuals, costs, and regulation [
11,
12,
15,
16,
21,
32,
41].
A lot of authors perceive outdoor advertising as visual smog and deal with its negative impact on the environment and society [
10,
13,
20,
27,
28].
Other studies deal with how outdoor advertising promotes the language and culture of chosen regions such as Malaysia [
18], the disparities of the outdoor advertising when aimed on different racial and ethnic groups in the USA or Indonesia [
19,
25,
37], or unethical content in outdoor advertising and its negative social impact [
33,
34].
Further research is focused on the impact of outdoor advertising on driving or riding experience [
14,
36].
We found only three articles that examined the influence of outdoor advertising on purchasing decisions and the targeting of outdoor advertising for the right customer [
26,
38,
40].
This means that, as a conclusion from the conducted analysis of given articles, we identified the following research information gaps dedicated to the impact of outdoor advertising on consumer behaviour:
Lack of data on the long-term impact of outdoor advertising on consumer behaviour;
Lack of information on the influence of outdoor advertising on different demographic groups;
Insufficient data on how outdoor advertising is perceived by consumers in different regions;
Limited research on how outdoor advertising affects the purchase decision of consumers;
Lack of research into the effectiveness of outdoor advertising compared with other forms of advertising.
By merging statements two and three, we formulated our research basis. Our research is centred around the research problem of understanding how various outdoor advertisements influence consumer behaviour in a particular city in Slovakia. As such, the main objective of this paper is to evaluate the effects of outdoor advertising on consumer behaviour in a chosen city in Slovakia, with a focus on online shopping. By fulfilling the information gaps, we provide an insight into the topic, which may be beneficial not only to the scientific community but also to the practitioners of outdoor advertising.
2. Materials and Methods
There are several methods with which we can analyse the impact of outdoor advertising on consumer behaviour. A mapping service is a technology that can be used to determine the location of outdoor advertising, as well as to analyse data from various sources such as census data, traffic patterns, and demographics. Another method of heat mapping is a technique used to identify the most effective locations for outdoor advertising. Data such as traffic patterns, demographic information, and other relevant details can be used to identify areas that are more likely to be exposed to an advertisement. An eye-tracking analysis is another method that involves the use of eye-tracking technology to measure where viewers are looking when they encounter outdoor advertising. This can provide valuable insight into which elements of an advertisement are most effective. By tracking the eye movements of viewers, researchers can determine which elements of the ad are attracting attention, how long viewers are looking at different parts of the ad, and how the ad is affecting their overall impression. Classic marketing methods of surveys can also be used. Surveys can be conducted to determine the effectiveness of outdoor advertising. Questions can be asked to gauge how viewers responded to specific elements of an advertisement, as well as to determine if the ad was memorable [
43,
44,
45].
In this study, we combined and used all of these methods, and thus, we created a sequence of steps in which the usage of methods is highlighted (
Figure 1). Following each of these steps contributed to reaching the main goal of the article.
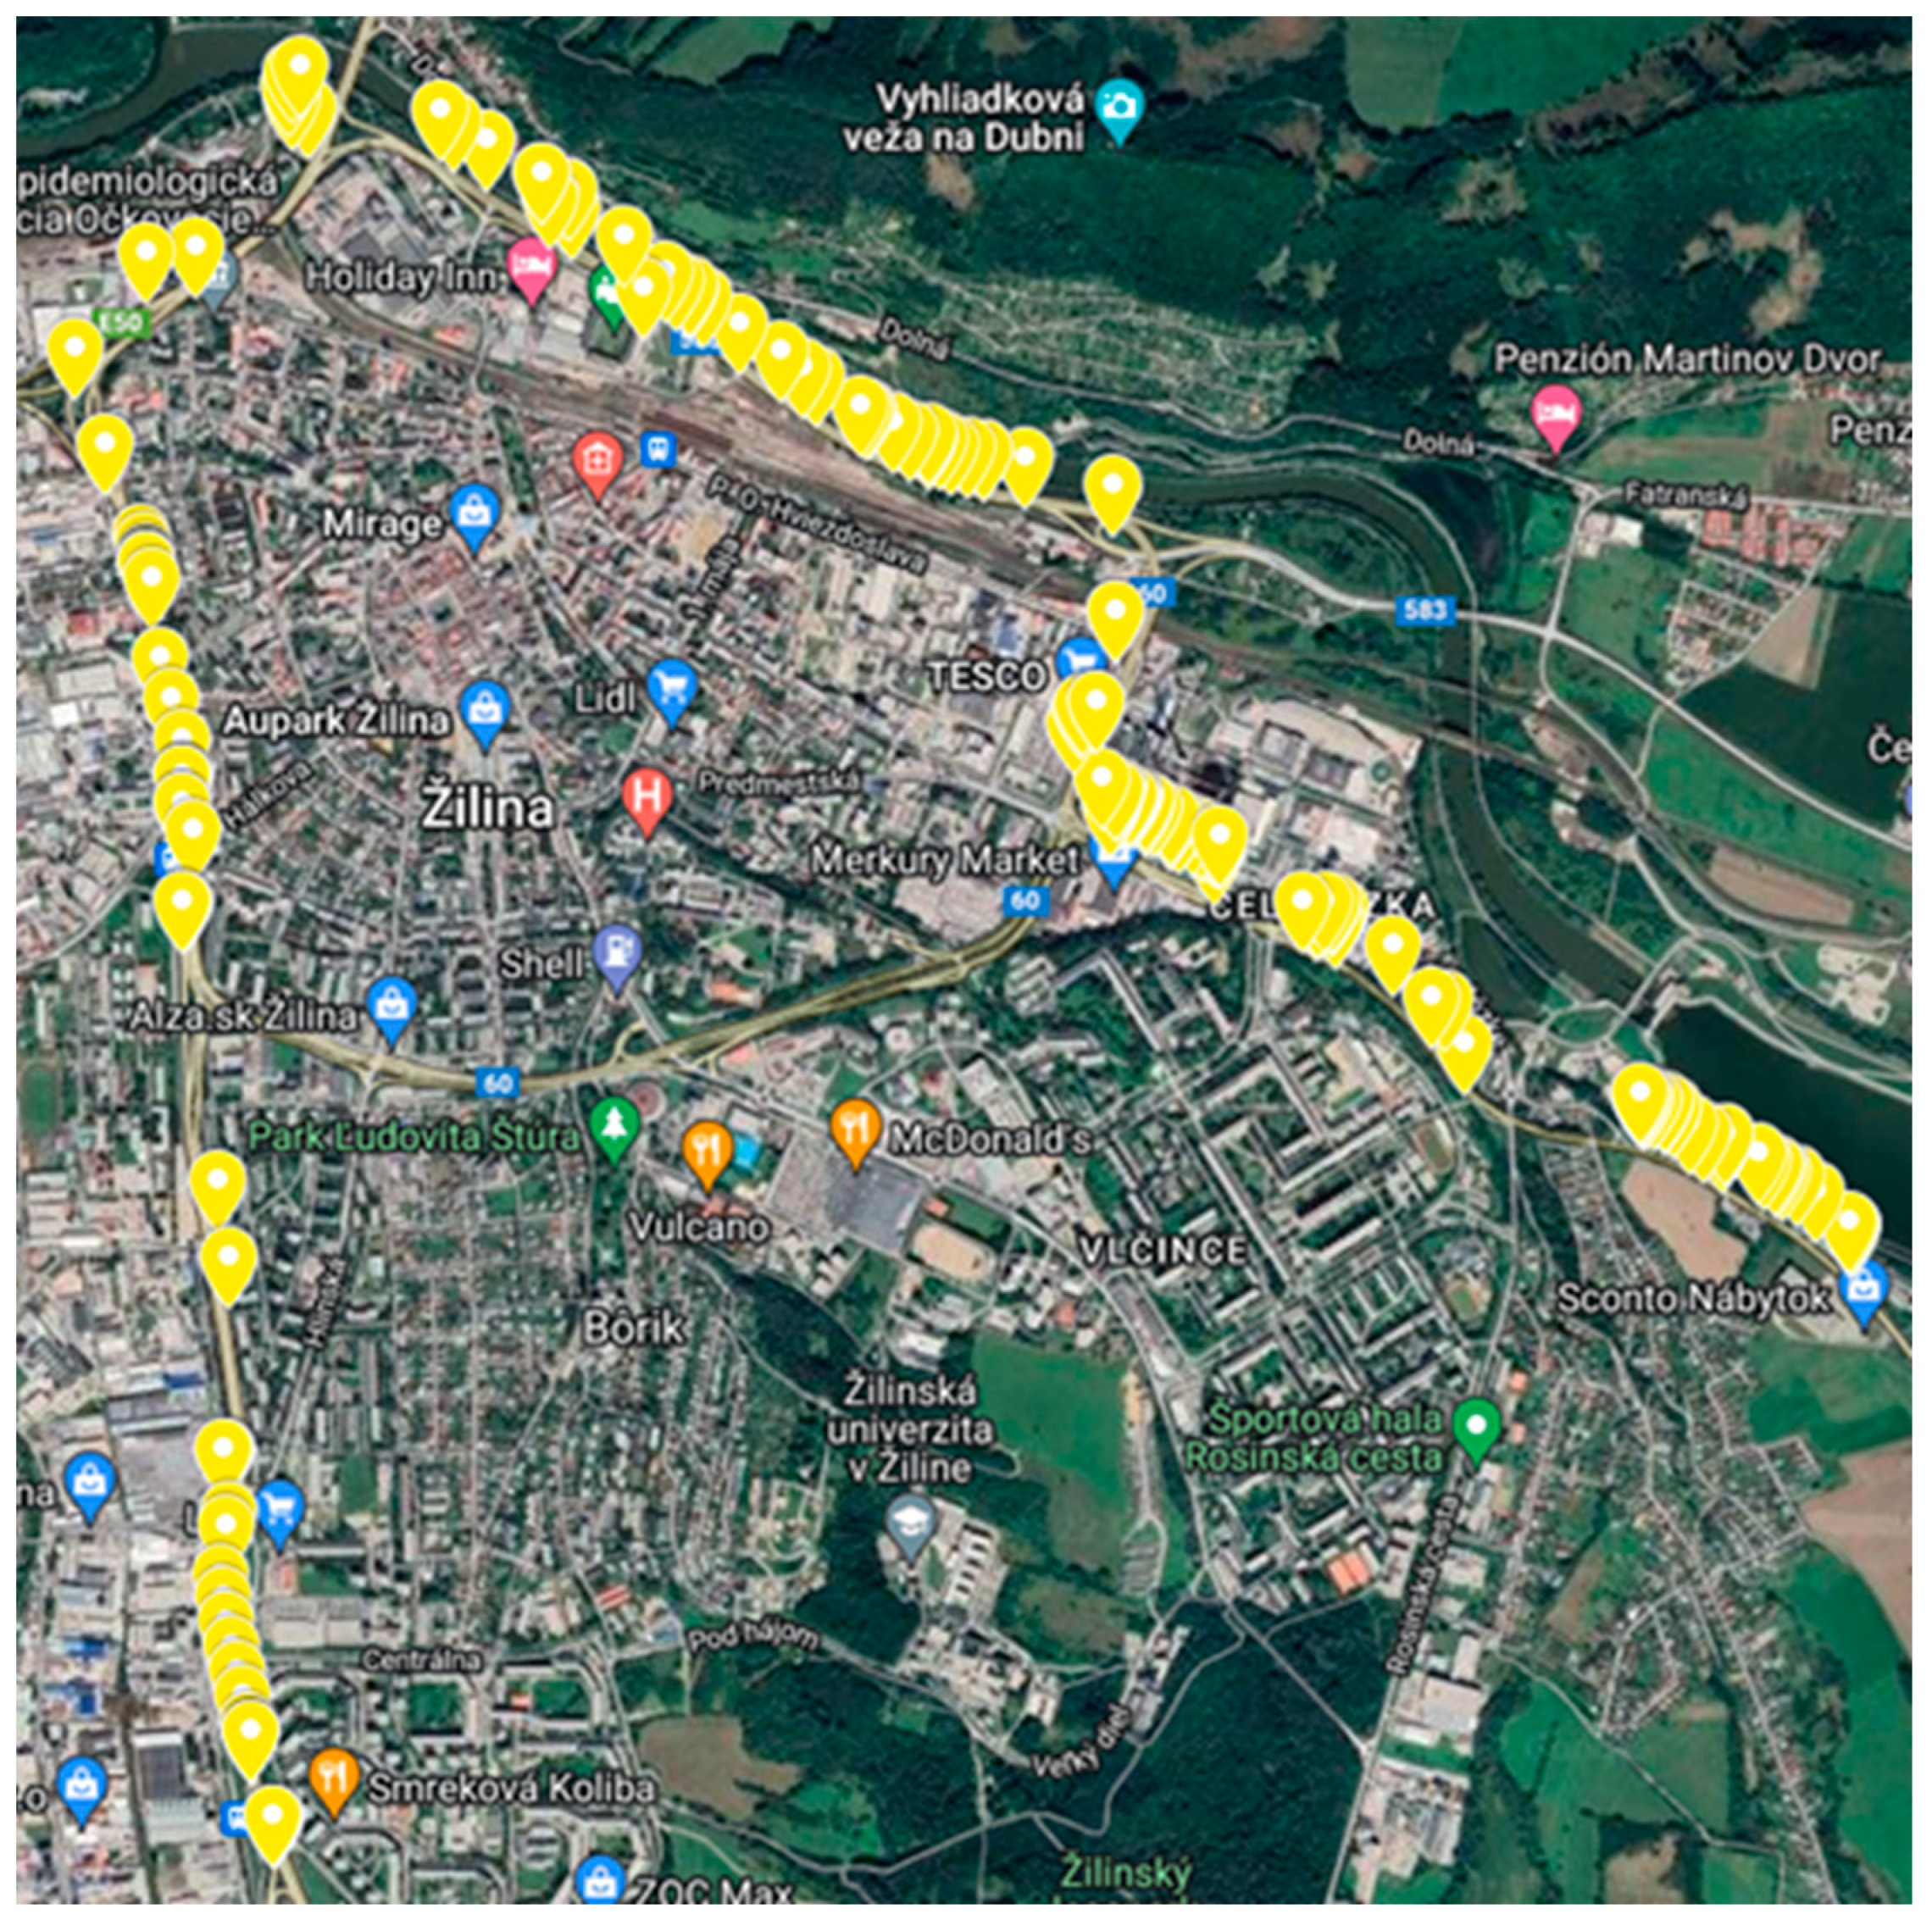
The first step consists of the identification of routes of the selected city, which is the city of Žilina. Identifying the routes of the Slovakian city of Žilina, we employed Google Maps to distinguish the external and internal circuits. Our subsequent task was to assess the density of outdoor advertisements by personally traversing the predetermined sections of the outer and inner circuits. Our analysis of the situation in Žilina allowed us to determine the prevalence of outdoor advertisements.
The inner circuit consists of the following streets (
Figure 2): Legionárska–J. M. Hurbana–Kálov–P. O. Hviezdoslava–1. Mája–Veľká Okružná. In the inner circuit, 29 large-format advertisements were recorded: 28 billboards and 1 bigboard.
Over time, some outdoor advertising can disappear due to many factors, such as weather damage, vandalism, or changes in the environment. The materials used in outdoor advertising are usually not designed to last forever, so they can deteriorate over time. Thus, we conducted a second analysis that revealed that 4 billboards had been removed in the meantime. Of the 25 large-format advertisements located on route, compared with the original analysis, the following was recorded: 10 same advertisements; 8 advertisements from the same advertiser but different advertisements (the company remained the same, but the product, visual, etc. changed); and 7 other advertisements.
The outer circuit consists of the following streets (
Figure 3): Košická–Na Horevaží–Ľavobrežná–Estakáda–Rajecká. This circuit had 72 large-format advertisements, of which 55 were billboards, 16 were bigboards, and 1 was a megaboard.
Again, due to the same assumption as for the inner circuit, we conducted a second analysis. The analysis revealed that 4 billboards had been removed. Compared with the original analysis, the outer circuit now had 15 same advertisements; 10 advertisements from the same advertiser but a different advertisement; and 43 other advertisements or empty advertising carriers. It is evident that the advertisements on the outer circuit have changed significantly during the period between the first and second analyses. Almost 80% of the 72 analysed advertisements were changed or removed.
The outer circuit of Žilina connects the city from north to south and from east to west, while the inner circuit creates a circular connection between the outer suburbs and the city centre. Together, these roads are essential for the functioning of the city. Žilina is an indispensable transportation hub in the northern part of Slovakia, boasting a large central railway station and numerous significant railway lines. Furthermore, Žilina is also a crucial crossroads for road traffic, with major highways leading to the Czech Republic, Poland, and Austria.
The positive aspects of both circuits are the placement of advertisements on both sides of the road. There are also many billboards and bigboards on the selected routes, as well as large-format banners placed on buildings and various banners. The necessary variety of outdoor advertising is provided by the location of the individual routes, since the research took place in the centre of the city, in its outskirts, and on highway exits (so-called freeways).
The second step in the research process was the formulation of a questionnaire for the participants to complete. Querying their opinions, the questions sought to identify: (1) whether the individual is conscious of external advertising while driving; (2) what aspect of external advertising most catches their eye (graphics, slogan, logo, colours, size of the carrier, etc.); (3) the level of awareness of the impact of external advertising on their buying behaviour; (4) whether their purchasing decisions are swayed by external advertising; and (5) the frequency of their online shopping habits (daily, weekly, monthly, etc.).
The questionnaire was filled out after the research commenced. The research itself centred on examining the effect of external advertising placed on selected routes on the attention of research participants while driving a car. Attention can be understood in terms of how it alters drivers’ perception of the environment.
The third step in the process was to define the criteria for conducting an A/B test. A/B testing is a scientific approach to comparison, in which two versions of a particular element—such as a logo, product, graphic visual, or slogan—are evaluated against each other to determine which version performs better [
46]. The randomly assigned participants of the study were presented with elements A and B after the completion of their drive, both on the outer and inner circuits. Subsequently, the drivers were asked four questions to assess which variant was more appealing: (1) Which option do you prefer when making a purchase—A or B? (2) What led you to choose this option? (This was an open question.) (3) Did you register the selected logo or product during the test drive? (Answers were limited to yes/no.) (4) Is there a specific product associated with the logo you saw? (Answers were limited to yes/no, and this question was applicable only to the logos of companies.)
Due to the substantial amount of outdoor advertising on both the inner and outer circuits, we carefully selected a specific set of advertisements for A/B testing and its correlation with eye-tracking research. We chose these ads for their visibility to drivers on both circuits, which were all in the form of billboards. Billboards on the outer circuit were labelled as TR4-005, TR4-006, TR4-017, TR4-029, TR4-039, TR4-055, TR4-059, TR4-075, TR4-079, TR4-092, TR4-097, TR4-114, TR4-115, TR4-119, TR4-121, TR4-122, TR4-143, TR4-151, TR4-155, TR4-156, TR4-157, and TR4-158. As for inner circuit, the billboards were identified as TR1-002, TR1-030, TR1-031, TR1-032, TR1-033, TR1-040, TR1-041, TR1-042, TR1-043, TR1-044, TR1-045, TR1-074, TR1-075, TR1-076, TR1-088, TR1-100, TR1-103, TR1-115, and TR1-116.
In the fourth step of the preparatory phase of the research, all relevant aspects of our research were formulated. Thirteen participants of varying genders, ages, and vehicles drove various routes—a sample size much larger than the recommended 6 by the Nolsen Norman Group’s publication “How to Conduct Eyetracking Studies” [
44]. Consequently, the results of the research could be accurately interpreted and applied to further knowledge acquisition. Seven women and six men aged 21 to 37 droves on an inner and outer circuit over three days, in varying weather and traffic conditions. Using the SMI Eye Tracking Glasses 2 (Wireless Analysis) version, we tracked the attention of the drivers towards external advertising with eye tracking.
The SMI EyeTracking Glasses 2 (ETG 2) is a wearable eye-tracking system that allows us to capture and analyse real-world visual attention and gaze behaviour. ETG 2 was designed as a lightweight and unobtrusive pair of glasses. The eye-tracking hardware is integrated into the glasses frame, along with miniature cameras, sensors, and other components required for eye tracking. The ETG 2 system utilizes high-resolution cameras mounted on the glasses to capture the wearer’s eye movements. The glasses include two cameras (one for each eye) to provide binocular tracking and more accurate measurements. To ensure robust eye tracking in various lighting conditions, the ETG 2 uses infrared illumination. Near-infrared light is emitted from the glasses frame, illuminating the eyes without causing discomfort or interfering with the wearer’s vision. The cameras in the ETG 2 capture images of the wearer’s eyes at a frame rate 60 Hz. These images are processed in real time using sophisticated algorithms to detect and track important features such as the pupil, corneal reflections, and eye movements. Before starting an eye-tracking session (measurement), the driver needs to go through a calibration procedure. This involves looking at specific calibration targets and following researcher’s instructions while the eye-tracking system records the eye movements. The calibration process establishes the relationship between the recorded eye movements and the actual point of gaze in the driver’s field of view. During the eye-tracking experiment, the ETG 2 continuously records eye movement data, including gaze coordinates, pupil diameter, and eye movement velocity. The data were transmitted by the cable to a connected notebook for real-time analysis [
47].
SMI provides dedicated software BeGaze for analysing the recorded eye-tracking data. The BeGaze software allows researchers to visualize and analyse gaze patterns, to generate heatmaps or gaze plots, and to extract various metrics related to fixations, saccades, and other eye movement parameters. These analysis tools help researchers gain insights into visual attention, cognitive processes, and user behaviour.
The SMI EyeTracking Glasses 2 technology enables to study eye movements in real-world environments, making it well-suited for applications such as market research, usability testing, sports performance analysis, and human factors research. Its portable and unobtrusive design allows for natural and ecologically valid eye-tracking studies in a wide range of settings and scenarios [
48].
This eye tracker does not significantly affect the cognitive abilities of the drivers and is advantageous for field measurements as it creates a natural and normal environment for the driver.
Steps five and six are implementation stages. The implementation stage of research is the process of executing the research activities. This stage consists of enacting the research plan (steps one to four), collecting data, examining the data, interpreting the results, and drawing conclusions.
In the fifth step, the actual eye-tracking measurements took place. Measurements were conducted from 9:00 a.m., with a schedule set so that each ride was allotted thirty minutes. To avoid morning and afternoon traffic rush in the city, the selection of times for test rides was carefully considered. Rides at this time should proceed without disruption from traffic jams. During the test drive, the driver had a calibrated eye-tracking device mounted on their head. On the passenger seat, the researcher calibrated the device before the drive and continuously monitored the data obtained on the computer during the journey. Another researcher occupied the back seat, observing the entire ride and measurement (
Figure 4).
Eye-tracking measurements are focused on specific indicators that can be measured by an eye tracker: fixations, saccadic movements, and blinks. Fixation refers to the period when the eyes are relatively still, focusing on a specific point of interest. During fixation, visual information is gathered and processed. Fixations typically last around 200–300 milliseconds and allow the brain to extract detailed information from the visual scene [
48]. Fixations indicate what a person has noticed, how long they looked at it, and the order in which they viewed different elements in a scene. Saccadic movements, on the other hand, are rapid and involuntary eye movements that shift the gaze from one point to another. These movements allow us to explore the visual environment by redirecting our focus to new points of interest. Saccades occur between fixations and typically last around 20–50 milliseconds. They are crucial for scanning the visual scene and are involved in acquiring new visual information [
45]. Saccadic movements measure the speed and accuracy with which the eyes move from one point to the next, providing insight into the user’s cognitive and perceptual processes. Blinks are brief closures of the eyelids that occur regularly to keep the eyes moisturized and protected. Blinks are essential for maintaining the health and function of the eyes. During a blink, the visual system is momentarily interrupted, and visual information is not processed. Blinks typically last around 100–150 milliseconds, but their frequency can vary depending on factors such as task demands, attention levels, and individual differences [
45]. Blinks are used to gauge a person’s attention and engagement with a particular stimulus and can even reveal visual fatigue and distraction.
The last stage of the research (sixth step) entailed a confidential interview (questionnaire) and an A/B testing between the researcher and the driver (steps two and three). This took place in a secluded atmosphere, free from any third-party interference. The interviewer used a pre-structured questionnaire, noting down the responses into their laptop. For the A/B testing, the researcher presented the driver with a tablet containing the prepared images which they were required to go through. Upon completion of the interview, the measurement was also concluded and the research progressed to the subsequent driver.
Considering the data obtained from the research, the results are interpreted via tables and graphs. The tables provide an in-depth analysis of the examined variables that were gathered using the eye tracker. The graphs illustrate the frequent responses given by the research participants following the rides.
3. Results
3.1. Drive on Inner Circuit
Drivers on the inner circuit during testing drives scarcely observed the billboards selected for A/B testing. A captivating fact about this route is that none of the six drivers noted the advertisement when driving into the car park at the Lidl supermarket (near Kálov Street) where the rides concluded. Not a single driver also directed their gaze to the large and conspicuously visible billboard fashioned on the edifice. Concerning the single billboard on this route, only one driver focused his gaze on it.
The first drive took place in light, early morning traffic, with few cars on the road. The sky was grey and overcast, yet there was no rain. While driving, the driver kept his eyes on the road ahead. He paid close attention to traffic signs and kept his gaze fixed upon the traffic lights at intersections. While stopped at an intersection, a clearly visible billboard advertisement was in the line of sight, directly behind the traffic light. However, the driver never diverted his eyes, keeping them fixed on the road. Aside from the stop at the intersection, the ride was uninterrupted. On one occasion, the driver did briefly focus his gaze on a billboard located on the opposite side of the road, which was not part of the test.
Table 1 provides a clear summary of the key performance indicators (KPIs) derived from the eye-tracking device.
The second driver kept his gaze fixed on the road ahead, glancing occasionally towards the tachometer on the dashboard, amid a backdrop of smooth traffic and cloudy but dry weather. At one point, a red traffic light necessitated a brief stop, but otherwise, the journey was uninterrupted. Driver 2 exhibited a far lower number of fixations than Driver 1, suggesting that the eye tracker was better calibrated (
Table 2). Nevertheless, the gathered data were sufficient to warrant its evaluation within the research.
The third drive happened with a greater number of cars on the route than the previous two drives, and the sky was somewhat cloudier, which made the scenery darker. There were three pauses during the drive: two times to give way to pedestrians at the intersection, and once due to a red light at the traffic lights. Unfortunately, the results from this driver cannot be processed due to the calibration of the eye tracker (see results from
Table 3), though the data from the questionnaire inquiry and testing can be partially utilized for the research. The only issue is with question three from the A/B testing, as it is impossible to confirm or validate the answer with a video recording from the eye tracker.
Traffic in the fourth drive was similar to what had been experienced before; however, the sky was much clearer. As one of the few drivers, he was acutely aware of outdoor advertisements. The driver had turned his gaze to the numerous billboard advertisements placed in a visible position for the cars leaving the Lidl supermarket, where the test drives began and ended. The driver paid close attention to the road ahead. During the ride, he repeatedly focused on the advertisement placed on the back of the bus he was following for a certain period of time. Possibly, there were issues with the eye tracker calibration, as there were repeated long fixations or no fixation registered on the recording in some sections. This is also reflected in the measured data (
Table 4).
Driver 5 embarked on his journey on a drizzly Saturday morning, in place of the previously missed Wednesday ride. The roads were surprisingly free of impediments, with only a few cars traversing the route. The dismal weather was a constant companion, with heavy rain and dark clouds hanging above. Nevertheless, Driver 5 made it to his destination without a hitch, carefully observing the cars in front of him or the rear-view mirrors. Although he had limited experience with the route, as he had only previously driven on other roads in Žilina, he kept his concentration on the task at hand. Along the way, Driver 5 noticed only a single billboard advertisement and a single city light.
Table 5 summarises the analysed key performance indicators obtained from the eye-tracking device.
On Saturday, during supplementary measurements for Driver 3, the downpour had ceased and the clouds had started to dissipate. The traffic in the sixth drive was a bit heavier than it was during the previous ride, but there were only two pauses at red lights at crossroads. Driver 6 followed the highway and the areas immediately adjacent to it, taking particular notice of the cars in front of him. During the journey, the driver mentioned that his eyes had been drawn to the bright digital advertisements. This was evident right from the start of the ride, when he was the only one to spot the digital ad while leaving the Lidl store and heading downtown. Additionally, the driver noticed several billboards in close proximity. The key performance indicators obtained from the eye-tracking device are summarized in
Table 6.
3.2. Drive on Outer Circuit
Driving along the outer circuit has resulted in a spike in recorded external advertising by drivers. This can be attributed to the extended journey, the opportune positioning of advertisements, as well as the reduced external stimuli compared with driving through the city centre. Many drivers fixed their gaze on the sizable advertisement in the form of a banner on a building. Notably, these were banners on a football stadium and a banner promoting the Lidl supermarket, which is easily visible to drivers traveling down Ľavobrežná Street towards the city centre.
The first attempt at riding was unsuccessful due to an inaccurate calibration of the eye tracker. As a result, a second ride was taken with the same measurements, potentially altering the driver’s perception. On a Saturday at noon, Driver 7 embarked on the second ride. The sky was cloudy with a wet roadway, and the roads were quite empty. The ride was smooth, except for one interruption at a red light. The driver focused on the street and traffic signs, as well as advertisements. In addition to the pre-selected ads for testing, the driver also noted a large-format banner advertisement hung up at the football stadium. Interestingly, the driver’s gaze repeatedly fixated on this particular advertisement.
Table 7 presents the data obtained from the eye tracker during the measurement.
Despite their unsatisfactory calibration results, Driver 8 managed to remain composed and deliver a smooth ride with no stops. Traffic conditions were favourable, with a moderate amount of vehicles on the road. The sky was clear, granting excellent visibility. Due to the unsatisfactory calibration results, the data from this eye tracking measurement (see
Table 8) were not used for next evaluation.
The ninth drive was first employed for eye tracking with a yellow filter, resulting in a notable improvement in tracking and motion accuracy, simplifying the calibration process. Environmentally, the conditions remained the same as in the prior measurement, with a steady flow of traffic and a cloudless sky. Although there were a greater number of cars on the road than usual, two stops at intersections due to red lights were observed. On the return trip, a queue formed on Košická Street towards Martin, adding to the overall journey time. Driver 9 was very vigilant, driving carefully and attentively scanning the road for the specified advertisements as well as various billboards and bigboards on either side of the road. On a stop at a traffic light intersection on Košická Street, a bigboard and megaboard were visible on the opposite side of the intersection. While the queue was forming, the driver also noticed several other billboards at the stop and in the slow-moving line.
Table 9 presents the data collected from the eye-tracking device during the measurement.
As the number of vehicles swelled along Košická and Ľavobrežná streets, the sky began to cloud over. When passing through the intersection where the green light had just flickered on, there was a momentary hiccup in the traffic, yet the voyage remained unhindered. Driver 10 kept in his lane and followed the procession of vehicles in front of him, as well as those trailing behind. Despite the sluggish pace of the queue, his attention was scarcely drawn to the outdoor advertising, but he did take note of a few billboards and bigboards.
Table 10 presents the data acquired from the eyetracker during the measurement process.
The eleventh ride took place before the sun reached its peak, so the roads were already becoming congested with a large number of vehicles. At one stop, the driver paused at a red-light intersection. Visibility was good, and the weather was suitable. The driver noted the smaller advertisements on the side of the street, but when he followed behind a larger vehicle, his focus shifted only to it. During the ride, the driver mentioned noticing a number of exterior ads on the sides of the road, and this was confirmed by the vast amount of attention he gave to the various outdoor ads, such as those on the opposing side of the street or the large billboards on buildings.
Table 11 presents the comprehensive data acquired from the eye-tracker during the measurement process.
The roads, during the twelfth drive, were tranquil, with nearly no traffic. At a crossroads, there was a single halt as the light turned red. The atmosphere was cloudy, but not rainy, just with a light mist. Driver 12 mainly kept their eyes on the road ahead, yet also monitored the roadside advertisements and traffic signs on the right. During the test drive, the driver’s gaze was frequently directed to the experimental advertisements, as well as those that were not included in the experiment. Most of them were placed beside the road on the driver’s side. This driver recorded the highest count of external advertisements from all of the measurements.
Table 12 displays the data acquired during the eyetracking measurement for driver 12. The table presents a comprehensive summary of the collected information.
An extra trial drive (thirteenth) was carried out as a substitute for the journey with poor calibration. The weather had improved since the prior ride. The drizzle subsided, and the skies began to brighten up. Traffic stayed consistent, and the roads were nearly deserted. The drive paused twice due to a stop at an intersection. Driver 13 carefully monitored the road and traffic signals. He was intent on driving. Occasionally, he would glance away from the road. Just like the prior driver, he noticed a substantial amount of advertisements, but mainly on his side of the street.
Table 13 displays the eye-tracking measurement data obtained from the latest driver (driver 13). This data provides insights into their eye movements and gaze patterns during the drive.
4. Results of Questionnaire Inquiry
The questionnaire results (
Table 14) indicate that a majority of participants, specifically 62%, reside in or near Žilina, while the remaining 38% live in different areas or cities. All drivers included in the study are familiar with Žilina and have experience driving in the town. Among these drivers, 77% have driven low-seated cars, while 23% have driven high-seated vehicles. Consequently, the majority of tests and measurements were conducted using small cars, such as hatchbacks or sedans.
The initial question inquired about drivers’ perception of outdoor advertising, including billboards, bigboards, banners, flags, and signs. A significant proportion of drivers, up to 85%, reported being aware of outdoor advertisements while driving. A small percentage, 15%, indicated that they were unable to perceive such advertising.
The responses to the open-ended question were categorized into five sections. Thirty-one percent of drivers agreed that graphics and the size of the advertisement were the most effective in capturing their attention.
This suggests that the size of the advertisement plays a crucial role in attracting drivers’ attention. Moreover, careful consideration of the visual elements can also be effective in drawing attention. Colours or colourfulness (23%) were identified as having a pleasing and visually appealing effect on drivers. Consequently, selecting the appropriate hues can enhance the advertisement’s reach and increase the likelihood of attracting more drivers. Additionally, drivers were enticed by the content of the advertisement (7%) and flashing elements (8%), particularly in digital outdoor advertising.
The third question investigated the impact of external advertising on drivers’ shopping habits. Fifteen percent of respondents acknowledged being influenced by external advertising, while eighty-five percent stated that they were not affected. This indicates that drivers are either not swayed by external advertising or are unaware of its influence on their purchasing decisions.
The subsequent inquiry aimed to determine whether external advertising can significantly influence drivers to choose a specific option from various choices when making an online purchase. The responses to this question overwhelmingly leaned towards a negative response. A notable 92% of drivers answered “No”, indicating that external advertising does not heavily influence their online purchasing decisions, while only 8% responded with a “Yes”.
The fifth and final question sought to ascertain the frequency of online shopping among the surveyed drivers. A total of 54% of participants reported shopping online at least once a month, and 23% revealed shopping twice a month. This indicates that 77% of the drivers surveyed are frequent online shoppers, which is a positive outcome. However, there were still outliers, with 15% and 8% of drivers stating that they shop online only once every six months or never shop online, respectively. The latter figure is rather unexpected, especially considering that the majority of Slovaks, particularly younger generations, are expected to engage in regular online shopping.
5. Results of A/B Testing
The A/B testing results provided the fundamental data that could be further used and developed. This testing consisted of 18 choices in the inner circuit and 22 choices in the outer circuit, with each selection being presented with four questions. During the testing, each driver was instructed to simulate the online shopping experience and make decisions accordingly. Their responses were recorded based on their autonomous answers, free from any external pressure or influence from the researcher. During the duration of the research, some of the advertisements were altered, such as TR1-002 in the inner circuit and TR4-039, TR4-055, TR4-059, TR4-075, TR4-115, and partially TR4-005 in the outer circuit. The latter was modified between the first and second measurements. These data were used in the research wherever feasible. Additionally, there were calibration issues with Driver 3 and Driver 8, meaning their data were only used where possible and were excluded from the eye-tracking evaluation.
Question 1 of the test focused on the selection of an option (A or B) that the driver prefers or selects when purchasing. The driver chose according to their personal inclination or preference. The responses for the inner and outer circuits were evaluated independently. The question was about which option, A or B, you would choose when purchasing. The answers were mainly categorized as Correct and Incorrect to enable the recognition of individual answers of the drivers when evaluating Question 1. The answer Correct means that tested subject chose the option that was placed on the billboard and had the opportunity to see it while driving. The answer Incorrect means that the tested subject chose an option not displayed on the billboards along the road. This appraisal was then be employed for further processing, thus necessitating the differentiation of the drivers’ individual answers.
On the inner circuit, five drivers (data from Driver 3 were not usable for further research) yielded 90 responses, of which 12 were correct and 6 were incorrect selections, with the highest success rate being for Driver 1 and the best result being TR1-088, chosen correctly by all. When evaluating the ads, 62% of the responses proved correct, while 38% were incorrect (
Table 15).
On the outer circuit, six drivers (data from Driver 8 were not usable for further research) amassed 132 responses, with Driver 10 being the most successful, with 17 correct and 5 incorrect options. The results were determined to be evenly split, with a 53% to 47% ratio of correct to incorrect answers (
Table 16).
Joint evaluation of the data yielded a final outcome of 57% correct answers to 43% incorrect answers. However, it is unclear whether the results were influenced by the perception of the external advertisement or if drivers were simply choosing based on personal preference.
Another question from the questionnaire probes whether drivers noticed or registered the chosen logo or product during their test drive. This is a closed question with the options Yes or No. The results were once more divided for inner circuit and outer circuit separately, yet were also evaluated together. For this evaluation, the results from the altered advertisements were no longer taken into account since the answer is irrelevant (TR-002 in the inner circuit and the TR4-005, TR4-039, TR4-055, TR4-059, TR4-075, TR4-115 in the outer circuit). The drivers were unable to see advertisements that were not on the route during the test drive.
The inner circuit recorded a total of 85 responses (
Table 17), with 12 being positive and 73 being negative, giving an overall ratio of 14% Yes to 86% No. This is an interesting result, as more than half of drivers on this route chose the “correct” option in the A/B test. The highest number of positive responses (4) were given for advertisement TR1-075. Driver 2 indicated that he noticed or registered logos or products 7 times, while 10 times, he did not see them.
Meanwhile, the outer circuit yielded the same result, with 14% Yes responses and 86% No responses (
Table 18). The most positive responses (2) were given for the advertisements TR4-097, TR4-121, TR4-156, and TR4-157. Notably, Driver 7 gave the most Yes responses, 8 times, and 8 times, he answered No.
From the overall assessment for both routes, the ratio is 15.5% for Yes and 84.5% for No. Indeed, the answer Yes was registered 28 times, while the answer No was documented 153 times. This analysis could be indicative of participating drivers only slightly perceiving and monitoring outdoor advertising while driving. Nonetheless, there is also a chance that drivers perceive outdoor advertising subconsciously and thus respond to the question negatively. Additional accurate findings were available once the eye tracker measurement had been evaluated.
The last question from the A/B testing was asked drivers to assess whether they associated the given logo or brand with a particular product. This focused on the experience or knowledge of a specific product or service that the driver knows is offered or sold by the company. If the driver chose an aquarist logo, the answer that they sell fish would not be positively evaluated; rather, it should be a specific product purchased or mediated directly from the aquarist. This question was asked only for selections that included the company logo, excluding those with specific products. All responses, including those from drivers without the results of eye-tracking measurement and changed advertisements, were evaluated together and separately for both routes to determine if there exists a correlation between product knowledge and purchase decisions.
On the inner circuit, 85 selections have been evaluated, with 20 connections to a specific product, and 65 times, it was not connected, resulting in a ratio of 24% to 76% in favour of the No answer. The most successful selections were TR1-002 and TR1-075, each with six Yes answers. Driver 6 had the most product brands connected to them, with Yes answered five times. The outer circuit evaluation totalled 96 data, with a near balanced distribution of 46 positive and 50 negative answers, representing 48% Yes answers and 52% No answers. TR4-115 had the highest number of Yes answers (7). Driver 7 had the highest tally of all drivers on the outer circuit, with 10 Yes answers.
The joint evaluation of both routes yielded 66 affirmative answers and 115 negative ones, resulting in a total of 181. The ratio of affirmative to negative answers was an unfavourable 36.5% to 63.5%, indicating that nearly two-thirds of respondents may have been influenced by their familiarity with a certain service or product linked to the logo.
6. Results of Eye-Tracking Analysis
Previous conclusions and outcomes were meticulously scrutinized on the basis of the subjective responses of individual drivers (A/B testing results). The evaluation of measurements and records from the eye tracker provided the requisite value to the earlier outcomes, which were then supported by tangible evidence. The recordings from the measurements with the eye tracker served as the essential foundation for the research and work done overall. An important indicator of the success of the eye-tracking measurement is the fixation and saccadic eye movements values.
Table 19 evidently shows the drivers for whom the results of the eye tracker measurement were inadequate (Driver 3 and Driver 8).
It is evident from the table that Driver 3 and Driver 8 had extensive difficulty in calibrating the eye tracker, rendering their measurements unusable for research, thus necessitating their exclusion from any further research regarding the eye-tracking data. Driver 2 and Driver 4 too presented substantially lower fixation and saccadic movement values compared with the remainder of the sample, yet these figures were satisfactory for research purposes; accordingly, they will be included in the research for the eye-tracking measurements. All the values in
Table 19 have been recalculated per minute, considering each driver’s test drive was of a different duration. Driver 7 ostensibly had the most desirable results. Nevertheless, it is imperative to point out that an excessive amount of fixations or saccadic movements while driving can cause agitation and unease. The average fixation value for the participating drivers was 147 per minute, while the average saccadic movement value was 129. This results in an average of over two fixations and saccadic movements per second for the driver.
Eye fixation is a critical component of research, particularly when it comes to outdoor advertising. An eye tracker can be used to measure each single fixation on the outdoor advertisement chosen for testing, as well as all other large-format advertisements excluded from the experiment. Within the inner circuit, 25 large-format advertisements were studied, resulting in a mere six fixations—a ratio of 5%. The outer circuit had a slightly better outcome, with 108 fixations—representing a ratio of 13% out of the total number of possible views.
For elucidation, the assessment in
Table 20 is directed at all the outdoor advertisements located on the test routes. All the test drives tallied up to 557 ads, of which drivers noted 65. The total fixation rate from all the ads was 12%. To put it another way, during the test drives, the driver on average recorded one out of every ten large-format outdoor advertisements.
The ultimate step in data evaluation and assessment is the fusion of eye tracking and A/B testing of the participating drivers. For both pathways, the external ads integrated in the trial were individually examined. However, the results were much less successful when all the ads on the routes were evaluated. After analysing the modified advertisement, 17 external ads were present on the inner circuit that was subjected to the testing. Since measurements were taken from five to six drivers, this accounts for 85 advertisements in total. Surprisingly, only four were registered by the drivers, and no fixations of the gaze were recorded for 81 of them. This generated a ratio of 5% for observed ads. Two drivers were unsuccessful in noting any fixations on the specified ads. From the viewpoint of advertisements, this corresponds to one fixation for 4 advertisements and zero fixations for 13 advertisements across five test drives.
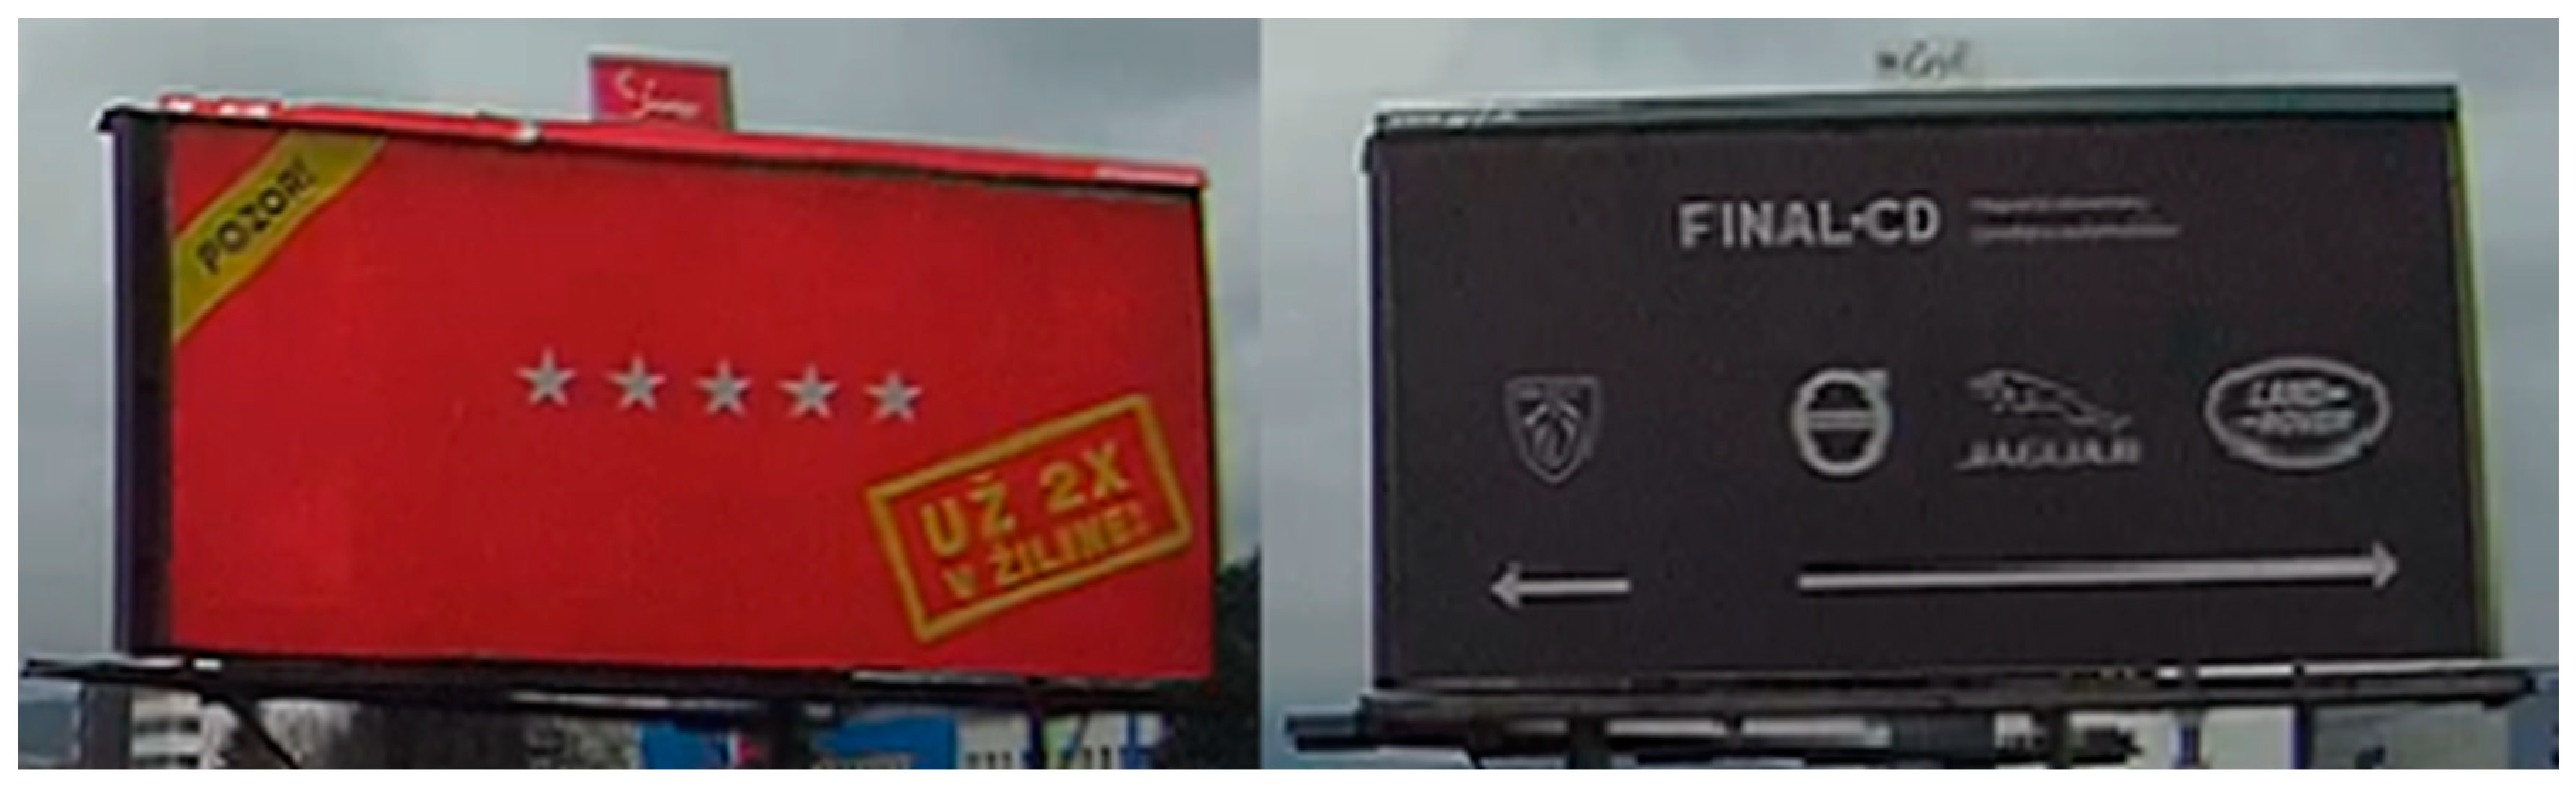
The outcomes of the outer circuit evaluation were markedly different from those of the inner circuit. Measurements of 6 drivers and 16 ads were used in the assessment. Out of the 96 outdoor ads visible on route, 24 were noted by drivers. On average, the total fixation rate was 25%. The most fixations (3) were recorded for ads TR4-155 and TR4-157 (
Figure 5). Driver 12 was the one with the highest number of recorded ads, having seen six ads overall. This gave a total ratio of 16% seen and 84% without fixation on both routes.
After a thorough assessment of the advertising tracking, a comparison between the drivers’ subjective responses from the A/B testing and the measured values from the eye tracker was made. Three variants were then produced:
Response Yes and Saw—evaluation based on the driver’s answer of Yes to the question on whether they noticed the logo or product they selected during the test drive, and the eye tracker recording that they saw the advertising used for that choice in the A/B testing.
Response Yes and Not seen—evaluation based on the driver’s answer of Yes to the question on whether they noticed the logo or product they selected during the test drive, and the eye tracker recording that they did not witness the advertising used for that choice in the A/B testing.
Response No and Saw—evaluation based on the driver’s answer of No to the question on whether they noticed the logo or product they selected during the test drive, and the eye tracker recording that they saw the advertising used for that choice in the A/B testing.
The evaluation of conditions was conducted according to the criterion of selecting TRUE or FALSE. When both conditions were fulfilled, the response was marked as TRUE. However, if one or both of the conditions were not satisfied, the result was labelled FALSE. The first variant evaluated was Answer Yes and Saw. The aim was to determine how often the driver reported that they noticed the chosen option and actually focused their gaze on it during the trial. The evaluation of this variant on the inner route revealed that only in two cases was the result TRUE, which signifies that in these two situations, both conditions were fulfilled. In terms of percentage, this outcome accounts for only 2% of the entire sample. The outer route was evaluated as TRUE in 5 cases out of a total of 96 options. Here, it is 5% of the entire sample. The overall ratio of fulfilment of this variant from both routes is 7 out of 181, which constitutes 1% of the entire sample.
The second variant with slight changes was Answer Yes and Not Seen. This was a situation in which the driver during the testing indicated that they saw the chosen logo or product during the test drive, but no fixation was recorded in the eye tracker data. On the inner circuit, these conditions were fulfilled in 10 out of 85 possible cases, representing 11.8% of the total sample. On the outer circuit, the conditions for the variant were met in 9 cases, representing 9.4% of all possibilities. From the overall evaluation of both routes together, the conditions were fulfilled in 10.5% of all possibilities.
The intriguing variant for investigation was answer No and Saw; from an investigative point of view, this is especially interesting. The assessment of this variant provides insight into the potential effect of external advertising on buying decisions. In this context, the driver claimed they did not notice the selected logo during the trial run, but in fact, they had it in focus. On the inner path, two cases fulfilled the conditions, representing 2.3% of the overall sample evaluated. On the outer route, the results were much better; twenty options were accurately evaluated, equating to 20.8% of all possibilities. Once both routes were taken into consideration, 22 of 181 options met the conditions, making up 12.2% of the total sample.
The third variant of evaluation was combined with A/B testing to determine any potential correlation between the perception of the advertisement and its influence on purchase decisions. This evaluation combines two previous evaluations, the A/B test based on “correct” and “incorrect” choices out of the options presented to the drivers among the individual choices in the test and the evaluation of the No Answer and Seen option. The aim was to identify instances wherein the driver might have registered the advertisement with the selected logo or product, while stating they did not see it during the test drive. If these three conditions are met, it can be concluded that there is a relationship between the driver’s making a purchase decision based on the registration of an external advertisement. In the assessment of the inner circuit, no correlation possibilities were discovered. Of the 85 possibilities, none fulfilled all three specified criteria. This can be partially attributed to the limited number of advertisements witnessed by drivers along the route. Nonetheless, the evaluation of the outer circuit uncovered nine scenarios in which all conditions were satisfied. Specifically, this accounts for 9% of the total sample evaluated. For these nine instances, it can be hypothesized that the visible outdoor advertising had a bearing on the purchasing decisions of certain drivers.
7. Discussion
This article aims to comprehensively understand the magnitude of external advertising’s influence on customer decision-making in the digital domain. To enhance the precision of the research and data, this study measures the effects of external advertising on drivers and their decision-making processes. To simulate the online environment, the researchers employed A/B testing, wherein drivers were promptly presented with two options after driving. This testing method was designed to elicit a choice between the brand and the product itself, resembling the process of online shopping. To ensure that drivers would adapt their behaviour and preferences accordingly, they were given prior notification of this experimental setup.
To elucidate conscious consumer preferences, an extensive interview was conducted. The primary objective of this interview was to ascertain the frequency with which the participating drivers engage in online purchasing. It is worth noting that over two-thirds of the sample reported engaging in monthly online transactions. This substantial figure lends credence to the research outcomes and their relevance in the context of consumer behaviour within the digital landscape. Given drivers’ familiarity with this form of shopping, their decision-making is inherently connected to the online realm.
Following a meticulous interview process and subsequent A/B testing, it was revealed that most drivers did not consciously perceive external advertising while driving. Nevertheless, the measurements obtained from the study unveiled that drivers are most strongly attracted to advertisements featuring visually appealing graphics, appropriate sizes, and captivating colours. This finding is paramount for advertisers, as it enables them to effectively engage consumers through three key mechanisms: establishing contact, capturing attention, and placing advertisements in optimal locations. Armed with this knowledge, advertisers can leverage visually appealing graphics, appropriately sized ads, and captivating colours to ensure that their advertisements are seen and noticed by drivers.
The subsequent inquiry pertains to the impact of external advertising on drivers’ purchasing behaviour. Most participants reported limited awareness of the influence exerted by such advertising on their decision-making. However, it is important to note that further investigation and comprehensive assessment utilizing additional tools would be required to corroborate or refute this observation definitively. It is pertinent to acknowledge that the research presented in this article was conducted from the driver’s perspective, with data collection facilitated by an eye tracker, thus limiting the scope of aspects that could be evaluated. When questioned regarding the influence of external advertising on their purchasing decisions, nearly all drivers asserted that it does not affect their decision-making process. The collected measurements partially substantiate this finding. Nonetheless, the impact of external advertising on drivers’ purchasing decisions, albeit minor, warrants further exploration and investigation.
7.1. Research Limitations
Throughout the research process, various key issues emerged that directly impacted the study and its components. Noteworthy influences were observed during the research.
One crucial factor that affected the research pertained to the selection of drivers. Gender was taken into consideration to ensure a relatively balanced sample of participants. Age diversity was also considered, with a range of 20 years. It is plausible to suggest that if the sample had predominantly consisted of one gender or age group, the obtained results may have differed from those obtained.
The utilization or lack thereof of a yellow filter on the eye tracker during measurements proved to be a significant factor. Insufficient calibration occurred without the filter, leading to unsuitable results for further evaluation (Drivers 3 and 8).
The selection of suitable routes played a crucial role in influencing the overall results. Comparing the two routes used in the research, significant differences in driving style and perception of outdoor advertising were observed, aligning with the intended purpose of route selection. Despite the exclusion of Drivers 3 and 8, the scenarios presented (inner circle and outer circle) yielded valuable findings.
The research presented in this article holds promise for the future, offering ample opportunities for further enhancements and the discovery of correlations. By incorporating additional technologies such as brain activity measurement and eye tracking for option selection, this research, which already utilizes A/B testing and eye trackers, can be further enriched. These methods can provide novel insights into shopping behaviour, including the order in which the eyes fixate on specific points. Furthermore, investigating the same routes for drivers and passengers may unveil a potentially greater impact of external advertising on passengers than on drivers.
The extensive scope of outdoor advertising and its substantial influence on consumer behaviour warrants further investigation and research. While this research draws upon a wealth of data and remains relevant, there is always room for improvement and refinement of the outcomes. It can be concluded, however, that outdoor advertising does exert a certain influence on customers’ decisions. Nevertheless, the research findings suggest that the impact of outdoor advertising on motor vehicle drivers is relatively minimal.
7.2. Agenda for Future Research
The A/B testing conducted in this study elicited responses to four questions associated with selections made for each circuit. The results demonstrated comparable success rates across both circuits, suggesting a lack of discernible influence of advertising on decision-making. Notably, many drivers make choices based on personal preferences, encompassing elements such as brand recognition, visually appealing stimuli, and other unspecified factors. Although a fraction of respondents acknowledged some impact of advertisements, these responses were subjective, thus necessitating caution in their interpretation. It is plausible to posit that the influence of advertising may operate at a subconscious level.
The analysis of participants’ responses revealed that drivers consciously register minimal outdoor advertisements. This limited conscious registration can be attributed to the fleeting nature of their exposure, characterized by an average fixation time of merely 0.3 s and often restricted to a single fixation. Consequently, the advertised logo or product often goes unnoticed, resulting in a lack of conscious recognition during decision-making. The evidence suggests that decisions are predominantly guided by personal experiences with specific goods or services and by the influence of word-of-mouth reviews from others. Consequently, it appears that outdoor advertising exerts only a marginal impact on individuals’ decision-making processes.
The eye-tracking measurements employed in this research are pivotal for assessing its validity, as they guarantee the accuracy of the collected data. Notably, a significant disparity exists between the measurements obtained from the inner and outer circuits. The “urban” inner circuit records considerably fewer outdoor advertisements compared with the “circular” outer circuit. Nevertheless, it is observed that, on average, drivers notice approximately one-tenth of the large-format outdoor advertisements encountered. It is important to acknowledge that this value is contingent upon numerous factors. Nonetheless, it can be stated that a lower number of recorded ads corresponds to a weaker impact on purchase decisions.
By evaluating measurements conducted under three different conditions, certain instances reveal the potential for external advertising to sway driver choices. However, it is important to note that this potential remains relatively weak when compared with the overall number of ads surveyed. This observation underscores the need for further measurements and exploration. Notably, all instances of possible influence were registered on the outer circuit, indicating the influence exerted while driving in town. Conversely, within the city, specifically on the inner circuit, no instances of possible impact through external advertising were recorded. It is crucial to avoid unequivocal assertions of the absence of influence; nonetheless, determining the magnitude of impact solely based on eye-tracking measurements is inherently challenging.
7.3. Research Implications
Based on the meticulous analysis of the data, it becomes evident that the driver’s perception, and hence the impact of external advertising on the driver, is subject to a multitude of factors. Notably, the examination of eye movement patterns in both the inner and outer circuits reveals a substantial decrease in the number of fixations and saccadic movements within the inner circuit. Furthermore, the level of traffic in urban centres and arterial roads outside the city exerts a discernible influence on the driver’s attentional capacity; in denser traffic conditions, the driver’s vigilance is heightened, consequently diminishing the likelihood of noticing external advertising. Consequently, it is impractical to target advertising campaigns towards city centres when aiming to reach drivers effectively. Instead, the strategic focus should encompass sections with fewer points of conflict, such as extended linear segments characterized by low traffic intensity. In areas with high traffic density, the impact of external advertising is notably diminished.
The visibility of outdoor advertising exhibits a profound dependence on its placement. Within the inner circuit, advertisements are frequently concentrated in inconspicuous locations where drivers direct their attention predominantly towards the traffic rather than peripheral objects. However, advertisements positioned along extensive, unobstructed roads that afford long-distance visibility possess an enhanced potential to capture the driver’s attention. Consequently, the degree of influence on the consumer is directly proportional to the positioning of the advertisement. Furthermore, the influence exerted by the advertisement can be significantly modulated by the consumer’s pre-existing opinion of the advertised product or service. Favourable past experiences with the brand or product increase the likelihood of being swayed towards making a purchase, thus augmenting the impact of the advertisement. Conversely, unfavourable experiences may prompt the consumer to opt for a competitor, thereby still exerting an influence on the efficacy of the advertisement.
In summary, the findings of this research can be succinctly encapsulated in the assertion that outdoor advertisements possess the potential to influence a driver’s purchasing decisions. Although the driver’s primary focus remains on operating the vehicle, instances arise wherein the route and prevailing traffic conditions allow for conscious notice of the advertisements. While this occurrence is not ubiquitous, if it does transpire, there exists the possibility of the advertisement exercising some sway in the eventual decision-making process.
8. Conclusions
The findings from this research provide clarity on various aspects of the influence of outdoor advertising on customers’ purchasing decisions. It becomes evident that the impact of outdoor advertising on drivers is minimal during the experimental testing. Factors such as prevailing road conditions and traffic volume significantly influence drivers’ perception of advertising. Consequently, it can be concluded that outdoor advertising is better suited for pedestrians or passengers in vehicles, especially in specific locations such as urban settings.
This study aimed to determine the impact of outdoor advertising on customers’ purchasing behaviour by employing A/B testing and assuming the role of drivers of personal vehicles. The research and experimental outcomes shed light on the extent of influence exerted by outdoor advertising on customers’ purchasing decisions, particularly in the online realm. The study identified nine instances where a clear correlation between outdoor advertising and specific purchase decisions was evident, suggesting some (albeit low) likelihood of the influence of outdoor advertising on customer decisions.
The results of the pre-experimental questionnaire highlight the significant factors that can impact customer decision-making and attention, including advertisement dimensions, colour schemes, and placement. In the online environment, customers’ decision-making processes can be influenced by subtle details, especially when encountering unfamiliar brands or products. Outdoor advertising can have a similar effect on customers, but it requires the advertisement to be initially perceived and processed subconsciously.
Marketers and advertising agencies need to consider various factors when devising strategies for outdoor advertising. The location and visually captivating nature of billboards, for example, can have a considerable influence on consumer purchasing decisions. However, the effectiveness of this impact depends on the advertisement being perceived by the consumer. Therefore, careful attention should be given to directing individual advertisements to drivers or pedestrians through precise site selection, appropriate frequency, and visually distinct content.
For future research endeavours, it is recommended to leverage diverse technologies, such as EEG (electroencephalography) and FEA (functional eye-tracking analysis), to gather a greater volume of data. This research utilized an eye-tracking device, which collected data from a specific region. By harnessing multiple technologies, data can be obtained from various sensors, enabling comprehensive evaluation, comparison, and the identification of potential correlations. The intersection of marketing, advertising, and eye-tracking in the transportation field presents an intriguing and relatively unexplored area, offering ample room for further research and valuable measurements. The remarkable potential of outdoor advertising necessitates continual exploration and investigation.


