1. Introduction
Sewer systems play an important part in urban infrastructure and usually have a long service life. However, with the increase in use time, various defects will appear in sewer pipes, such as deposition, stagger and crack. If these defects cannot be found and dealt with in a timely manner, they will seriously reduce the lifetime of the sewer system and threaten urban safety. Studies have found that flooding events in cities can be caused not only by extreme weather but also by blockages and collapses in sewer pipes [
1]. Therefore, it is necessary to conduct thorough and regular inspections of the sewer pipes, and then take appropriate measures to deal with these defects.
Currently, closed-circuit television (CCTV) inspection technology has been widely used for the inspection of sewer pipes [
2]. CCTV uses a robot with a camera to enter the sewer pipes for video shooting, and then provide the collected video data to professional technicians for evaluation. Although CCTV greatly improves safety by not requiring a human to enter the sewer pipe, professional technicians are still required to inspect the video in detail, which is labor intensive, inefficient and difficult to guarantee accuracy [
3]. Moreover, due to the large number of sewer pipes and the limited number of professional technicians [
4], it is difficult to conduct a comprehensive inspection of sewer pipes in time. Therefore, there is an urgent need to develop an automatic sewer defect detection method, which can not only speed up the detection process but also eliminate the potential human bias of technicians [
5]. In addition, automatic detection technology does not require a constant concentration of technicians and can detect some minor and imperceptible defects in time, such as cracks and fractures [
6].
Due to the shortcomings of manual inspection, automated detection methods based on computer vision (CV) techniques and deep learning techniques are gradually developed in the field of sewer defect detection. CV-based techniques focus on accurately designing feature information used to describe pipe defects, such as texture features and shape features of the image. However, the process is complicated, inefficient and requires technicians to design features manually, which depends on the experience level of technicians. In recent years, deep learning techniques have achieved better results in various computer vision tasks such as image classification and object detection. By simply feeding a large amount of raw data into the deep learning network, the complex network structure can automatically extract feature information of the target, which greatly improves the accuracy and efficiency of detection. Image classification technology can recognize a single image, but cannot determine the specific location of the target. Object detection technology can detect multiple targets in a single image at the same time and can detect the specific location of the target, which is more suitable for actual sewer defect detection tasks. Therefore, this paper chooses object detection technology for sewer defect detection research.
Specifically, this paper proposes an improved YOLOv4 model for automatic detection of sewer pipeline defects, which achieves accurate detection and recognition of four types of defects. Due to the large differences in morphology and size among different sewer defects, small defects are easy to lose feature information in the detection process. Moreover, object detection networks usually pay more attention to the local features of the target and not enough to the global features of the image, which leads to poor classification performance of the target. Therefore, this paper introduces the spatial pyramid pooling (SPP) module to achieve fusion of defect feature information at different scales, enabling models to obtain richer global and local information. This method is simple and efficient, does not cause a large amount of computation, and can effectively improve the defect detection accuracy, especially for small defects.
We evaluated the detection performance of different models on our self-made dataset, and the experimental results show that our method is superior to the current state-of-the-art object detection methods. Overall, the main work of this paper is as follows:
- (1)
To address the shortcomings of existing defect detection methods, an improved YOLOv4 model is proposed to detect and classify sewer defects. This model has high detection performance and fast detection speed, which can be better adapted to the sewer defect detection tasks;
- (2)
Based on the processing speed and detection accuracy of the model, the influence of three bounding box loss functions on model performance are compared, including GIoU, DIoU and CIoU;
- (3)
To address the lack of datasets for sewer defect detection, this study selects a total of 2700 images from the public dataset Sewer-ML for defect location annotation. The dataset is labeled in a multi-label form, including four types of the most common defects such as crack, deposition, root and stagger.
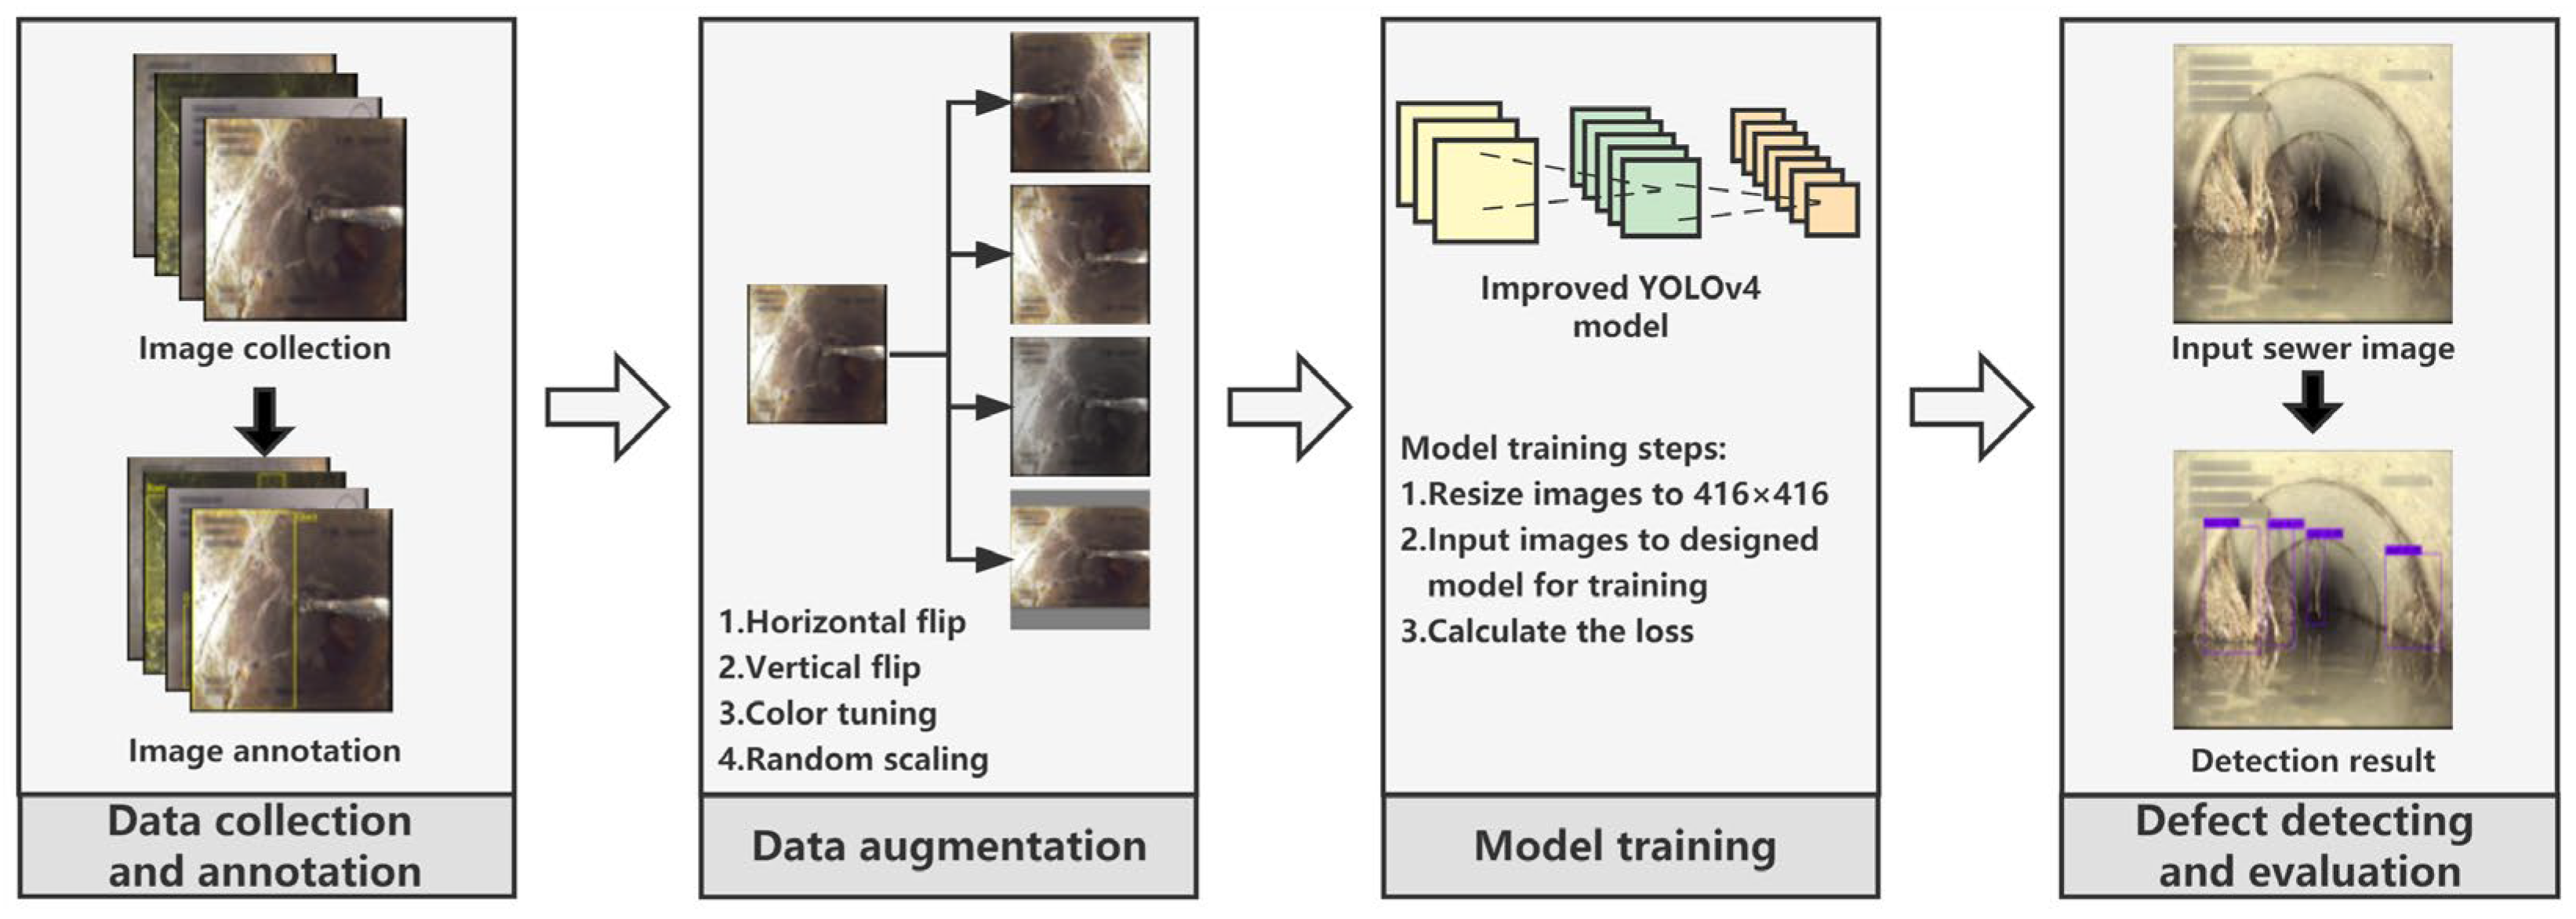
As shown in
Figure 1, the overall workflow of this study contains: (1) sewer defect images collection and annotation; (2) image augmentation; (3) the proposed model training; and (4) defect detection and model performance evaluation.
2. Literature Review
Manual inspection methods for sewer defects have a large workload and low accuracy and can no longer meet the growing demand for pipeline inspection. Therefore, many studies have combined image processing technology to study the automated detection of sewer defects. We will discuss related work from the following two aspects, including traditional computer vision methods and deep learning methods.
2.1. Sewer Defect Detection Based on Computer Vision Techniques
In order to overcome the drawbacks of manual inspection, automatic inspection methods based on traditional computer vision technology are gradually developed.
Yang et al. [
7] used wavelet transform and co-occurrence matrix to extract texture features of sewer defects and used support vector machine (SVM) to classify defects. Experimenting on 291 images containing defects, an accuracy of 60% was obtained. However, this method classifies based on the texture details of the defects, which is easily affected by the pipe background. When the sewer background is complex or the defect texture features are not obvious, the detection effect is poor. Halfawy et al. [
8] used threshold segmentation to segment the region of interest containing defects from the sewer images. Following this, the extracted HOG features are classified using SVM classifier. This method can be used for the detection of root defects with an accuracy of 91.2%, but it cannot be applied to the detection of other defects. Hawari et al. [
9] detected crack defects by morphological segmentation method, detected deposition defects based on the Gabor filter, and detected pipeline deformation by ellipse fitting algorithm. Although a variety of defects can be detected, the accuracy is low with a maximum of 74%.
It can be seen that the traditional computer vision methods mainly rely on manually designed features for defect identification. However, the sewer environment is complex and diverse, and there are many types of sewer defects with different morphological characteristics. It is difficult for traditional methods to detect multiple defects at the same time, and the accuracy rate is also affected. Since manual intervention is still required, it cannot meet the needs of automatic detection of sewer defects.
2.2. Sewer Defect Detection Based on Deep Learning Techniques
The emergence of deep learning techniques has better addressed the drawbacks of traditional computer vision methods. As the most popular algorithm among them, convolutional neural network (CNN) is most widely used [
10]. Compared with the traditional CV method, CNN can automatically extract image features and perform recognition, without the need for professional technicians with rich work experience and complex feature design process, which greatly simplifies the detection process. CNN has achieved good performance in defect classification and defect detection [
2].
2.2.1. Sewer Defect Identification Based on Image Classification Techniques
Kumar et al. [
11] presented a method for sewer pipe defect classification based on multiple binary CNNs, with an average accuracy of 86.2%. The higher classification performance proved the feasibility of CNNs in sewer defect detection. Li et al. [
12] proposed a method using Resnet18 to classify defects in CCTV images. This method is divided into two steps, first distinguishing the defective images from normal images, and then classifying the defective images individually. The hierarchical classification method significantly improves the defect detection accuracy, with an accuracy rate of up to 83.2%. Xie et al. [
13] designed a two-level hierarchical CNN method for sewer defect classification. This method was trained using 40,000 images and achieved an accuracy of 94.96% in classifying 6 defects such as deposition, stagger, high water level and barrier; it also effectively solved the problem of data imbalance. The method demonstrates the high accuracy of CNN in sewer defect classification tasks and has been applied to practical inspection tasks. However, this method can only detect one type of defect on a single image, whereas sewer pipes may have multiple types of defects at the same location [
10].
2.2.2. Sewer Defect Detection Based on Object Detection Techniques
Object detection technology can classify multiple targets appearing in a single image and obtain their precise positions, which is more widely applicable. Object detection techniques are mainly divided into two categories, one is two-stage networks such as RCNN [
14] and Faster R-CNN [
15]. The other is one-stage networks such as Single Shot MultiBox Detector (SSD) [
16] and YOLO [
17].
Cheng & Wang [
2] first applied the two-stage network Faster R-CNN to the CCTV image detection task. This method uses 3000 images for training and realizes the accurate detection of four kinds of defects: root, crack, infiltration and deposit. The mean average precision (mAP) of this method can reach 83%. However, the detection speed of this method is slow and it is only suitable for offline detection. Kumar et al. [
18] used three methods, SSD, YOLOv3 and Faster R-CNN, to detect sewer pipe defects, and compared the performance between different methods. Li et al. [
19] proposed an improved Faster R-CNN model, which combines global context features with local defect features to achieve sewer pipe defect location and fine-grained classification. Yin et al. [
6] developed a real-time automated defect detection system based on YOLOv3, which can detect six types of defects. Due to the good detection speed of YOLOv3, this method can use CCTV video as input and generate defect-marked video, with an mAP of 85.37%. Tan et al. [
3] proposed an improved YOLOv3 model with reference to YOLOv5, which achieved accurate detection of four types of defects, and the mAP can reach 92%. Most current research on sewer defect detection is based on YOLOv3 or Faster R-CNN algorithm [
20]. The detection speed of the YOLOv3 is fast, but its feature fusion ability is weak; furthermore, it is easy to produce miss or false detection for small targets. Faster R-CNN usually has high accuracy, but the detection speed is very slow.
In this work, we focus on improving the detection accuracy of sewer defects. Specifically, we propose an improved YOLOv4 model to detect sewer defects. By introducing the SPP module to improve the multi-scale feature fusion capability, the improved model can obtain richer global information and improve the detection accuracy of sewer defects, especially for small defects such as cracks.
3. Materials and Methods
3.1. Data Collection and Annotation
The sewer defects studied in this paper are four types commonly encountered in southern China [
10,
21], namely crack, deposition, root and stagger. The original images were obtained from the Danish laboratory’s public dataset Sewer-ML [
22]. This dataset contains 1.3 million images, all of which were annotated by professional sewer inspectors in a multi-label manner.
Sewer pipe defect detection requires not only classification information but also accurate location information. As this dataset contains only classification information, a total of 2700 images which contain at least one of the above four types of defects were selected from this dataset for defect location annotation. The resolution of all images is between 352 × 288 and 720 × 576.
Table 1 summarizes the number of each defect in the dataset.
In order to ensure the accuracy of annotation information, we invited relevant professionals to use the graphical annotation tool LabelImg to label the location of defects. These labeled images will be used to train the model after data enhancement. The original sewer defect images in the Sewer-ML dataset are shown in
Figure 2, and the defect images labeled with bounding boxes are shown in
Figure 3.
3.2. Data Augmentation
Object detection models may not be sufficiently trained when the number of images is small. In this paper, data augmentation techniques are used to increase the dataset size. This technology can increase the variety of sewer defect images, so that the model can adapt to more complex environments and has higher robustness [
3]. In this paper, we used four methods including random vertical and horizontal flipping, random scaling and color tuning (adjustment of the brightness, contrast and saturation) for data augmentation.
Figure 4 shows examples of each data augmentation method. After augmentation, all the defect images are scaled to 416 × 416 pixels.
3.3. Sewer Pipe Defect Detection Method Based on Improved YOLOv4
Sewer defect images are different from those in traditional target detection datasets in that they have more obscure features and poor lighting conditions in the pipeline. In order to make the model better adapted to the defect detection task, this paper first compares the effects of three different bounding box loss functions on the model performance, including GIoU, DIoU and CIoU. Secondly, an improved YOLOv4 model is proposed, which effectively increases the receptive field of the network and improves the ability of the model to fuse spatial features. Details are presented in the following sections.
3.3.1. Overall Architecture of the YOLOv4 Model
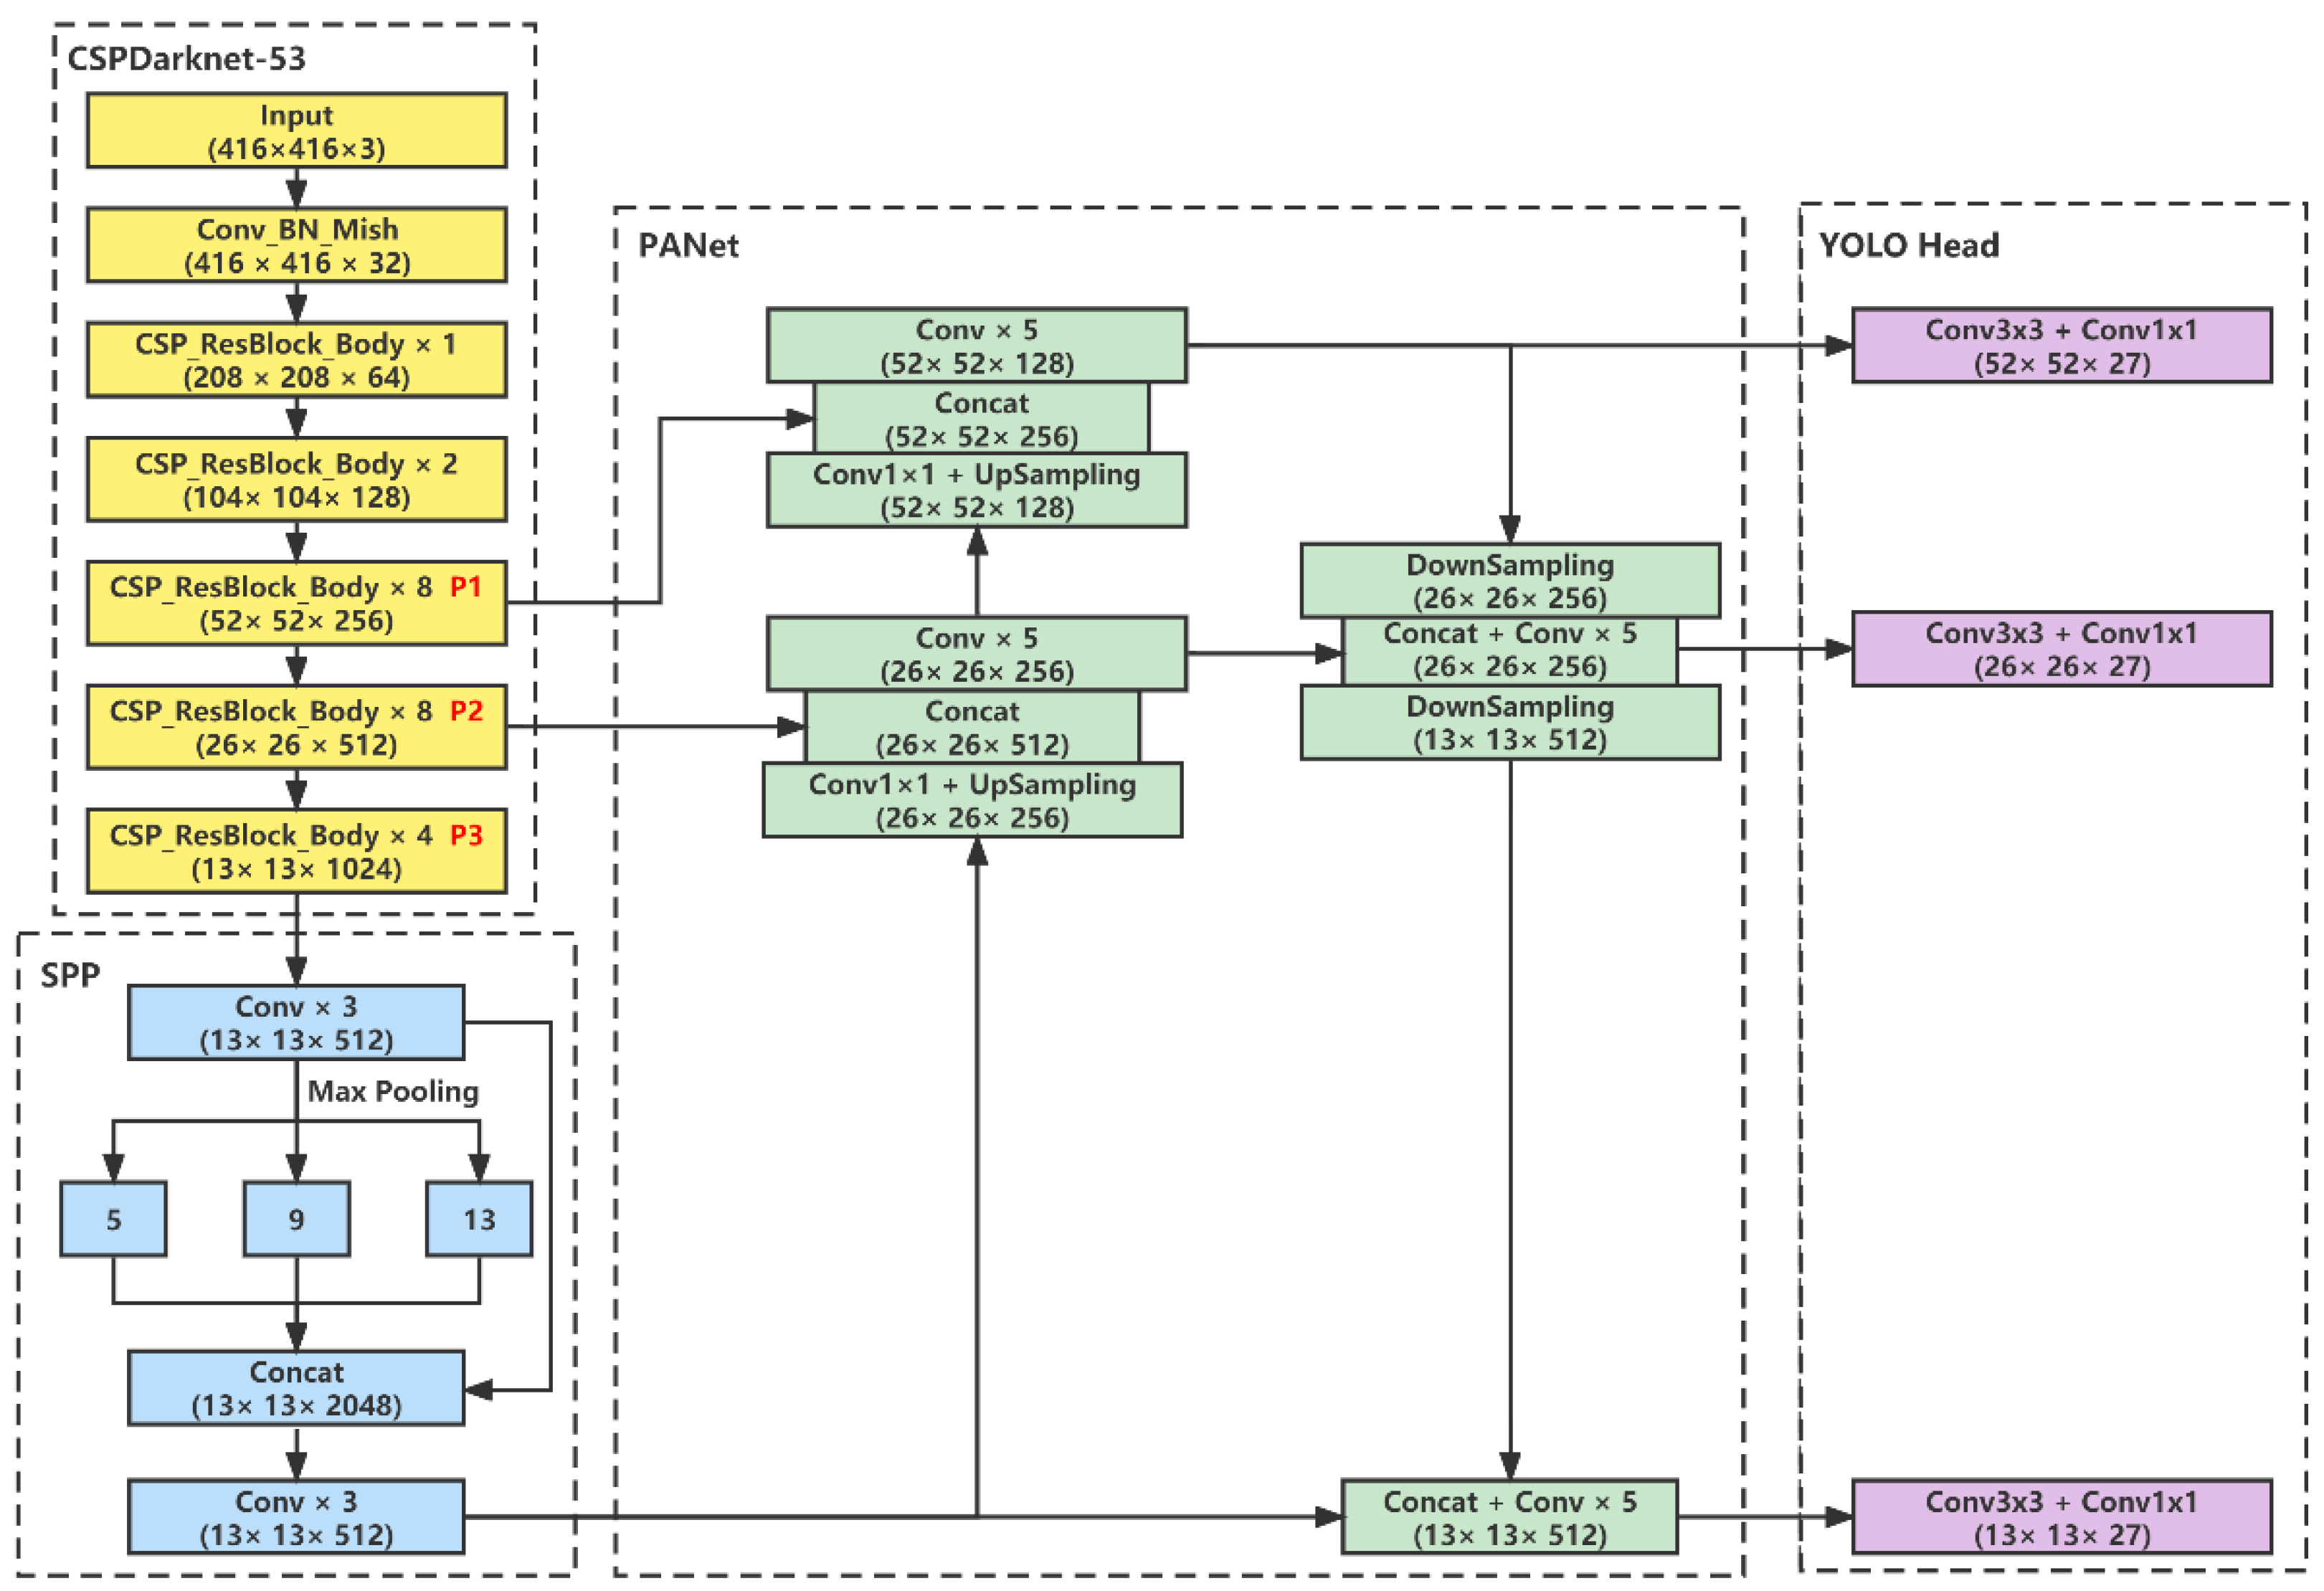
The overall structure of YOLOv4 is shown in
Figure 5. Compared with YOLOv3, YOLOv4 has three main innovations in the network structure, including the backbone feature extraction network CSPDarknet53, the spatial pyramid pooling (SPP) module and the path aggregation network (PANet). CSPDarknet53 adds the Cross Stage Partial connections (CSP) module [
23] on the basis of Darknet53. The CSP module can reduce computation and memory costs while improving the accuracy of the model. As shown in
Figure 5, CSPDarknet53 consists of five residual structures CSP_ResBlock_Body, whose network structure is shown in
Figure 6. After the input images pass through the backbone network, three feature maps of different scales P1, P2 and P3 are obtained, which are responsible for the detection of large, medium and small targets, respectively. These three feature maps will be sent to the Neck network for feature fusion.
As shown in
Figure 5, the neck of YOLOv4 consists of the SPP module [
24] and PANet [
25]. The core idea of the SPP module is to perform max pooling operations of different scales on the input feature maps and then obtain a fixed-length feature map through splicing operation. PANet is based on the FPN [
26] with a bottom-to-top information fusion path. Larger scale feature maps have high resolution and can provide more accurate spatial information, while smaller scale feature maps have a larger receptive field and can provide higher level semantic information. The higher-level semantic information can help us detect the target accurately, and the lower-level spatial information can tell us the exact location information of the target, fusing these features can improve the accuracy of object detection.
YOLOv3 combines semantically rich high-level features with low-level spatial information through a top-down path. However, this method may cause the loss of spatial information due to the long path. For the high-level feature layer used to detect large objects, the spatial information may need to be propagated through hundreds of layers to be fused with the high-level semantic information. PANet adds a bottom-up path on the basis of FPN, which greatly shortens the distance between low-level features and high-level features, enhancing the fusion ability between different feature layers.
3.3.2. The Improved YOLOv4 Model
Although YOLOv4 applies many improved strategies based on YOLOv3, it does not perform well when directly applied to the sewer defect detection task, and there will be missed and wrong detections in some defect types. To address these issues, this paper proposed an improved model based on YOLOv4.
The original YOLOv4 network feeds the last feature layer P3 of the backbone network into the SPP module for feature enhancement. This module has many advantages, such as the ability to solve the target multiscale problem to some extent, obtaining different important context features to expand the receptive field [
3], and not significantly slowing down the network operation. In this paper, two SPP modules are added to the original network to enhance the P1 and P2 feature maps of the backbone network. The improved network structure is shown in
Figure 7. The three feature maps (P1, P2 and P3) are enhanced by the SPP modules and then input to the PANet network for feature fusion. This method can obtain a richer feature representation, which is expected to further improve the detection accuracy of the model.
3.3.3. Different Bounding Box Loss Functions
The effectiveness of the object detection tasks highly depends on the definition of the loss function. The loss function of YOLOv4 is shown in Equation (1), where
represents the loss of the bounding box,
represents the loss of target confidence, and
represents the loss of the category to which the target belongs.
There are several methods to calculate the loss of bounding boxes. YOLOv3 uses the mean square error (MSE) to calculate the loss of bounding boxes, but this method does not consider the integrity of the object and cannot continue learning when the predicted bounding box and ground truth do not overlap, so MSE is not used in this paper for testing. YOLOv4 uses CIoU to calculate the bounding box loss, which is a helpful solution to the shortcomings of MSE. However, sewer pipe defect images are different from traditional nature images. In order to find the most suitable loss function, a total of three different bounding box loss functions are investigated in this paper for their impact on model performance, including GIoU [
27], DIoU [
28] and CIoU [
28]. The details of the three loss functions are as follows:
- (1)
As shown in Equation (2), in addition to considering the overlap area, GIoU adds the minimum outsourcing box as a penalty item, which solves the problem that the learning cannot continue when the predicted bounding box does not overlap the ground truth;
- (2)
As shown in Equation (3), DIoU considers the Euclidean distance of the center point on the basis of GIoU, which solves the problem of large loss values when the distance between the predicted bounding box and ground truth is great;
- (3)
As shown in Equation (4), CIoU considers the degree of overlap, Euclidean distance of the center point and aspect ratio. With the aspect ratio, CioU can distinguish prediction bounding boxes with the same IOU but different regression effects.
In Equation (2),
denotes the predicted bounding box,
denotes the ground truth and
denotes the smallest box which covers
and
. As shown in Equation (5),
IoU denotes the intersection ratio of
A and
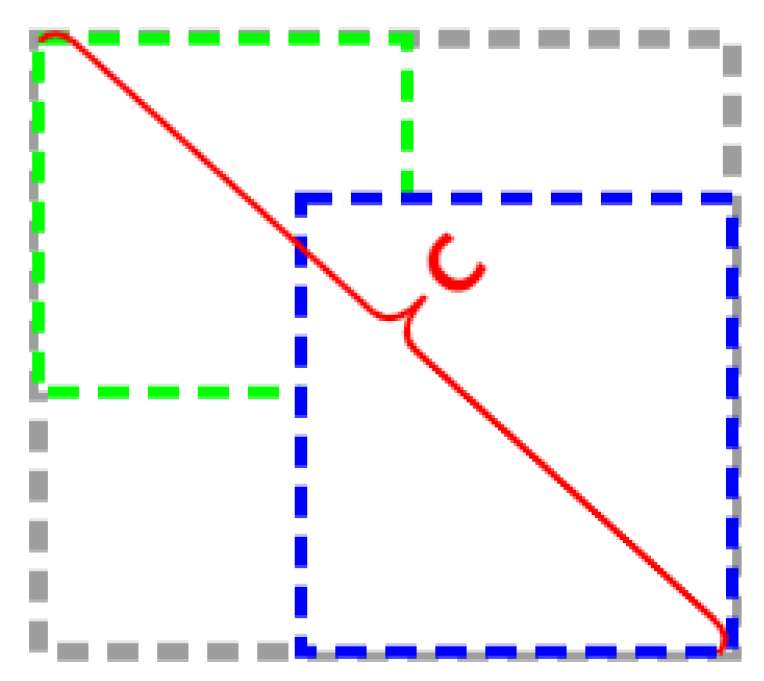
B. In Equation (3),
and
denotes the center point of
and
, respectively,
denotes the Euclidean distance between
and
and
is the diagonal distance of
as shown in
Figure 8. In Equation (4),
is the weighting factor and
is used to measure the consistency of the aspect ratio. The calculations of
and
are shown in Equations (6) and (7).
In this paper, we compare the influence of three different bounding box loss functions by replacing in Equation (1) with , and , respectively.
3.4. Performance Evaluation
Recall, Precision and F1 are usually used as performance evaluation indicator after models have been trained. The calculations of these indicators are shown in Equations (8)–(10).
In the sewer pipe defect detection task, TP (true positive) denotes the number of sewer defects that are correctly predicted as defects; FP (false positive) denotes the number of sewer backgrounds that are incorrectly predicted as defects; and FN (false negative) denotes the number of sewer defects that are incorrectly predicted as non-defects.
However, using precision and recall individually cannot accurately evaluate the performance of object detection models. In this paper, average precision (AP) and mean average precision (mAP) are also used as evaluation metrics. AP is a comprehensive metric of precision and recall, which is used to calculate the average precision of a class at different recall, and mAP is the average of all APs. The calculations of AP and mAP are shown in Equations (11) and (12).
3.5. Experimental Preparation
In order to ensure comparability among different models, the environment configuration, parameter information and dataset used in this paper are the same for all models. As shown in
Table 2, the sewer pipe dataset contains a total of 2700 images, with 85% randomly selected for model training, 5% for model validation and 10% for model testing. The experiments are conducted on Ubuntu system with an Intel(R) Xeon(R) CPU E5-2650 v4 @2.20 GHz (Intel Corporation, Santa Clara, CA, USA) and an NVIDIA GeForce RTX2080Ti GPU (Nvidia Corporation, Santa Clara, CA, USA).
The parameters used in the experiments are shown in
Table 3. A total of 300 epochs are trained for each model, with a batch size of 8. During the training process, Adam is used as the optimizer, and the Cosine Annealing Scheduler is used to adjust the learning rate [
3]. During the model evaluation process, the threshold of NMS is set to 0.5.
We did a set of comparative experiments to verify the effectiveness of the Adam and Cosine annealing Scheduler. The YOLOv4-Adam-CA represents the use of Adam optimizer and Cosine annealing Scheduler strategy, and YOLOv4-SGD-StepLR represents the use of SGD optimizer and StepLR strategy. The loss curves of different models during training are shown in
Figure 9. It can be seen that the YOLOv4-Adam-CA model has lower training loss and better training results when using Adam and Cosine annealing Scheduler.
4. Results and Discussion
There are three experiments in this study, and the purpose of each experiment is as follows: (1) Using YOLOv4 as the baseline, study the impact of three bounding box loss functions on defect detection performance, including GIoU, DIoU and CIoU, so as to select the most effective loss function for further research; (2) based on Experiment 1, introduce the SPP module to improve the network structure. By comparing the detection performance of different loss functions combined with the SPP module, select the best detection model; and (3) compare our model with other state-of-the-art detection models, and analyze the actual detection effects of different models to verify the effectiveness of our method.
4.1. Experiment 1 and Results
Experiment 1 used GIoU, DIoU and CIoU to calculate the regression loss of the prediction bounding box, and the obtained models were named YOLOv4-GIoU, YOLOv4-DIoU and YOLOv4-CIoU, respectively. The loss curves of the three models during the training process are shown in
Figure 10. Due to the large loss function values in the earlier period, the figure shows the loss function value starting from the 30th Epoch. It can be seen from the loss curve that the loss value of YOLOv4-DIoU and YOLOv4-CIoU fluctuates relatively little during the training process, and the convergence speed is relatively fast. The loss value of YOLOv4-GIoU fluctuates relatively large.
Table 4 shows the mAP of each model on the test set and the AP value for each defect class. As shown in
Table 4, YOLOv4-CIoU achieves the highest AP value for crack detection among all models, and YOLOv4-DIoU achieves the highest AP value for other defects, which means that YOLOv4-DIoU has higher performance for most classes. YOLOv4-GIoU has the worst detection performance, with lower AP values for all classes than the other models. It can be found that YOLOv4-DIoU has achieved the highest mAP of 87.9%, but the difference with YOLOv4-CIoU is very small, only 0.22%.
The experimental results show that both YOLOv4-DIoU and YOLOv4-CIoU have excellent detection capability for sewer pipe defects. As DIoU and CIoU consider the distance between the predicted bounding box and ground truth, they can directly minimize the distance between two boxes, which makes the model have faster convergence speed and higher detection accuracy. Due to the comparable performance of YOLOv4-DIoU and YOLOv4-CIoU, these two models are selected for further study in Experiment 2.
4.2. Experiment 2 and Results
Based on the results of Experiment 1, this paper improves the network structure on the basis of YOLOv4-DIoU and YOLOv4-CIoU. The improved models are named YOLOv4-D-SPP3 and YOLOv4-C-SPP3, respectively. As shown in
Table 5, YOLOv4-D-SPP3 achieves the highest AP for all defect classes, in particular the highest AP of 88% for crack. It can be found that YOLOv4-D-SPP3 improves the mAP by 4.4% compared to YOLOv4-DIoU and YOLOv4-C-SPP3 improves the mAP by 0.5% compared to YOLOv4-CIoU, which means that the combination of the improved network structure and DIoU can further improve the detection performance. Nevertheless, the combination with CIoU only has a tiny performance improvement for the model.
Table 5 also shows the detection speed of different models on the test set. Due to the addition of the SPP modules, the network structure of YOLOv4-D-SPP3 is more complex, and the detection speed has decreased. Nevertheless, the difference in detection speed is very tiny and has little effect on practical detection. The above experimental results show that the improved YOLOv4 model not only improves the defect detection performance but also does not cause a lot of computational costs. Since the YOLOv4-D-SPP3 model achieves optimal performance, it is chosen as the final improved model.
4.3. Experiment 3 and Results
In order to further verify the effectiveness of the final improved model, we compared it with current mainstream object detection models with the same training method. Other detection models include single-stage detection models SSD, YOLOv3, YOLOv7 and YOLOv8, two-stage detection models Faster-RCNN and transformer-based model, DETR [
29] and Swin-Trans-YOLOv4. The Swin-Trans-YOLOv4 model is to use Swin Transformer [
30] as the backbone of YOLOv4. The experimental results are shown in
Table 6, and
Figure 11 shows some detection results of these detection models.
As shown in
Table 6, YOLOv4-D-SPP3 achieves a mAP of 92.3%, which is higher than other recent studies and achieves the highest AP on all classes of detection. It should be noted that due to the more complex network structure and more computing costs, the FPS of our model is lower than other models, but still higher than Faster R-CNN.
We selected five representative models to detect some defects, and the detection results are shown in
Figure 11, the red boxes are stagger, the purple boxes are root, the blue boxes are crack and the green boxes are deposition. All five models have the ability to detect different types of defects in complex environments, but the detection results are different. The model proposed in this paper can detect more defects under the same conditions and has the highest degree of overlap between the predicted bounding box and ground truth, which means that our model has better detection performance. Nevertheless, all other models have missed or wrong detections. For example, the detection results of YOLOv3 have different degrees of missed detection for stagger and cracks on the first and third images. The YOLOv7 model has missed detection for stagger and root on the second and fourth images. The detection result of Faster R-CNN has many redundant prediction boxes on the second image and low overlap with ground truth on the fourth image. The detection result of DETR model have many redundant detections on the third and fourth pictures, which will greatly interfere with the judgment of technicians.
Table 7 shows the Recall and F1 values for each model on the test set. It can be seen that our model achieves the highest average recall rate. A higher recall means that the model misses fewer defects. For sewer defect detection, it is necessary to identify as many sewer defects as possible, so a higher recall is more important. Although DETR and Faster R-CNN also have a high average recall rate, their precision and F1 value are much lower than other models. The reason is that DETR and Faster R-CNN have a large number of predicted bounding boxes that are incorrectly predicted as defects, which results in a low precision and F1 value. A large number of incorrect prediction boxes may cause great interference to the judgment of technicians and seriously affect work efficiency. As shown in
Figure 11, the detection results of DETR and Faster R-CNN also illustrate this problem.
Figure 12 shows the precision–recall curves of the five models on the test set. It can be seen that our model has the highest curve, which means better detection performance.
In conclusion, the improved model proposed in this paper, namely YOLOv4-D-SPP3, can more effectively detect several different types of defects and accurately label their locations. In terms of accuracy, our model achieves the best performance among these methods.
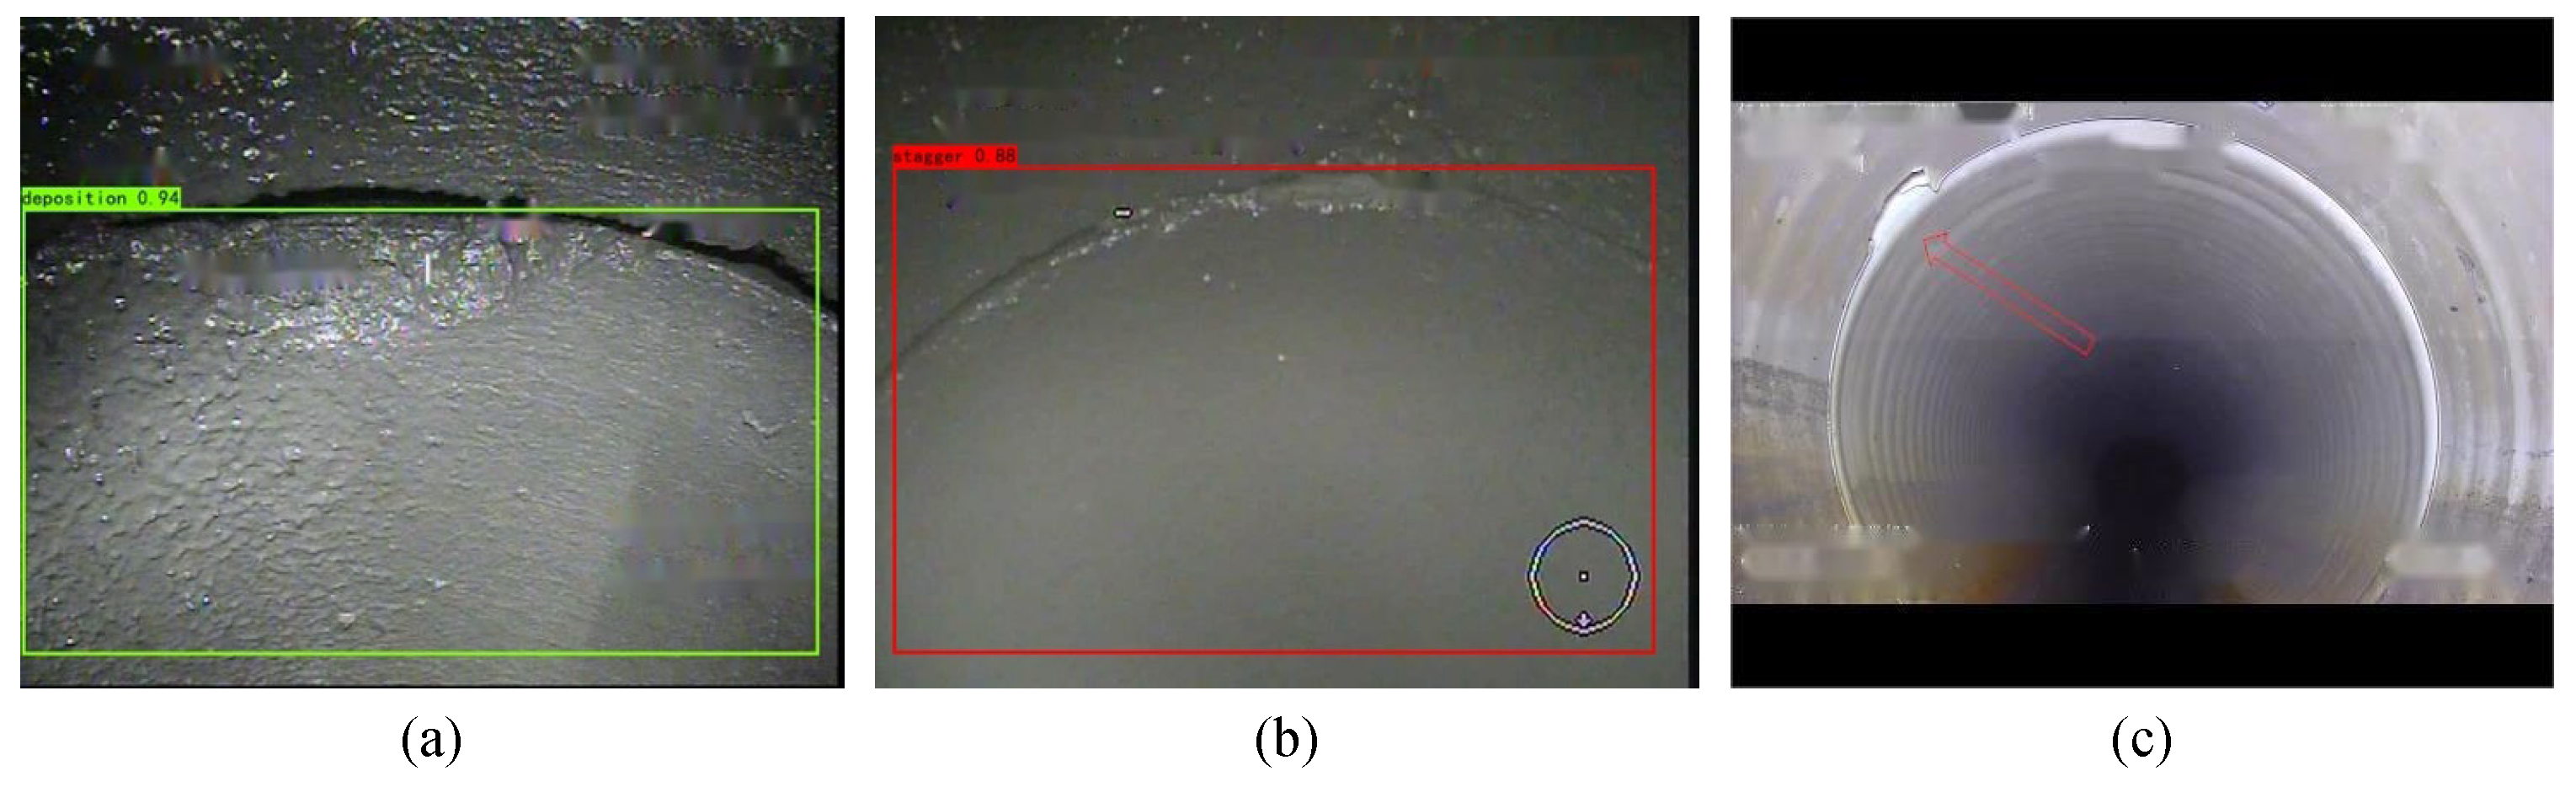
It should be pointed out that our method may be wrong in some special cases. As shown in
Figure 13, the crack in
Figure 13a is incorrectly identified as deposition. The reason may be that the sewer pipe at this location is darker and not smooth like normal pipes, which are very similar to deposition defects, resulting in model detection errors. In
Figure 13b, the crack is incorrectly identified as a stagger. The reason may be that the image is very blurry and contains a lot of noise, which causes significant interference to the detection of the model. In
Figure 13c, the crack defect is missed. The location of the crack is indicated by the red arrow in the figure. The reason may be that this crack occurs at the pipe junction, and its color is very similar to the background of sewer, and its features are not obvious, which causes the model to miss the detection.
It can be seen that when encountering some extreme situations, such as uneven lighting or noise interference during image shooting or transmission, the detection effect will be significantly affected. In addition, when the defect features are not obvious or very similar to the pipeline background, all of them may cause error cases. Among them, errors in identifying crack defects are relatively common.
The attention mechanism can improve the ability of the model to extract critical features and suppress the influence of interference information such as noise. Introducing an attention mechanism in the model may reduce the occurrence of these errors, and further research will be done in the future.
5. Sewer Defect Detection System
At present, there are many use cases for applying deep-learning-based detection technology in the real world [
6,
31], which demonstrate the practical implementability of the proposed method.
In this section, we propose a potential sewer defect detection system whose workflow is shown in
Figure 14. Firstly, the CCTV robot collects the video data of the sewer pipes. Secondly, these videos will be fed directly into the system for the detection of specific defects. Finally, the system will output the final inspection results and give them to professional technicians for processing. The output of the system contains two parts, the labeled video and the defect frames extracted from the video.
Figure 15 shows the labeled video and the extracted defect frames which come from an actual inspection project of an underground pipeline in Shanghai. It can be seen that in the labeled video, different defects are marked with bounding boxes of different colors, which makes it easy for technicians to review.
Defect detection is usually divided into two steps: fieldwork and office work. In fieldwork, technicians use professional detection equipment to obtain video data of sewer and save it to storage devices for office personnel to view. In office work, experts watch the collected sewer videos in detail and manually record information about each defect. The proposed system is mainly used for office work inspection, so only a personal computer that can run the system is required and no hardware equipment is required. Of course, the better the performance of the computer, the faster the detection speed of the system, which is far higher than the speed of manual defect detection.
When the detection performance of the system is good enough, technicians can directly evaluate the state of the sewer pipe by watching the labeled video. The defects annotated using bounding boxes allow the technician to spend less time and effort in reviewing them. Moreover, the defect frames output by the system allows technicians to produce inspection reports without manually capturing and labeling images from the video. As shown in
Figure 13c, the red arrow is manually annotated by technicians, which also takes a lot of time. Overall, this system can significantly speed up the detection efficiency of sewer defects, reduce the work intensity of technicians and has high accuracy, which provides a very important application value.
6. Conclusions and Future Work
Examining the problems of low efficiency and difficulty in ensuring the accuracy of the traditional CCTV inspection method, we present an improved YOLOv4 model for the detection of sewer pipe defects. By improving the network structure, the detection accuracy of sewer defects is effectively improved. By comparing different bounding box loss functions, the effectiveness of the combination of DIoU loss function and SPP module is verified.
Overall, the model proposed in this paper has the following advantages: (1) it has a higher detection performance. Experimental results show that the proposed model achieves a mAP of 92.3% and an average recall of 89.0% on the test set. Compared with the state-of-the-art detection models, such as YOLOv7, YOLOv8 and transformer-based models, our model achieves better performance in detecting multiple sewer defects, not only with higher mAP and recall rate, but also with better actual detection results, which means that it can be better adapted to the sewer defect detection tasks. (2) It has good detection speed. Although the detection speed of our model is lower than that of YOLOv3 and YOLOv7, it is still much higher than Faster RCNN. Overall, the model has the highest detection performance and good detection speed, achieving a balance between detection accuracy and speed. (3) It has better detection accuracy for small defects. Due to the addition of the SPP module, the detection and recognition effect on small defects such as cracks has been significantly improved, which avoids the long-term concentration of technicians to detect these difficult-to-find defects. Compared with the manual detection method, our method can reduce the work intensity of technicians, speed up the detection process and improve work efficiency.
In fact, the majority of the sewer pipes are normal with no defects, and it will undoubtedly waste a lot of time to directly detect the video. In future work, we will investigate the extraction of key frames containing defects from sewer videos to reduce the overall detection time. In addition to the four types of defects studied in this paper, there are many other types of defects such as fraction and barrier in sewer pipes. These defects can also seriously affect the healthy operation of the sewer systems. More images of other types of defects will be collected for future research.


