Article

Exploring the Effects of Blockchain Scalability Limitations on Performance and User Behavior in Blockchain-Based Shared Manufacturing Systems: An Experimental Approach

Faculty of Mechanical Engineering, University of Ljubljana, Aškerčeva 6, SI-1000 Ljubljana, Slovenia
*
Author to whom correspondence should be addressed.
Appl. Sci. 2023, 13(7), 4251; https://doi.org/10.3390/app13074251
Submission received: 23 February 2023 / Revised: 21 March 2023 / Accepted: 24 March 2023 / Published: 27 March 2023

Abstract

:
This study investigates the effects of blockchain technology scalability limitations on the performance of Blockchain-Based Shared Manufacturing (BBSM), an innovative smart-manufacturing paradigm aimed at enhancing the utilization of global manufacturing resources via peer-to-peer (P2P) collaboration of self-organized manufacturing assets. Despite the prevalence of research highlighting blockchain technology’s scalability limitations as the main barrier for adoption, few studies have explored their effects on the operation of blockchain-based systems. The primary goal of the presented research work is to explore the implications of blockchain technology scalability limitations on the BBSM system’s performance and user behavior. To obtain realistic behavior, an experiment is conducted using an online game played by human participants. Analysis of the players’ strategy is used for implementation of a multi-agent simulation model, which is then employed to assess the influence of varying blockchain network configurations on the BBSM concept’s performance. Preliminary experimental findings reveal that a congested blockchain network leads to increased transaction costs and reduced service prices, consequently devaluing the manufacturing role in the BBSM system and causing underutilization of existing maximum production capacities. Moreover, allocating funds to financial activities rather than manufacturing activities yields superior outcomes for system users. Simulation results indicate that the BBSM system’s response to alterations in blockchain network throughput is contingent upon the production function. The findings of this study reveal that the scalability limitations of blockchain technology impair the performance of the BBSM system and affect user behavior in the system, underscoring the necessity for future research to concentrate on incorporating scalable solutions within blockchain-based manufacturing systems.

1. Introduction

The development of technology and new approaches to combining disruptive concepts from different fields has resulted in new modes of smart manufacturing that try to satisfy the requirements of the Industry 4.0 paradigm. Shared Manufacturing (SM) [1] is a mode of smart manufacturing that combines advances in technology, economics, and society, intending to improve the organization of the global production system by harnessing unused resources. This approach vertically dissects the manufacturing system structure, positioning individual manufacturing components directly within the marketplace as distinct services. With this vertical cut into manufacturing systems, individual Autonomous Production Units (APUs) appear at the highest level on the market [2]. Their operation can be adapted to the situation on the global market as well as to the situation in the local production plant. Such organization of manufacturing systems extends to the individual level, consequently enhancing the social aspects of manufacturing. This, in turn, benefits participants (consumers and providers) by augmenting capabilities and competitiveness, thereby fostering mutually advantageous business models [3].
Connecting and organizing manufacturing entities that do not trust each other on the global level is one of the main problems in the establishment of such an open manufacturing system. Blockchain technology, introduced as a countermeasure to manipulations by centralized organizations within the banking system, is emerging as a solution that can promote and foster trust among competitive entities engaged in global networks [4]. In order to enable a trusted environment for operation of the SM system, a Blockchain-Based Shared Manufacturing concept was presented in [3]. Due to the characteristics of blockchain technology, (e.g., decentralization, immutability, and transparency), several potential benefits for manufacturing systems have been recognized (see Table 1). Most of the benefits are related to secure and correct executions of interaction between different manufacturing entities.
Nonetheless, blockchain technology exhibits specific constraints. Historically, extant blockchain networks have grappled with performance issues such as diminished throughput and elevated transaction latency [14]. Scalability in a blockchain network refers to its capacity to support a growing volume of transactions effectively [15], and is lower compared to centralized non-blockchain systems [16]. A compromise exists among the three key attributes of a blockchain network: scalability, security, and decentralization [17]. Highly secure and decentralized blockchain networks, which are generally more trusted, struggle to handle any significant surge in transaction requests. Consequently, transaction processing times are extended and fees increase as users compete for faster confirmations. These scalability constraints impact the performance of systems reliant on blockchain technology [18]. The increasing number of publications regarding the scalability limitations of blockchain technology shows that this is the main source of concern regarding the worldwide adoption of the blockchain technology [16].
In this paper, the effects of blockchain technology’s limitations on the performance of the BBSM system and on the behaviour of system users are explored. The contributions of this paper are summarized as follows:
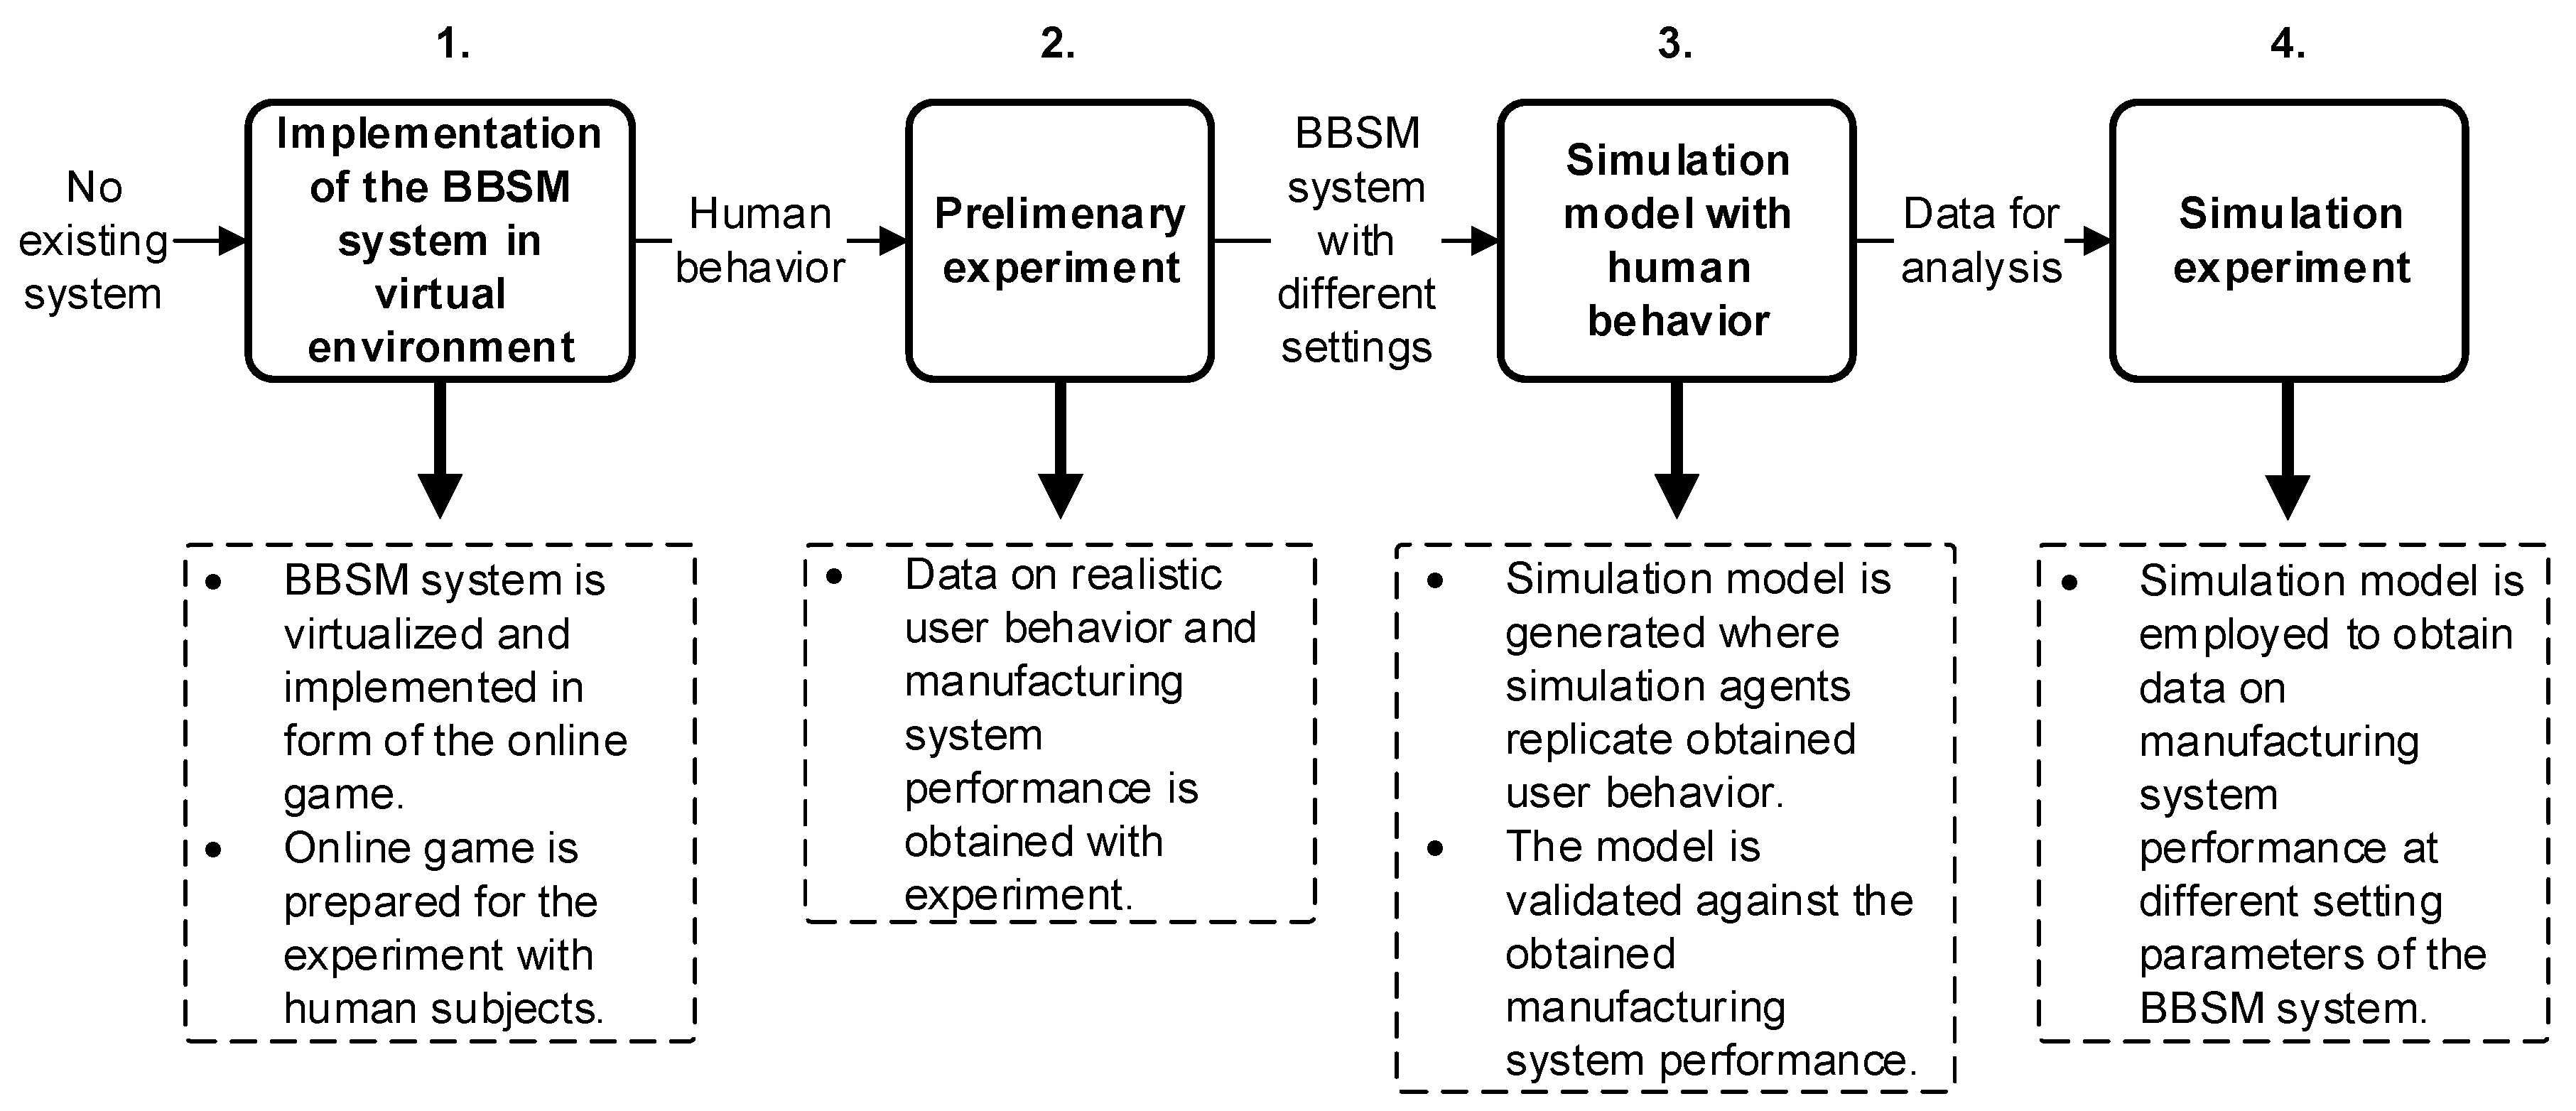
  • A novel approach employing experimental methodology is presented in the field of blockchain-based manufacturing. An experiment was conducted in the form of an online game to identify the strategies of people in situations that arise due to the limitations of blockchain technology in BBSM contexts. A simulation model that mimics the behavior of players was used to observe how different blockchain network settings affected the BBSM system.
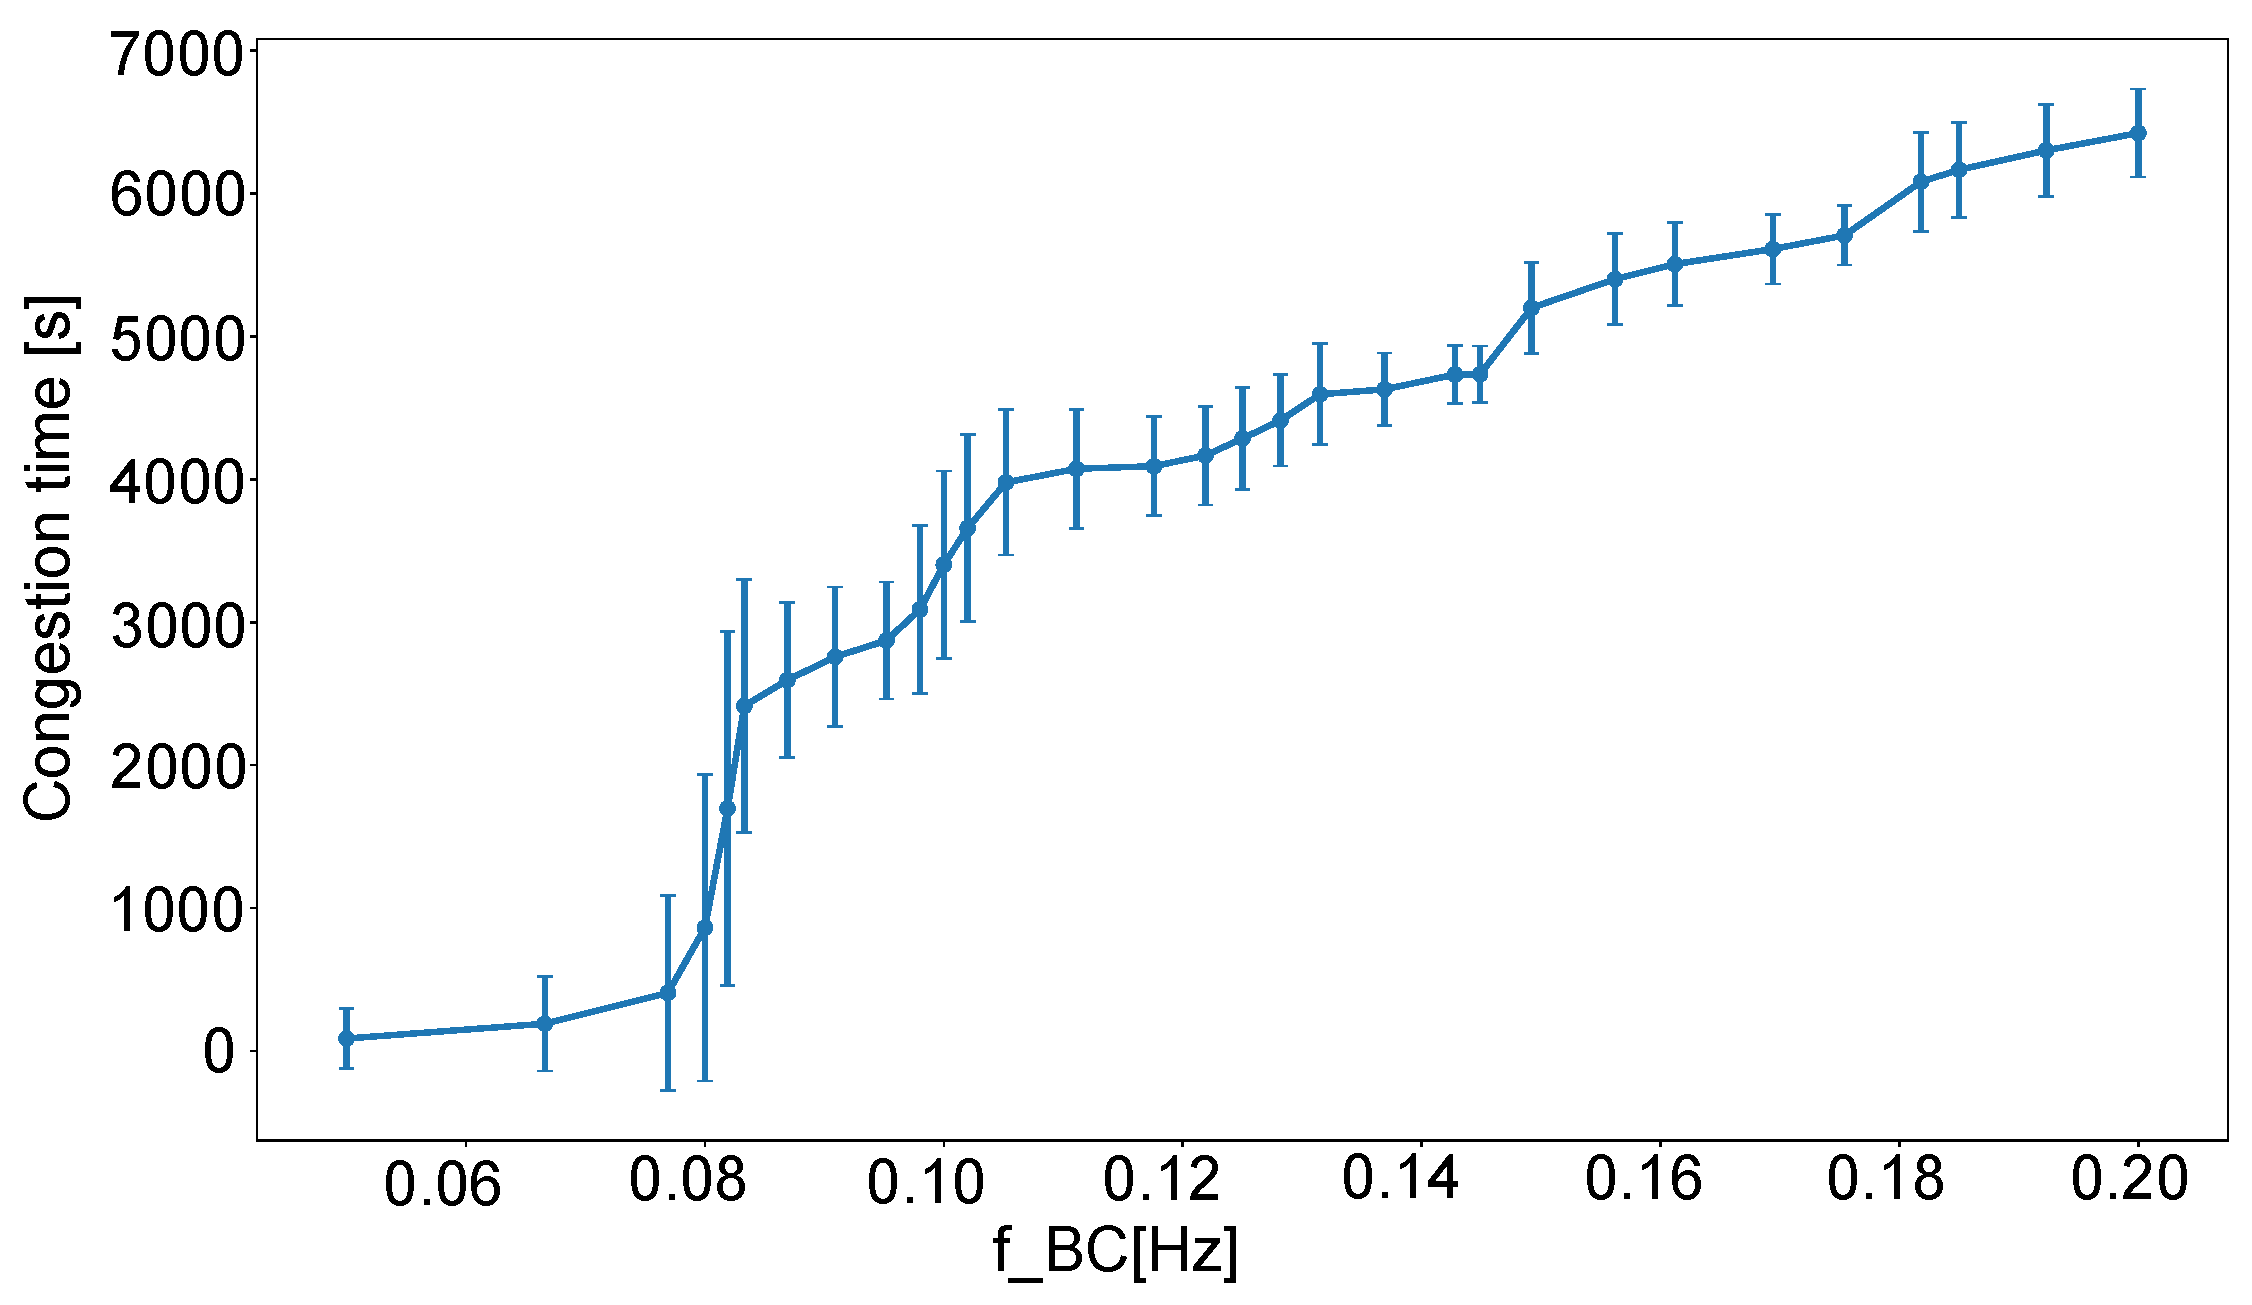
  • The results of the preliminary experiment indicate that congestion of the blockchain network can lead to depreciation of the manufacturing role in the BBSM system, meaning that the BBSM system is not able to utilize the maximum production capacity existing in the manufacturing system.
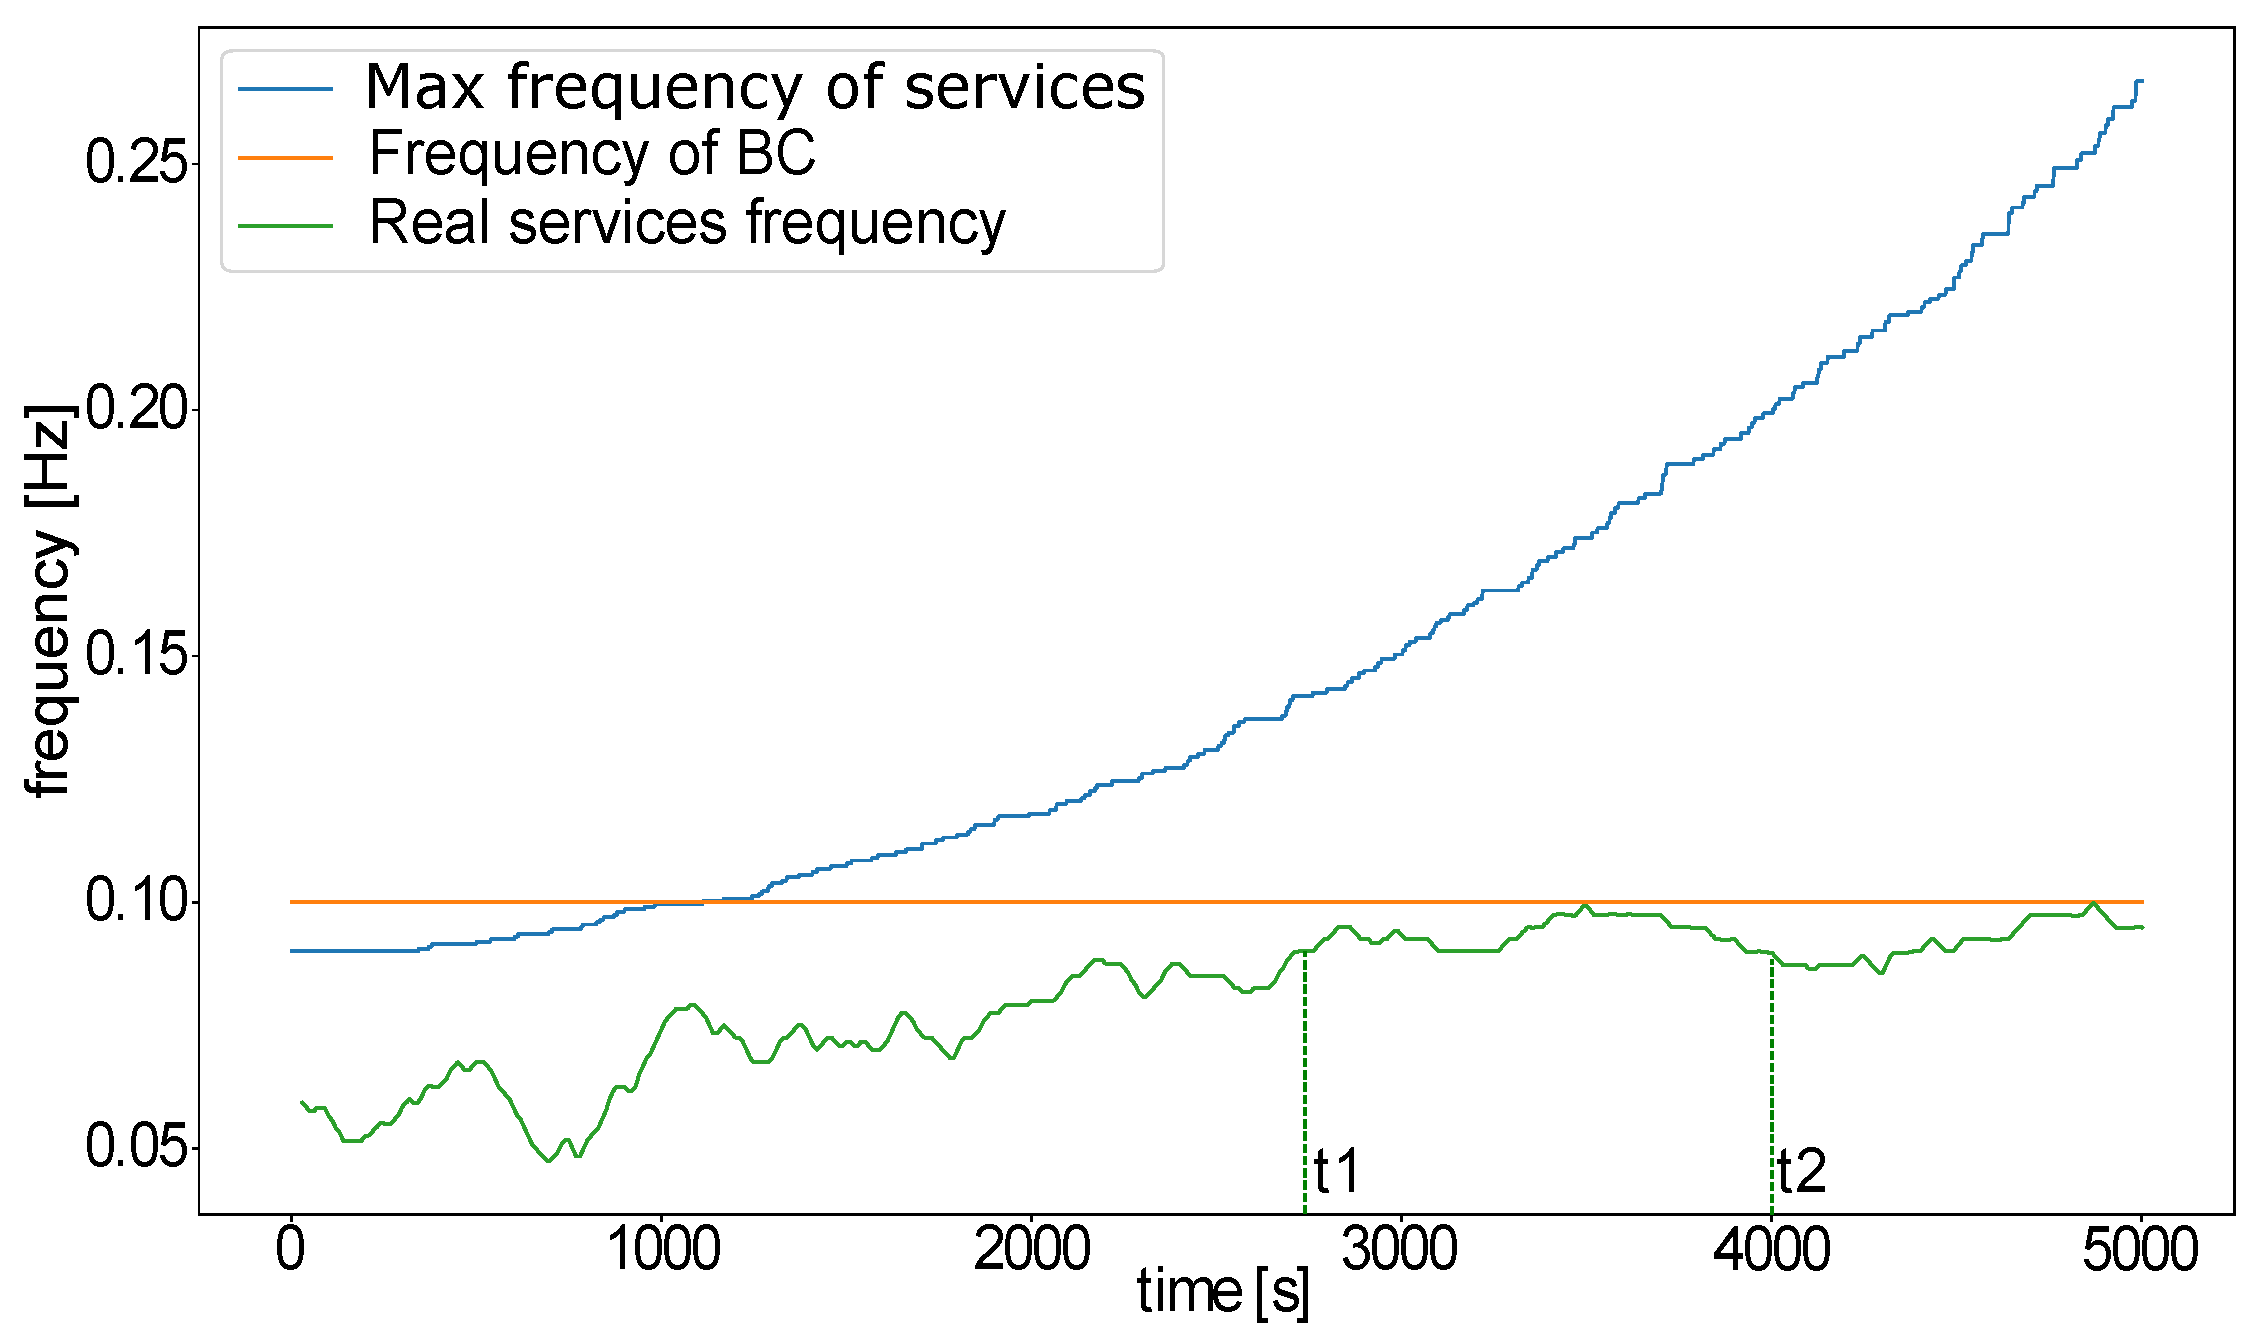
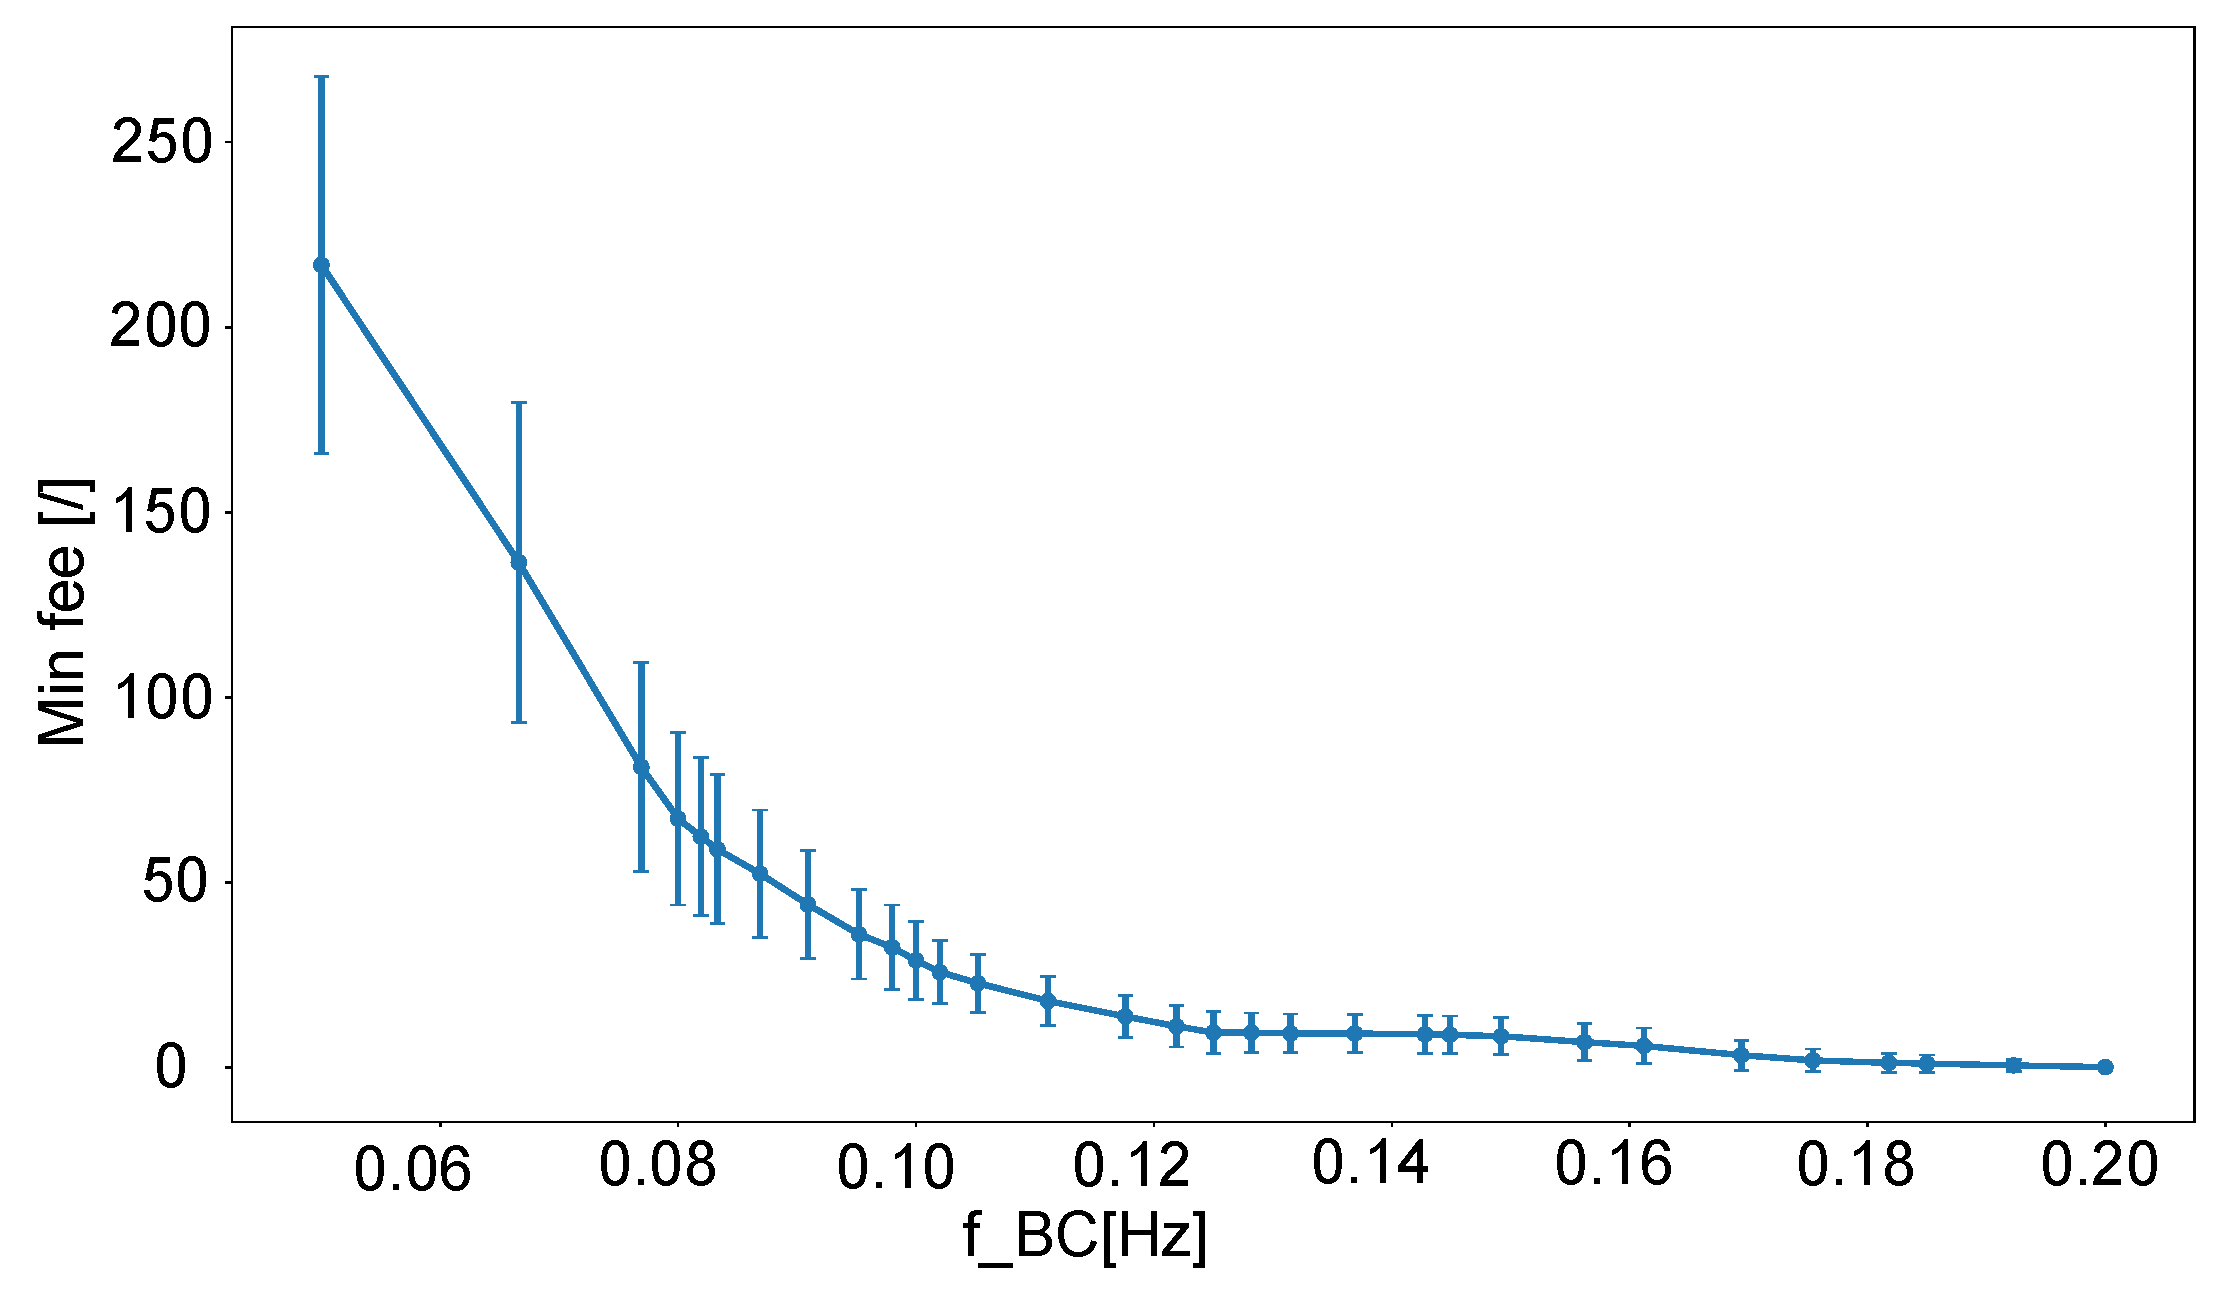
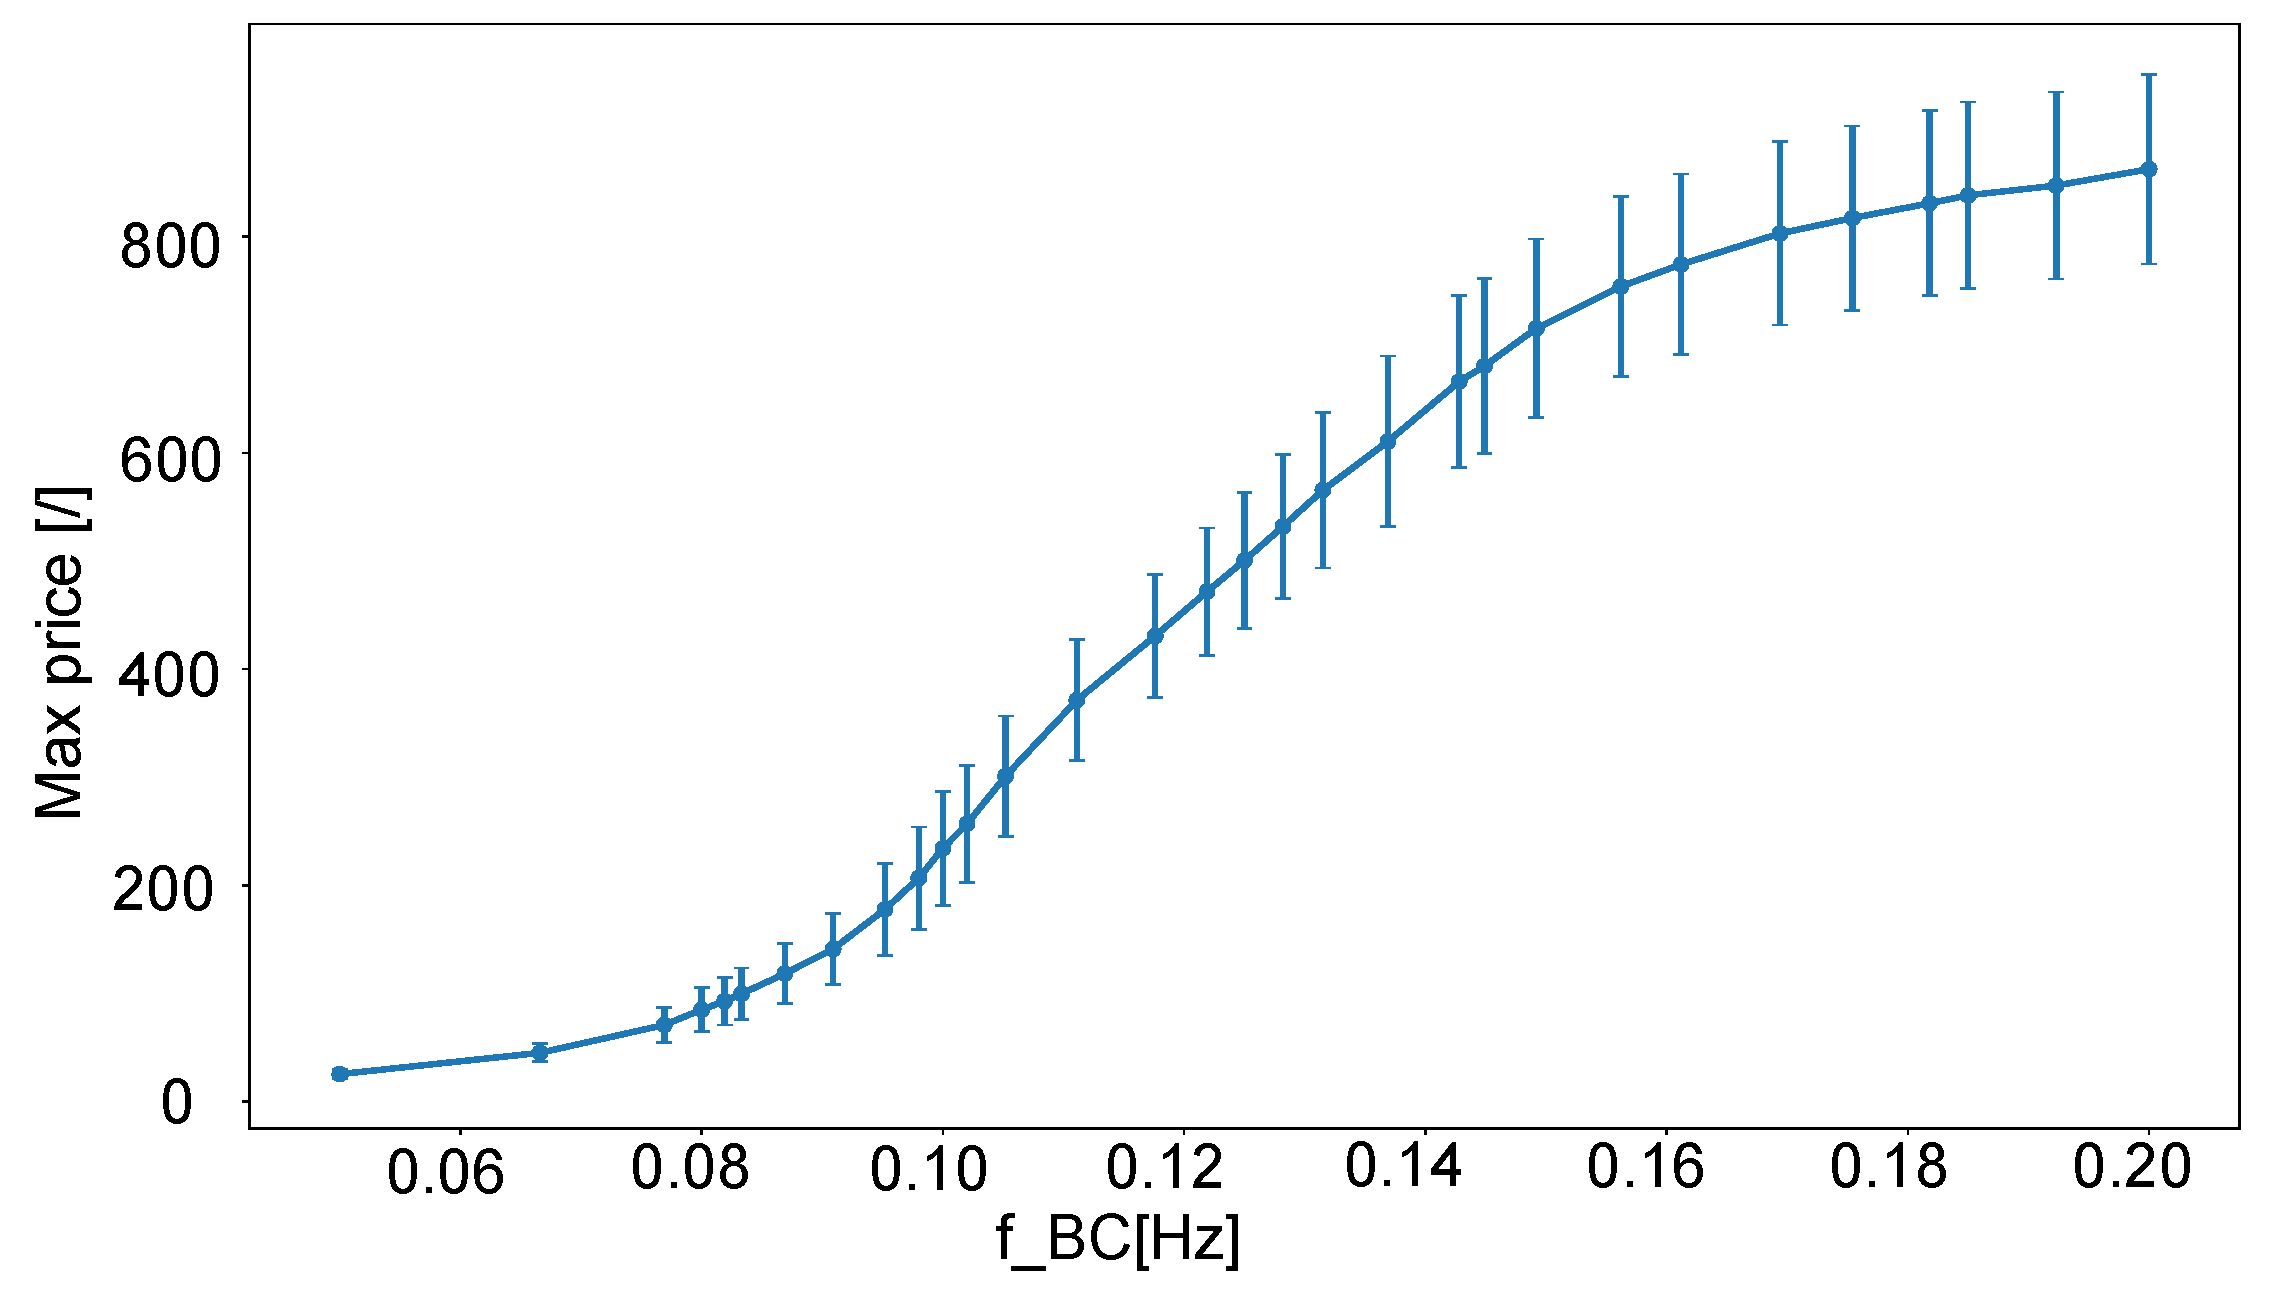
  • The results of our simulations suggest that changes in the blockchain network throughput in the BBSM system result in opposite changes in the maximum price of the service and the maximum transaction fee of the transaction according to the production function. This means that increasing the frequency of transaction confirmation increases the service frequency in a non-trivial way, though it is difficult to determine how much the service frequency will increase by.
The subsequent sections of this paper are structured as follows. Section 2 presents a literature review. The methodology employed in the study is presented in Section 3. Section 4 outlines the implementation of the BBSM system and preliminary experiment. Section 5 describes the implemented simulation model. In Section 6, the results of the experiments with the simulation model are presented. Finally, the conclusions drawn from our research are presented in Section 7.

2. Review of the Literature

Shared Manufacturing is a mode of smart manufacturing developed on the principles of the sharing economy. The main property of the sharing economy is that any user can share their unused available resources. To ensure the sharing of resources in the global market, the consumers and providers of these services need a platform where they can meet. Such a space creates a strong network effect, which is supported by the increasing number of participants in the ecosystem. Additionally, it provides the financial potential for emerging market growth, relying on extensive, secure, and decentralized access [19].
On the other hand, connecting and organizing such a dispersed group of entities at the global level is challenging. This problem is usually addressed through a centralized platform, where problems of trust in the platform provider are likely to arise [4]. Experience with existing centralized sharing economy platforms shows the occurrence of manipulation of such systems by the platform provider, including misuse of user data to privilege certain users who offer more money or have a better personal relationship with the provider and limit access to less important users [19,20]. Thus, centralized platforms do not provide equal opportunities for new users to integrate into the system and do not inspire confidence in the system. Decentralized platforms offer an alternative in which the operating conditions are known and transparent in advance and decisions are made in a decentralized way. Such platforms provide equal opportunities for users to integrate into the system. A decentralized platform can be implemented using blockchain technology, which enables financial transactions and the transfer of information between users via smart contracts [21].
The integration of new technologies into existing systems brings both advantages and disadvantages; however, the disadvantages and their impact on the existing system are often overlooked. In terms of the Industry 4.0 paradigm, limitations such as data security have been acknowledged, primarily stemming from the integration of the Internet of Things (IoT) concept to facilitate cyber–physical systems. Case studies on existing companies show that enterprises perceive an increased threat of cyberattacks fueled by Industry 4.0 due to low data security and lack of protection against unauthorized access [22]. Moreover, the complexities of device, statistical, and model heterogeneities within intricate IoT environments present significant hurdles for novel machine learning techniques [23]. Threats to knowledge sharing in smart manufacturing systems have been discovered, including that unregulated external sharing of knowledge can result in inadvertent knowledge leaks and reduced performance in radical innovation contexts [24]. Furthermore, the adverse impact of information technology on the mental wellbeing of employees in manufacturing companies has been acknowledged [25]. Such disadvantages of IoT technology on manufacturing systems increase the risk of fragility, and induce additional uncertainty in addition to the fundamental uncertainties present in the manufacturing system.
Similar to the integration of IoT technology in manufacturing systems, the integration of blockchain technology with SM introduces limitations to manufacturing systems. Upon examining different blockchain networks, it can be inferred that none of the networks can scale efficiently, all networks are vulnerable to various security threats, and there is a risk of centralization [26,27,28]. The combination of these observations and research findings on the present condition of blockchain networks has culminated in a unified concept known as the Blockchain Trilemma (or the Scalability Trilemma) by different researchers [29,30]. According to one definition of the Trilemma, optimizing a blockchain-based system involves a trade-off between three key properties: scalability, decentralization, and security [17]. As the popularity and utilization of blockchain networks increase, limitations have been identified with respect to the ability of such networks to scale alongside their number of users [31]. Among the most significant performance metrics of existing blockchain systems, transaction throughput and transaction confirmation latency have yet to reach an acceptable level for users in terms of experience [32]. This often results in users having to wait for several blocks to be mined before their transaction is verified [18]. Furthermore, an overcrowded network may lead to higher transaction costs, as transaction validators typically select transactions with higher fees to increase their rewards. The desire for prompt transaction confirmation creates competition between users, and a surge in transactions within the network can cause the average transaction fee to rise substantially.
In smart manufacturing systems, a vast number of devices and users that interact with each other frequently generate a significant volume of transactions. This results in a potential demand for high throughput from the blockchain network [33]. An analysis conducted on the global furniture-manufacturing giant IKEA specified the throughput requirements necessary to ensure traceability within the system [34]. Even with significant performance improvements to existing blockchain networks, a full-scale traceability system for a company such as IKEA would require event processing to be partitioned into multiple subsystems. Moreover, shorter transaction-processing times may create operational issues in industrial applications, as business decisions might be postponed or outdated information might be used [35]. All elements of blockchain-based manufacturing systems must be scalable in order to meet the performance requirements of manufacturing systems [36]. Scalability solutions are emerging to enhance the integration of blockchain technology in systems such as manufacturing [37,38].
Even though there exist many review surveys that have identified the problem of scalability as a crucial barrier to the adoption of blockchain technology in manufacturing systems [6,39,40,41,42], there is a lack of research investigating the impact of blockchain technology and scalability limitations on the operation of blockchain-based manufacturing systems [43]. Table 2 presents existing studies on blockchain-based shared manufacturing, highlighting explored research problems and findings related to the effects of blockchain technology on the operation of BBSM systems.
Yu et al. [3] were the first to propose the concept of a BBSM system, and additionally proposed a new approach to writing manufacturing services transactions in the blocks of the blockchain. They observed the impact of their proposed approach on service throughput, and found that efficiency increased when reducing the number of transactions for a single production service. Li et al. [44] proposed a blockchain-based collaboration platform for heterogeneous manufacturing resource management in a socialized environment. In a demonstrative case study, the performance of the system (i.e., its transaction throughput) was observed for different node configurations. The main finding of this test was that it is better to add new blockchain nodes to the network instead of expanding manufacturing participants for the same size of the network. This means that optimization of blockchain network operation is required in order to increase the number of transactions for manufacturing services in the system.
Rožman et al. [2] suggested the use of scalability solutions to improve the performance of BBSM systems. In their analysis, they observed the impact of employing sidechain technology in comparison to employing only the main blockchain network. Their key finding was that the use of scalability solutions lowers the cost for users and reduces the time required for manufacturing services thanks to a shorter transaction confirmation time. Zhang et al. [45] analyzed the strategies of users of the BBSM system with the help of evolutionary game theory; under different assumptions, they found that several different stable states of the system are possible, with instability occurring when manufacturers do not participate in the confirmation of transactions. The BBSM system is in a global state where all users of the BBSM system participate in transaction confirmation. While many papers have described the problem of integrating blockchain technology into manufacturing systems due to scalability limitations, these have not analysed the impact of these constraints on system performance [41,42]. Implementations of scalability solutions are emerging to improve the integration of blockchain technology in systems such as manufacturing [37,38]. Thus far, two studies have addressed scalability limitations in the context of blockchain-based shared manufacturing [2,3]. Both studies recognize the scalability limitations of blockchain technology and propose solutions that reduce the consumption of computational resources in the context of implementing the BBSM concept.
Even though all the studies presented above considered the impact of blockchain technology on the performance characteristics of the system and the behavior of system users, none of the analyses used any of the metrics that describe the performance of the manufacturing system, instead mostly using metrics that define the performance of the blockchain network (i.e., transaction throughput and transaction costs). In addition, none of the aforementioned studies deal with the situation when the blockchain network becomes congested, which is a common occurrence in existing networks, or when the operation of the network changes. In the extant analyses, the decisions of the real users of the system (people) are not fully taken into account; instead, simulation and theoretical approaches are mostly used. Based on the reviewed literature, the following research gap can be identified, leading to the posing of the following research questions:
  • What are the effects of the scalability limitations of blockchain technology on the performance of BBSM systems (i.e., the frequency of manufacturing services)?
  • How do the scalability limitations of the blockchain technology and resulting blockchain network congestion affect human behavior in BBSM systems?

3. Methodology

There are currently no existing BBSM systems, meaning that there is no data on the implementation of such systems available for analysis. There are multiple reasons for this, including:
  • The disruptiveness of the concept;
  • The low maturity of the technology;
  • The high risk of joining the system.
The primary reason is the disruptiveness of the BBSM concept compared to the traditional manufacturing systems employed in the real world. There do not yet exist any business models or known good practices to guide manufacturing companies within such a system. In order for a manufacturing company to join a BBSM system, it must have a high level of digitalization, which introduces high investment costs. Furthermore, there do not exist any standardized hardware and software tools that would enable the faster establishment of the infrastructure required for the participation of manufacturing companies. The necessary changes to existing manufacturing systems in terms of technological infrastructure and economic models present great risks, as the operation of the manufacturing system would be obstructed during the transition phase. Furthermore, in the initial phase of setting up the BBSM system, the participants do not have as much benefit as when the system is adopted by a larger group of manufacturers. Until the system reaches a critical mass of users, resource sharing cannot take full effect.
To convince users to join the system, there is a need for multiple smaller cases and analyses that show the concept to be feasible and work well. One of the primary reasons for the lack of acceptance and implementation of blockchain-based applications in industry is the scalability limitations of blockchain technology [46]. Conducting an exploratory analysis of the scalability limitations of blockchain technology on the operation of BBSM systems can yield further insights and guidelines for implementing such systems. However, due to the non-existence of any such systems, there are no real data available for analysis. Furthermore, there does not exist any other blockchain-based manufacturing system which could provide similar of data on the operation of such a system. Another difficulty in analyzing the BBSM concept is that while all existing analyses of the concept have used a simulation environment to model the system, each time it has been modeled differently, without any uniform standard model.
Experimental approach: In experimental economics, in cases where it is not possible to apply the experimental methodology directly to an existing system, experiments are commonly conducted in the form of virtual games [47,48,49]. Mapping the properties of a system into a virtual environment enables the simple creation of situations that would occur in reality. This approach can provide a basic understanding of the observed phenomena under diverse conditions. Experimental findings can function as a rigorous empirical pre-test of economic theory before conducting tests with field data [50]. This form of experimentation has been employed to investigate diverse issues in the manufacturing domain. For example, experiments related to decision-making have been conducted with human subjects, then further supported by experiments with multi-agent simulations [51,52]. Another study explored the emergence and behavior of a network in a distributed manufacturing environment where none of the components held information concerning the entire state of the system [53]. A similar approach to that above described is selected in the presented study.
In order to conduct our analysis, we employed the presented methodology (Figure 1). Implementation of a BBSM system in a virtual environment was carried out first. Human decisions are a part of BBSM systems, and affect how the system responds to the scalability limitations of the blockchain. In general, there are two ways to detect human behavior: experimental methods, in which the actual behavior of people in the system is analyzed, or by creating possible strategies based on experience or with the help of artificial intelligence. In this study, the former approach is selected. Based on acquired human behavioral information, a simulation model of a BBSM system and the detected strategies was created in order to analyze the BBSM system with different blockchain settings. The simulation model was employed to evaluate how varying frequencies of transaction confirmation and congestion in the blockchain network impact the manufacturing system within the BBSM framework. The presented methodology contains several items based on realistic scenarios, namely, human decisions, blockchain networks, transaction processing, the production function, and service markets. However, there are less realistic parts as well; for instance, the number of participants, number of different services, and physical limitations (e.g., physical location of manufacturers, supply chain disruptions, etc.) are either simplified or neglected entirely.

4. Implementation of the BBSM Concept in the Virtual Environment

Employing the presented approach, virtual implementation of the BBSM system was carried out in the form of an online game. The game tries to replicate the concept of BBSM within a simplified virtual world. To ensure that the players to behave in the game as they would behave in the real world, it includes an incentive scheme that establishes a reward system that ranks the players according to their performance in the game. The players are ranked using two criteria. The primary criterion is the development of their production system (production criterion), while the second criterion is the amount of virtual money they currently have (economic criterion). The implemented online game was used inn a preliminary experiment to determine human behavior within the system.

4.1. Design of the BBSM Virtual Environment

The BBSM concept in the virtual environment was mapped by implementing the five main properties of the BBSM system that distinguish it from any other blockchain-based system or manufacturing mode.
Service-oriented manufacturing: The BBSM system involves service-oriented manufacturing in which individual APUs offer their unused resources on the market to increase the utilization of their capacities [1]. In the developed game, these unused capacities are mapped in the form of services offered by APUs on the market (Figure 2). The APUs, which are represented by the players, can offer their service to other players with a certain frequency ( f s e r v i c e ). The offer is defined by the type of service offered by the provider, the price set for the service, and the time required to perform the service.
Services are exchanged in the form of a free market where prices are self-regulated by the sellers’ response to a customer’s demand [54]. The medium of exchange is virtual money that is equally distributed at the beginning of the game. All services that are bought by other players in the implemented system are executed automatically due to the simplification of the system. In the BBSM concept, virtualized manufacturing resources are connected with the social representation of the APUs on the market. In this analysis, an assumption is made that all manufacturing resources are already available in the virtual layer of the system due to the simplification of the system. In this virtual implementation of the system, physical activities are modeled only by production time.
Prosumers: The operational model of BBSM permits individuals and enterprises to act as both providers and consumers of services, becoming prosumers [1]. There are three types of services in the game (services A, B, and C), one of which is predetermined to each APU. The APUs can provide their service and consume other services on the market that are not of the same type as the one they are providing. Examples of types of services are provided to the players for each service type for better understanding of the game. The divided groups of players (three types) represent a group of companies that are specialized in the field of mechanical engineering, electrical engineering, and IT engineering. An assumption is made that all companies of the same type have the same knowledge of the field of service they are offering (e.g., all mechanical engineers are equally good or close to equally good at mechanical services). Therefore, manufacturers within each group do not require services from other companies to improve their manufacturing services. However, by purchasing other types of services, they can increase their manufacturing capabilities.
The presented analysis is focused on the effects of the scalability limitations of blockchain technology on the BBSM. Therefore, the observed phenomenon is congestion of the blockchain network (i.e., the network is not capable of processing new transactions with the same frequency as they are created). Congestion of the blockchain network in the BBSM system can occur if the frequency of the service exchange surpasses the frequency of transaction confirmation. One of the possible scenarios in which such a situation would occur in reality the case of increasing customer demand, which is an open issue addressed by global manufacturing systems. In the implemented system, growing customer demand was incurred through an incentive scheme in which the primary criteria for determining the winner was the development of the production system. To fulfill increasing customer demand, additional manufacturers in the system or more optimized utilization of existing capacities is required. Due to the limitations of the experiment (i.e., the limited number of participants and limited duration), a closed system was observed; therefore, adding new manufacturing resources to the system (i.e., emergence of new manufacturing companies) was not possible. Instead, we focused on optimization in terms of upgrading the available manufacturing resources.
Table 3 presents examples of how service exchange can upgrade the capabilities of the consuming companies in the case of 3D printing manufacturing. Companies specialized in mechanical engineering provide better equipment in terms of computer hardware (e.g., improved cooling and ergonomics results in faster program development) and hardware for manufacturing (e.g., lighter moving parts and more rigid structure result in faster manufacturing of PCB components). Companies specializing in electrical engineering provide upgrades in terms of electrical components that can enhance either manufacturing processes (e.g., better motion control that results in faster 3D printing) or computational hardware (e.g., improved electronic components that increase the speed of computing). Companies specializing in IT engineering provide upgrades in terms of software, which can either improve the manufacturing process (e.g., 3D printing tool path optimization that results in faster 3D printing), or engineering software (e.g., improved simulation software that results in faster PCB manufacturing).
Cooperation: The complex necessities of manufacturing make it challenging for enterprises to execute all production processes independently in order to offer a product service system. Therefore, a substantial number of enterprises collaborate closely to augment manufacturing capabilities [55]. By purchasing the other two types of services, the players in the game upgrade their APU, thereby reducing the time required to perform a service (i.e., increased frequency). The APUs are codependent on each other to upgrade themselves, meaning that there is a closed system in the game in which funds and services are exchanged only between players. Upgrading the APU follows a predefined production function that determines how the time to perform a service changes with the number of upgrades. The production function defines the highest possible limit on output that a company can obtain with a certain combination of production factors (inputs) at a given state of technical knowledge during the production period [56]. In the game, the production function defines how the capacity of service provision changes when the state of the production system changes. The production factor is only the state of manufacturing equipment or the capital invested in equipment; no other factors are observed. Thus, when there is enough capital invested in the production system, the ability to offer a service (i.e., the frequency of service) changes. In the case of the presented implementation, the service provider of the mechanical engineering type (e.g., 3D printing) upgrades its manufacturing system in accordance with the production function by purchasing the services of the other two types. For example, 3D printers could be enhanced by installing additional electrical components (e.g., cameras) by purchasing from an electrical service company, while another service provided by an IT company could provide and install surveillance software for better optimization of the 3D printing process.
Public access to information: In the BBSM system, information on service providers is available to all users. Consequently, each service provider can make decisions based on the known existing state of the system [2]. In the game, the user interface presents a list of all the providers in the system, and players can monitor all the current service offers on the market for all types of services. Because the blockchain has the property of immutability with respect to the transaction record, players in the game can view the entire history of transactions that have occurred to date. All this information influences the players’ decisions about which services they buy and how they set the prices of their services for the other players in the game.
Decentralized platform: In contrast to other traditional resource-sharing manufacturing modes, the operation mechanism of the BBSM is decentralized, which is enabled by blockchain technology [3]. Therefore, all the interactions between players (e.g., information exchange and transactions) are made without the intermediation of another entity in the game. Furthermore, all the changes in the state of the system are made in the form of transactions that are confirmed by the decentralized blockchain network.
Financial transactions are processed by the blockchain network in the game, which implements a Proof-of-Stake (PoS) consensus mechanism [57]. The implemented blockchain network is a simulation of a public permissionless blockchain network, which is the most widely used general blockchain network (e.g., Ethereum). The implemented blockchain network is simplified due to the complexity of the system. The decentralization and security of the network are the maximum possible; therefore, no security attacks on the network are possible, and confirmation of transactions cannot be stopped by any single entity. Furthermore, the option to vote on changes to the blockchain protocol between blockchain nodes is disabled. The blockchain network consists of blockchain nodes that are run by each manufacturer in the system without instilling any additional costs (e.g., due to computer hardware). Individual transactions are confirmed with constant frequency. The transaction that is the highest in the queue when confirmation is performed (e.g., that offers the highest transaction fee as a reward to the validator) is selected for confirmation. All the confirmed transactions are shown in a table that is available to all the players. The transaction confirmation is made automatically by an algorithm. The reward deriving from the confirmed transactions is divided according to the players’ stakes, as is usual in PoS blockchain networks.
The decision process for a player is shown in the flowchart (Figure 3). The players can decide whether to spend the money to buy the service or to stake it in the blockchain network. In addition, they must make a decision about setting the price of their service and which service they want to buy. Determining the fee for an individual transaction is in the hands of the players. Although an individual player can perform only one service at a time, they can purchase several services at the same time. A player cannot purchase services that are of the same type as the service they offer themselves. A request to purchase a service is made by a player by placing the transaction in the queue.
The generated transaction is queued for confirmation according to the specified transaction fee. The service is purchased when the transaction is processed by the blockchain network. The service starts automatically when the transaction is confirmed, and cannot be canceled. Multiple players can compete for the same service; the player whose transaction is confirmed first is the one who buys the service. When this occurs, the transactions of all the other players with transactions in the queue are deleted and refunded. The same happens if the service provider withdraws the service from the market before any related transaction has been confirmed. Increasing or decreasing of the stake is carried out in the form of transactions, and both cases are treated in the same way as transactions for the purchase of services. Distribution of the transaction fee among the players for each individual confirmed transaction is performed by the application itself.
The dynamics of the game are determined by three parameters, namely, the number of players (N), the frequency of transaction confirmation on the blockchain network ( f B C ), and the initial time required to provide the service ( t i n i t a l ). The total initial production frequency ( f i n i t i a l ) is defined by Equation (1), and is lower than the frequency of transaction confirmation ( f B C ).
f i n i t i a l = N t i n i t a l
The production function, which defines how the time for the service ( t s e r v i c e ) changes with an APU upgrade, is defined by Equation (2). The time for the service after the upgrade is defined by the current time for the service. The parameter d defines by what proportion the time for the service will decrease with each upgrade and n u represents the number of upgrades of the APU. The time limit ( t l i m i t ) represents the limit of the production function.
t s e r v i c e ( n u + 1 ) = d ( t s e r v i c e ( n u ) t l i m i t ) + t l i m i t

4.2. Preliminary Experiment Results

The experiment comprised 27 participants, all of whom were Master’s degree students in mechanical engineering and were introduced to smart modes of manufacturing systems such as the SM concept. It should be noted that for such a complex game it is not trivial to make an intuitive and simple user interface that enables players to use the virtual world to its full extent. The developed user interface was functional for a group of up to 30 players. The web application was implemented using the MERN stack (MongoDB, ExpressJS, ReactJS, and NodeJS). The developed code of the online game is publicly available on the GitHub platform [58]. The game lasted for 90 minutes; the players were situated in different remote locations, and were permitted to communicate with each other. The game parameters defining the game dynamics were set as follows: f B C = 10 s, d = 0.87 , t i n i t a l = 300 s, and t l i m i t = 20 s. The parameter values were selected to achieve congestion of the blockchain network in a reasonable game time. Due to the time limits of the experiment, the timeline was scaled down to ensure that events that would otherwise have happened over a longer period of time of days or weeks were captured during a shorter period in the experiment. The observed events, such as congestion of the blockchain network, are usually longer processes; therefore, the results acquired by this experiment are not affected by this kind of time scaling.
Figure 4 shows the value of the transaction fee for confirmed transactions over the game time. The figure indicates that the value stabilizes after the first one-third of the play time. After half the play time ( t 1 ), however, the transaction fee starts to rise sharply. An increase in transaction fees in a blockchain network indicates higher network occupancy, with users competing with each other to have their transactions be confirmed by increasing the transaction fee is collected by the block validator [59]. Towards the end of the game, it becomes clear that this increase has stopped. This may have happened because the players knew the approximate time of the game and were expecting it to end. For this reason, this last part of the experiment was not used in the subsequent analyses.
Figure 5 shows the moving average (window size = 20 samples) of the price for a service provided for each type of service. The price of a service increases in the first half of the game, then (after t 1 ) the trend reverses and the price starts to fall below the values that were set at the beginning of the game. At time t 2 , the price for a service is equal to the transaction fee; after that time, the price for a service is lower than the cost of transaction confirmation by the blockchain network. The price of supply in free-market systems is affected by the supply–demand ratio [60]; in this case, it can be concluded that in the middle of the game the supply began to increase sharply. In connection with the dynamics of the transaction fee, this confirms that there was congestion in the blockchain network and that the frequency of service provision outpaced the frequency of transaction confirmation.
Figure 6 confirms the previous finding, showing that the number of services offered on the market first decreased; then, after the frequency of service provision outpaced the frequency of transactions, the validation began to increase. In addition, Figure 6 shows that the supply on the market fluctuated in waves during the first half of the game. This is because the players started the game on equal terms and at the same time. The same start time for all services resulted in near-synchronized provision of services. During the second half of the game, this fluctuation is not as obvious.
The main result of the experiment is shown in Figure 7, shows how the frequency of transaction validations on the blockchain network affects the frequency of service provision. The blue line represents the maximum capacity of the production units in the game, while the green line shows the actual frequency of the executed services. The blockchain network represents a bottleneck in the production system (the orange line). At the beginning of the game, when the production units are slower than the blockchain network, the frequency of the provided services does not reach the maximum, because the players are becoming acquainted with the user interface and the game. In addition, several players focused their activities on determining their stake in the blockchain network at the same time. The change in the frequency of provided services in the first half of the game follows an increase in the maximum frequency of production, and the slopes are approximately the same. After the blockchain network becomes congested, the frequency of service provision is limited by the frequency of transaction confirmation, and does not increase further. Moreover, it even drops a little (at around 4000 s); thus, it can be assumed that at this time players were running out of money and pulled their stake from the blockchain network to gain additional funds. This in turn resulted in the unstaking transactions overtaking the service transactions, further slowing production. At the end of the game, the players’ APUs utilized only 40% of their maximum capacity.

5. Simulation Model with Human Behavior

The presented results are based on only one instance of the experiment. Therefore, the conclusions and findings should be treated at most as indicative, and must be confirmed with further multiple independent experiments with different setting parameters. However, due to the very nature of the experiment, it is very difficult to repeat it multiple times. To execute the experiment properly, it is necessary to incentivize the players to behave as if they would in reality. The problem is that there are only a limited number of participants and limited rewards. It is difficult to experiment with different setting parameters, such as a longer game time, as players are unable to maintain concentration for more than a certain period. Furthermore, there is a problem if the number of participating players is increased, as it is difficult to implement a simple and intuitive user interface where a complete overview of the game is available for the players.
For the reasons described, it is difficult to repeat the experiment several times with different setting parameters as desired in the research methodology. To be able to repeat the experiment multiple times with different settings, a simulation model of the experiment was designed and implemented to imitate the behavior of the players in the game. While a simulation is not the same as an experiment, based on such simulations it is possible to observe different events and player behavior (hypothesis formation), which can then be verified by future experiments.

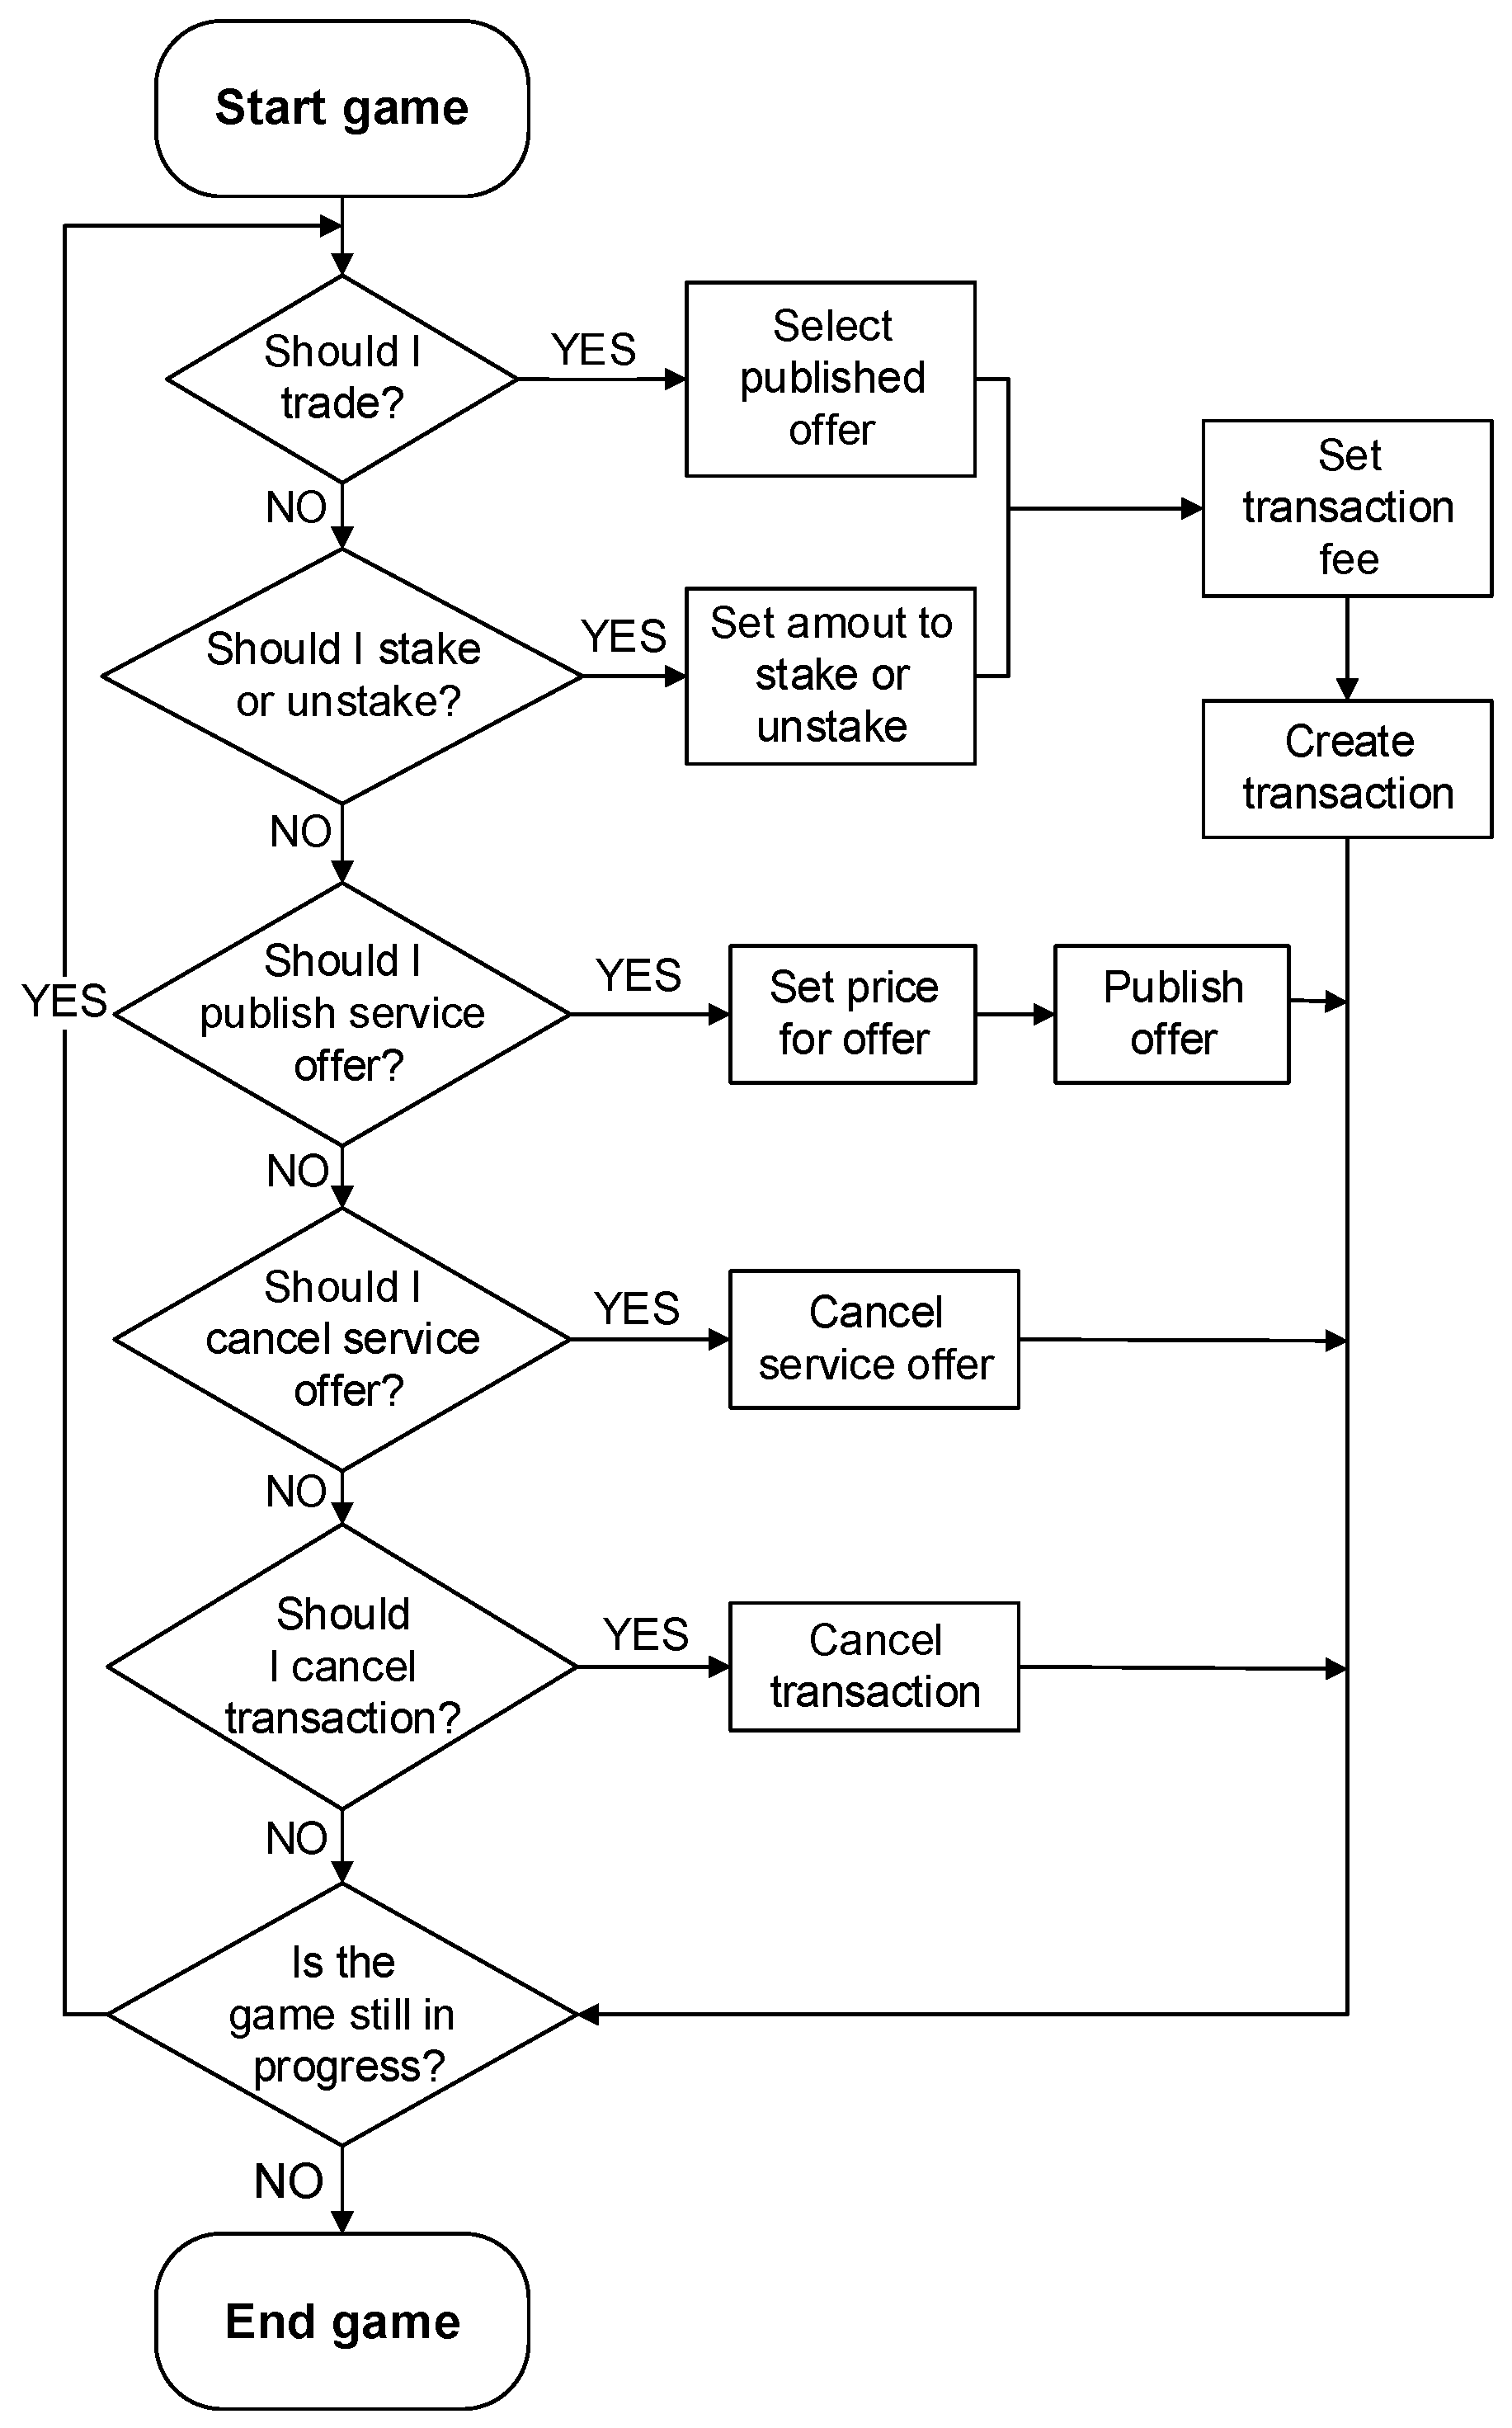
5.1. Strategy Analysis

An approach in which the results from the experiment were used as a reference was selected, in contrast to an approach in which agents are modeled without prior understanding of people’s behavior [61]. A simulation model of the agent was built based on major decisions, which were mostly made by the players in the experiment. Therefore, to be able to model the agent, the strategies of the players in the experiment were analyzed first, observing four key decision processes in the game:
  • Deciding on the price of the offered service;
  • Deciding on which service to purchase regarding the price;
  • Deciding on the amount of the transaction fee for the transaction;
  • Deciding on the amount of funds allocated to the stake.
Four different statistical parameters that describe the decision-making of players in the above-mentioned decision processes were determined. For each player’s decision, a parameter was calculated and the distribution of parameter values was plotted (Figure 8 and Figure 9). Due to different decision frequencies for different parameters, all the decision frequencies were normalized.
The coefficient of buying ( k b ) tells us whether a player purchased a service ( s e l e c t e d P r i c e ) at a higher or a lower price than the current average price ( p r i c e ¯ ) for that type of service on the market (Equation (3)). In the user interface, the services offered were displayed with a histogram, in which the services were ranked from the lowest price to the highest to provide players with a sense of the average price. On average, players bought services during the game that were cheaper than the average price ( k b ¯ = 0.88 ). The distribution of the parameter is shown in Figure 8a, with the distribution appearing to be normal; thus, it can be concluded that no other strategies emerged for this process.
k b = s e l e c t e d P r i c e p r i c e ¯
The coefficient of setting the price ( k p ) defines whether the set price ( s e t P r i c e ) is higher or lower than the current average price ( p r i c e ¯ ) of services of the same type (Equation (4)). Players in the experiment set the price ( k p ¯ = 0.91 ) lower than the current average price (Figure 8b). In the experiment, there was a situation in which players did not have references from other providers of the same type of service. Therefore, k p was calculated in the case for which there was no offer of the same type of services ( k p e m p t y ). The average price was calculated from the current average service price for the other two services. While the distribution of the coefficient value (Figure 8c) is similar to the normal distribution in this case, it has greater variance than in the case of the service purchasing coefficient. Players in the experiment set the price ( k p e m p t y ¯ = 1.08 ) higher than the current average price. Based on these results, the players had only one predominant strategy for setting the service price.
k p = s e t P r i c e p r i c e ¯
The coefficient of setting the transaction fee ( k f ) characterizes whether the set transaction fee ( s e t T x F e e ) for the new transaction is higher or lower than the transaction fee ( t o p P e n d i n g T x F e e ) of the pending transaction with the highest transaction fee in the list of pending transactions (Equation (5)). On average, players set the transaction fee 5% lower than the currently highest queue fee ( k f ¯ = 0.95 ). The distribution of the value of the parameter k f in the experiment (Figure 8d) is again similar to the normal distribution; however, the distribution has long tails. These tails could be caused by transactions being set with a very high transaction fee, by which players tried to ensure that their transaction would be confirmed as soon as possible. When a player sets a large fee for a transaction, the value of the coefficient is large, and each subsequent transaction, which sets the price according to the values of the fees before the transaction with a large fee, is characterized by a small value. Even in this case, there do not seem to be several different strategies for the players, only a few cases of exceptional events.
k f = s e t T x F e e t o p P e n d i n g T x F e e
The stake coefficient ( k s ) defines what share a player has regarding the total stake in the network when the selected transaction is confirmed (Equation (6)). Because this coefficient represents the player’s stake, the average value of the coefficient from all the players is always equal to the initial value ( 3.7 % ). The distribution of the parameter k s (Figure 9) is not normal, as is the case with the above-mentioned parameters; rather, it is divided into three parts, indicating three different strategies. The first part, to the far left of the distribution, represents the strategy of players who wanted to withdraw their stake from the network. The second part of the distribution is similar to the normal distribution around the initial value of the stake for an individual player ( 3.7 % ), and represents the strategy of players who did not want to change their stake or to change it very little. The third part of the distribution, to the right, represents the strategy of players who wanted to significantly increase their stake in the blockchain network. Players employing this strategy placed highly in the ranking at the end of the game, and the player with the most aggressive staking strategy was the winner of the game, with the highest number of upgrades and the most owned funds. A similar winning strategy was discovered in one of the stable states of the BBSM system using an evolutionary game theory approach [45].
k s = s t a k e c u r r e n t + s t a k e t r a n s a c t i o n t o t a l S t a k e
Based on the results of this analysis of the players’ staking strategies, the players can be classified into three groups. These three groups relate to the player’s staking strategies in the blockchain network, while the other three parameters define the general behavior of all the players in the game.

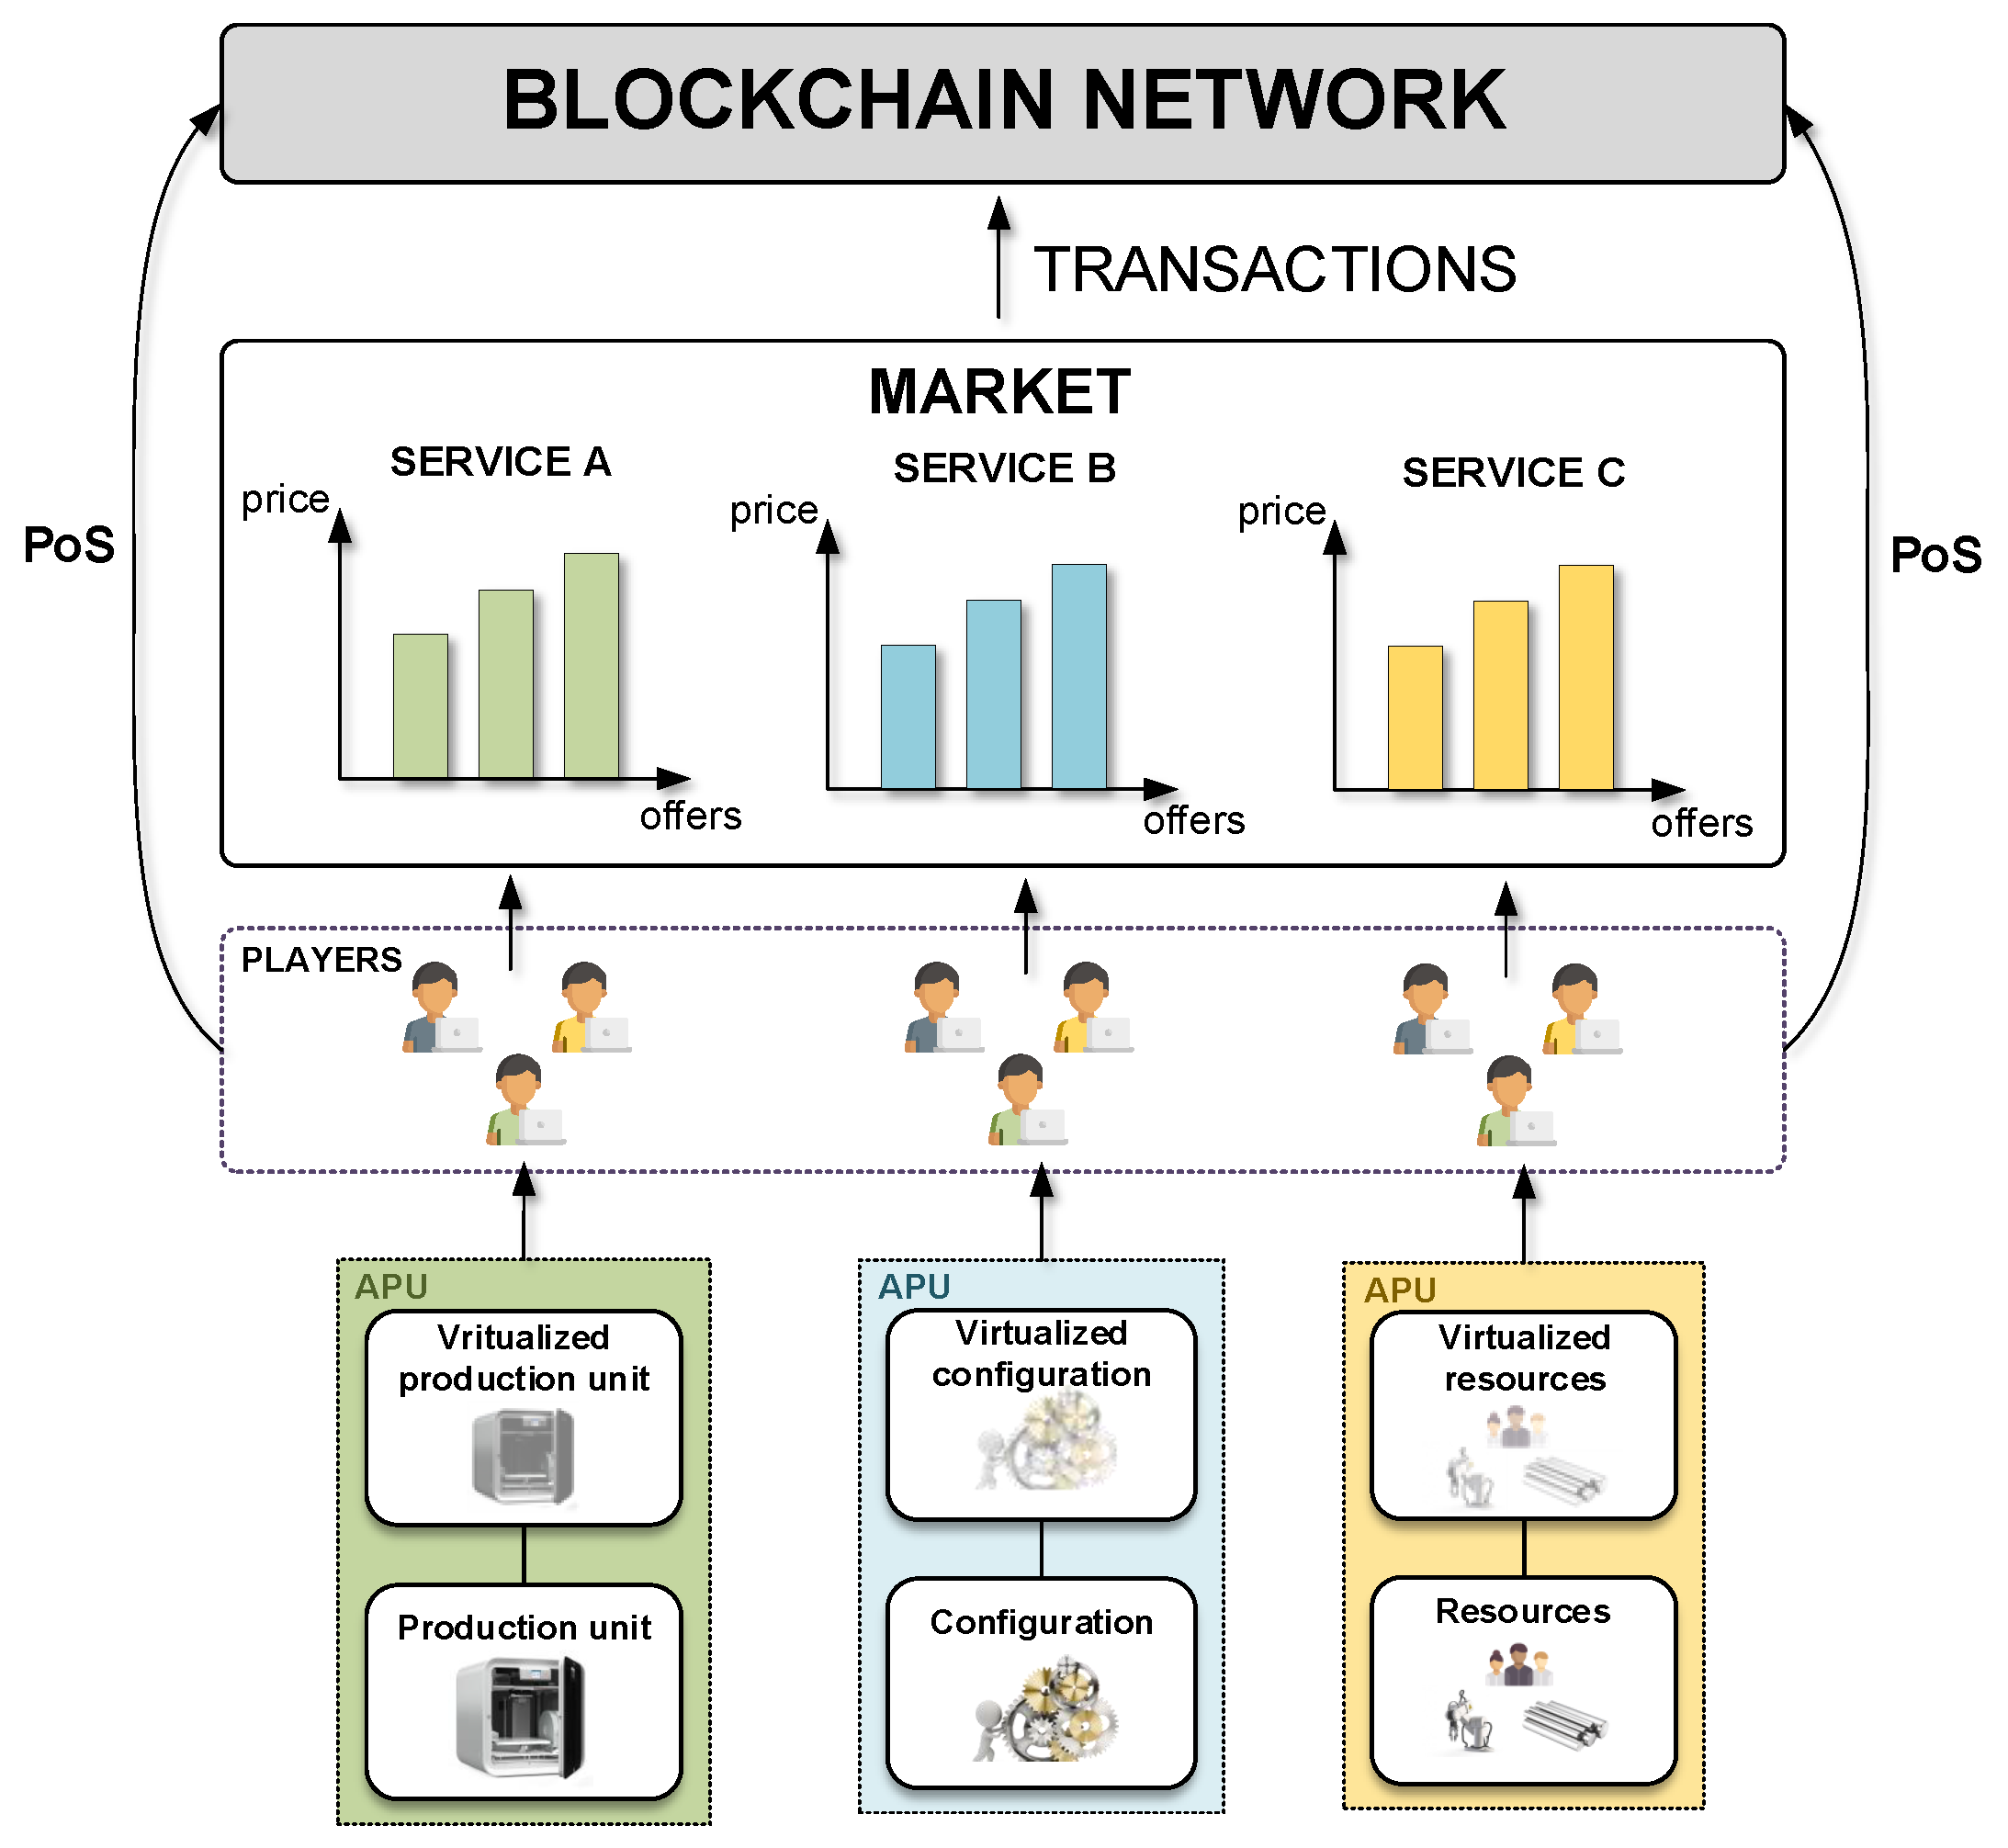
5.2. Simulation Model

To create a simulation model that mimics the performed experiment, the properties of the system (blockchain network, upgrade of manufacturing system, etc.) and the behavior of individual players represented by agents were mapped in the simulation environment. The system properties were mapped by implementing three mechanisms:
  • The market mechanism for offering APU services;
  • The mechanism for upgrading APUs;
  • The mechanism for validating transactions via the blockchain network based on a PoS consensus mechanism.
All the above mappings follow the system described in Section 4.1. The agent model follows the previously described decision-making process (Figure 3), taking into account the parameters obtained through the strategy analysis for individual processes.
The decision-making actions of an individual agent were divided into two groups, namely, the transaction decision process and the service decision process. Both groups of processes are executed with different frequencies, with f T being the frequency of the transaction decision process and f S the frequency of the services decision process, as such a division makes it easier to simulate a similar number of decision-making processes performed by players during the experiment. In the case of transactions, the agent decides whether to purchase a service, to stake its assets, to unstake its staked assets, or to delete a transaction. In the case of services, the decision is only between offering a service on the market and deleting an offer from the market.

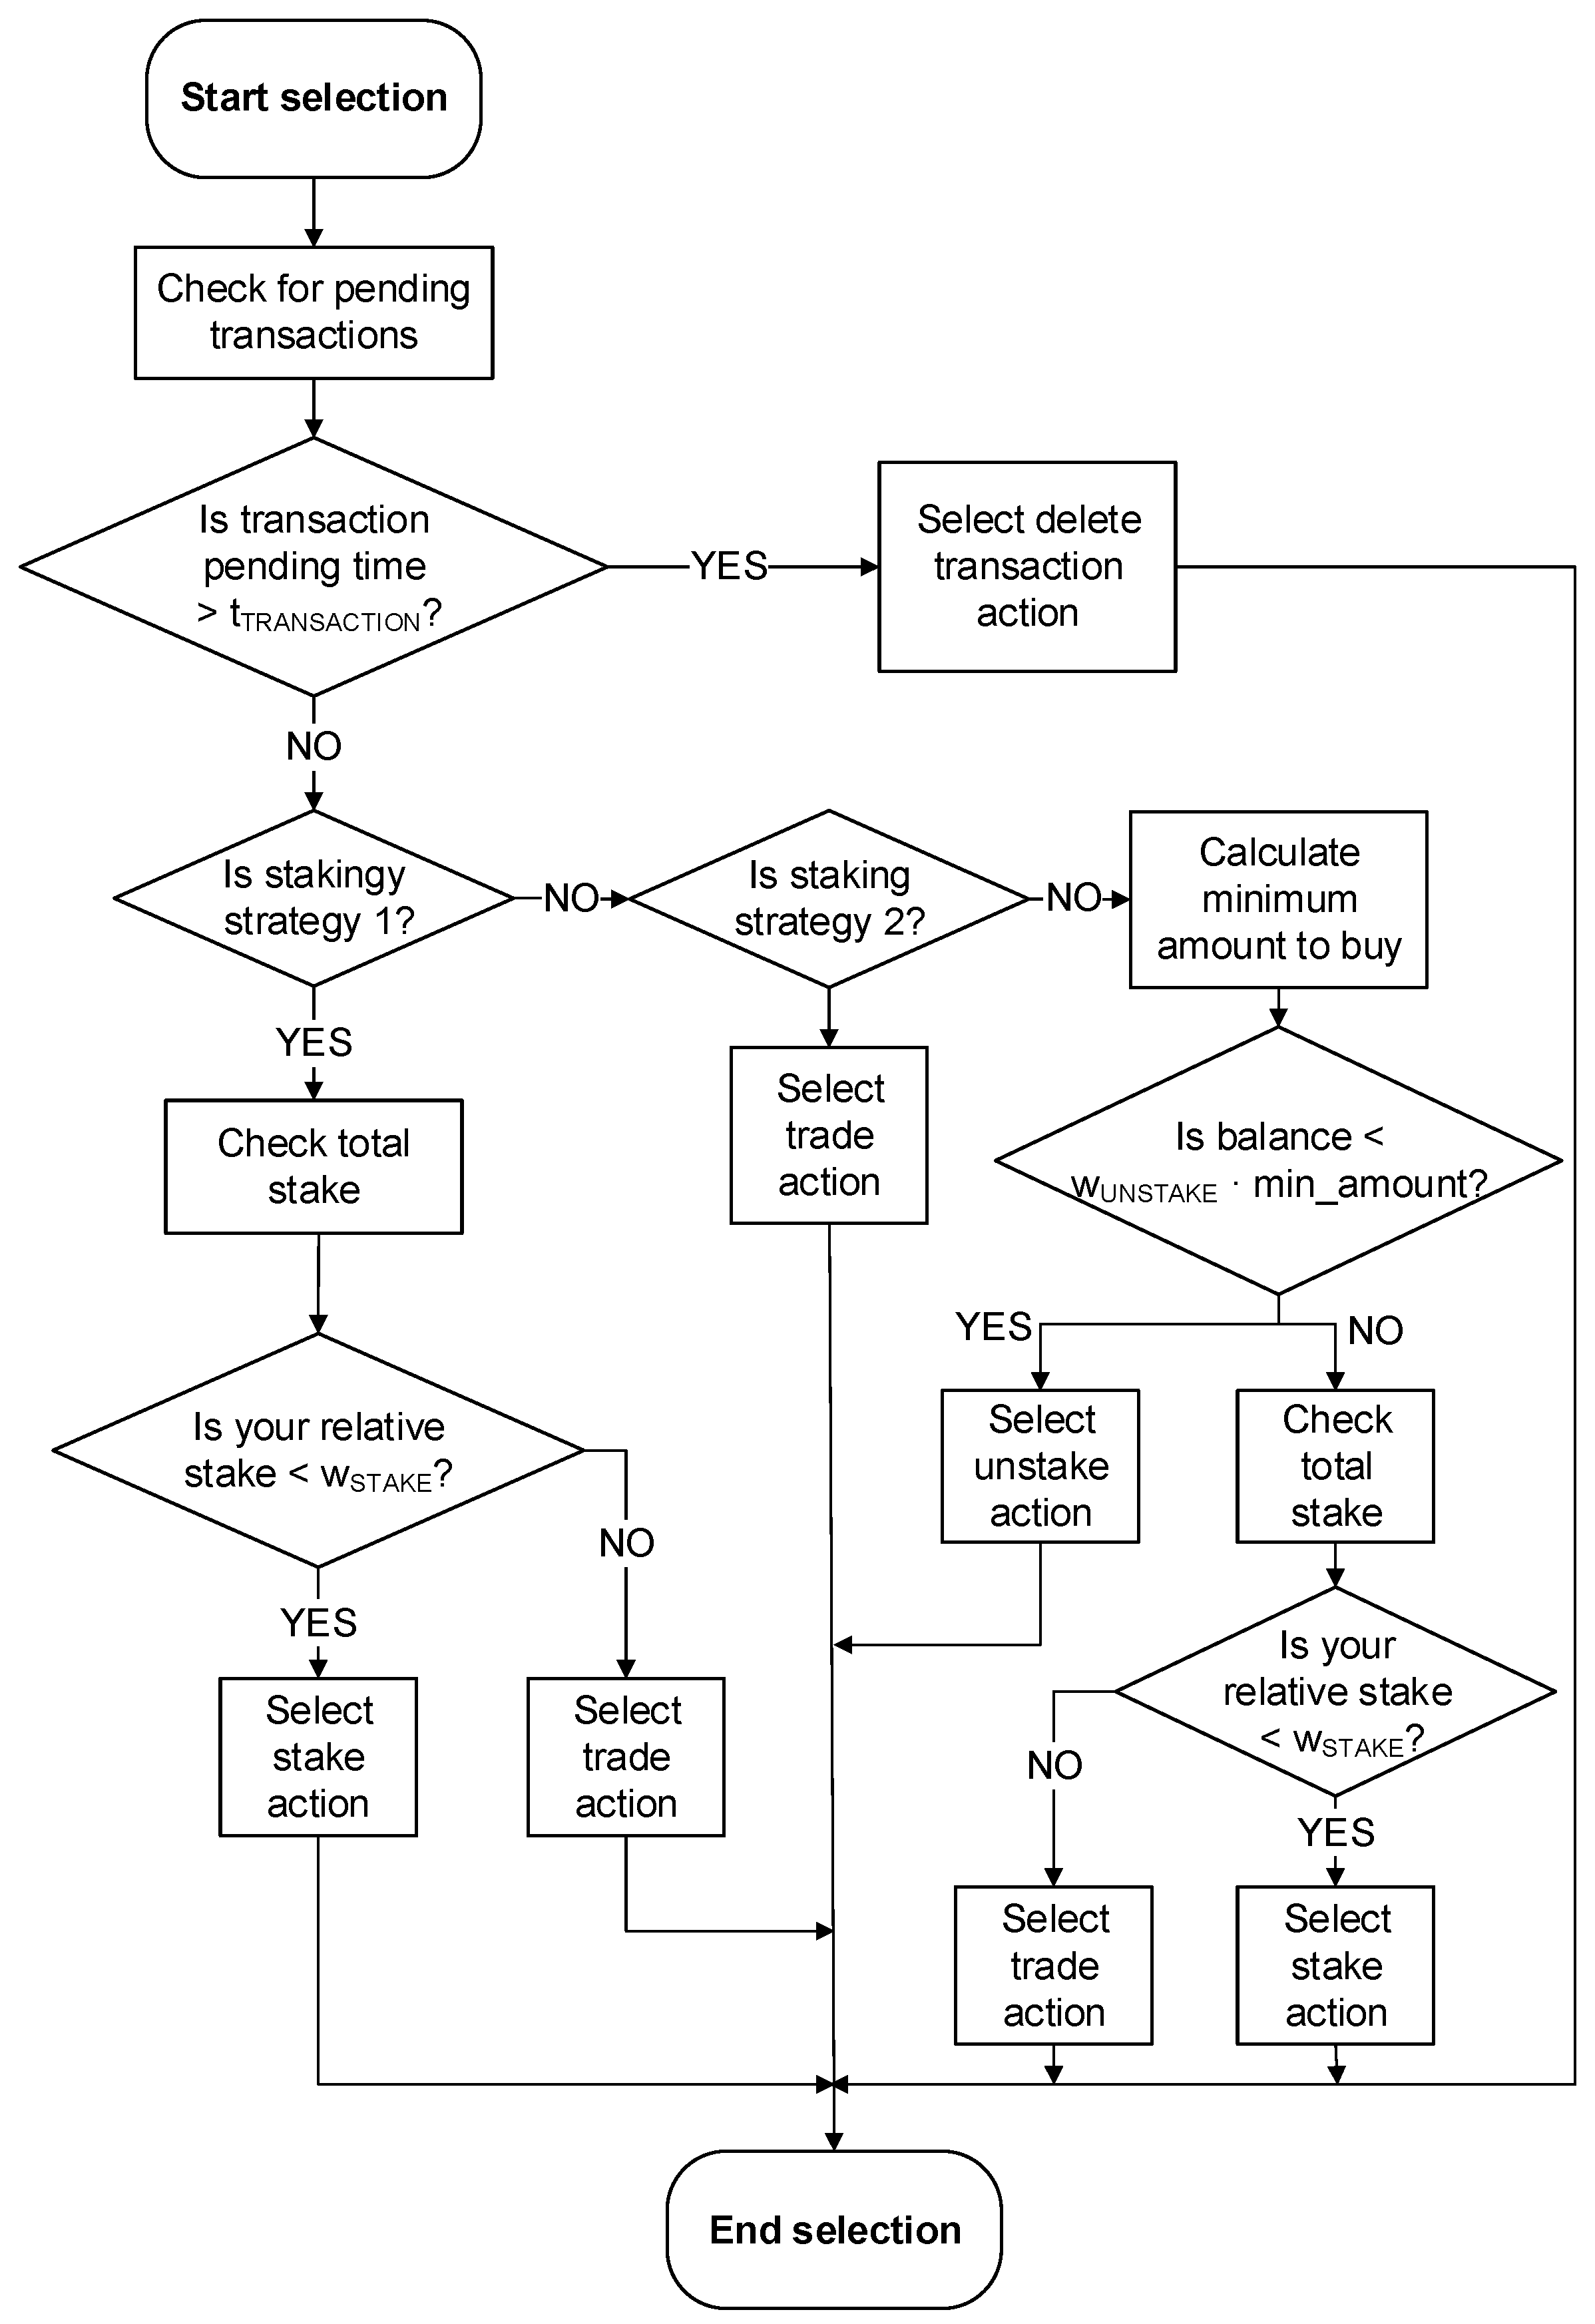
5.2.1. Transaction Decision Process

The transaction action decision-making process is shown in Figure 10. First, the agent finds out whether there are any transactions in the confirmation queue. Then, for each transaction, it determines whether the queue is longer than the criterion for pending transactions t t r a n s a c t i o n P e n d i n g . If the transaction is in the queue longer than the criteria, the agent decides to delete the transaction from the queue. Immediately afterwards, the agent performs the transaction action decision-making process again to replace the deleted transaction. If there is no pending transaction that exceeds the criteria, the agent checks the staking strategy that was assigned to it at the beginning of the game.
The staking strategy refers to the three strategies defined in the previous section. In the case of the strategy in which the agent wants to significantly increase their stake in the blockchain network, the agent first checks the total amount of funds staked in the network, then calculates its relative stake and compares it to the staking weight w s t a k e . If its current relative stake is lower than w s t a k e , the agent decides on a staking action; otherwise, it decides on a trading action. In the case of a staking strategy where the agent does not want to change its stake in the network (stake strategy 2), the agent always decides to carry out a trading action. Finally, an agent that has a staking strategy to unstake funds from the network first calculates the minimum amount of funds it needs to be able to purchase the service; this means that the current maximum transaction fee is added to the lowest price of the currently offered service. If its balance is lower than the minimum amount multiplied by the unstaking weight w u n s t a k e , it decides on the unstaking action. Otherwise, it compares the relative stake with the staking weight w s t a k e and makes the same decision as in the case of staking strategy 1.
All transaction actions are performed in two phases. First, the agent determines the values of the parameters for this type of transaction and determines the transaction fee value. The exception is a transaction delete action, where the agent only selects the transaction it wants to delete. The selection of a transaction for deletion is the same as in the transaction action decision-making process, where the agent checks which transaction(s) have been pending longer in the queue than the pending transactions criterion t t r a n s a c t i o n P e n d i n g and selects the first transaction that meets this condition.
In the case of a trade action, the agent first selects the service offer. It determines the type of service it wishes to purchase by selecting a type of service it has bought less often in the past. If it has bought the same amount of services of each type, it selects service offers from both types of services. If there is currently no offer for the selected type of service, it checks the offer for the other type. For the selected type of service (or for both), it collects all the service offers on the market and arranges them according to the price of the service, from highest to lowest. If there are offers that are candidates for selection, the agent selects the service according to the price; the lower the price, the greater the chance of its being selected. Due to this strategy, the agents buy services that are on average cheaper than the average market price, as shown in the strategy analysis in the case of k b ; however, there is a possibility that an agent may buy a more expensive service. In the strategy analysis, the k b distribution shows that players in the experiment sometimes bought services at a higher price than was the current average price of the service.
In a staking action, the agent must determine the amount of funds it wants to stake in the blockchain network. The agent selects a value between s t a k e m i n and s t a k e m a x , which is the coefficient by which the agent’s current balance is multiplied. A similar process is executed in the case of an unstaking action, where the agent selects a value between u n s t a k e m i n and u n s t a k e m a x , which in this case is multiplied by the amount of the agent’s stake in the blockchain network.
For all three of these actions, the agent must determine the transaction fee, which is determined according to the following procedure. The agent first acquires the list of all pending transactions for confirmation and ranks them according to the transaction fee, from highest to lowest. It then looks at whether the new transaction is the result of a normal transaction action decision process or is the result of a deletion due to the previous transaction waiting too long for confirmation. If the transaction action is triggered due to the deletion of the previous transaction, and if there is any transaction in the queue, the agent sets the transaction fee by multiplying the highest transaction fee in the queue by the coefficient k f e e D e l e t e d . If there is no transaction in the queue, the agent checks the fee of the last confirmed transaction and multiplies it by the coefficient k f e e D e l e t e d E m p t y . If the new transaction is not the result of a deletion by the agent, the agent checks whether its previous transaction was deleted by other users because they overtook it in the case of purchasing the same service. If the previous transaction was not deleted by other users and if there is any transaction in the queue, the agent sets the transaction fee by multiplying the highest transaction fee in the queue by the coefficient k f e e N e w . If there is no transaction in the queue, the agent checks the fee of the last confirmed transaction and multiplies it by the coefficient k f e e N e w E m p t y . However, if the previous transaction was deleted by other users and there is any transaction in the queue, the agent sets the transaction fee by multiplying the highest transaction fee in the queue by the coefficient k f e e N e w D e l e t e d . If there is no transaction in the queue, the agent checks the fee of the last confirmed transaction and multiplies it by the coefficient k f e e N e w D e l e t e d E m p t y . Due to the described strategy, transaction fees increase if the blockchain network becomes congested.

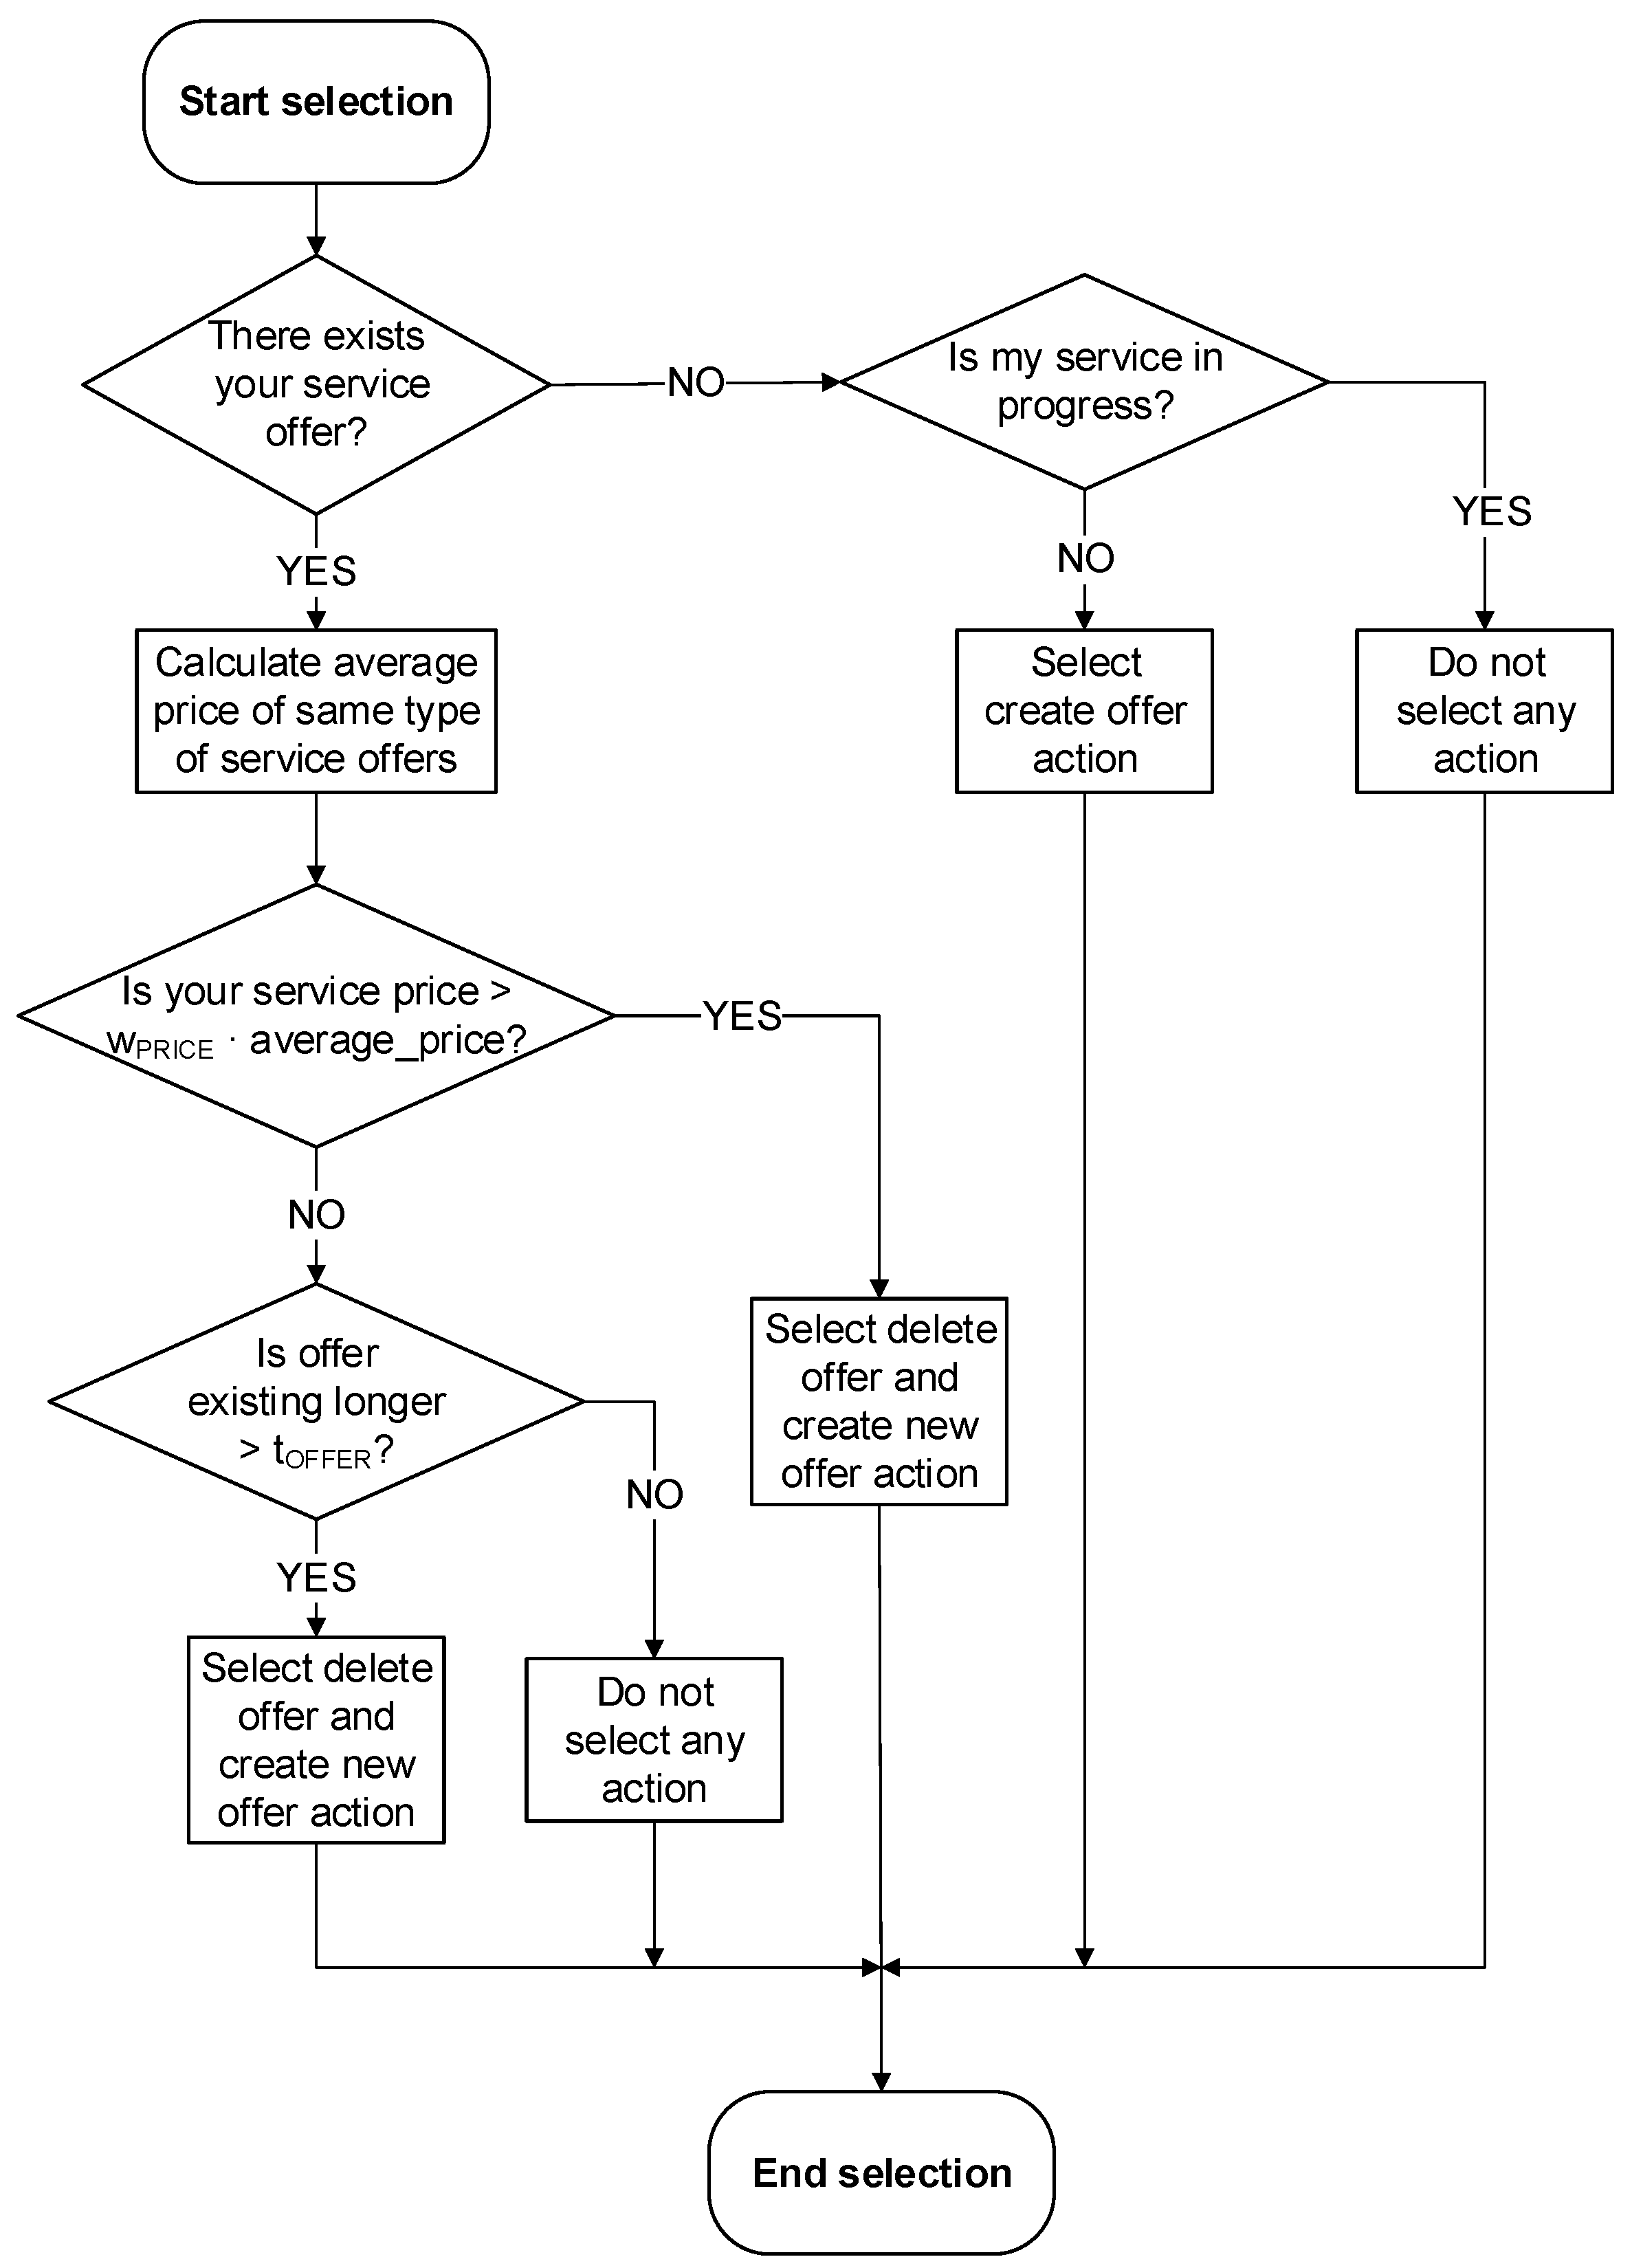
5.2.2. Service Decision Process

The process of deciding on a service action is shown in Figure 11. The agent first checks whether it already has an offer for its service on the market; if it does not and it is not in the process of providing the service, it decides to create an offer. If it already has a set offer, it first calculates the average price of the same type of service offers. It then checks whether the price of its offer is higher than the average price multiplied by the price weight w p r i c e . If it is higher, the agent decides to delete the offer and immediately moves to the next step in creating an offer. Otherwise, it checks whether the offer has lasted longer than the time for pending offers t o f f e r P e n d i n g and decides to either delete the offer and set a new offer, or to do nothing.
The action of creating a service offer is performed by an agent by first determining the price offered for the service and then publishing the service on the market. When setting the price, the agent first checks whether there is an offer for other services of the same type. If such an offer exists, it multiplies the average price of the existing service offer(s) by the coefficient k e x i s t O f f e r and saves the average service price. If no current offers of the same type exist, the agent checks the saved previous average service price and multiplies it by the coefficient k p r e v i o u s O f f e r . If the agent does not have the previous average price (e.g., at the beginning of the game), it multiplies its account balance by the coefficient k e m p t y O f f e r . The selection of an offer for deletion is the same as in the service action decision-making process; the agent checks whether its offer has lasted longer than the time of the pending offer t o f f e r P e n d i n g and deletes its offer if it meets this condition. Immediately after the offer is deleted, it repeats the described offer creation process.

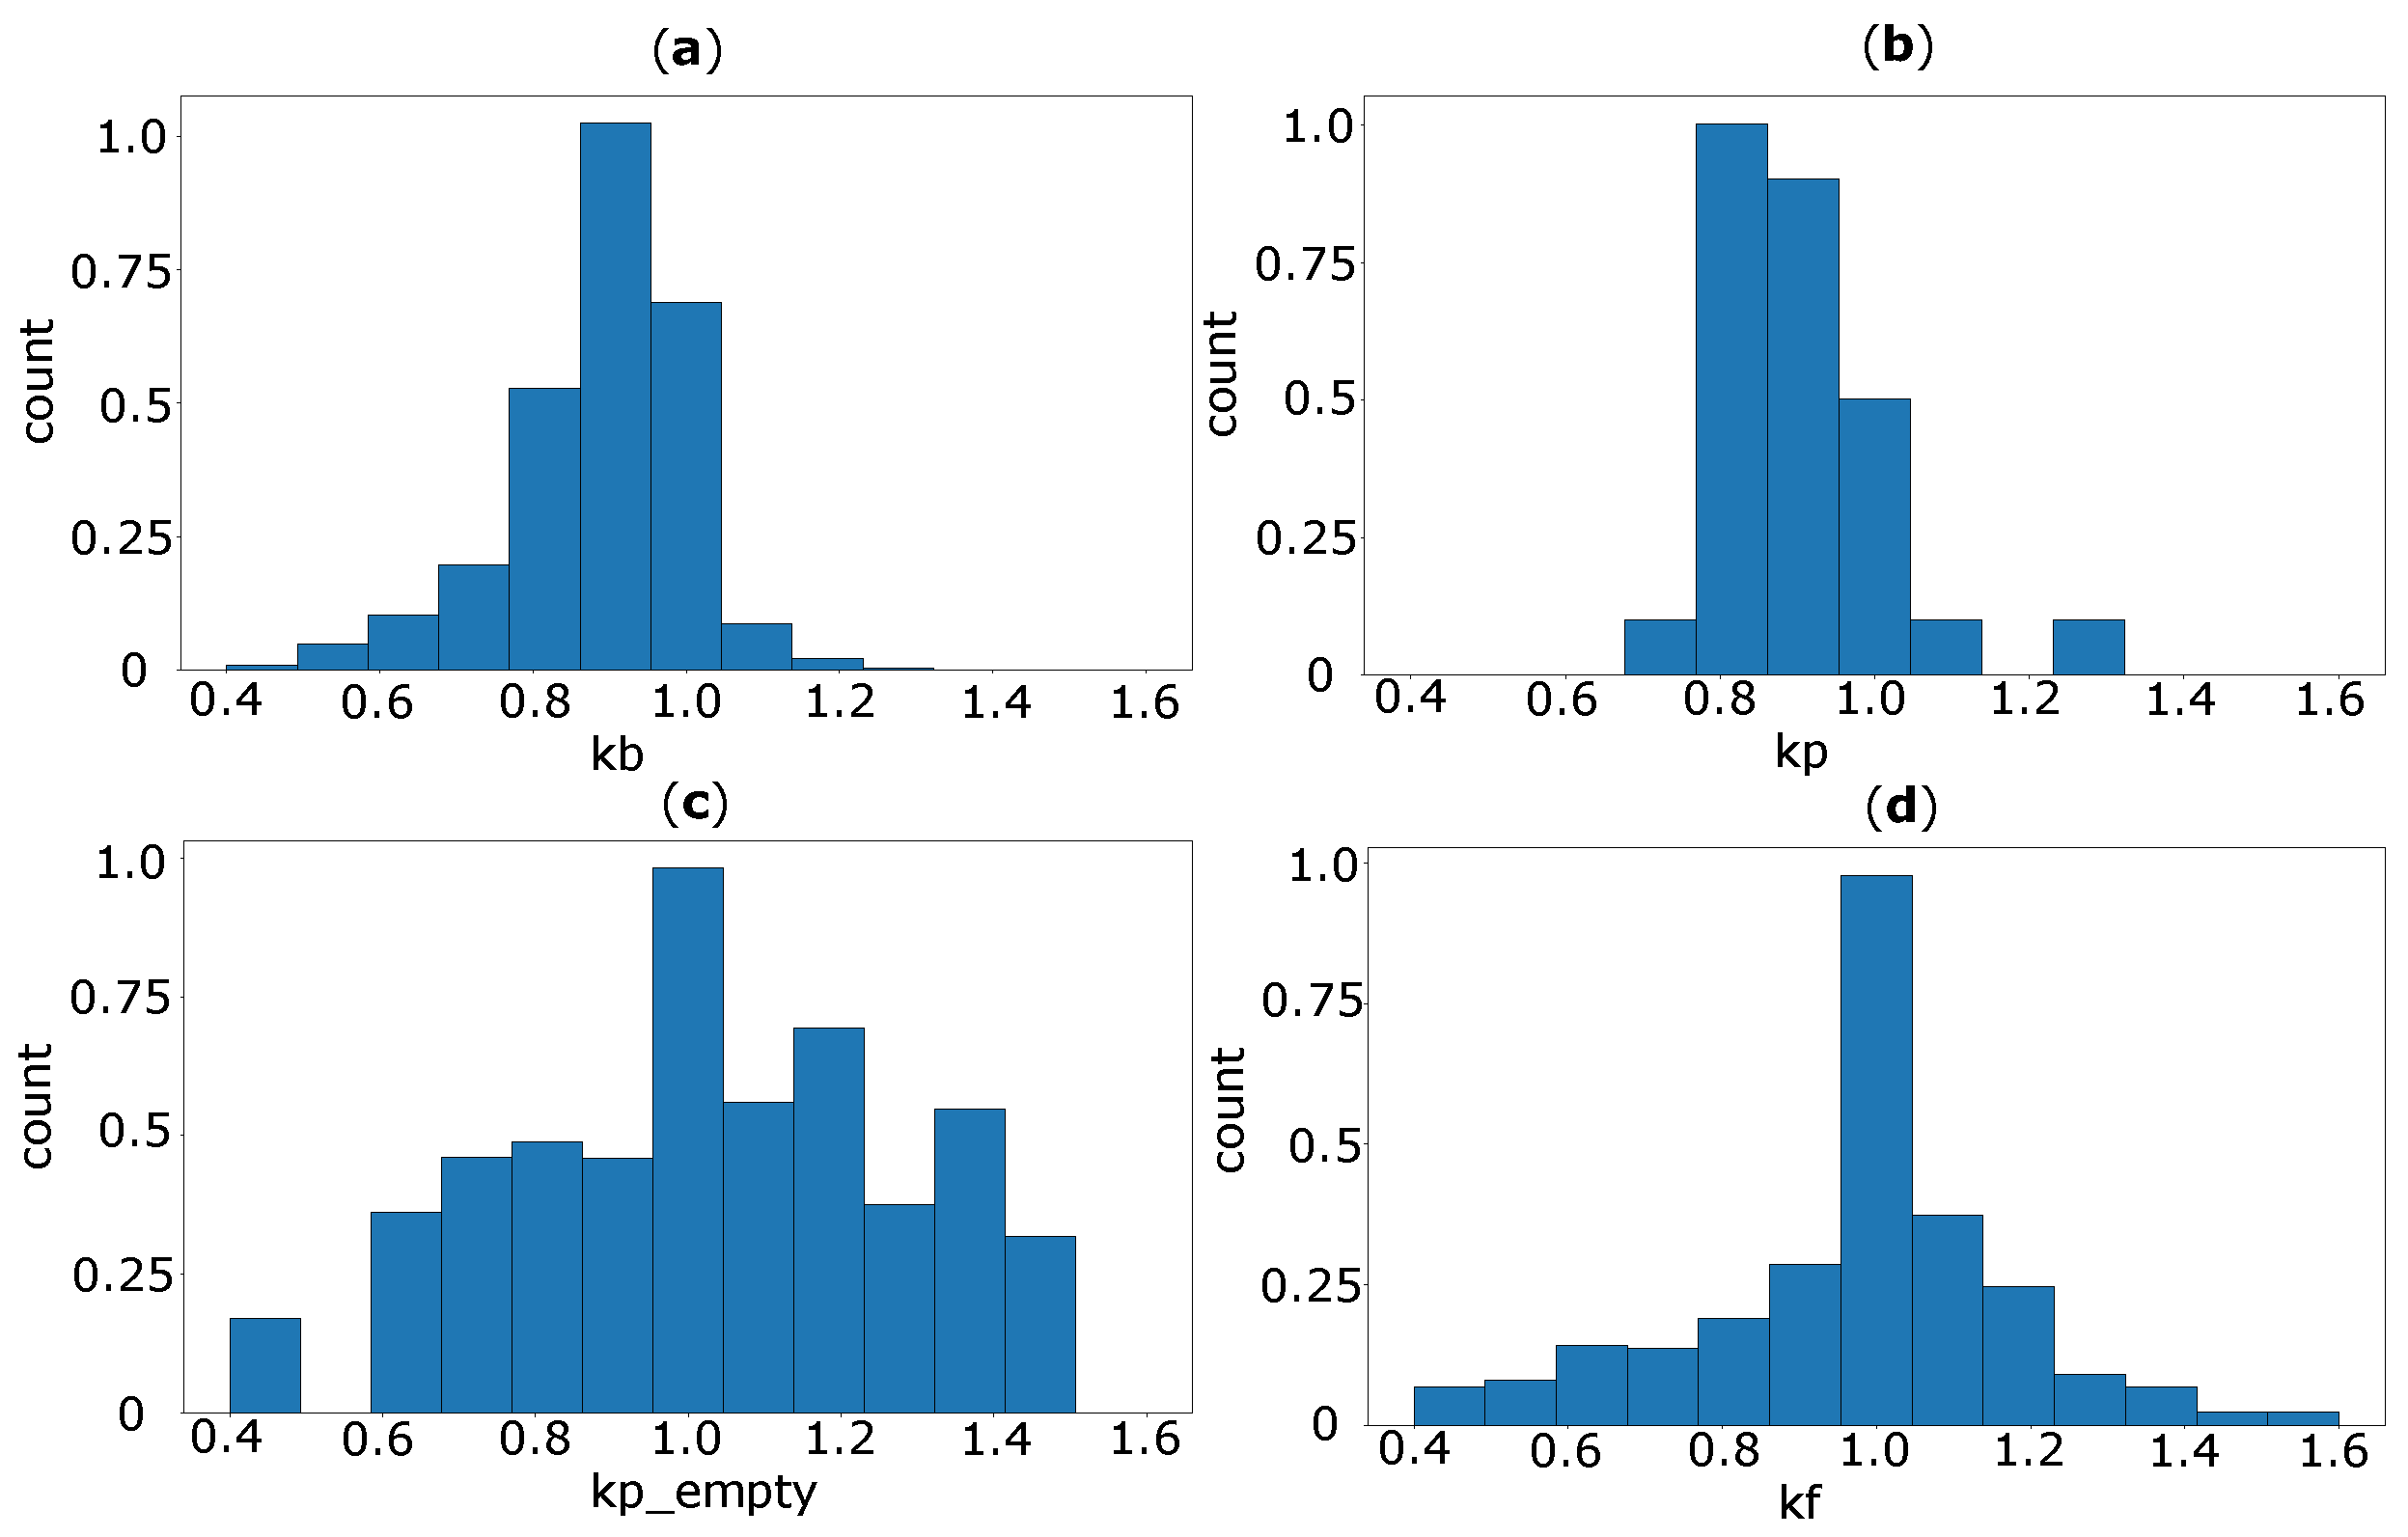
5.2.3. Human Behavior Decision Parameters

The results of the experiment and strategy analysis were used to determine the values of the parameters described above that define the behavior of the agents. The determined parameters are shown in Table 4. On average, players made transaction action decisions every 60.6 s and service action decisions every 34.8 s. The time for the transaction action t t r a n s a c t i o n A c t i o n and the time for the service action t s e r v i c e A c t i o n were defined in order for agents to have a similar frequency of decision-making with respect to transactions and services as the players in the experiment. To ensure asynchronous actions, agents select a value for each action between the set minimum and maximum values. In the transaction action process, a recognized strategy during the experiment was considered in which players waited until the last few seconds before the new transaction was confirmed to place their transaction on the pending list, thereby reducing the chance of their transaction being overtaken by other players. In the case of an agent, when the time for the transaction action elapses, it first checks how much time is left until the new transaction will be confirmed and waits to make a decision until the last 3 s before the confirmation.
Several of these parameters were set using trial and error, while others were defined using the findings obtained from the experimental results; k f e e N e w is equal to the value of the coefficient for setting the transaction fee k f ¯ , which was calculated in the strategy analysis. The same is true for k f e e N e w E m p t y , k f e e N e w D e l e t e d E m p t y and k f e e D e l e t e d E m p t y , which means that in the case of the transaction not being deleted or the list of pending transactions being empty, the agent sets a lower transaction fee from the previous or current highest price. This kind of behavior was seen in the experiment, especially in the first half of the game when the blockchain network had not yet become congested. In contrast, k f e e D e l e t e d and k f e e N e w D e l e t e d are set to a value greater than 1, which means that in the case of transactions being deleted because the transaction fee is set too low or because they have waited too long for confirmation, agents start to raise their transaction fees. This increases the transaction fee when the blockchain network is congested.
The values of the staking weight w s t a k e are divided into four groups. The first three values are for a group of agents that follow staking strategy 1. In the experiment, not all players within this group had the same tendency to stake in the blockchain network. The last value represents w s t a k e for the group of agents following staking strategy 2, who do not want to change their stake significantly. The value of the coefficient for setting the service price k p r e v i o u s O f f e r is close to the value for the coefficient of the setting price k p e m p t y ¯ obtained in the strategy analysis. The set value means that if the supply in the market is lower, the agent increases the price of its service (as happened in the first half of the experiment). For k e x i s t O f f e r , however, the value of the coefficient is higher than the value of k p ¯ , though it is lower than 1, as the agent wants to set a price that slightly lower than the market average if there are more offers on the market. Thus, the price of the service is lower if the supply is higher, or in the case of the experiment, when the blockchain network was unable to confirm transactions as fast as the provider could provide services. When determining the parameters of the agents, the values of the parameters do not have to be the same as those obtained from the experiment, as the analysis is based only on a single experiment.

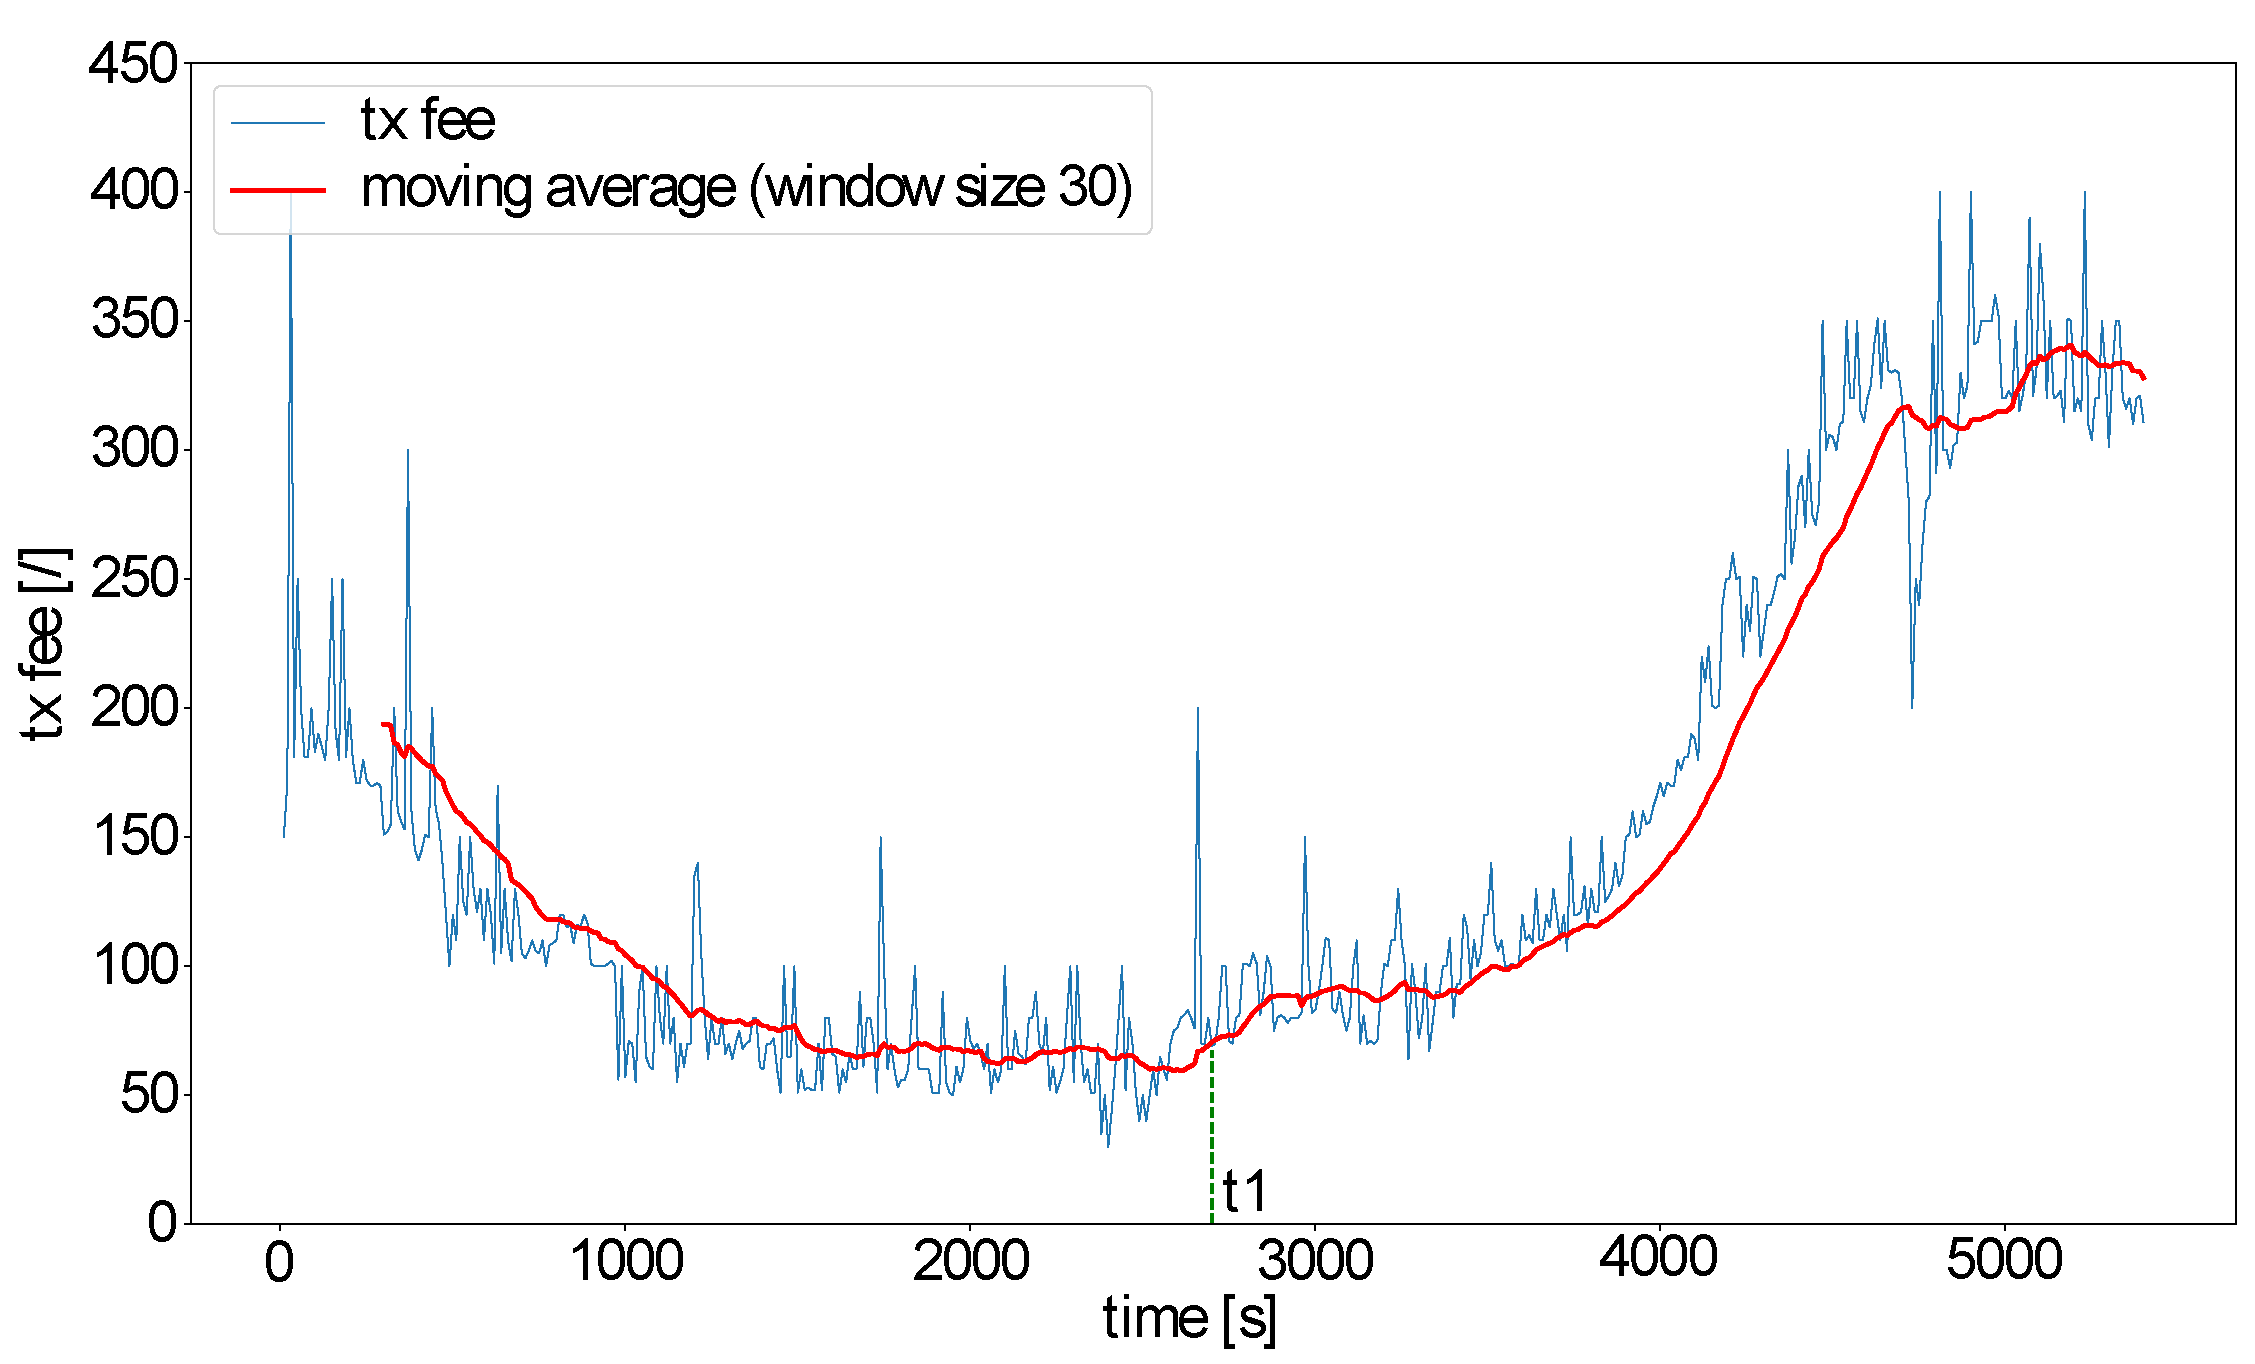
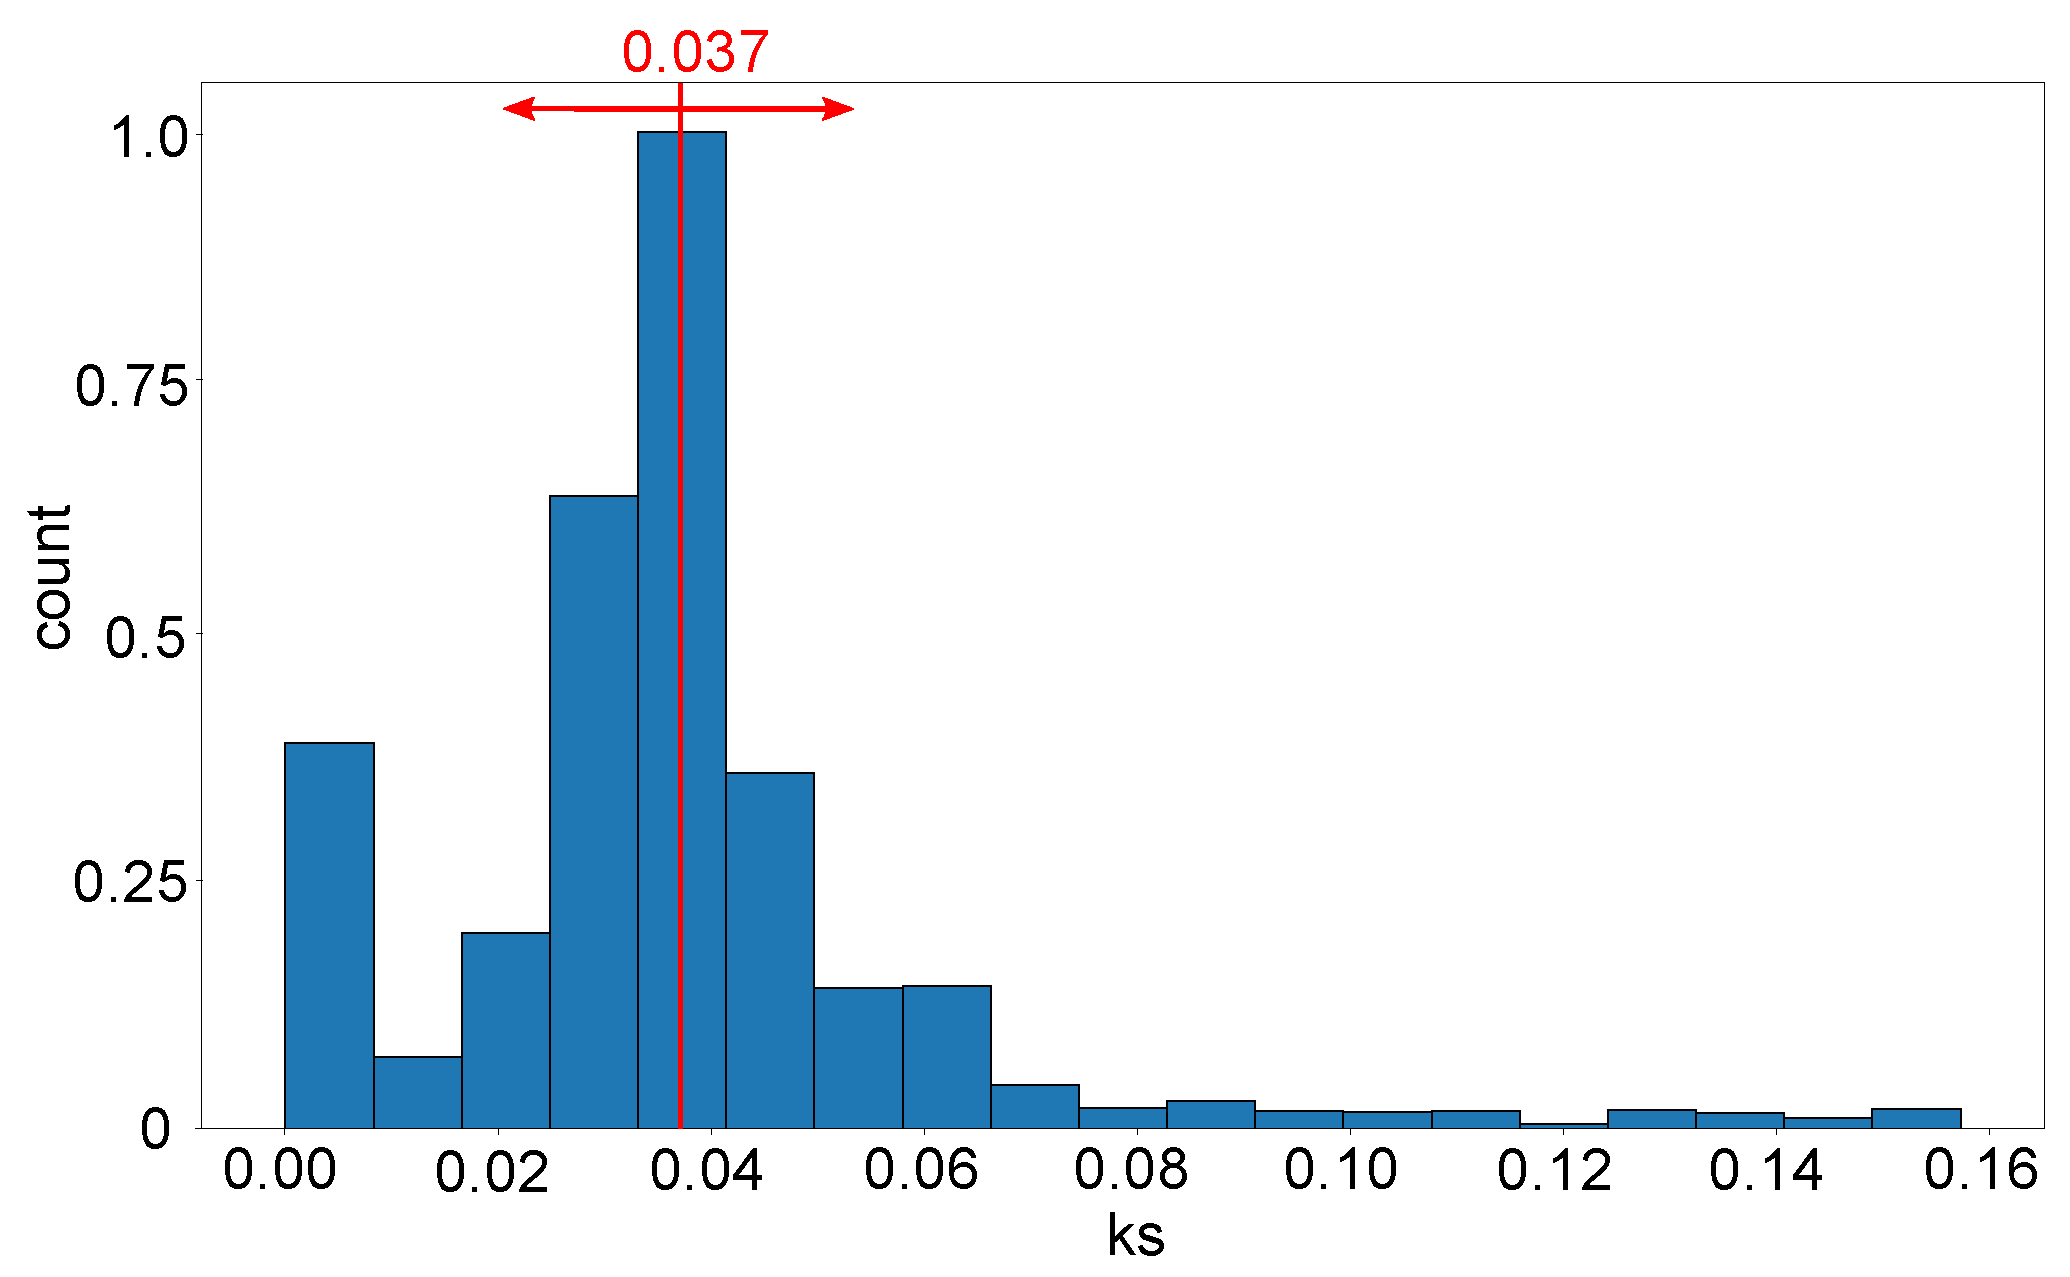
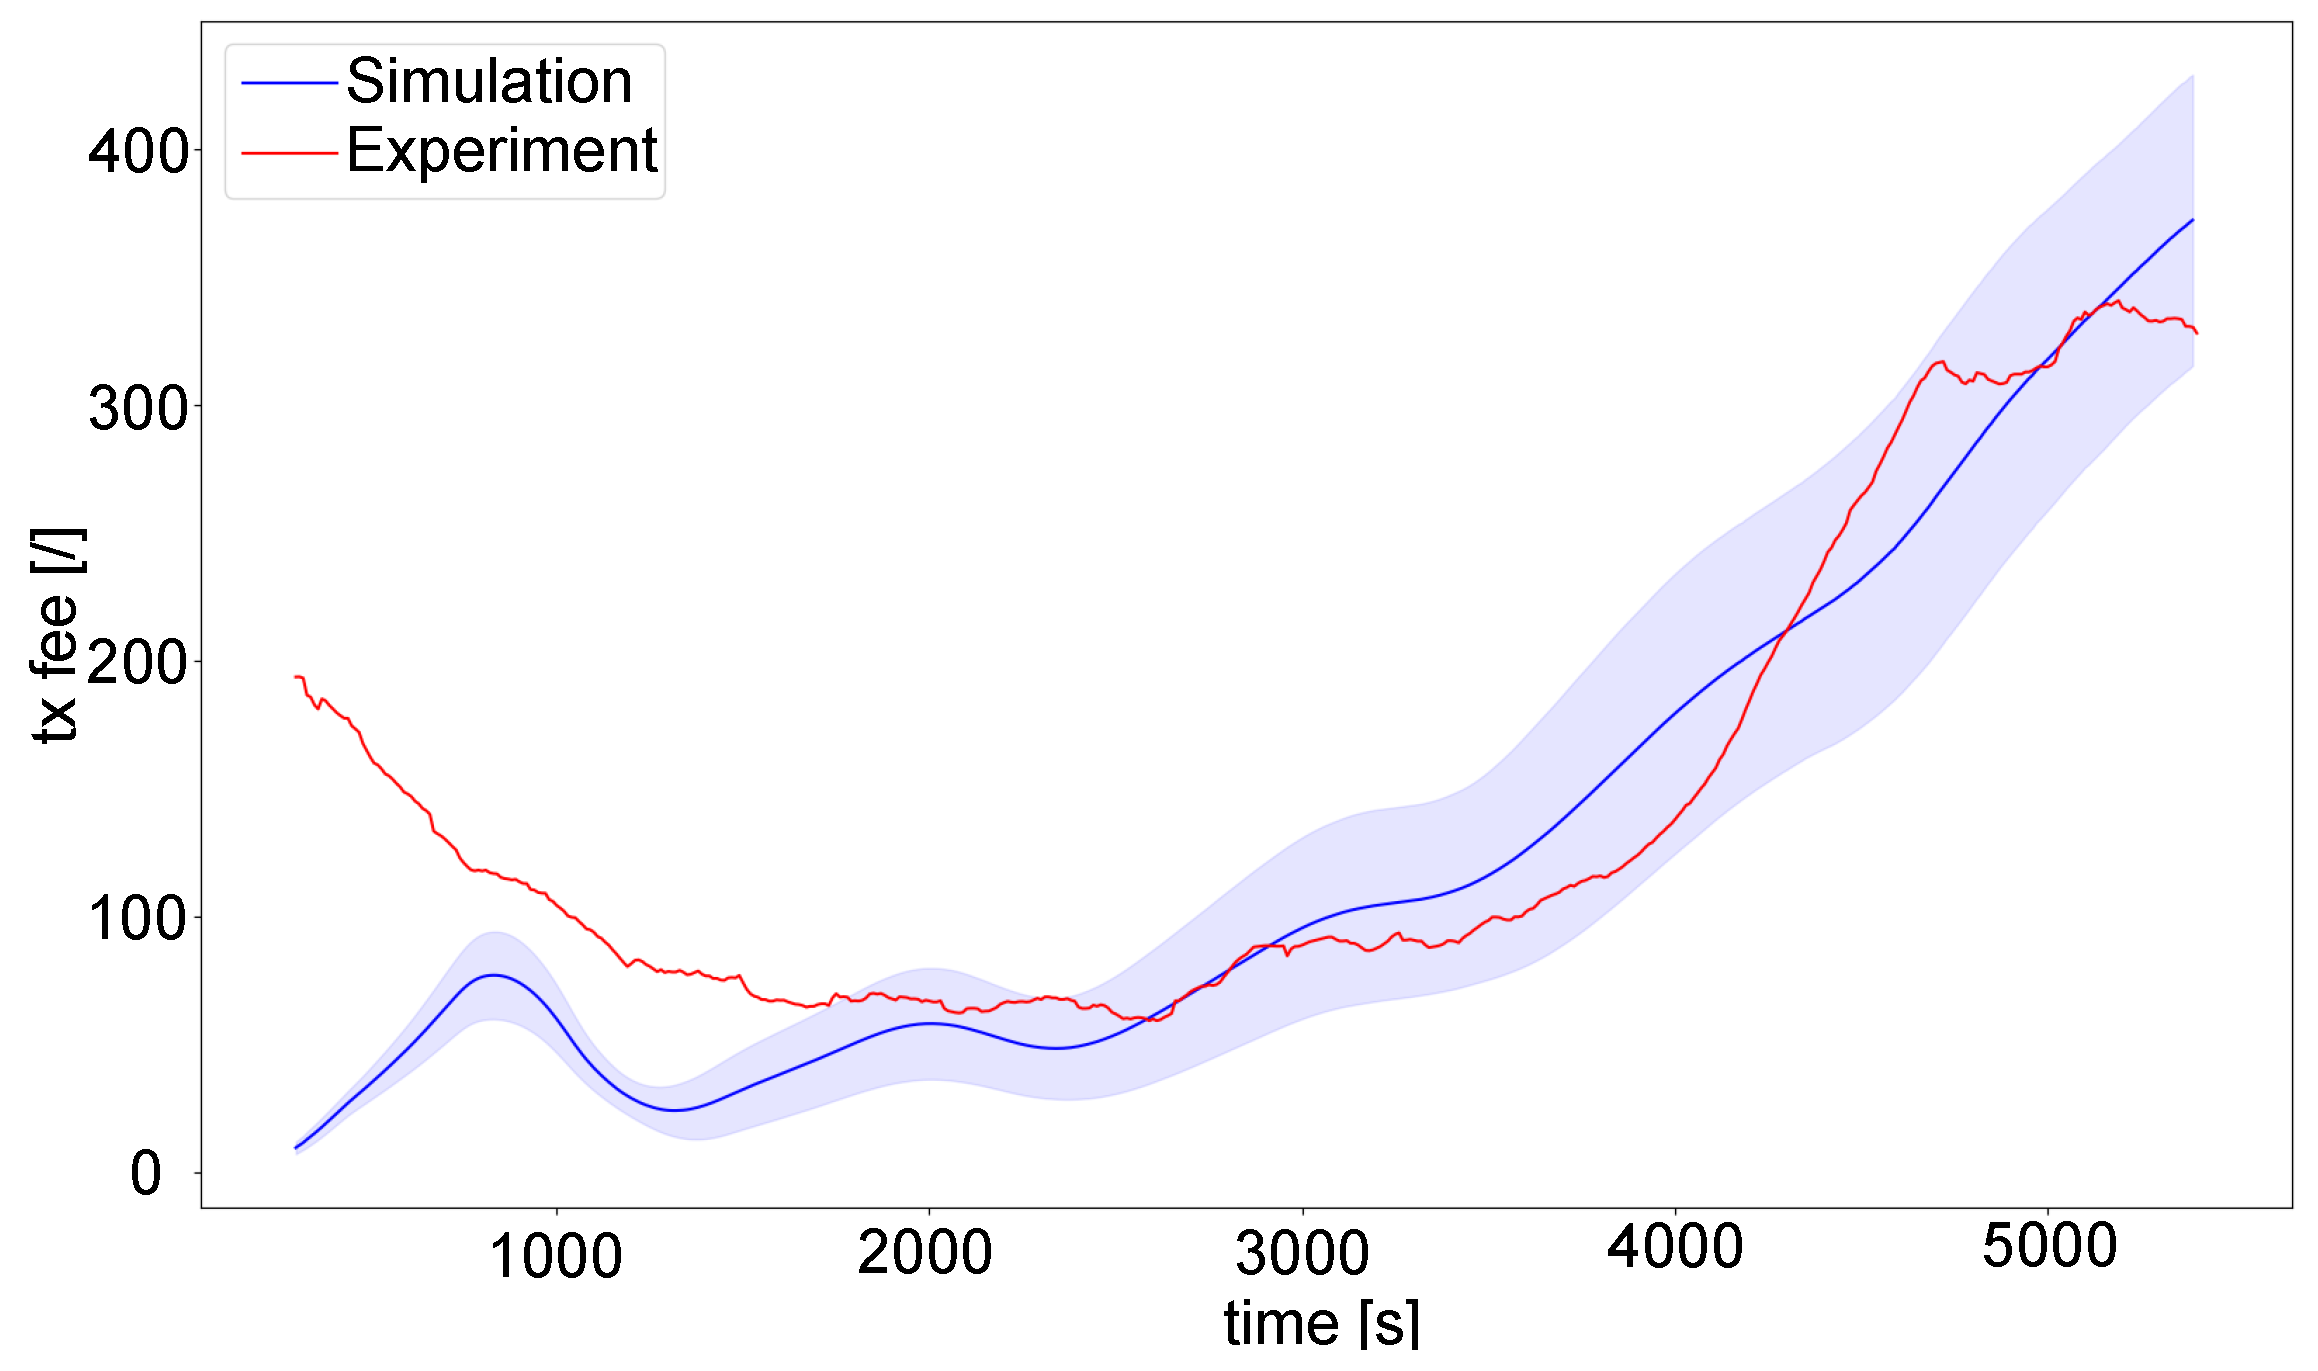
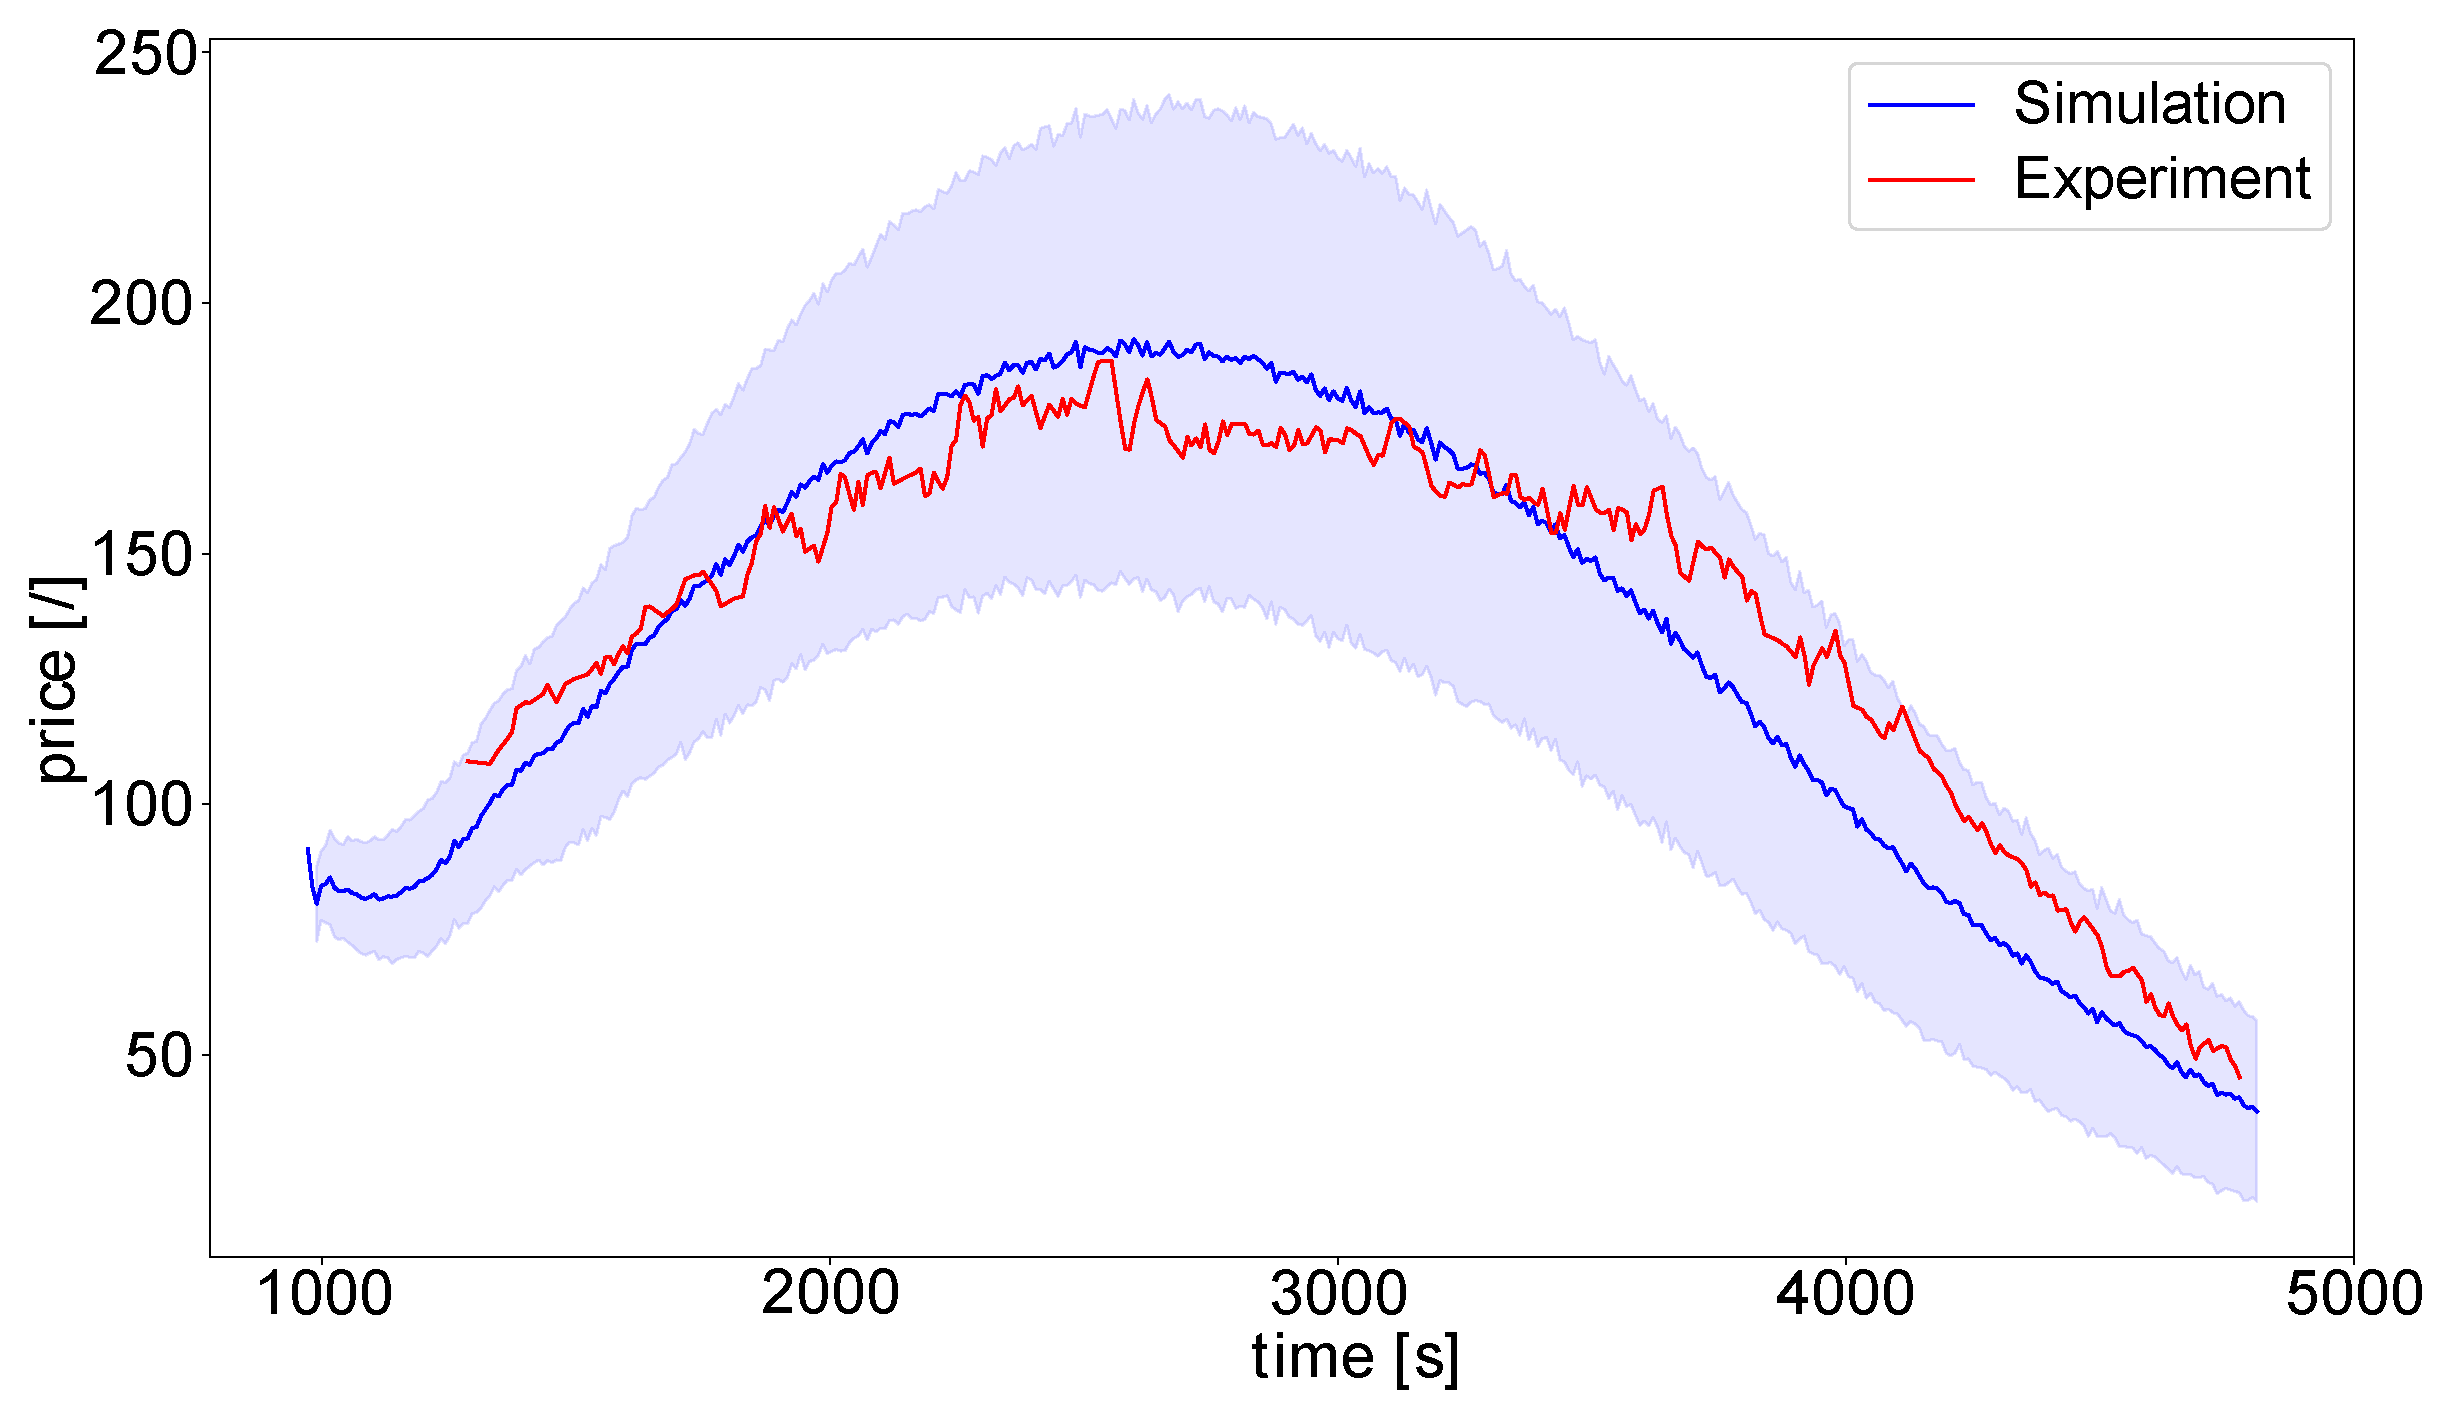
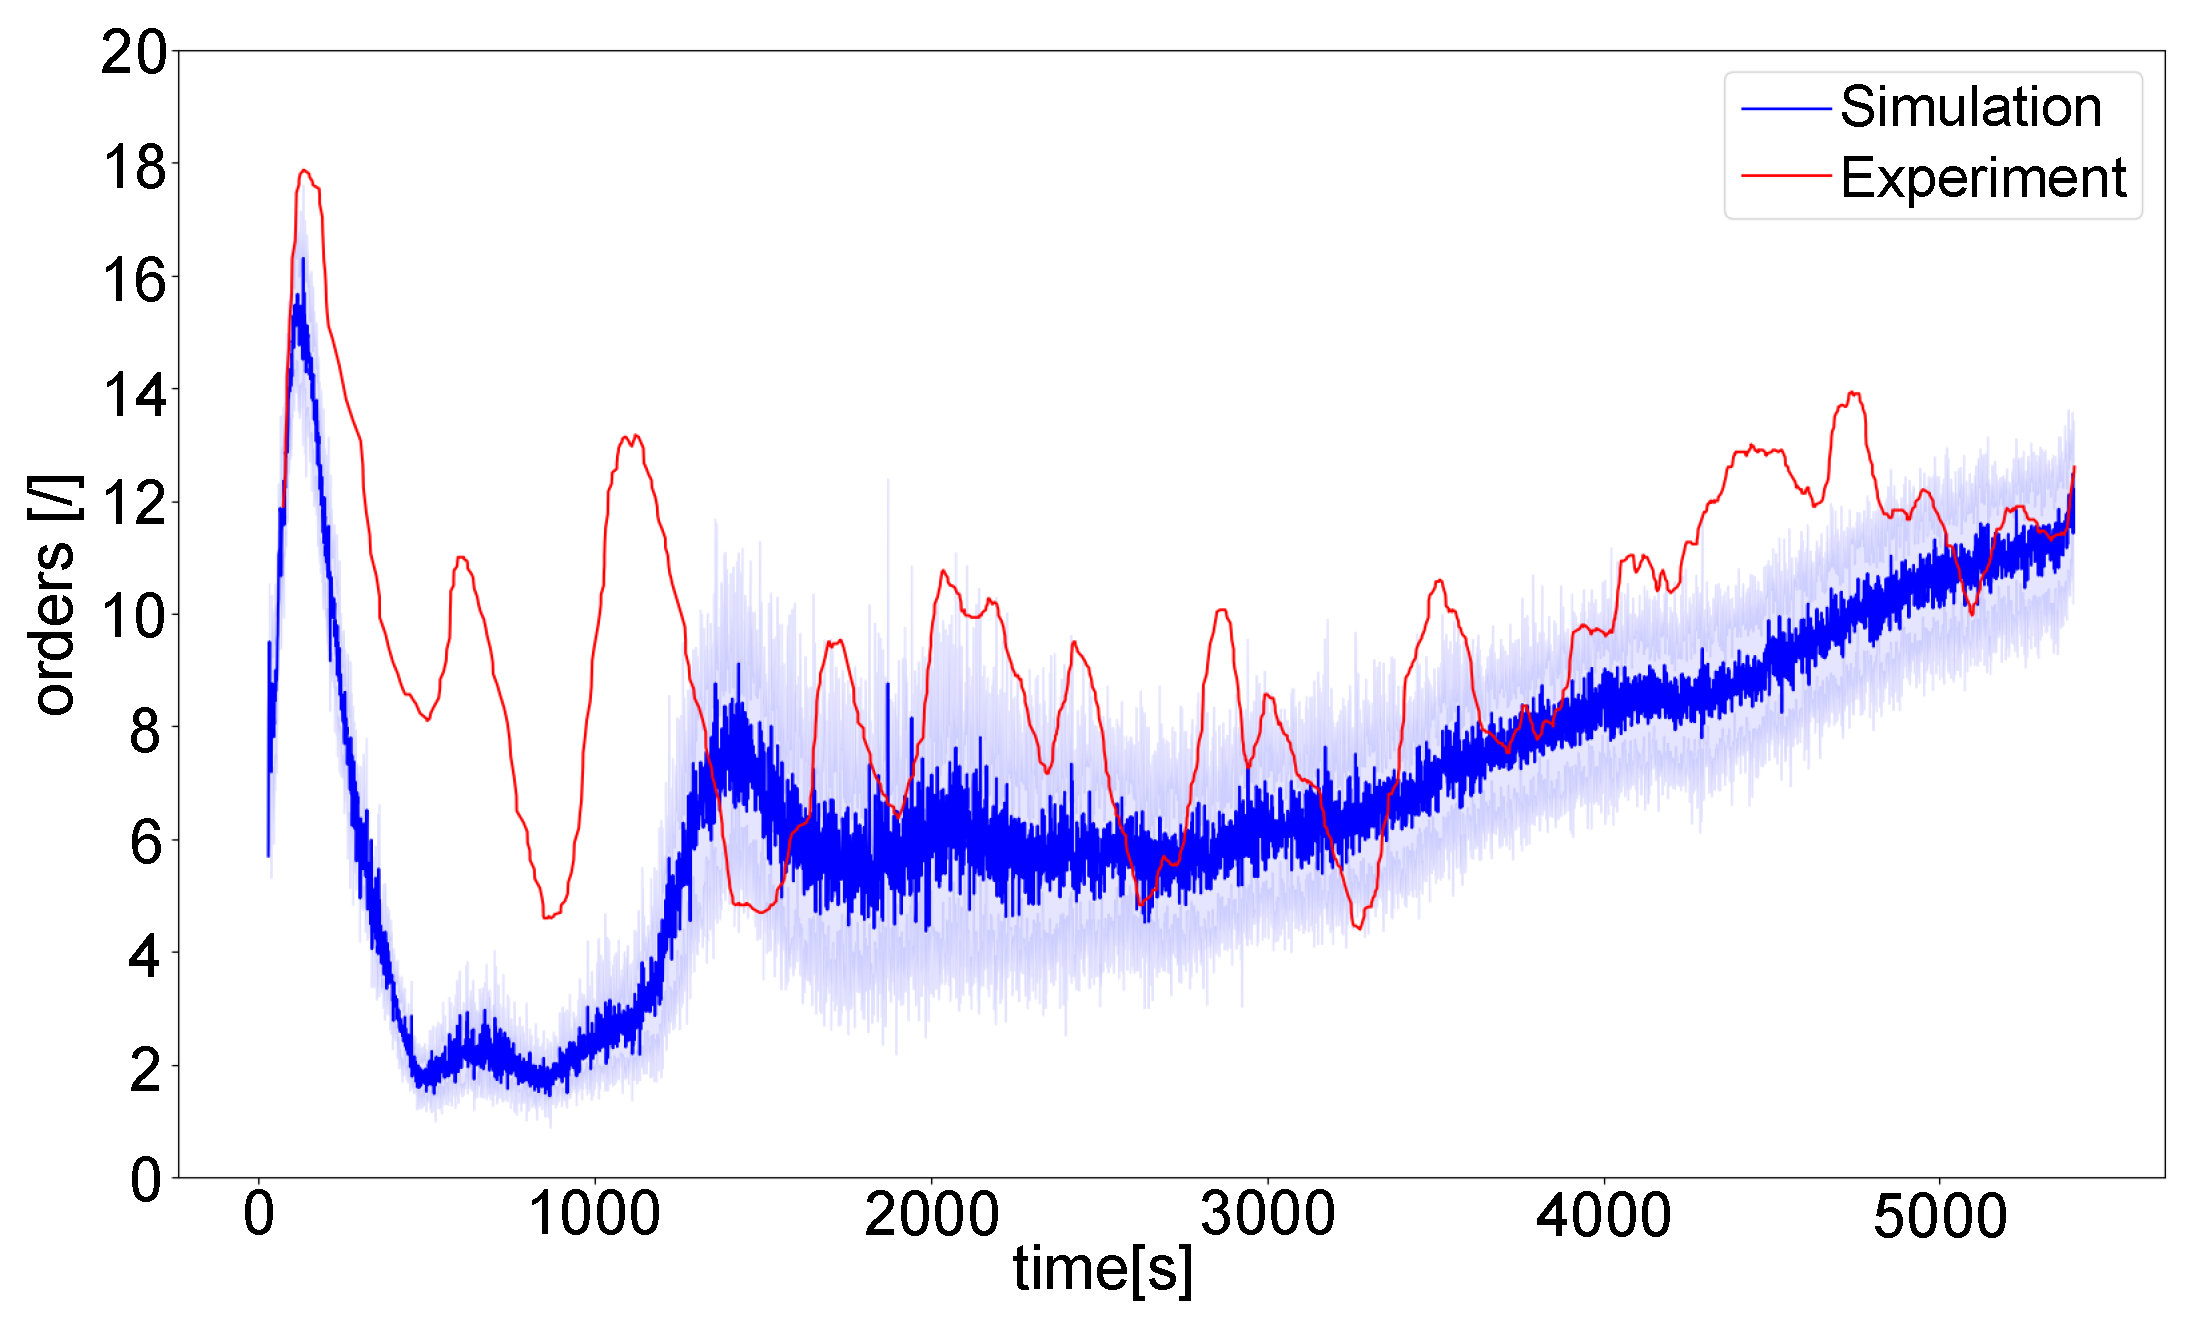
5.3. Verification of the Model

To verify the described model, the results of the simulation were compared with the results of the experiment. The simulation was executed 1000 times with the same initial settings as used in the experiment (27 agents, t g a m e = 90 min, f B C = 10 s, d = 0.87 , t i n i t a l = 300 s, t l i m i t = 20 s). The results of the simulations were compared with the experiment based on four variables: the transaction fee of the confirmed transactions, the price of the provided services, the number of services on the market, and the frequency of the provided services in time. For each variable, the obtained simulation results were observed to see whether they followed the normal distribution; if they passed this test, they are presented using the average value and the standard deviation. The normality test was performed using the Kolmogorov–Smirnov (KS) test for normality, which rejects the normality hypothesis if the p value is less than 0.05 .
Figure 12 presents a comparison of the transaction fee for confirmed transactions over time between the experimental results and the results of the simulations. The KS normality test confirmed the zero hypothesis ( p = 0.11 ). There is a noticeable difference in the first quarter of the game, when the transaction fee in the simulation is much smaller than it was in the experiment. This deviation at the beginning of the game is due to multiple reasons, such as the learning process of the players in the real experiment, hesitation, and waiting for the strategic moves of other players. The agents in the simulation, on the other hand, follow preprogrammed decision-making strategies from the beginning. In the rest of the game, however, the simulation model better describes the behavior of the players in the real experiment, as the value of the transaction fee in the experiment is within the standard deviation of the transaction fee in the simulations.
Figure 13 shows a comparison of the average price between the results of the experiment and the simulations for all three types of provided services. The simulation results again follow a normal distribution (Service A: p = 0.59 , Service B: p = 0.67 , Service C: p = 0.56 ). In the case of this characteristic, the simulation model describes the behavior of the players well throughout the game, as the obtained results of the experiment almost overlap with the average values (dark-colored lines) in the simulation. The average price values of the three types of services deviate less from each other over time in the case of the simulation compared to the experiment, though the values from the experiment are within the standard deviation of the simulation results (brightly colored area).
Figure 14 presents a comparison of the results of the experiment and the simulations for the number of services on the market. The simulation results confirm the hypothesis of normality ( p = 0.69 ). Again, there is a noticeable difference between the results of the experiment and the simulations in the first quarter of the game. In the case of the simulations, agents buy services on the market much faster than players did in the experiment. This might be because agents have more funds in their accounts due to the lower transaction costs in the first quarter of the game, as described above, and might consequently purchase more services. Noisy changes in the average value and standard deviation occur with this variable, which may be a consequence of the number of offers fluctuating on the market in each simulation being slightly offset in time. As a result, the simulation model does not describe this fluctuation of the market supply perfectly, and only describes the tendency of the change in the value of the characteristic.
Figure 15 shows a comparison of the results of the experiment and simulations for the frequency of service provision over time. The simulation results have a normal distribution ( p = 0.62 ). The simulation model better describes the change in the actual frequency of the provided services (green lines) than the change in the maximum capacity of the manufacturing system or the upgrading of the APUs over time (blue lines). These results confirm the previous explanation as to why the simulation deviates from the real experiment in the first quarter, as there is a higher frequency of buying services at the beginning of the game in the former case. As a result, the maximum frequency of service provision in the simulation model increases more than in the experiment at first; towards the end of the game, when the model is better at describing the experiment, this difference decreases.

6. Simulation Results

The verified simulation model was employed to perform a simulation experiment multiple times using different initial setup parameters for the game. The primary objective was to investigate how the frequency of transaction confirmation in a blockchain network impacts a manufacturing system within the BBSM framework. The increasing frequency of transaction confirmation, as seen in the results described above, causes the network to become congested, with the operation of the manufacturing system being limited as a result.
Figure 16 shows how the change in frequency of transaction confirmation in the blockchain network ( f B C ) during the game affects the actual frequency of service provision. At the beginning of the game, the frequency of the provided services is equal for most transaction confirmation frequencies, and the only limitation is the APU production capacity.
For f B C = 0.05 Hz and f B C = 0.075 Hz, the transaction confirmation frequency is already lower than the production capacity of the manufacturing system at the beginning of the game. Later in the game, when congestion occurs in the blockchain network, the differences between the different frequencies of transaction confirmation begin to show, with higher frequency of transaction confirmation leading to higher frequency of service provision.
For different frequencies of transaction confirmation, several variables of the game were observed: the minimum transaction fee, maximum price for the performed service, and time point of the network congestion. Figure 17 shows the change in the minimum transaction fee as a function of the transaction confirmation frequency.
The minimum transaction fee is the value of the lowest fee paid for a transaction after the value of the transaction fee in the game has already stabilized. The dependency is similar to the exponential function, with the transaction fee decreasing rapidly at low transaction confirmation frequencies and approaching its limit value of 0 at higher frequencies, which is a property of the system. If we consider the transaction fees as a part of the manufacturing costs, then the costs would increase in the case of congestion of the blockchain network. On the other hand, if scalability of the blockchain network is sufficient for the needs of the BBSM system, costs would be reduced due to the omitted friction (lower fees) of the financial layer.
Figure 18 shows the dependence of the maximum price of the provided services on the frequency of transaction confirmation. The higher the f B C , the higher the maximum price for the performed service, while the higher the f B C , the less supply there is in the market, as players buy any service that comes on the market immediately. As there is less supply on the market, the price increases according to the property of the free market. The dependency is similar to a sigmoid function, which is due to the production function, defined as a property of the system. At lower frequencies, the blockchain network is immediately congested and the price immediately starts to fall towards a value of zero, as the supply on the market is continually increasing.
When f B C is increasing, the network is not immediately congested at the beginning, though it is necessary to wait for the APUs to upgrade according to the production function. Initially, the production function slowly changes the frequency of the APUs’ ability to offer services; thus, services come onto the market more slowly, and the price cannot rise to a higher value until the network becomes congested. In the middle part of the presented graph, the dependence of the maximum price for a service on f B C can be approximated using a linear function, as the production function in this range is linear as well. The more f B C increases, the higher the maximum price is. The increase of the blockchain network’s frequency in the linear part of the production function means that there is proportionally more time before congestion; consequently, there is proportionally more time to generate supply in the market and to increase the price of services. In the third part, logarithmic relaxation occurs due to the limiting of the production function (in this case, it was set to 20 s).
Figure 19 presents how the time to network congestion depends on the transaction confirmation frequency. The time to network congestion is the first point in time in the game at which the frequency of the provided services is equal to the frequency of transaction confirmation by the blockchain network. Again, the presented function does not indicate linear dependence, because the time to network congestion depends on the defined production function. In a case where there exists a group of players who play the optimal strategy and want to achieve the global optimum manufacturing system, this function has a lower set limit. This means that the blockchain network cannot be congested sooner than the production function allows. A similar form of the function can be observed in Figure 16, which shows the times at which the initial fluctuations in the frequency of service execution disappear. It can be seen that the value fluctuates, i.e., a local maximum appears at about every 0.02 Hz. This oscillation occurs because a point in time is observed at which the function reaches a certain limit; because this function is periodic, the obtained point in time depends on the phase of the observing function.
From the presented simulation results, it can be seen that the scalability properties of blockchain technology in BBSM define the kind of regime in which the BBSM system operates. If the throughput of the blockchain network is lower than the requirements of the users, the transaction fees are high, service prices are low, and manufacturing capacities are underused. This causes depreciation of the manufacturing role compared to the financial role, as shown in the preliminary experiment. On the other hand, if the throughput of the blockchain network is much higher than the requirements of the users, the financial role is depreciated, as the value of the transaction fees are minimal compared to service prices. Both of these two roles, manufacturing and financial, are necessary in order for the BBSM system to exist. Therefore, either extreme regime inhibits the operation of the BBSM system and is not desirable. There must be a balance between the requirements of the users and the throughput provided by the blockchain network in order for the BBSM system to operate. Such a balance is dependent on the user requirements in the system.
The main limitation of the presented results is that the analyzed BBSM system is simplified due to the methodology of employing a virtual environment. In reality, the observed system would be more complex, as the manufacturing world is more diverse with a large number of different types of services, there are additional external factors affecting operation of the system, such as supply chains, and other aspects such as security issues are present. In order to improve this study, experiments with a higher number of repetitions than the sole experiment presented here are necessary. Furthermore, he trade-off between the complexity of the virtual environment and the intuitiveness of the user interface should be optimized in order to increase the complexity of the observed system.

Scalability Solutions

The simulation model was utilized to assess the system’s response when the frequency of transaction confirmation was heightened as the blockchain network became congested. Figure 20 shows a comparison between the simulation results in the case of constant f B C (green color) and the simulation results when f B C doubles as the blockchain network becomes congested (blue color). It is clear that in the case of doubled transaction validation frequency, the utilization of the APUs increases from 40% of the available capacity to 60% at the end of the game. The available maximum production capacity of the manufacturing system in this time frame does not differ much from the capacity in the case without increasing the frequency of transaction confirmation, as this frequency is limited by the production function. However, in the future, even in the case of the maximum possible frequency of service provision, a difference would appear as a result of more service executions. The APUs in the manufacturing system would be upgraded more, and their frequency of service provision would be higher. When f B C is doubled, the frequency of the provided services increases by approximately 40%, and does not completely follow the maximum production capacity, as agents perform staking and unstakingtransactions during this time as well.
Simply increasing the frequency of transaction validation in the blockchain network while not affecting the other properties of the system is not possible due to technological limitations (i.e., the Scalability Trilemma). Solutions are emerging to increase the scalability of blockchain technology, which may allow systems to increase their scalability with arbitrary expense in terms of security and decentralization (e.g., sharding, sidechains). Depending on the amount transferred by the transaction and their importance, users can decide how secure or expensive a network they prefer to use for their transactions. In the case of BBSM, transactions for service provision could be arranged according to such a hierarchy. Therefore, the decision about whether a certain user selects an additional channel (increased f B C ) is not included in the presented Figure 20. This raises interesting questions for future work; we intend to examine the effects of scalability enhancing technologies on the performance of the BBSM concept.

7. Conclusions

This work presents an analysis of the effects of blockchain technology’s limitations on the performance of a BBSM system. To obtain a more realistic model of a BBSM system, an experiment was conducted in the form of an online game. Based on the results of this experiment, an analysis of the players’ strategies was carried out and used to model a multi-agent simulation model that mimics the behavior of the players during the experiment. The model was verified based on the results of the experiment and used to test how different blockchain network settings affect the performance of the BBSM concept. The experimental results have been published in the same repository [58] as the source code of the application developed and used to conduct the experiment. The collected data can be utilized for future performance comparisons of similar experimental methods in the field of blockchain-based manufacturing.
The main findings of our analysis are as follows:
  • The results of the preliminary experiment indicate that when the scalability of the blockchain network does not meet the needs of the BBSM system, the role of the manufacturer becomes less beneficial than the financial role, which means that such a limitation can affect whether or not the system works at all, as manufacturers could lose incentive to participate in such a system. Higher transaction costs and lower prices for manufacturing services emerge in the BBSM system due to congestion of the blockchain network, and as a result the system is not able to utilize the existing maximum production capacities in the manufacturing system. Our strategy analysis of the performed experiment shows that because of the scalability limitations of the blockchain network in the game, staking funds in the blockchain network instead of using them to upgrade production capabilities is the winning strategy.
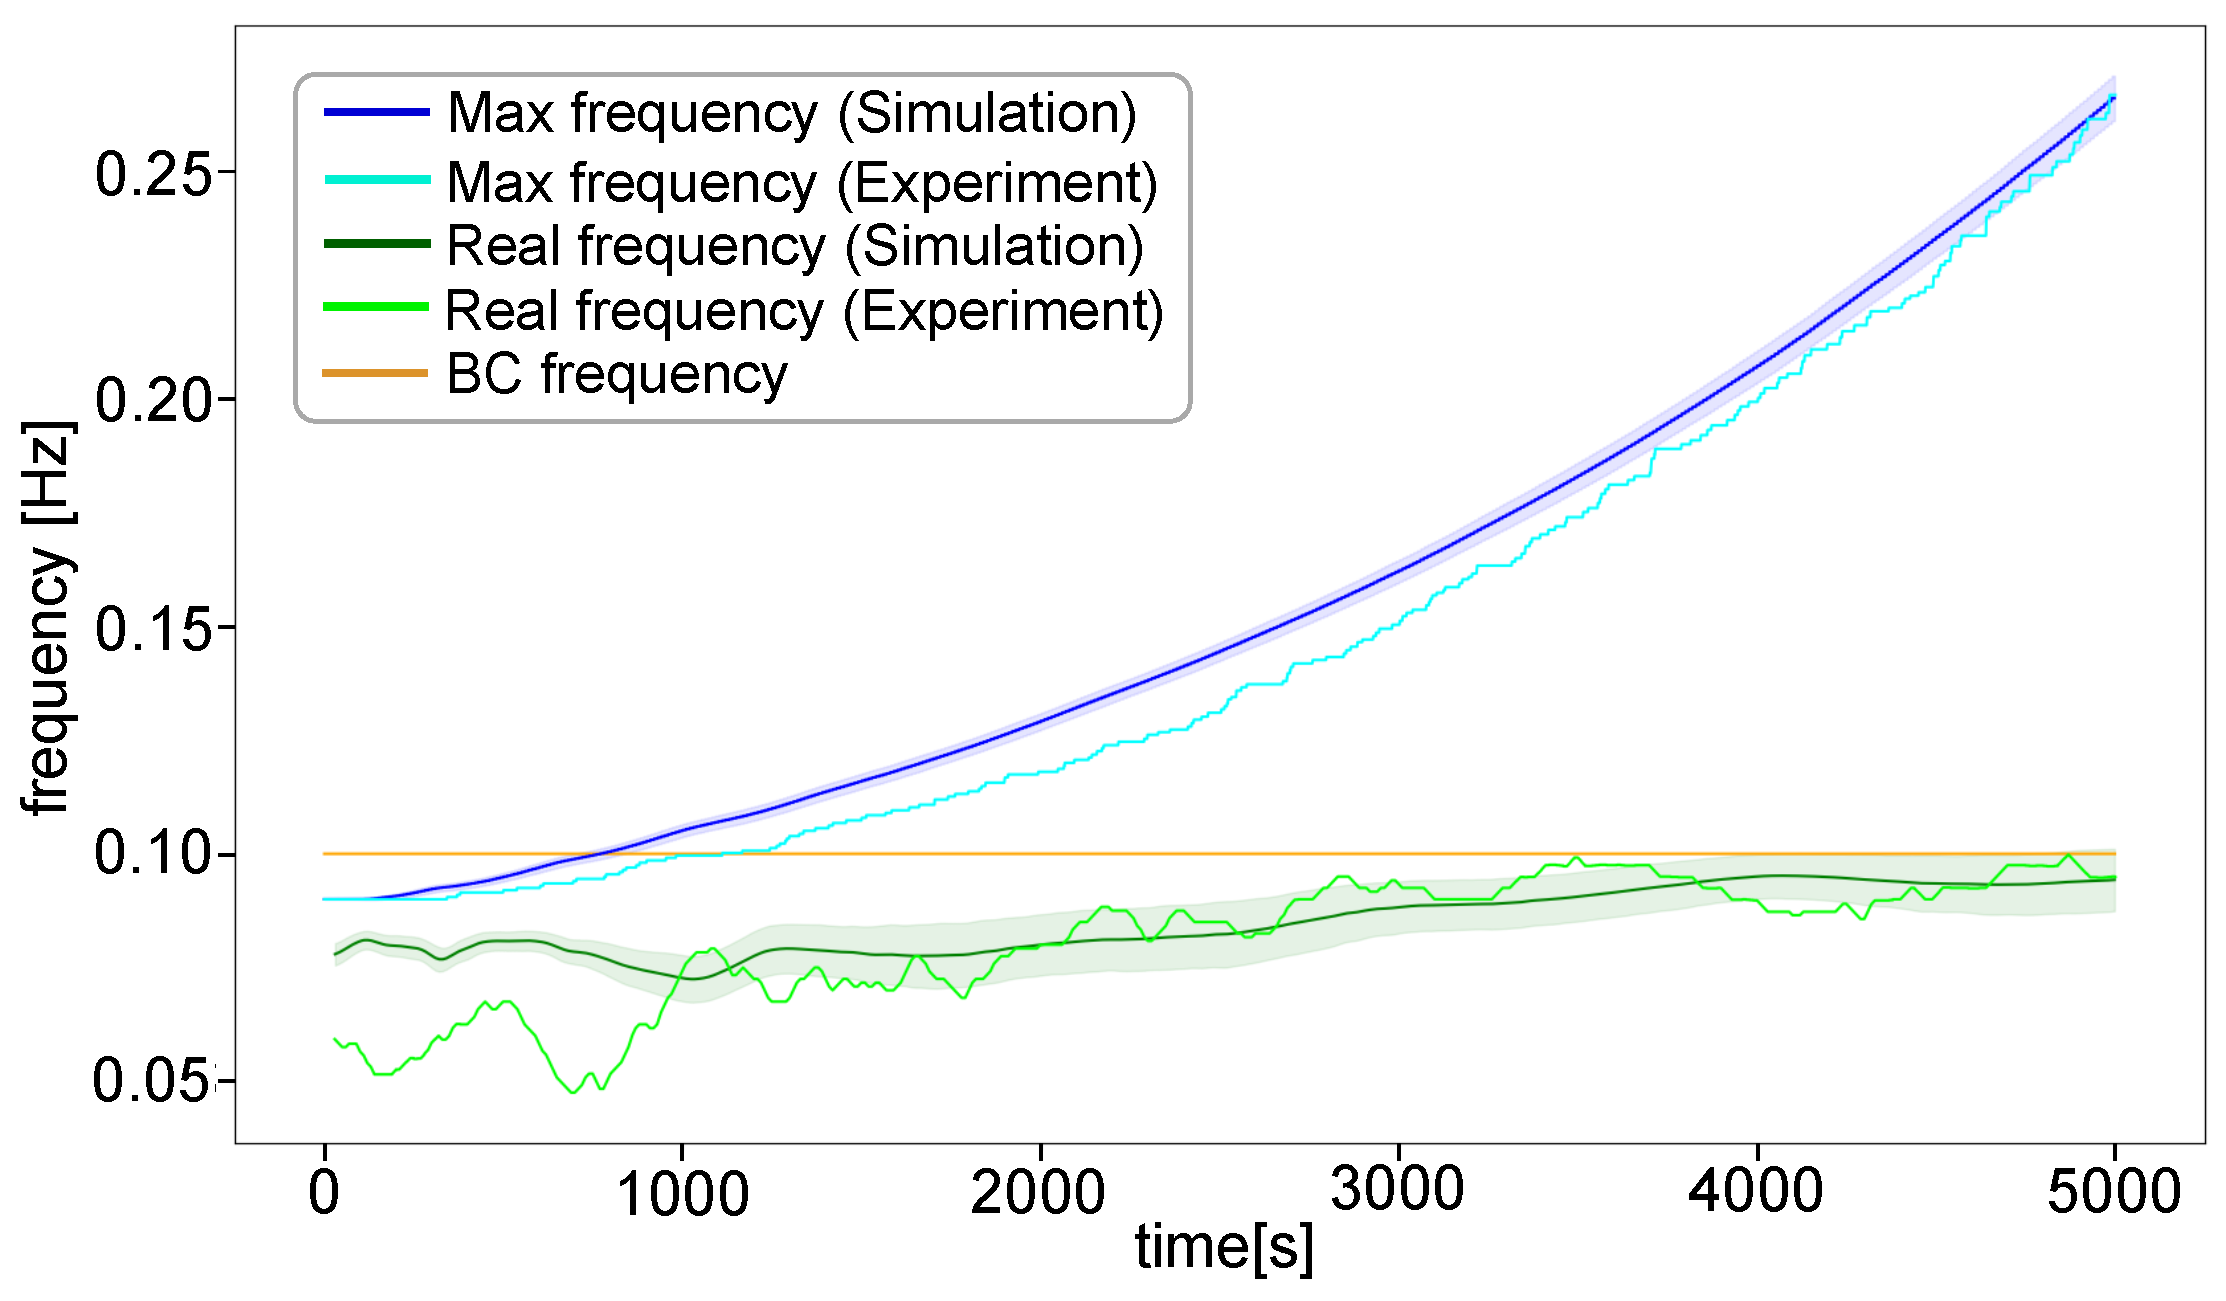
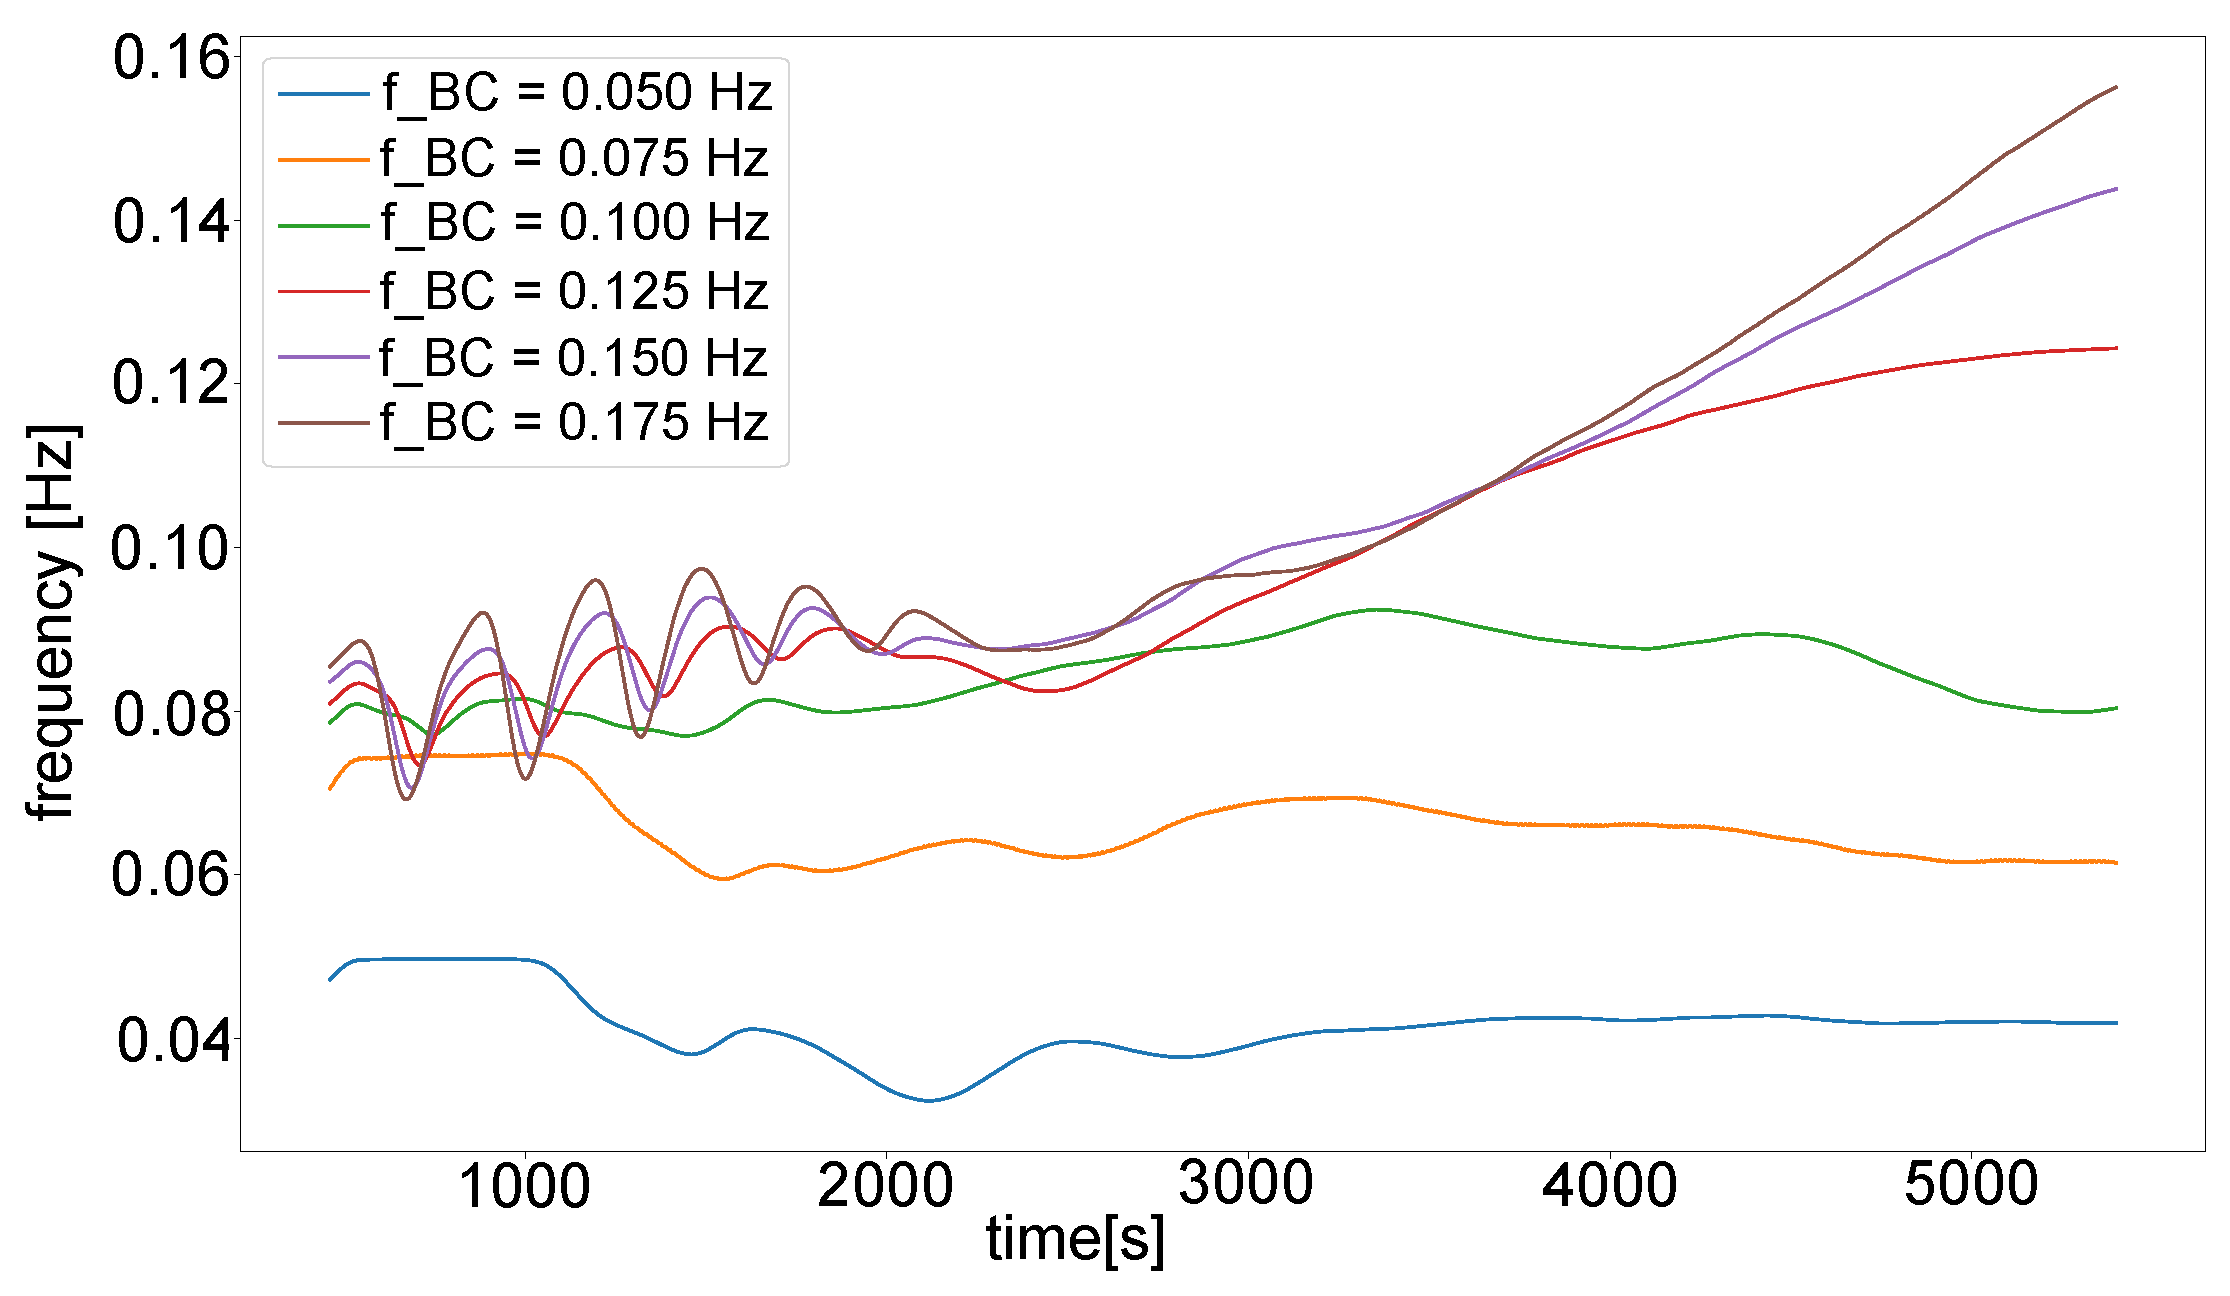
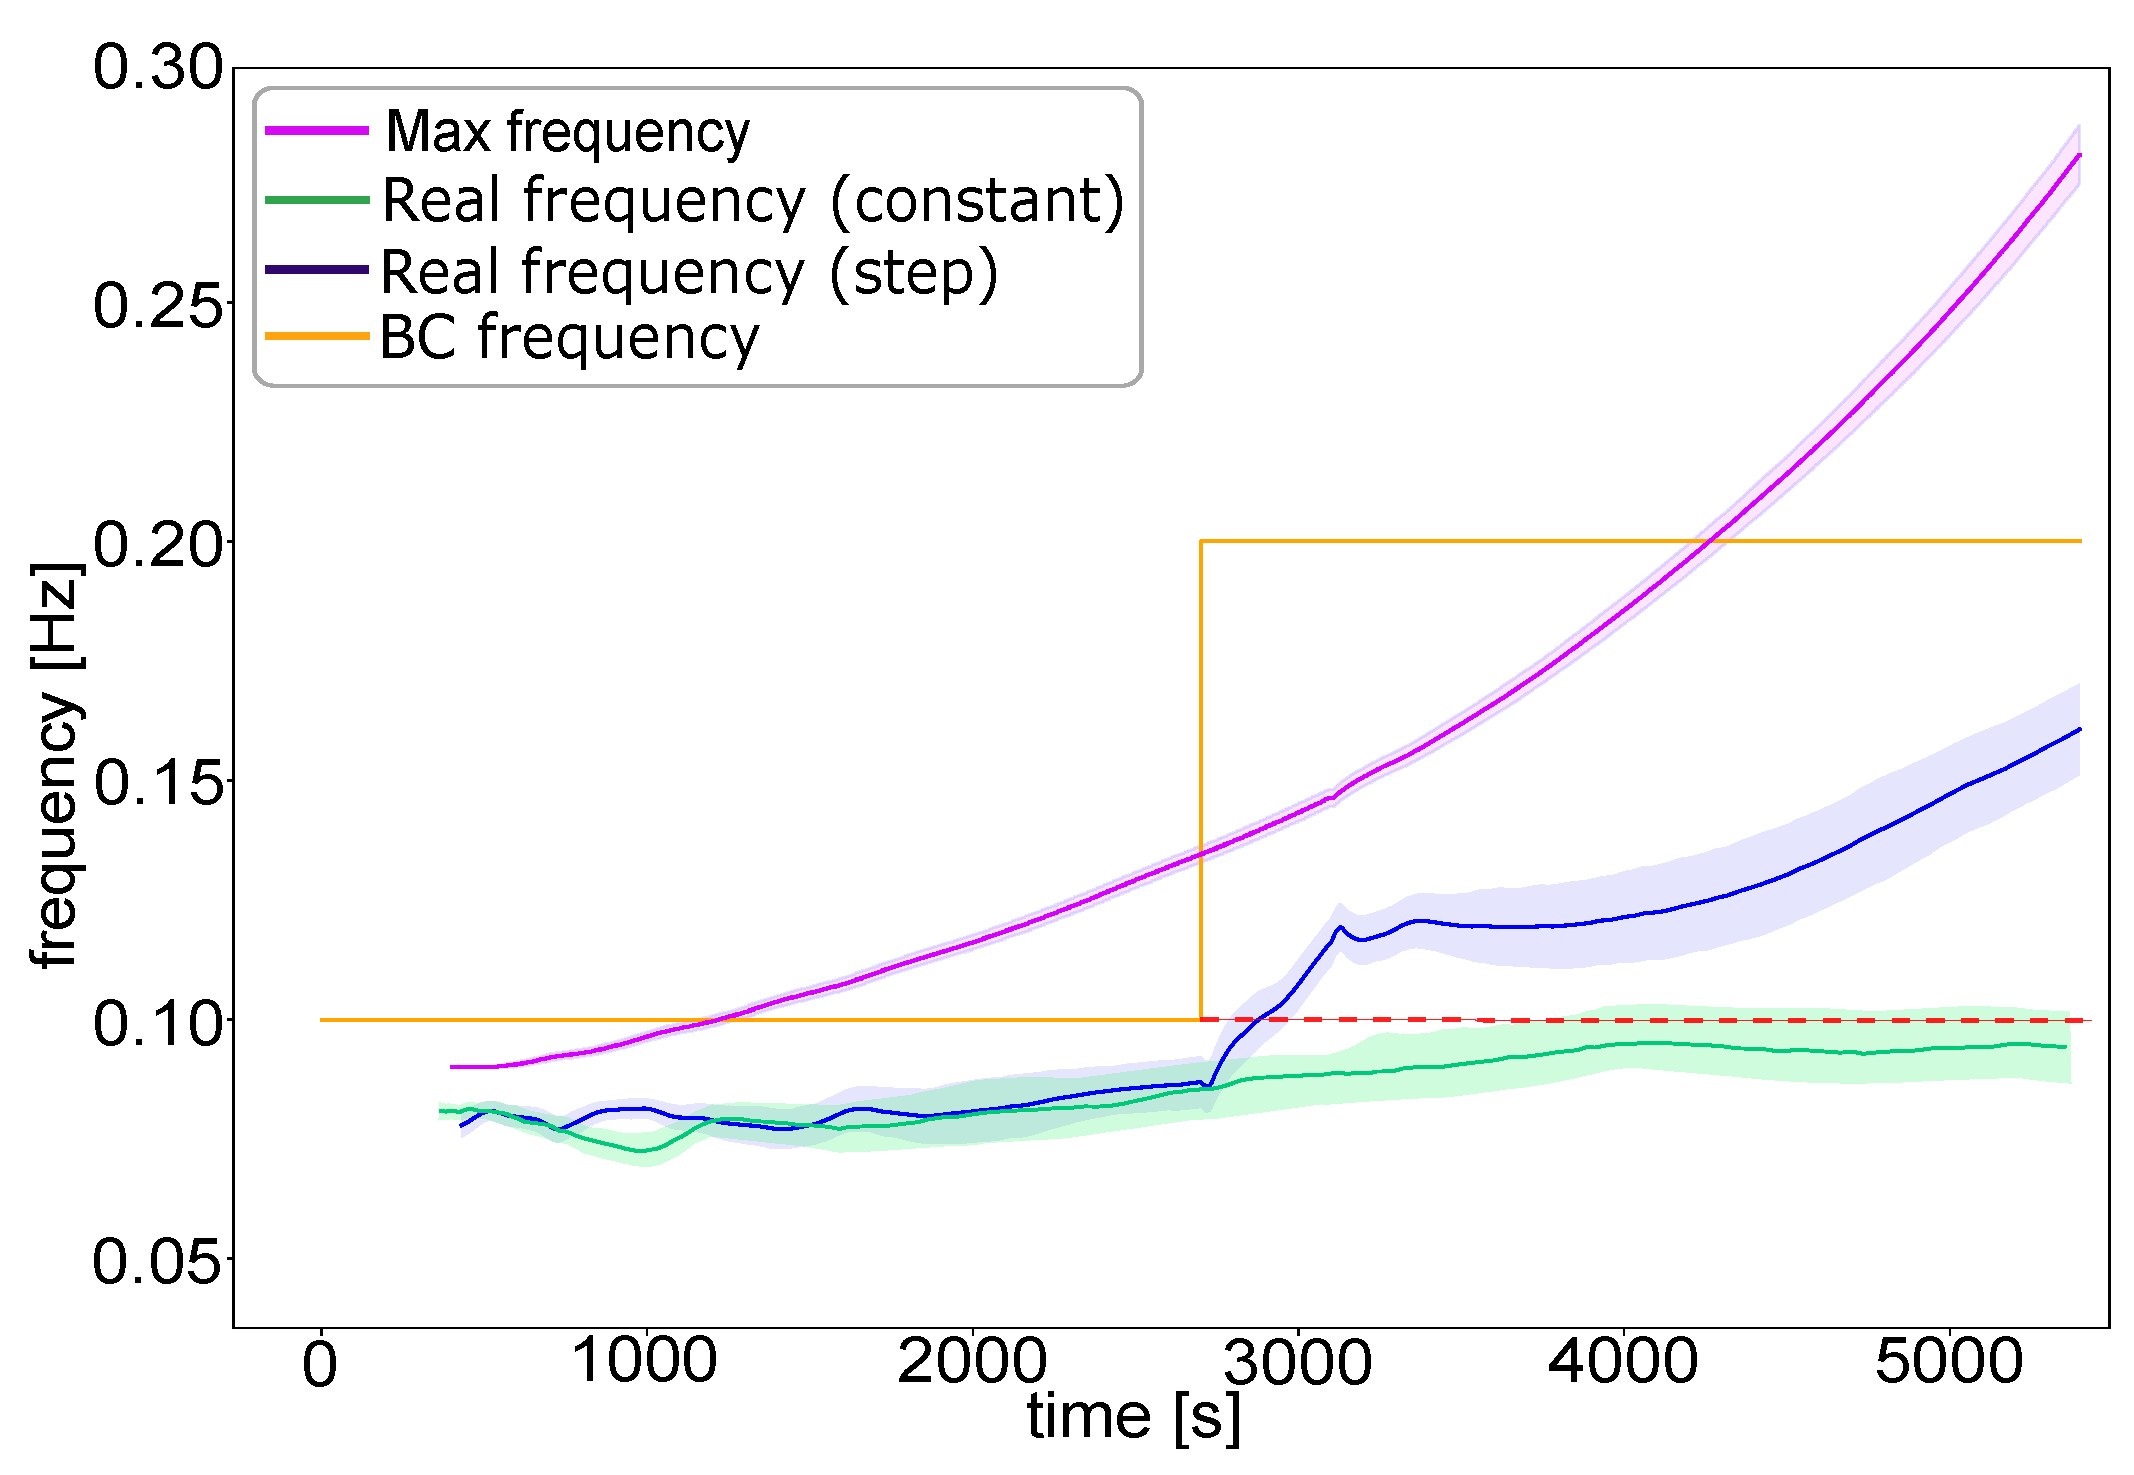
  • The results of our simulations suggest that changing the scalability of the blockchain network in the BBSM system does not directly affect the system’s properties (i.e., minimum fee, maximum price, and capacity utilization); however, the change in these properties depends on the production function. Therefore, when introducing scalability enhancing technologies into the BBSM system, it is not trivial to predict how the system will respond to the increased throughput. The results of our simulations show that in the presented game a 100% increase in f B C when the blockchain is clogged changes the upper bound of service provision frequency from f B C to the maximum frequency of the service provision as defined by the production function. At that moment, the actual frequency of service provision is increased by approximately 40%, and does not completely follow the production function, which is due to the concurrent financial transactions (i.e., staking and unstaking transactions). Due to the relieving of pressure on the blockchain network, the efficiency of utilizing the maximum production capacity within the BBSM concept increases.
In conclusion, this study has demonstrated, contrary to early assertions that blockchain systems can significantly reduce costs for manufacturers by eliminating the need for expensive intermediaries, it is instead evident that zero-trust and intermediary-free blockchain systems are faced serious with operating capacity limitations. The experiment and simulations presented in our research serve as a compelling illustration of this critical observation. Scalability-enhancing technologies seem to be a solution to the scalability limitations of blockchain technology. Our results suggest that the implementation of such solutions can improve the operation of BBSM systems. However, the same results indicate that a balance between the scalability properties of the blockchain network and users’ requirements is necessary in order for the BBSM system to operate. In future research, scalability-enhancing technologies (i.e., sidechains) in connection with BBSM will be examined to determine whether such technologies can enable a dynamic balance between requirements and throughput as well as address the effects of the Scalability Trilemma on the BBSM system. The presented methodology and analysis can be applied to studies on other types of blockchain-based manufacturing systems. Furthermore, the presented implementation of a BBSM system can serve as a model for future analysis of BBSM systems in which APUs are supported by AI technology.

Author Contributions

Conceptualization, N.R., M.C. and G.Š.; methodology, N.R., M.C. and G.Š.; software, N.R.; validation, N.R., M.C., G.Š. and J.D.; formal analysis, N.R. and M.C.; investigation, N.R.; resources, N.R.; data curation, N.R.; writing—original-draft preparation, N.R.; writing—review and editing, N.R., M.C., G.Š., J.D. and P.P.; visualization, N.R. and J.D.; supervision, T.B., J.D. and P.P; project administration, T.B., J.D. and P.P.; funding acquisition, T.B., J.D. and P.P. All authors have read and agreed to the published version of the manuscript.

Funding

This research was funded by the Slovenian Research Agency under the funding “Young Researchers” and research programme Grant P2-0270.

Informed Consent Statement

Informed consent was obtained from all subjects involved in the study.

Data Availability Statement

Publicly available datasets were analyzed in this study. This data can be found here: https://github.com/fsprojekti/BBSMgame.

Conflicts of Interest

The authors declare no conflict of interest. The funders had no role in the design of the study; in the collection, analyses, or interpretation of data; in the writing of the manuscript, or in the decision to publish the results.

References

  1. Yu, C.; Xu, X.; Yu, S.; Sang, Z.; Yang, C.; Jiang, X. Shared Manufacturing in the Sharing Economy: Concept, definition and service operations. Comput. Ind. Eng. 2020, 146, 106602. [Google Scholar] [CrossRef]
  2. Rožman, N.; Diaci, J.; Corn, M. Scalable framework for blockchain-based shared manufacturing. Robot. Comput. Integr. Manuf. 2021, 71, 102139. [Google Scholar] [CrossRef]
  3. Yu, C.; Jiang, X.; Yu, S.; Yang, C. Blockchain-based shared manufacturing in support of cyber physical systems: Concept, framework, and operation. Robot. Comput. Integr. Manuf. 2020, 64, 101931. [Google Scholar] [CrossRef]
  4. Hawlitschek, F.; Notheisen, B.; Teubner, T. The limits of trust-free systems: A literature review on blockchain technology and trust in the sharing economy. Electron. Commer. Res. Appl. 2018, 29, 50–63. [Google Scholar] [CrossRef]
  5. Yalcinkaya, E.; Maffei, A.; Akillioglu, H.; Onori, M. Empowering ISA95 compliant traditional and smart manufacturing systems with the blockchain technology. Manuf. Rev. 2021, 8, 15. [Google Scholar] [CrossRef]
  6. Zuo, Y. Making smart manufacturing smarter—A survey on blockchain technology in Industry 4.0. Enterp. Inf. Syst. 2021, 15, 1323–1353. [Google Scholar] [CrossRef]
  7. Lee, J.; Azamfar, M.; Singh, J. A blockchain enabled Cyber-Physical System architecture for Industry 4.0 manufacturing systems. Manuf. Lett. 2019, 20, 34–39. [Google Scholar] [CrossRef]
  8. Raja Santhi, A.; Muthuswamy, P. Influence of blockchain technology in manufacturing supply chain and logistics. Logistics 2022, 6, 15. [Google Scholar] [CrossRef]
  9. Jing, Z.; Hu, N.; Song, Y.; Song, B.; Gu, C.; Pan, L. On the design and implementation of a blockchain-based data management system for ETO manufacturing. Appl. Sci. 2022, 12, 9184. [Google Scholar] [CrossRef]
  10. Ko, T.; Lee, J.; Ryu, D. Blockchain technology and manufacturing industry: Real-time transparency and cost savings. Sustainability 2018, 10, 4274. [Google Scholar] [CrossRef] [Green Version]
  11. Matenga, A.E.; Mpofu, K. Blockchain-Based Cloud Manufacturing SCM System for Collaborative Enterprise Manufacturing: A Case Study of Transport Manufacturing. Appl. Sci. 2022, 12, 8664. [Google Scholar] [CrossRef]
  12. Wang, Y.; Yang, Y.; Suo, S.; Wang, M.; Rao, W. Using Blockchain to Protect 3D Printing from Unauthorized Model Tampering. Appl. Sci. 2022, 12, 7947. [Google Scholar] [CrossRef]
  13. Zhang, Y.; Xu, X.; Liu, A.; Lu, Q.; Xu, L.; Tao, F. Blockchain-based trust mechanism for IoT-based smart manufacturing system. IEEE Trans. Comput. Soc. Syst. 2019, 6, 1386–1394. [Google Scholar] [CrossRef]
  14. Zhou, Q.; Huang, H.; Zheng, Z.; Bian, J. Solutions to scalability of blockchain: A survey. IEEE Access 2020, 8, 16440–16455. [Google Scholar] [CrossRef]
  15. Gopalan, A.; Sankararaman, A.; Walid, A.; Vishwanath, S. Stability and scalability of blockchain systems. Proc. ACM Meas. Anal. Comput. Syst. 2020, 4, 1–35. [Google Scholar] [CrossRef]
  16. Sanka, A.I.; Cheung, R.C. A systematic review of blockchain scalability: Issues, solutions, analysis and future research. J. Netw. Comput. Appl. 2021, 195, 103232. [Google Scholar] [CrossRef]
  17. Buterin, V. On Sharding Blockchains. Available online: https://github.com/ethereum/wiki/wiki/Sharding-FAQ (accessed on 27 November 2019).
  18. Chauhan, A.; Malviya, O.P.; Verma, M.; Mor, T.S. Blockchain and scalability. In Proceedings of the 2018 IEEE International Conference on Software Quality, Reliability and Security Companion (QRS-C), Lisbon, Portugal, 16–20 July 2018; pp. 122–128. [Google Scholar] [CrossRef]
  19. Acquier, A.; Daudigeos, T.; Pinkse, J. Promises and paradoxes of the sharing economy: An organizing framework. Technol. Forecast. Soc. Chang. 2017, 125, 1–10. [Google Scholar] [CrossRef]
  20. Sutherland, W.; Jarrahi, M.H. The sharing economy and digital platforms: A review and research agenda. Int. J. Inf. Manag. 2018, 43, 328–341. [Google Scholar] [CrossRef]
  21. Tumasjan, A.; Beutel, T. Blockchain-based decentralized business models in the sharing economy: A technology adoption perspective. In Business Transformation through Blockchain; Springer: Berlin/Heidelberg, Germany, 2019; pp. 77–120. [Google Scholar] [CrossRef]
  22. Kovacs, O. The dark corners of industry 4.0–Grounding economic governance 2.0. Technol. Soc. 2018, 55, 140–145. [Google Scholar] [CrossRef]
  23. Wu, Q.; He, K.; Chen, X. Personalized federated learning for intelligent IoT applications: A cloud-edge based framework. IEEE Open J. Comput. Soc. 2020, 1, 35–44. [Google Scholar] [CrossRef]
  24. Ritala, P.; Husted, K.; Olander, H.; Michailova, S. External knowledge sharing and radical innovation: The downsides of uncontrolled openness. J. Knowl. Manag. 2018, 22, 1104–1123. [Google Scholar] [CrossRef]
  25. Jie, L.; Jiang, W. The Negative Effects of Information Technology on Employees’ Mental Health and Their Solutions. In Proceedings of the 2008 International Seminar on Business and Information Management, Taipei, Taiwan, 19–21 December 2008; Volume 1, pp. 453–456. [Google Scholar] [CrossRef]
  26. Swan, M. Blockchain: Blueprint for a New Economy; O’Reilly Media: Sebastopol, CA, USA, 2015. [Google Scholar]
  27. Zheng, Z.; Xie, S.; Dai, H.; Chen, X.; Wang, H. An overview of blockchain technology: Architecture, consensus, and future trends. In Proceedings of the 2017 IEEE International Congress on Big Data (BigData Congress), Honolulu, HI, USA, 25–30 June 2017; pp. 557–564. [Google Scholar] [CrossRef]
  28. Croman, K.; Decker, C.; Eyal, I.; Gencer, A.E.; Juels, A.; Kosba, A.; Miller, A.; Saxena, P.; Shi, E.; Gün Sirer, E.; et al. On Scaling Decentralized Blockchains. In Proceedings of the Financial Cryptography and Data Security; Clark, J., Meiklejohn, S., Ryan, P.Y.A., Wallach, D., Brenner, M., Rohloff, K., Eds.; Springer: Berlin/Heidelberg, Germany, 2016; pp. 106–125. [Google Scholar]
  29. Slepak, G.; Petrova, A. The DCS Theorem. arXiv 2018, arXiv:1801.04335. [Google Scholar]
  30. Abadi, J.; Brunnermeier, M. Blockchain Economics; Working Paper 25407; National Bureau of Economic Research: Cambridge, MA, USA, 2018. [Google Scholar] [CrossRef] [Green Version]
  31. Herrera-Joancomartí, J.; Pérez-Solà, C. Privacy in Bitcoin Transactions: New Challenges from Blockchain Scalability Solutions. In Proceedings of the Modeling Decisions for Artificial Intelligence; Torra, V., Narukawa, Y., Navarro-Arribas, G., Yañez, C., Eds.; Springer International Publishing: Cham, Switzerland, 2016; pp. 26–44. [Google Scholar] [CrossRef]
  32. Zheng, P.; Zheng, Z.; Luo, X.; Chen, X.; Liu, X. A detailed and real-time performance monitoring framework for blockchain systems. In Proceedings of the 2018 IEEE/ACM 40th International Conference on Software Engineering: Software Engineering in Practice Track (ICSE-SEIP), Gothenburg, Sweden, 25 May–3 June 2018; pp. 134–143. [Google Scholar] [CrossRef]
  33. Dedeoglu, V.; Dorri, A.; Jurdak, R.; Michelin, R.A.; Lunardi, R.C.; Kanhere, S.S.; Zorzo, A.F. A journey in applying blockchain for cyberphysical systems. In Proceedings of the 2020 International Conference on Communication Systems & NETworkS (COMSNETS), Bangalore, India, 7–11 January 2020; pp. 383–390. [Google Scholar] [CrossRef] [Green Version]
  34. Sund, T.; Lööf, C.; Nadjm-Tehrani, S.; Asplund, M. Blockchain-based event processing in supply chains—A case study at IKEA. Robot. Comput. Integr. Manuf. 2020, 65, 101971. [Google Scholar] [CrossRef]
  35. Al-Jaroodi, J.; Mohamed, N. Blockchain in industries: A survey. IEEE Access 2019, 7, 36500–36515. [Google Scholar] [CrossRef]
  36. Yalcinkaya, E.; Maffei, A.; Onori, M. Blockchain Reference System Architecture Description for the ISA95 Compliant Traditional and Smart Manufacturing Systems. Sensors 2020, 20, 6456. [Google Scholar] [CrossRef]
  37. Seok, B.; Park, J.; Park, J.H. A lightweight hash-based blockchain architecture for industrial IoT. Appl. Sci. 2019, 9, 3740. [Google Scholar] [CrossRef] [Green Version]
  38. Da Xu, L.; Viriyasitavat, W. Application of blockchain in collaborative internet-of-things services. IEEE Trans. Comput. Soc. Syst. 2019, 6, 1295–1305. [Google Scholar] [CrossRef]
  39. Leng, J.; Ye, S.; Zhou, M.; Zhao, J.L.; Liu, Q.; Guo, W.; Cao, W.; Fu, L. Blockchain-secured smart manufacturing in industry 4.0: A survey. IEEE Trans. Syst. Man. Cybern. Syst. 2020, 51, 237–252. [Google Scholar] [CrossRef]
  40. Leng, J.; Ruan, G.; Jiang, P.; Xu, K.; Liu, Q.; Zhou, X.; Liu, C. Blockchain-empowered sustainable manufacturing and product lifecycle management in industry 4.0: A survey. Renew. Sustain. Energy Rev. 2020, 132, 110112. [Google Scholar] [CrossRef]
  41. Hameed, K.; Barika, M.; Garg, S.; Amin, M.B.; Kang, B. A taxonomy study on securing Blockchain-based Industrial applications: An overview, application perspectives, requirements, attacks, countermeasures, and open issues. J. Ind. Inf. Integr. 2022, 26, 100312. [Google Scholar] [CrossRef]
  42. Lu, Y. Blockchain and the related issues: A review of current research topics. J. Manag. Anal. 2018, 5, 231–255. [Google Scholar] [CrossRef]
  43. Rožman, N.; Corn, M.; Škulj, G.; Diaci, J.; Podržaj, P. Scalability Solutions in Blockchain-Supported Manufacturing: A Survey. Strojniški Vestn. J. Mech. Eng. 2022, 68, 585–609. [Google Scholar] [CrossRef]
  44. Li, M.; Fu, Y.; Chen, Q.; Qu, T. Blockchain-enabled digital twin collaboration platform for heterogeneous socialized manufacturing resource management. Int. J. Prod. Res. 2021, 1–21. [Google Scholar] [CrossRef]
  45. Zhang, F.; Wu, L.; Liu, W.; Ding, K.; Hui, J.; Leng, J.; Zhou, X. Evolutionary game-based incentive models for sustainable trust enhancement in a blockchained shared manufacturing network. Adv. Eng. Inform. 2022, 54, 101791. [Google Scholar] [CrossRef]
  46. Khan, D.; Jung, L.T.; Hashmani, M.A. Systematic literature review of challenges in blockchain scalability. Appl. Sci. 2021, 11, 9372. [Google Scholar] [CrossRef]
  47. Kagel, J.H.; Roth, A.E. The Handbook of Experimental Economics; Princeton University Press: Princeton, NJ, USA, 2020; Volume 2. [Google Scholar]
  48. Guala, F. The Methodology of Experimental Economics; Cambridge University Press: Cambridge, UK, 2005. [Google Scholar] [CrossRef]
  49. Horton, J.J.; Rand, D.G.; Zeckhauser, R.J. The online laboratory: Conducting experiments in a real labor market. Exp. Econ. 2011, 14, 399–425. [Google Scholar] [CrossRef] [Green Version]
  50. Smith, V.L. Experimental economics: Induced value theory. Am. Econ. Rev. 1976, 66, 274–279. [Google Scholar]
  51. Ueda, K.; Nishino, N.; Takenaka, T. Producer decision-making in markets with network externalities. CIRP Ann. 2009, 58, 413–416. [Google Scholar] [CrossRef]
  52. Nishino, N.; Ueda, K.; Sato, Y. Modeling of decision making in membership services as public goods problems. CIRP Ann. 2010, 59, 473–476. [Google Scholar] [CrossRef]
  53. Škulj, G.; Butala, P. Experimental study of work system networking in production environment. CIRP Ann. 2014, 63, 401–404. [Google Scholar] [CrossRef]
  54. Popper, K.R. The Open Society and Its Enemies; Princeton University Press: Princeton, NJ, USA, 2020; Volume 119. [Google Scholar] [CrossRef]
  55. Gao, J.; Yao, Y.; Zhu, V.C.; Sun, L.; Lin, L. Service-oriented manufacturing: A new product pattern and manufacturing paradigm. J. Intell. Manuf. 2011, 22, 435–446. [Google Scholar] [CrossRef]
  56. Aigner, D.J.; Chu, S.f. On estimating the industry production function. Am. Econ. Rev. 1968, 58, 826–839. [Google Scholar]
  57. Bentov, I.; Lee, C.; Mizrahi, A.; Rosenfeld, M. Proof of activity: Extending bitcoin’s proof of work via proof of stake. ACM Sigmetrics Perform. Eval. Rev. 2014, 42, 34–37. [Google Scholar] [CrossRef]
  58. Rožman, N.; Corn, M.; Škulj, G. Blockchain-Based Shared Manufacturing Game. Available online: https://github.com/fsprojekti/BBSMgame (accessed on 12 December 2022).
  59. Easley, D.; O’Hara, M.; Basu, S. From mining to markets: The evolution of bitcoin transaction fees. J. Financ. Econ. 2019, 134, 91–109. [Google Scholar] [CrossRef]
  60. Sunstein, C.R. Free Markets and Social Justice; Oxford University Press on Demand: Oxford, UK, 1997. [Google Scholar] [CrossRef]
  61. Zhu, X.; Shi, J.; Xie, F.; Song, R. Pricing strategy and system performance in a cloud-based manufacturing system built on blockchain technology. J. Intell. Manuf. 2020, 31, 1985–2002. [Google Scholar] [CrossRef]
Figure 1. Methodology employed for the analysis.
Applsci 13 04251 g001
Figure 2. Online game implementation of BBSM system.
Applsci 13 04251 g002
Figure 3. Flowchart of the player decision-making process.
Applsci 13 04251 g003
Figure 4. Transaction fee of confirmed transactions over time.
Applsci 13 04251 g004
Figure 5. Price of services over time.
Applsci 13 04251 g005
Figure 6. Number of service orders over time.
Applsci 13 04251 g006
Figure 7. Frequency of service provision over time.
Applsci 13 04251 g007
Figure 8. Strategy coefficient distributions: (a) coefficient of buying, (b) coefficient of setting price, (c) coefficient of setting price when market is empty, (d) coefficient of setting transaction fee.
Applsci 13 04251 g008
Figure 9. Strategy coefficient distribution.
Applsci 13 04251 g009
Figure 10. Flowchart of the transaction action decision-making process.
Applsci 13 04251 g010
Figure 11. Flowchart of the service action decision-making process.
Applsci 13 04251 g011
Figure 12. Comparison of transaction fee between experimental and simulation results.
Applsci 13 04251 g012
Figure 13. Comparison of service price between the experimental and simulation results.
Applsci 13 04251 g013
Figure 14. Comparison of amount of services on the market between the experimental and simulation results.
Applsci 13 04251 g014
Figure 15. Comparison of the frequency of service provision over time between the experimental and simulation results.
Applsci 13 04251 g015
Figure 16. Comparison of provided service frequencies over time for different frequencies of transaction confirmation.
Applsci 13 04251 g016
Figure 17. Minimum transaction fee in the game for different frequencies of transaction confirmation.
Applsci 13 04251 g017
Figure 18. Maximum price of provided services in the game for different frequencies of transaction confirmation.
Applsci 13 04251 g018
Figure 19. Time point to congestion in the game for different frequencies of transaction confirmation.
Applsci 13 04251 g019
Figure 20. Comparison of service provision frequencies over time between simulations with constant f B C and those with increased f B C .
Applsci 13 04251 g020
Table 1. Potential benefits of blockchain technology for manufacturing systems.
Blockchain Technology PropertyPotential Benefits for Manufacturing Systems
Decentralized consensus
  • Exerting control over or disabling a system by seizing the central authority is rendered unfeasible [5].
  • Interaction and information sharing during various phases of a manufacturing process without intermediaries [6].
  • A decision support system that is independent of location, resilient to faults, autonomous, and expandable [7].
Immutability of the records
  • Provides trusted and secure information to all participants in the manufacturing process [8,9].
  • Disputes can be resolved by reviewing the blockchain records [6].
Transparent database
  • Real-time transparency increases the profits of a manufacturing company and supports its capacity for market competition [10].
  • Transparency improves traceability and provenance while mitigating costs [8,11].
Self-executing environment
  • Smart contracts facilitate secure end-to-end business automation while maintaining operational excellence by removing the possibility of human mistakes [5,12].
  • Provides a collaboration mechanism for entities that do not trust each other to work together [13].
Table 2. Existing studies on blockchain-based shared manufacturing.
AuthorsProblematicsParametersMethodologyKey Findings
Yu et al. [3]Analysis of block generation efficiency in resource operation blockchainGas consumption and throughputSimulationA decrease in the number of transactions per service increases efficiency
Li et al. [44]Performance analysis of collaboration platformTransaction throughput and latencySimulationPerformance is satisfiable if a sufficient amount of blockchain nodes are present compared to the number of users in the system
Rožman et al. [2]Performance analysis of scalable platformCosts and time for serviceTheoretical calculations and experimental analysisScalability solutions reduce the costs and time reqiored for manufacturing service execution
Zhang et al. [45]User strategy analysis in BBSM systemsPayoffTheoretical approach and simulationsInstability occurs in the system if manufacturers do not participate in confirmation of transactions
Table 3. Examples of service exchange between three types of companies in the case of 3D printing.
ProviderMechanicalElectricalIT
Consumer
  Mechanical\Upgrade of
3D printer control
system capabilities
Upgrade of
3D printer
software and firmware
  ElectricalUpgrade of
PCB manufacturing
capabilities
\Upgrade of
electrical design and
simulation software
  ITUpgrade of
computational
hardware (mechanical)
Upgrade of
computational
hardware (electrical)
\
Table 4. Selected agent model setting parameters.
ParameterValue
t t r a n s a c t i o n A c t i o n M i n 40 s
t t r a n s a c t i o n A c t i o n M a x 80 s
t s e r v i c e A c t i o n M i n 30 s
t s e r v i c e A c t i o n M a x 40 s
t t r a n s a c t i o n P e n d i n g 600 s
w s t a k e (4 groups) 0.1 , 0.07 , 0.04 and 0.037
w u n s t a k e 0.5
w p r i c e 1.3
t o f f e r P e n d i n g 50 s
s t a k e m i n 0.02
s t a k e m a x 0.04
u n s t a k e m i n 0.18
u n s t a k e m a x 0.22
k f e e D e l e t e d 1.02
k f e e D e l e t e d E m p t y 0.99
k f e e N e w 0.95
k f e e N e w E m p t y 0.95
k f e e N e w D e l e t e d 1.05
k f e e N e w D e l e t e d E m p t y 0.95
k e x i s t O f f e r 0.965
k p r e v i o u s O f f e r 1.07
k e m p t y O f f e r 0.15
Disclaimer/Publisher’s Note: The statements, opinions and data contained in all publications are solely those of the individual author(s) and contributor(s) and not of MDPI and/or the editor(s). MDPI and/or the editor(s) disclaim responsibility for any injury to people or property resulting from any ideas, methods, instructions or products referred to in the content.

