Article

The Detection of Nitrogen Saturation for Real-Time Fertilization Management within a Grassland Ecosystem

Department of Geography, School of Agricultural, Earth and Environmental Sciences, University of KwaZulu-Natal, Pietermaritzburg 3209, South Africa
*
Author to whom correspondence should be addressed.
Appl. Sci. 2023, 13(7), 4252; https://doi.org/10.3390/app13074252
Submission received: 20 January 2023 / Revised: 26 February 2023 / Accepted: 23 March 2023 / Published: 27 March 2023

Abstract

:
Unfettered agricultural activities have severely degraded vast areas of grasslands over the last decade. To rehabilitate and restore the productivity in affected grasslands, rangeland management practices still institute vast nitrogen-based fertilization regimes. However, excessive fertilization can often have damaging environmental effects. Over-fertilization can lead to nitrogen saturation. Although early indicators of nitrogen saturation have been documented, research detailing the near-real-time nitrogen saturation status of grasslands is required to better facilitate management protocols and optimize biomass production within degraded grasslands. Hence, the aim of this study was to discriminate nitrogen-saturated tropical grasses grown under a diverse fertilization treatment trial, using Worldview-3 satellite imagery and decision tree techniques. To accomplish this, nitrogen-saturated plots were first identified through specific physiological-based criteria. Thereafter, Worldview-3 satellite imagery (400–1040 nm) and decision tree techniques were applied to discriminate between nitrogen-saturated and -unsaturated grassland plots. The results showed net nitrate (NO3-N) concentrations and net pH levels to be significantly different (α = 0.05) between saturated and non-saturated plots. Moreover, the random forest model (overall accuracy of 91%) demonstrated a greater ability to classify saturated plots as opposed to the classification and regression tree method (overall accuracy of 79%). The most important variables for classifying saturated plots were identified as: the Red-Edge (705–745 nm), Coastal (400–450 nm), Near-Infrared 3 (838–950 nm), Soil-Adjusted Vegetation Index (SAVI) and the Normalized Difference Vegetation Index 3 (NDVI3). These results provide a framework to assist rangeland managers in identifying grasslands within the initial stages of nitrogen saturation. This will enable fertilization treatments to be adjusted in near-real-time according to ecosystem demand and thereby maintain the health and longevity of Southern African grasslands.

1. Introduction

Grasslands are a major vegetation type that span across the Earth’s terrestrial surface [1]. These ecosystems are often dynamic and intricate environments that sustain a host of ecosystem goods and services [2], such as the grazing of livestock, the provision of traditional medicinal plants, the regulation of climate, and the purification of water [3,4]. In South Africa, the financial appraisal of the ecosystem goods and services provided by grasslands are in excess of ZAR 9 billion [5]. However, unsustainable anthropogenic activities (e.g., overgrazing and intensive agriculture) have caused severe degradation to these environments [6,7]. To rehabilitate degraded grasslands, as well as maintain the soil nutrient profile, nitrogen-based fertilization regimes are extensively implemented by grassland stakeholders [8,9]. Nitrogen is the primary constituent of chlorophyll and plant enzymes and is, thus, often the limiting factor of net primary productivity within terrestrial ecosystems [10,11,12,13,14]. As such, nitrogen regularly forms the basis of fertilizer compounds [13,15]. Subsequently, the use of nitrogen-based fertilizers has been proven to augment biomass productivity within previously degraded grasslands [9]. However, their excessive use can often have detrimental environmental consequences [13,14,16,17,18].
The nitrogen cycle is a delicately balanced and highly complex feedback system; however, the continued introduction of anthropogenic nitrogen has adversely altered its natural state [19,20]. Several studies have emphasised the detrimental impacts associated with excess anthropogenic nitrogen application [18,21,22,23]. These impacts are often preluded by increases in both foliar nitrogen and soil nitrate concentrations [24,25]. Thereafter, unregulated anthropogenic nitrogen deposition results in the available nitrogen pool exceeding the demand of both plants and microbes, causing the ecosystem to reach a state of nitrogen saturation [16,24,25]. This may cause stunted growth, increased mortality, and a reduction in overall species diversity [20,26]. The culmination of these effects along with the lack of proper grassland management practises such as overgrazing [27], could greatly alter many sensitive ecosystems [24,25,28].
The factors, processes and effects concerning nitrogen saturation have been extensively studied for a variety of ecosystems, including grasslands [13,16,28,29,30,31]. Fundamentally, unregulated nitrogen enrichment significantly alters the soil physiochemical environment [18,28]. This results in nitrate (NO3-N) and ammonium (NH4+-N) supplies exceeding both plant and microbial demand [29]. Thereafter, the process of nitrification occurs, as excess ammonium is converted into nitrate [32]. The ensuing high nitrate concentrations coupled with climatic factors (i.e., rainfall) cause negatively charged NO3 cations to leach [30]. This in turn causes the soil to acidify as pH levels decrease [33]. Subsequently, both soil acidification and the accumulation of negatively charged NO3 cations result in the attraction and leaching of positively charged calcium (Ca2+) and magnesium (Mg2+) anions into ground water [13,16,34]. As such, characterising the initial stages of nitrogen saturation is crucial in preventing the negative consequences associated with over-fertilization. Aber et al. [16], in their study of nitrogen saturation in northern forest ecosystems, documented several initial indicators of nitrogen saturation. These indicators included elevated concentrations of soil nitrate, increased soil acidity, and the increased leaching of minerals [16]. In this context, research documenting the present nitrogen status of grasslands, as well as early indicators of nitrogen saturation in near-real-time are required to facilitate management protocols and optimize biomass production within degraded grasslands, whilst avoiding any possible adverse effects [13].
The use of traditional laboratory-based methods for measuring both plant (such as the Kjeldahl digestion method) and soil nitrogen concentrations (both soil inorganic nitrogen content and soil fertility tests) are often complex, expensive and impractical over large swaths [10,28,35,36]. Nevertheless, the use of remotely sensed data provides a more feasible solution in characterising the nitrogen saturation status of tropical grasslands [7]. The ability of remote sensing technology to assess foliar biochemical concentrations, such as nitrogen and chlorophyll, have been widely researched within the remote sensing academic community [10,28,37,38,39,40,41]. Hyperspectral remote sensing, which utilizes many narrow contiguous spectral bands, has been widely utilized to assess the nutritional status of vegetation [7,39,42,43,44]. However, its practical application has often been restricted by its excessive costs, high degree of multicollinearity and related processing, and its unavailability within developing regions [45,46].
Nonetheless, the current generation of multispectral sensors, such as Worldview-3, which have improved spectral and spatial configurations, could provide a more practical alternative [45,46,47]. As such, research documenting the ability of multispectral sensors in assessing vegetative nutrient condition has grown in recent years [44,47,48,49]. For instance, Boegh et al. [50] used airborne multispectral data (457.8–778.8 nm) to effectively quantify Leaf Area Index (R2 = 0.77) and nitrogen concentrations (R2 = 0.78) within an agricultural area in Denmark, whilst in a later study, Ramoelo et al. [51] utilized the RapidEye sensor (440–850 nm) to map foliar (R2 = 0.48) and canopy (R2 = 0.64) nitrogen at a regional scale within a savanna rangeland. In a following study, Ramoelo et al. [47] applied Worldview-2 imagery (400–1040 nm) and Random Forest (RF) techniques to successfully map leaf nitrogen (R2 = 0.81) and aboveground biomass (R2 = 0.90) within a South African rangeland. To improve nutrient model estimates and to handle the complex relationships between response and predictor variables, Ramoelo et al. [47] and other studies often employed machine learning models, such as RF [52,53]. For example, both Adjorlolo et al. [54] and Mutanga et al. [55] used RF and Worldview-2 data to successfully estimate grassland nutrients within the Drakensburg mountain range of South Africa, whilst in a more recent study, Singh et al. [49] applied RapidEye imagery (440–850 nm) and RF techniques to map key grassland nutrients (i.e., neutral detergent fibre, acid detergent fibre, and lignin) within KwaZulu-Natal, South Africa. Meanwhile, in the Tibetan region of China, Gao et al. [56] used a multi-factor machine learning algorithm to model Alpine grassland forage quality (R2 = 0.67). Thereafter, in a related study, Gao et al. [57] used Sentinel-2 imagery and an RF algorithm to map forage nitrogen and phosphorus ratios within the same grassland ecosystem. Despite such contributions towards this research domain, to our understanding, no study has attempted to characterize nutrient saturation levels within tropical grasslands and its impact on plant growth using remotely sensed data.
In consideration of this, this study aims to characterize tropical grassland plots under the initial stages of nitrogen saturation using high resolution multispectral imagery and decision tree techniques. It is hypothesized that the use of high-resolution multispectral imagery and decision tree techniques can accurately detect nitrogen saturation in tropical grasslands plots subjected to diverse fertilization treatments. To accomplish this objective, the study firstly differentiated nitrogen-saturated plots using specific physiological criteria identified by Aber et al. [16]. Thereafter, 8-band Worldview-3 satellite imagery (400–1040 nm) and decision tree techniques were used to discriminate between nitrogen-saturated and -unsaturated grassland plots and assess their influence on plant growth.

2. Materials and Methods
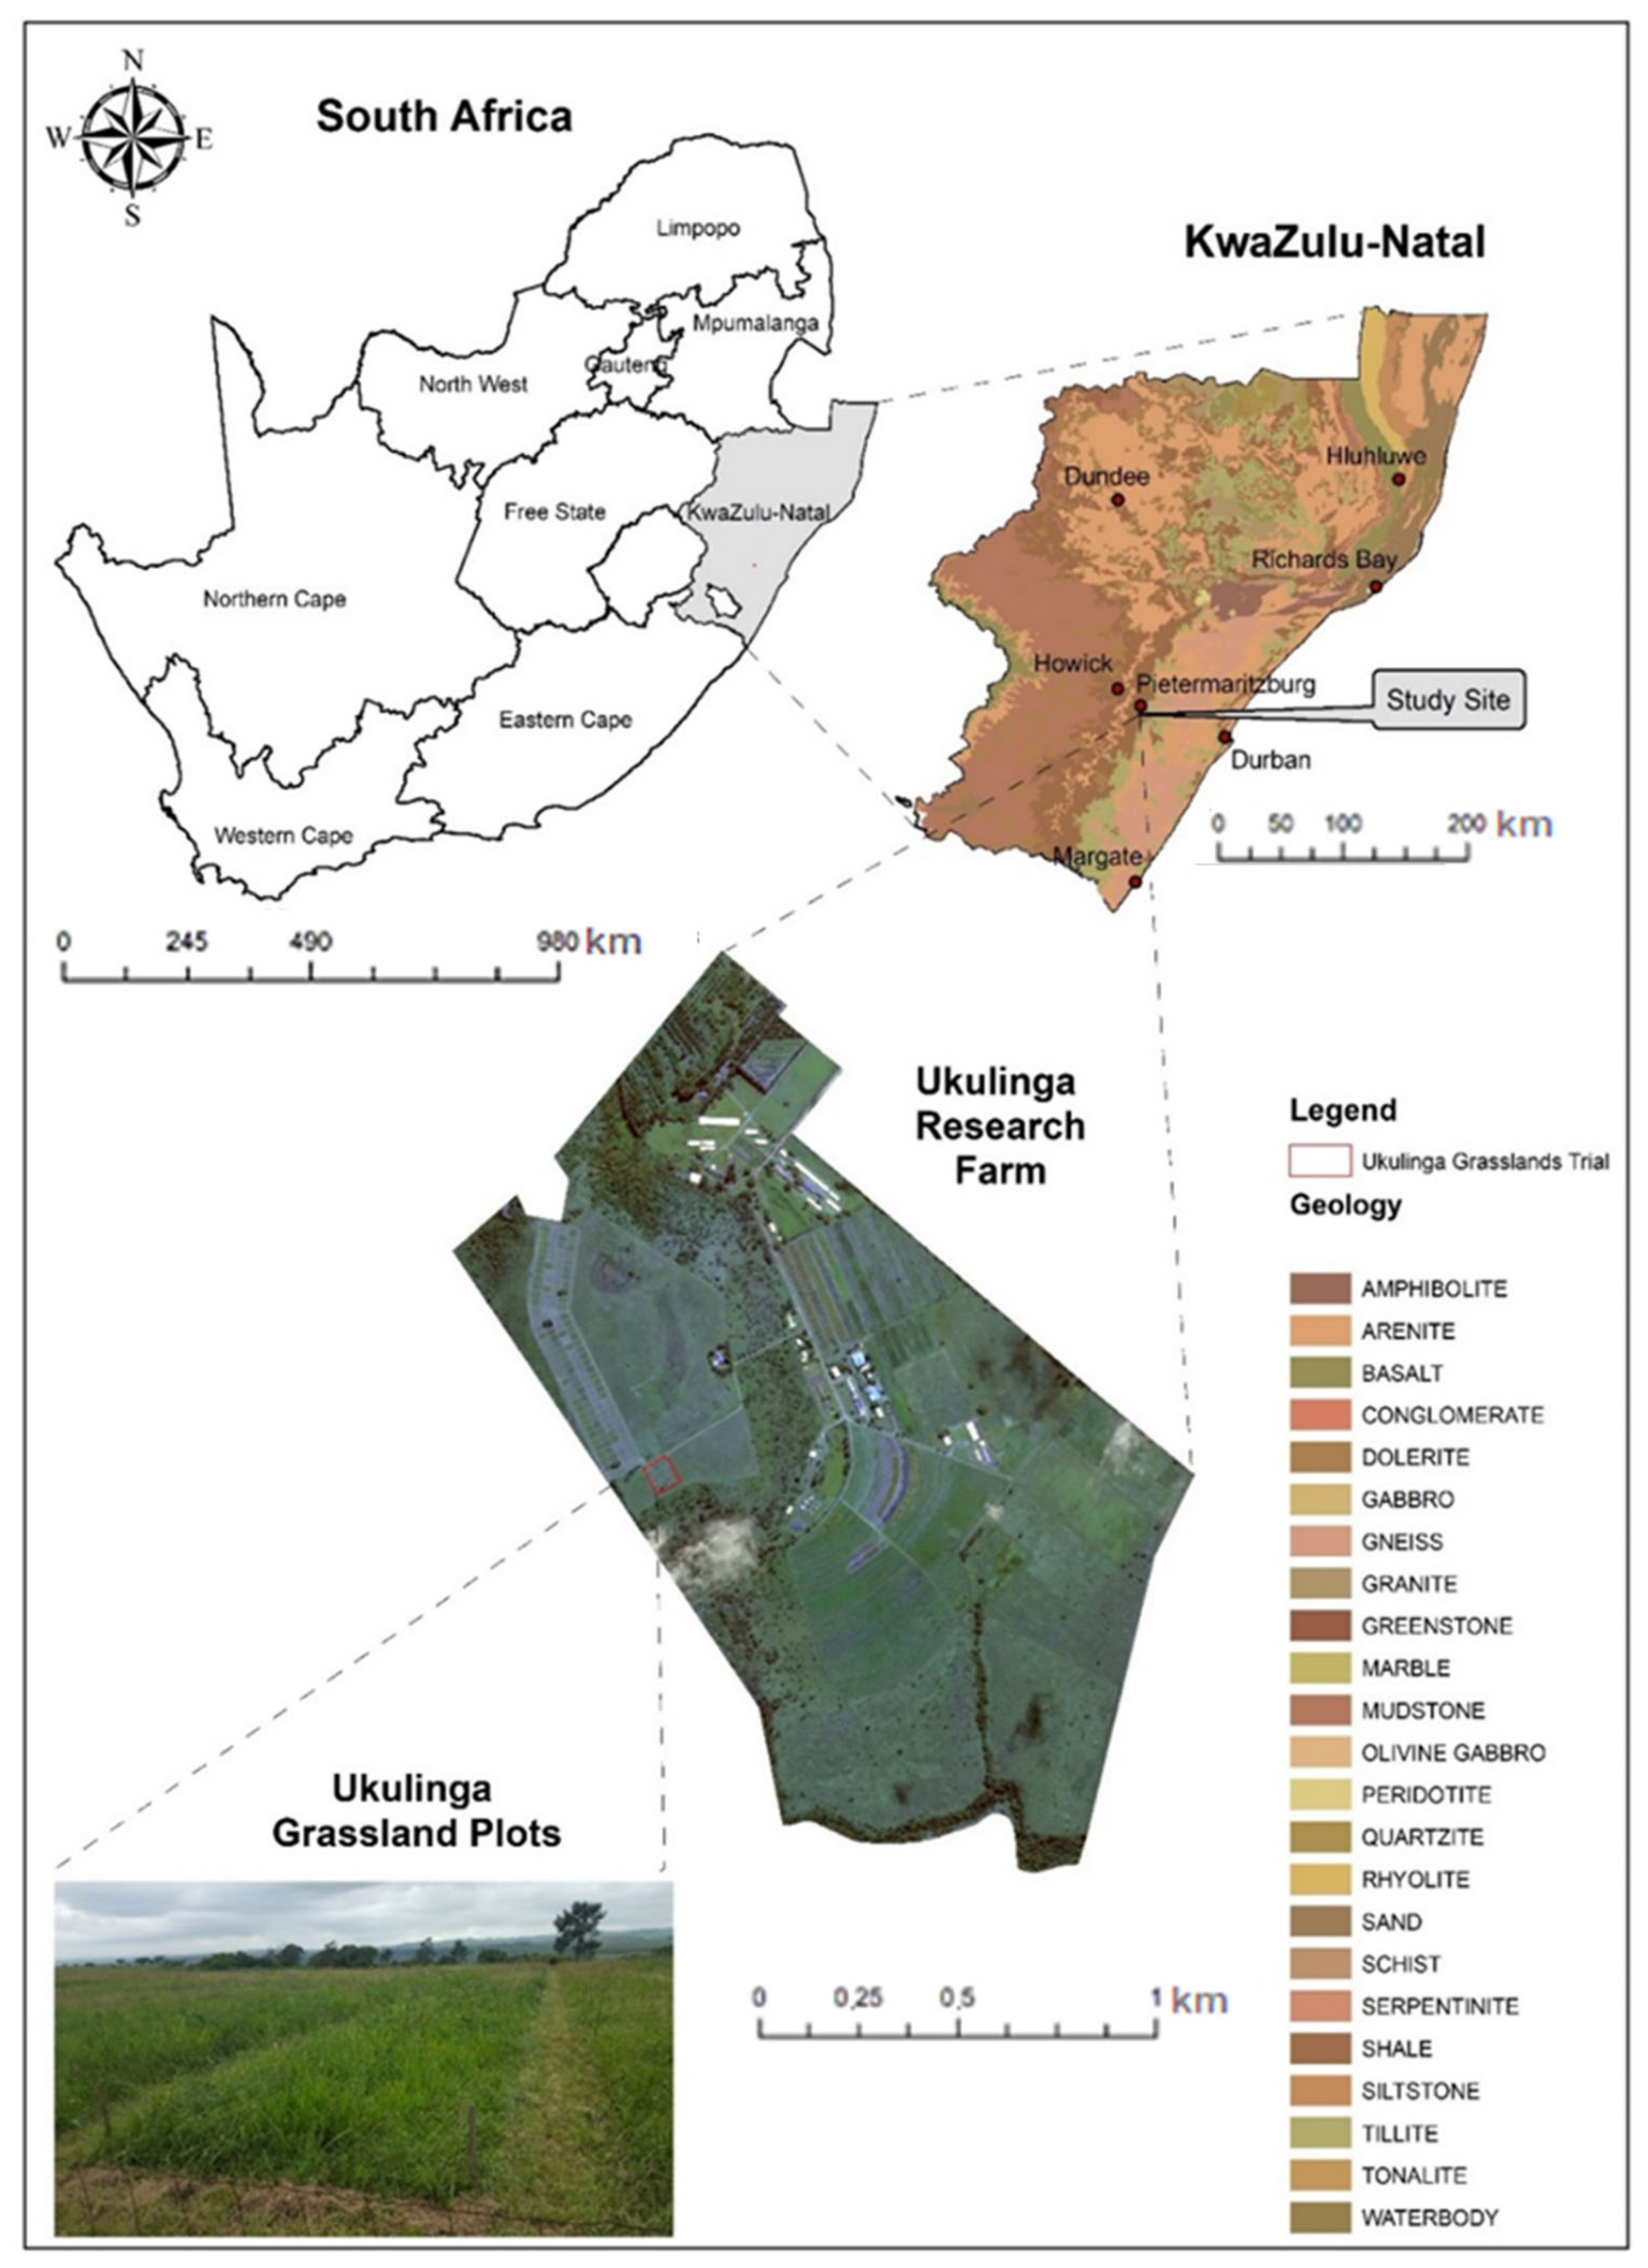
2.1. Study Area

The study took place within the Ukulinga Research Farm (29°39′45.68′′ S; 30°24′17.93′′ E) in KwaZulu-Natal, South Africa (Figure 1). The farm houses a long-term grassland fertilization trial that was established by J.D Scott in 1950 [58]. The underlying geology of the site comprises mainly of Shale rock, upon which, infertile Westleigh form soils are found [59]. Several grass species, namely, Themeda triandra (Red grass), Heteropogon contortus (Black speargrass), Eragrostis plana (Cane grass), Panicum maximum (Guinea grass), Setaria nigrirostris (Black-seed bristle grass), and Tristachya leucothrix (Trident grass) are found along the site [58,59]. The site itself experiences the majority of its annual rainfall (694 mm) during the grass-growing season of October to April [46].

2.2. Experimental Design

Seventy eight 3 m × 3 m grassland plots were arranged in a randomized block design [28,46] and treated with distinct levels of ammonium nitrate (NH4NO3) and ammonium sulphate ((NH4)2SO4) fertilizers [59]. These fertilizers were applied twice yearly at variable concentrations. More specifically, ammonium nitrate (NH4NO3) was applied at 21.0 g/m2, 42.1 g/m2, and 63.2 g/m2, and the ammonium sulphate ((NH4)2SO4) was applied at 33.6 g/m2, 67.2 g/m2, and 100.8 g/m2. This enabled plots to experience nitrogen concentrations that ranged from 0% (control) to 80%, which would effectively induce nitrogen saturation within the highly fertilized grassland plots [28]. Moreover, to ensure nitrogen was the primary limiting factor, phosphate, lime, and potassium chloride were applied. The super phosphate was applied at 33.6 g/m2 per year and the dolomitic lime was applied at 225 g/m2 at five-year intervals, whilst the potassium chloride was applied twice at 13.9 g/m2. Fertilization took place in October 2016 (prior to seed germination) and again in December 2016 (during the boot growth stage).

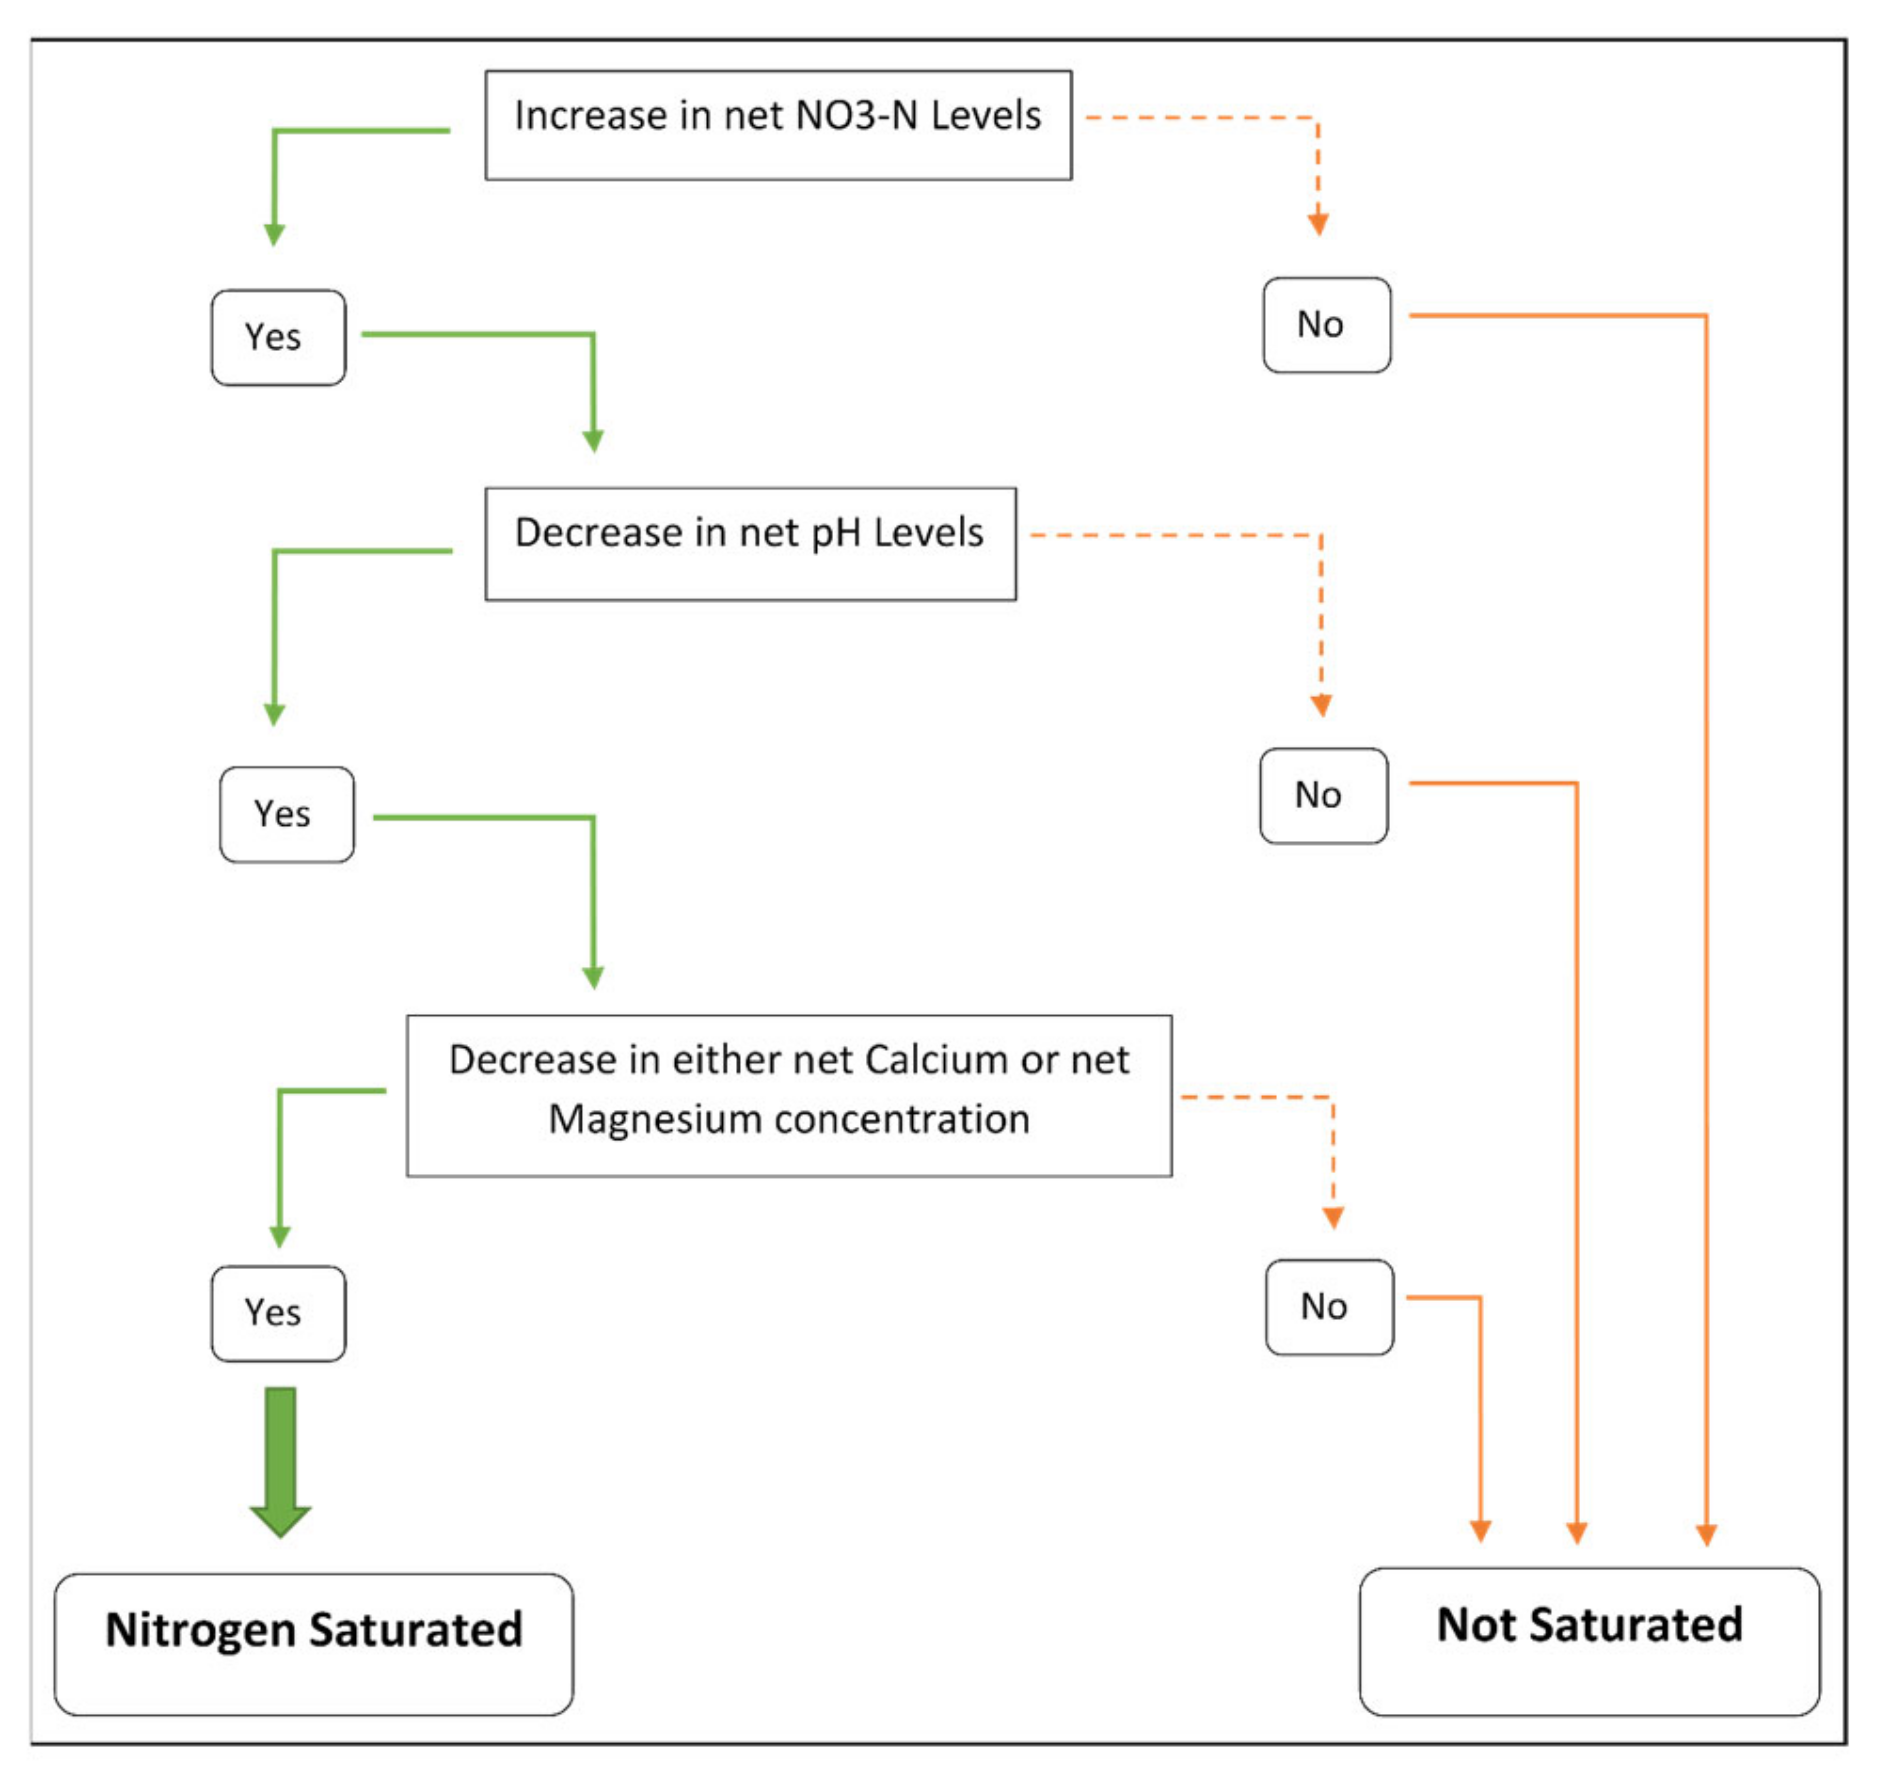
2.3. Characterization of Saturated Nitrogen Plots

Several studies have shown that nitrogen availability can be categorized into distinct stages of ecosystem response [16,60,61]. The first stage is documented as the ‘pre-treatment stage’, prior to any fertilization. Thereafter, the second stage of ‘nitrogen loading’ is characterised by increased nitrogen deposition, during which, ecosystem production responds positively to increased fertilization. Later, the third stage of ‘early nitrogen saturation’ is realised, as the ecosystem approaches initial nitrogen saturation; however, the associated negative effects are often subtle. Aber et al. [16] documented several early indicators of nitrogen saturation. These include (1) elevated soil nitrate concentrations, (2) increased soil acidity, and (3) increased mineral cation leaching. The last stage—Stage 4—is documented as ‘late nitrogen saturation’, where significant levels of nitrogen saturation cause major ecosystem impacts. This considerably affects plant growth and species composition [16]. As such, detecting nitrogen saturation timeously within grasslands is crucial in maintaining optimal grassland health and longevity. Subsequently, this study explored stages 1 (pre-treatment) and 3 (early nitrogen saturation) to characterize grassland plots, which exhibited the initial signs of possible nitrogen saturation. Thus, a specific set of physiological criteria was used to characterize plots within the initial stages of nitrogen saturation. These criteria were centred around the early indicators of nitrogen saturation documented by Aber et al. [16]. More precisely, grassland plots had to fulfil the entire set of physiological-based criteria to be considered nitrogen-saturated (Figure 2). In this regard, plots had to demonstrate a notable increase in nitrate (NO3-N) levels, a reduction in pH levels, and a reduction in either calcium and magnesium levels between stages 1 and 3. The resultant net changes for each of these variables across the growing season were calculated as the difference between stage 3 and stage 1. The nitrogen enrichment factor, which details the difference in nitrogen abundance between the substrate (i.e., soil nitrogen) and the product (i.e., foliar nitrogen) was also calculated using the equation below (Equation (1)) [62].
N i t r o g e n   E n r i c h m e n t   F a c t o r = N L e a f N S o i l

2.4. Field Data Collection

Sampling was first conducted prior to fertilization in October 2016 (Stage 1), and again in April 2017 (Stage 3). A 1 m × 1 m quadrant was randomly placed within each plot and used to collect soil cores [28]. Soil samples were collected at two particular depths. Specifically, soil samples were collected at 0–10 cm for inorganic nitrogen content and at 10–20 cm for soil fertility (n = 78). Samples were stowed in separate sealed plastic bags and taken to the Cedara Agricultural College for specific testing [63]. Nitrate (NO3-N) and ammonium (NH4+-N) concentrations were determined using the ultraviolet spectrophotometric screening method and measured as mg/L [28,33]. Soil pH was determined through a glass electrode and a 1:2.5 mixed solution of soil and deionized water [28,33]. Next, calcium (Ca2+) and magnesium (Mg2+) concentrations were extracted with a 0.1 mol/L solution of barium chloride and deionized water [13]. Lastly, soil organic carbon was derived through an oxidization method detailed in Zhang et al. [13]. Grass samples were collected during the boot (December 2016) and maturity stages (April 2017) of the phenological cycle from each of the 78 plots and stored in plastic bags. Samples were subsequently dried, milled and analysed for plant nitrogen concentration at the Cedara Agricultural College laboratory using the Kjeldahl digestion method [35]. To derive Aboveground Biomass (AGB), wet grass samples were collected at peak grass growth. These samples were dried for 48 h at 70 °C, prior to being reweighed. These readings were then transformed to obtain dry total AGB for each plot in kilograms per plot (kg/plot) [45].

2.5. Image Pre-Processing

A Worldview-3 image (400–1040 nm) was attained within one week of field sampling (2 May 2017) under favourable weather conditions from the supplier, Swift Geospatial. The spectral range of the 2 m 8-band Worldview-3 image is detailed in Table 1. Swift Geospatial provided the image both orthorectified and atmospherically corrected. The image was firstly atmospherically corrected using both the Shuttle Radar Topography Mission (SRTM) 30 m radar data and the ENVI remote sensing software package [64]. It was then orthorectified to a ± 3 m CE90 relative accuracy. Following this, the resultant image and GPS readings were used to ascertain the overall image accuracy of 89% and facilitate the formation of a map detailing the specific grassland plot boundaries (n = 78). Thereafter, using both the zonal statistics tool in ArcGIS 10 and the grassland’s plot map, the average spectral information from each grassland plot was extracted and to be used for statistical analysis [65].

2.6. Vegetation Indices

To improve the characterization of nitrogen-saturated grassland plots, numerous vegetation indices were developed from the spectral profile of the Worldview-3 image. These indices included the: Normalized Difference Vegetation Index (NDVI), Simple Ratio (SR), Enhanced Vegetation Index (EVI), Soil-Adjusted Vegetation Index (SAVI), and the Green Difference Vegetation Index (GDVI) [47,66,67,68]. However, due to the spectral arrangement of the Worldview-3 image, these vegetation indices had to be computed for several near-infrared variations, namely, Near-Infrared 1 (NIR1), Near-Infrared 2 (NIR2) and a combination of the two (hereafter referred to as NIR3). This resulted in a total of 24 spectral variables, including 15 vegetation indices and 9 spectral wavebands. Thereafter, both spectral wavebands and vegetation indices (n = 24) were input into the RF classification algorithm to distinguish between nitrogen-saturated and -unsaturated grassland plots. The datasets were split into 70% training and 30% testing data [69]. Next, the performance of the RF classification algorithm in characterizing nitrogen saturation was evaluated. For comparative purposes, a Classification and Regression Tree (CART) algorithm was implemented together with RF using the R statistical software package [70].

2.7. Statistical Data Analyses

A Shapiro–Wilk test was first conducted to ascertain that all data did not significantly deviate from the normal distribution curve (α = 0.05) [71]. A Student’s t-test was then used to ascertain if any significant differences were noted between the saturated and non-saturated plots, for each of the physiological-based criteria and associated site factors [13].

2.7.1. Classification and Regression Tree Analysis

The Classification and Regression Tree analysis, commonly referred to as CART, is a binary discriminatory procedure with the ability to process both categorical and continuous variables as target and predictor variables [72,73]. The analysis utilizes a binary recursive partitioning method, where each node within the decision tree is repeatedly divided into two groups—either nitrogen-saturated or non-nitrogen-saturated [72,73]. Thereafter, the trees are grown to their maximum size [73,74]. The strength of the CART analysis lies in its non-parametric nature and its ability to disregard the assumed distribution of the predictor variable values [72,74]. Moreover, this method is further bolstered by its automatic class balancing and missing value interpretation ability [72,73]. However, in recent years, the RF algorithm, and its ability to contend with both highly correlated and noisy predictor variables, has been extensively utilized by the remote sensing community [47,69,75,76].

2.7.2. Random Forest Classification Analysis

Similar to CART, the RF algorithm is an ensemble-based method which develops multiple decision trees to complete classification-based tasks as opposed to a single decision tree [69,75,77]. The algorithm utilizes a deterministic technique to select recursive bootstrapped samples that are drawn with replacements [77]. These samples are then used to build each tree within the decision tree matrix, which is then grown to a user-defined node size [68,69]. Thereafter, the amount of decision trees (ntree) and the total number of predictor variables (mtry) to be used were defined. The mtry values were derived by the amount of the square root of the total number of predictor variables (spectral variables) used, whilst ntree was set to 1000 [47,78]. Next, both ntree and mtry values were optimised to improve model accuracy, and the resultant classification model was run 100 times [68]. Lastly, the samples not included in the bootstrapped samples or the Out Of Bag (OOB) data were used to estimate the importance of the predictor variables [53,78]. The most important variables for characterising nitrogen-saturated and -unsaturated grassland plots were then derived through a backwards feature elimination method [53,78]. To avoid over-fitting the data, a 10-fold cross validation approach was applied [68].

2.7.3. Accuracy Assessment

In recent years, the use of the Kappa statistic within classification accuracy assessment has been critiqued due to its provision of often misleading information [79]. Moreover, Kappa can be challenging to calculate and interpret [80,81]. To this end, Pontius Jr. and Millones [79] proposed the use of quantity disagreement and allocation disagreement as summary parameters of classification accuracy. Essentially, quantity disagreement is the total number of mismatches obtained between the training and testing data for each category [79]. Allocation disagreement is the summation of mismatches attained between the column total of each category and its corresponding row total within the confusion matrix [79]. To compare the ability of each of the two classification algorithms in categorising nitrogen-saturated and -unsaturated grassland plots, a confusion matrix was developed for each model. Following this, user, producer and overall accuracy were derived. Moreover, the quantity disagreement and allocation disagreement for each algorithm were derived using XLSTAT [79,80,81].

3. Results

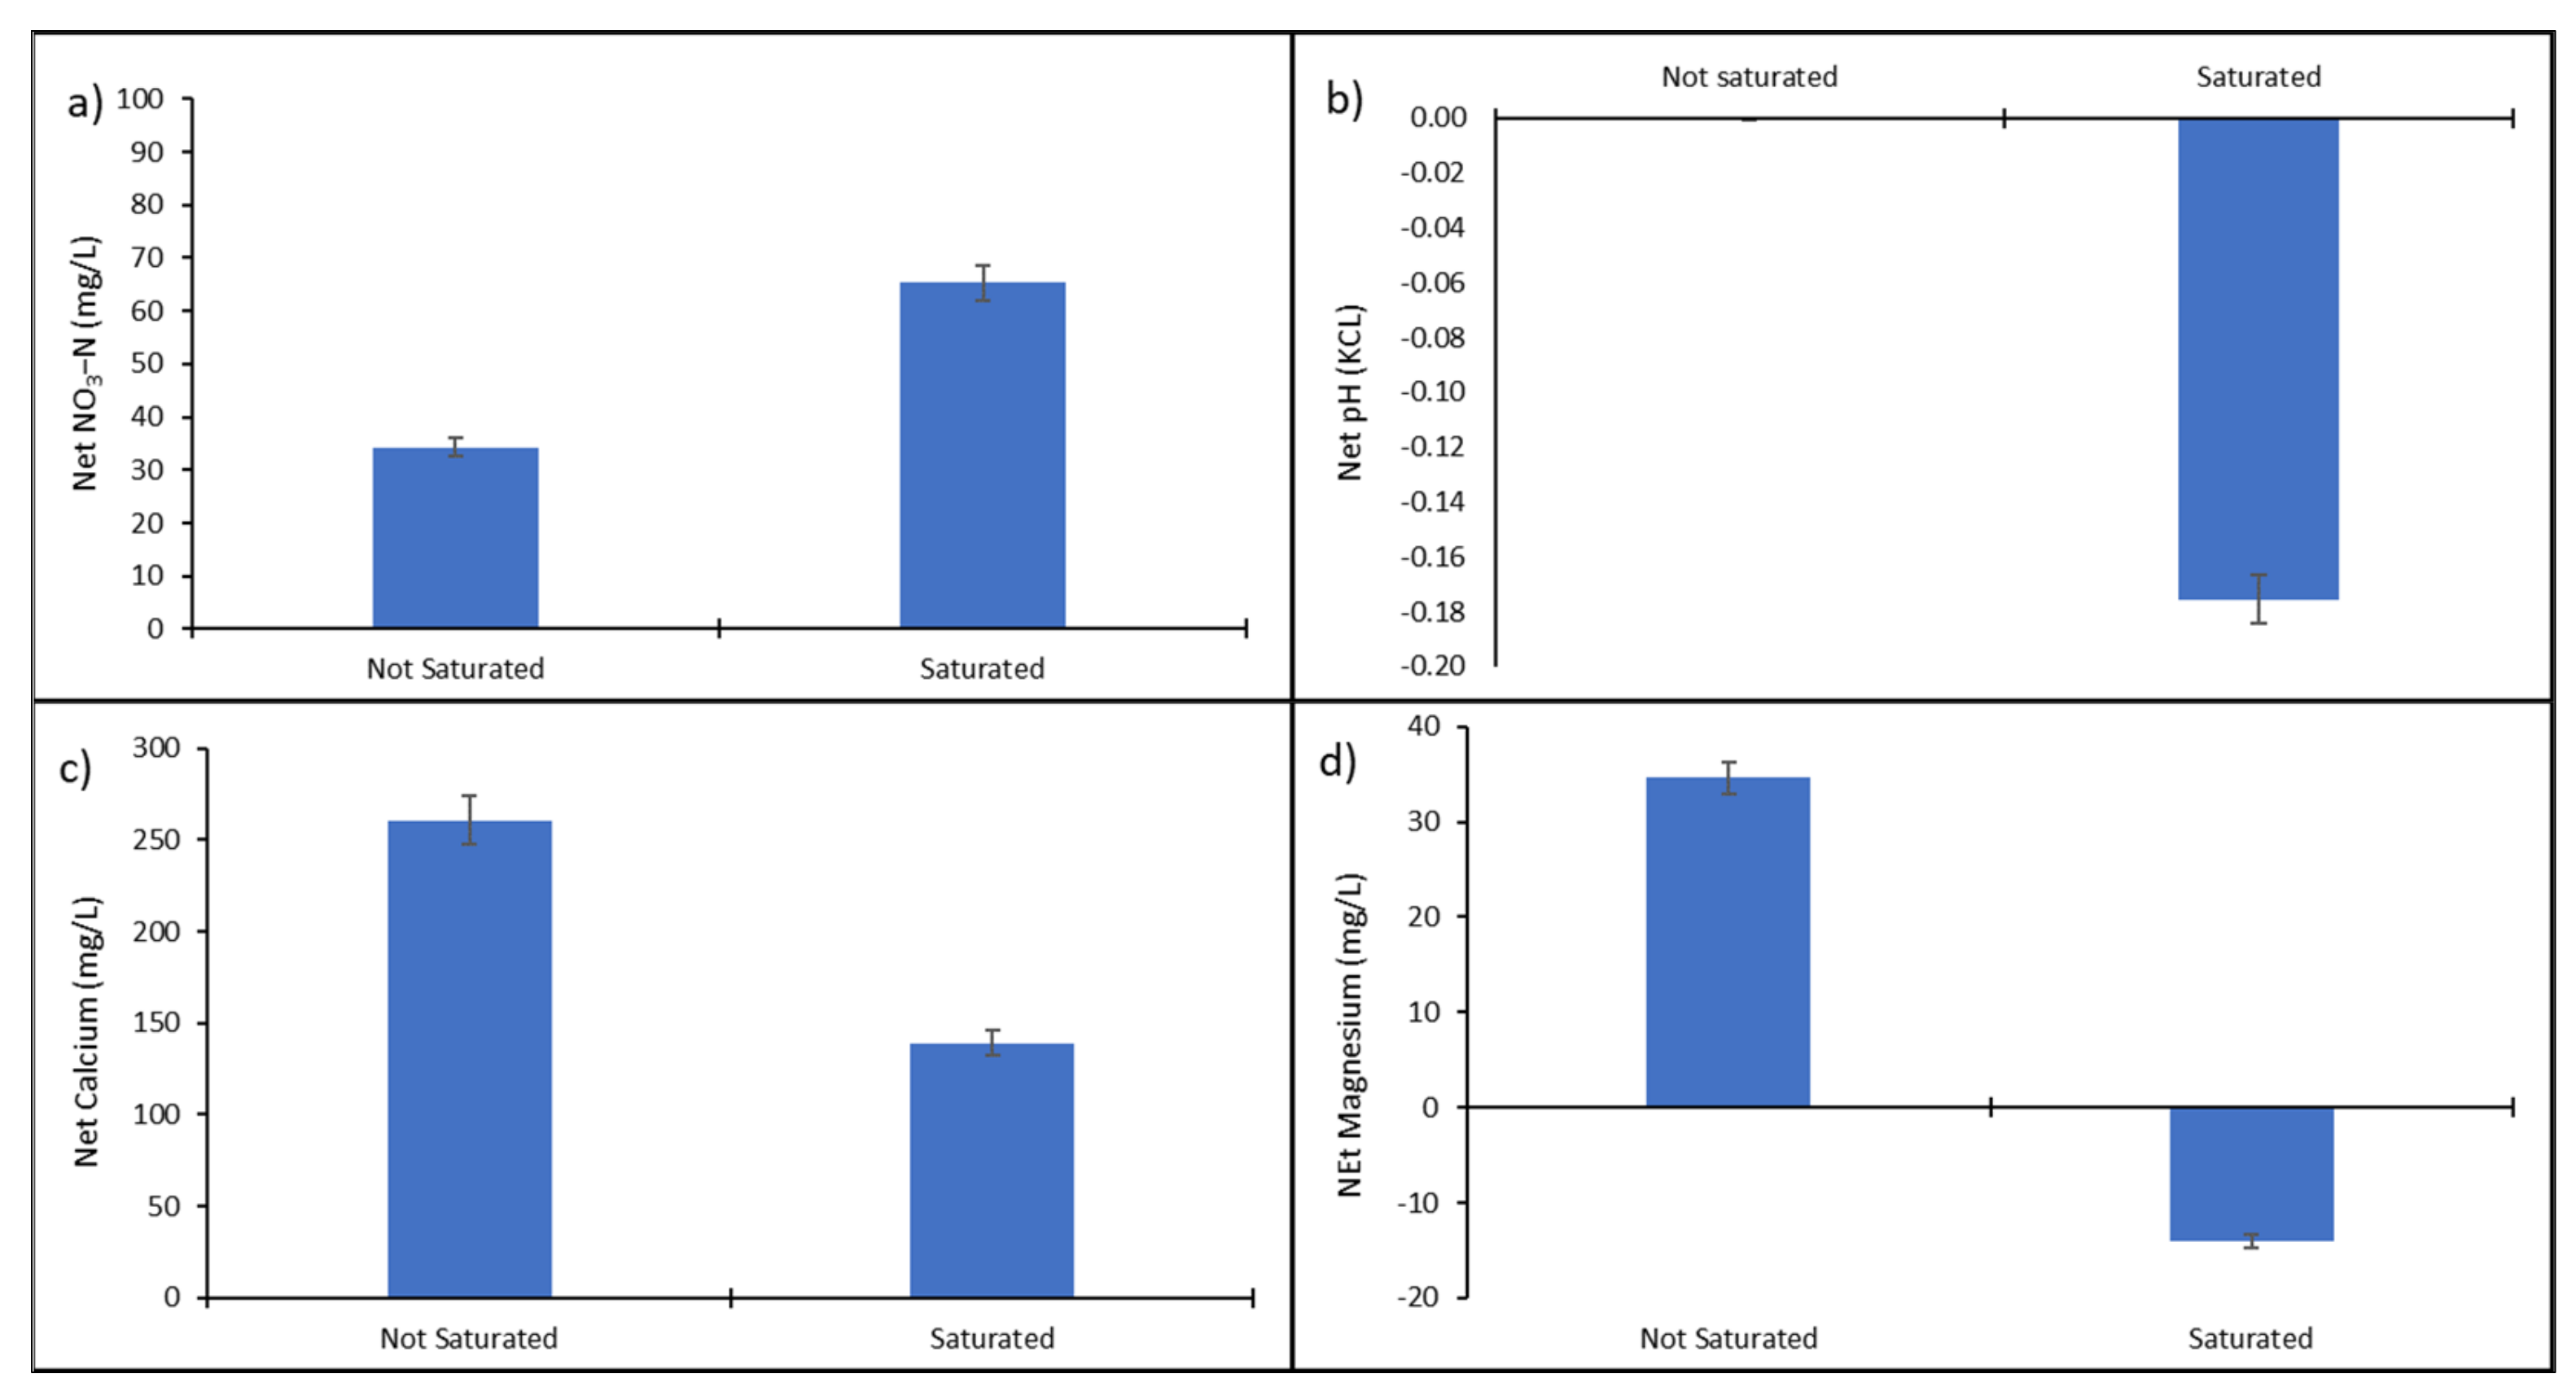
3.1. The Characterization of Nitrogen-Saturated and -Unsaturated Plots Using Physiological Properties

From the 78 grassland plots investigated between stages 1 and 3, 16 plots fulfilled the physiological saturation criteria and were considered nitrogen-saturated. Specific statistical testing then revealed significant differences (α = 0.05) between saturated and unsaturated plots for both net nitrate (NO3-N) concentrations and net pH levels (Figure 3a,b). More specifically, net NO3-N concentrations were shown to be substantially higher for nitrogen-saturated plots (65.28 mg/L), as opposed to plots that were not saturated (34.23 mg/L) (Figure 3a), whereas net pH levels were significantly lower for saturated plots (−0.175 KCL) as compared to non-saturated plots (−0.0001 KCL) (Figure 3b). In addition, both net calcium and net magnesium concentrations were noticeably lower for saturated plots (Figure 3c,d). More precisely, net calcium concentrations declined from 260 mg/L for unsaturated plots to 138 mg/L for saturated plots (Figure 3c), while net magnesium concentrations decreased from 35 mg/L for non-saturated plots, to −14.06 mg/L for saturated plots (Figure 3d).
From the associated site factors investigated, net ammonium (NH4+-N) levels were shown to decrease from 8.87 mg/L for non-saturated plots to −1.2 mg/L for saturated plots (Figure 4a). Net foliar nitrogen concentrations, however, were found to be higher for saturated grassland plots (0.36%) as compared to non-saturated plots (0.19%) (Figure 4c). Both biomass and soil organic carbon concentrations demonstrated negligible changes between saturated and non-saturated plots (Figure 4b,e). Unsaturated plots demonstrated a mean biomass yield of 0.92 kg/m2, whilst saturated plots recorded a biomass mean of 0.95 kg/m2 (Figure 4e). Soil organic carbon showed an insignificant change, with concentrations declining from −2.89% for saturated plots to −2.90% for non-saturated plots. Subsequent testing discovered net total soil nitrogen concentrations to be higher for saturated plots (Figure 4d). Lastly, computation of the nitrogen enrichment factor demonstrated a higher nitrogen enrichment factor of 0.37% for saturated grassland plots as opposed to 0.22% for non-saturated plots (Figure 4f). Moreover, significant positive linear correlations (α = 0.01) were documented between net calcium, magnesium, and pH levels.

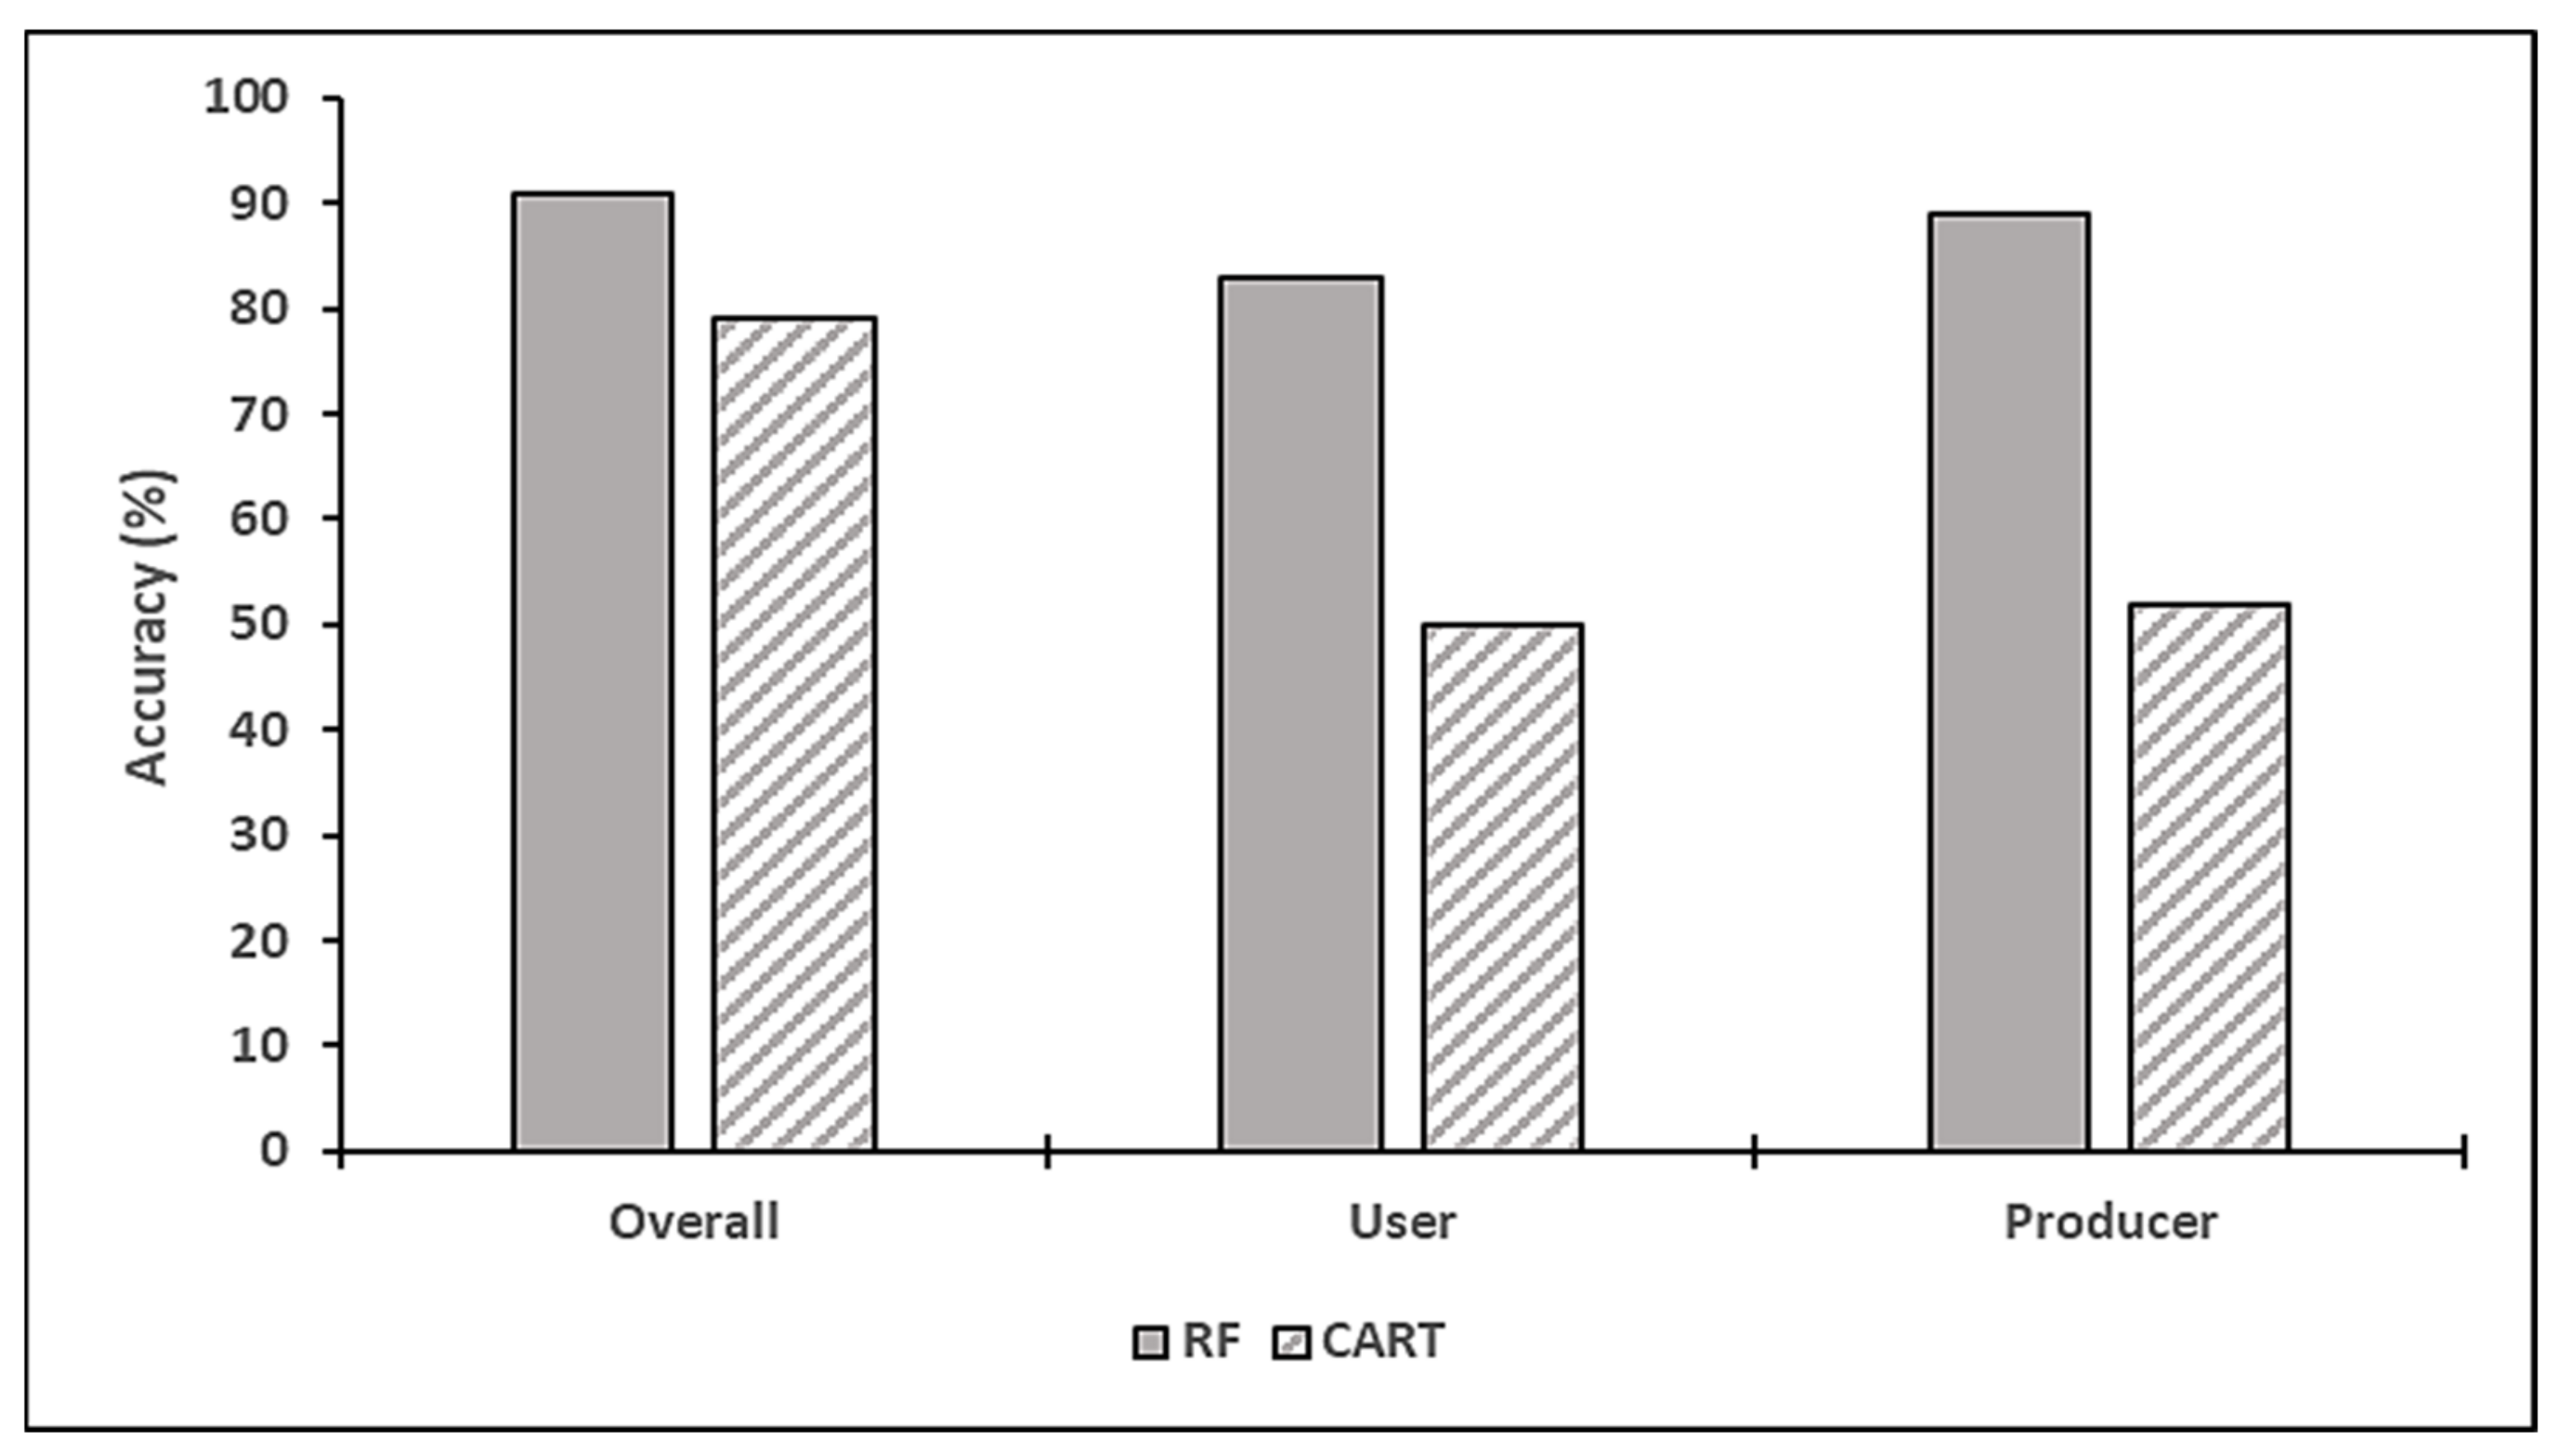
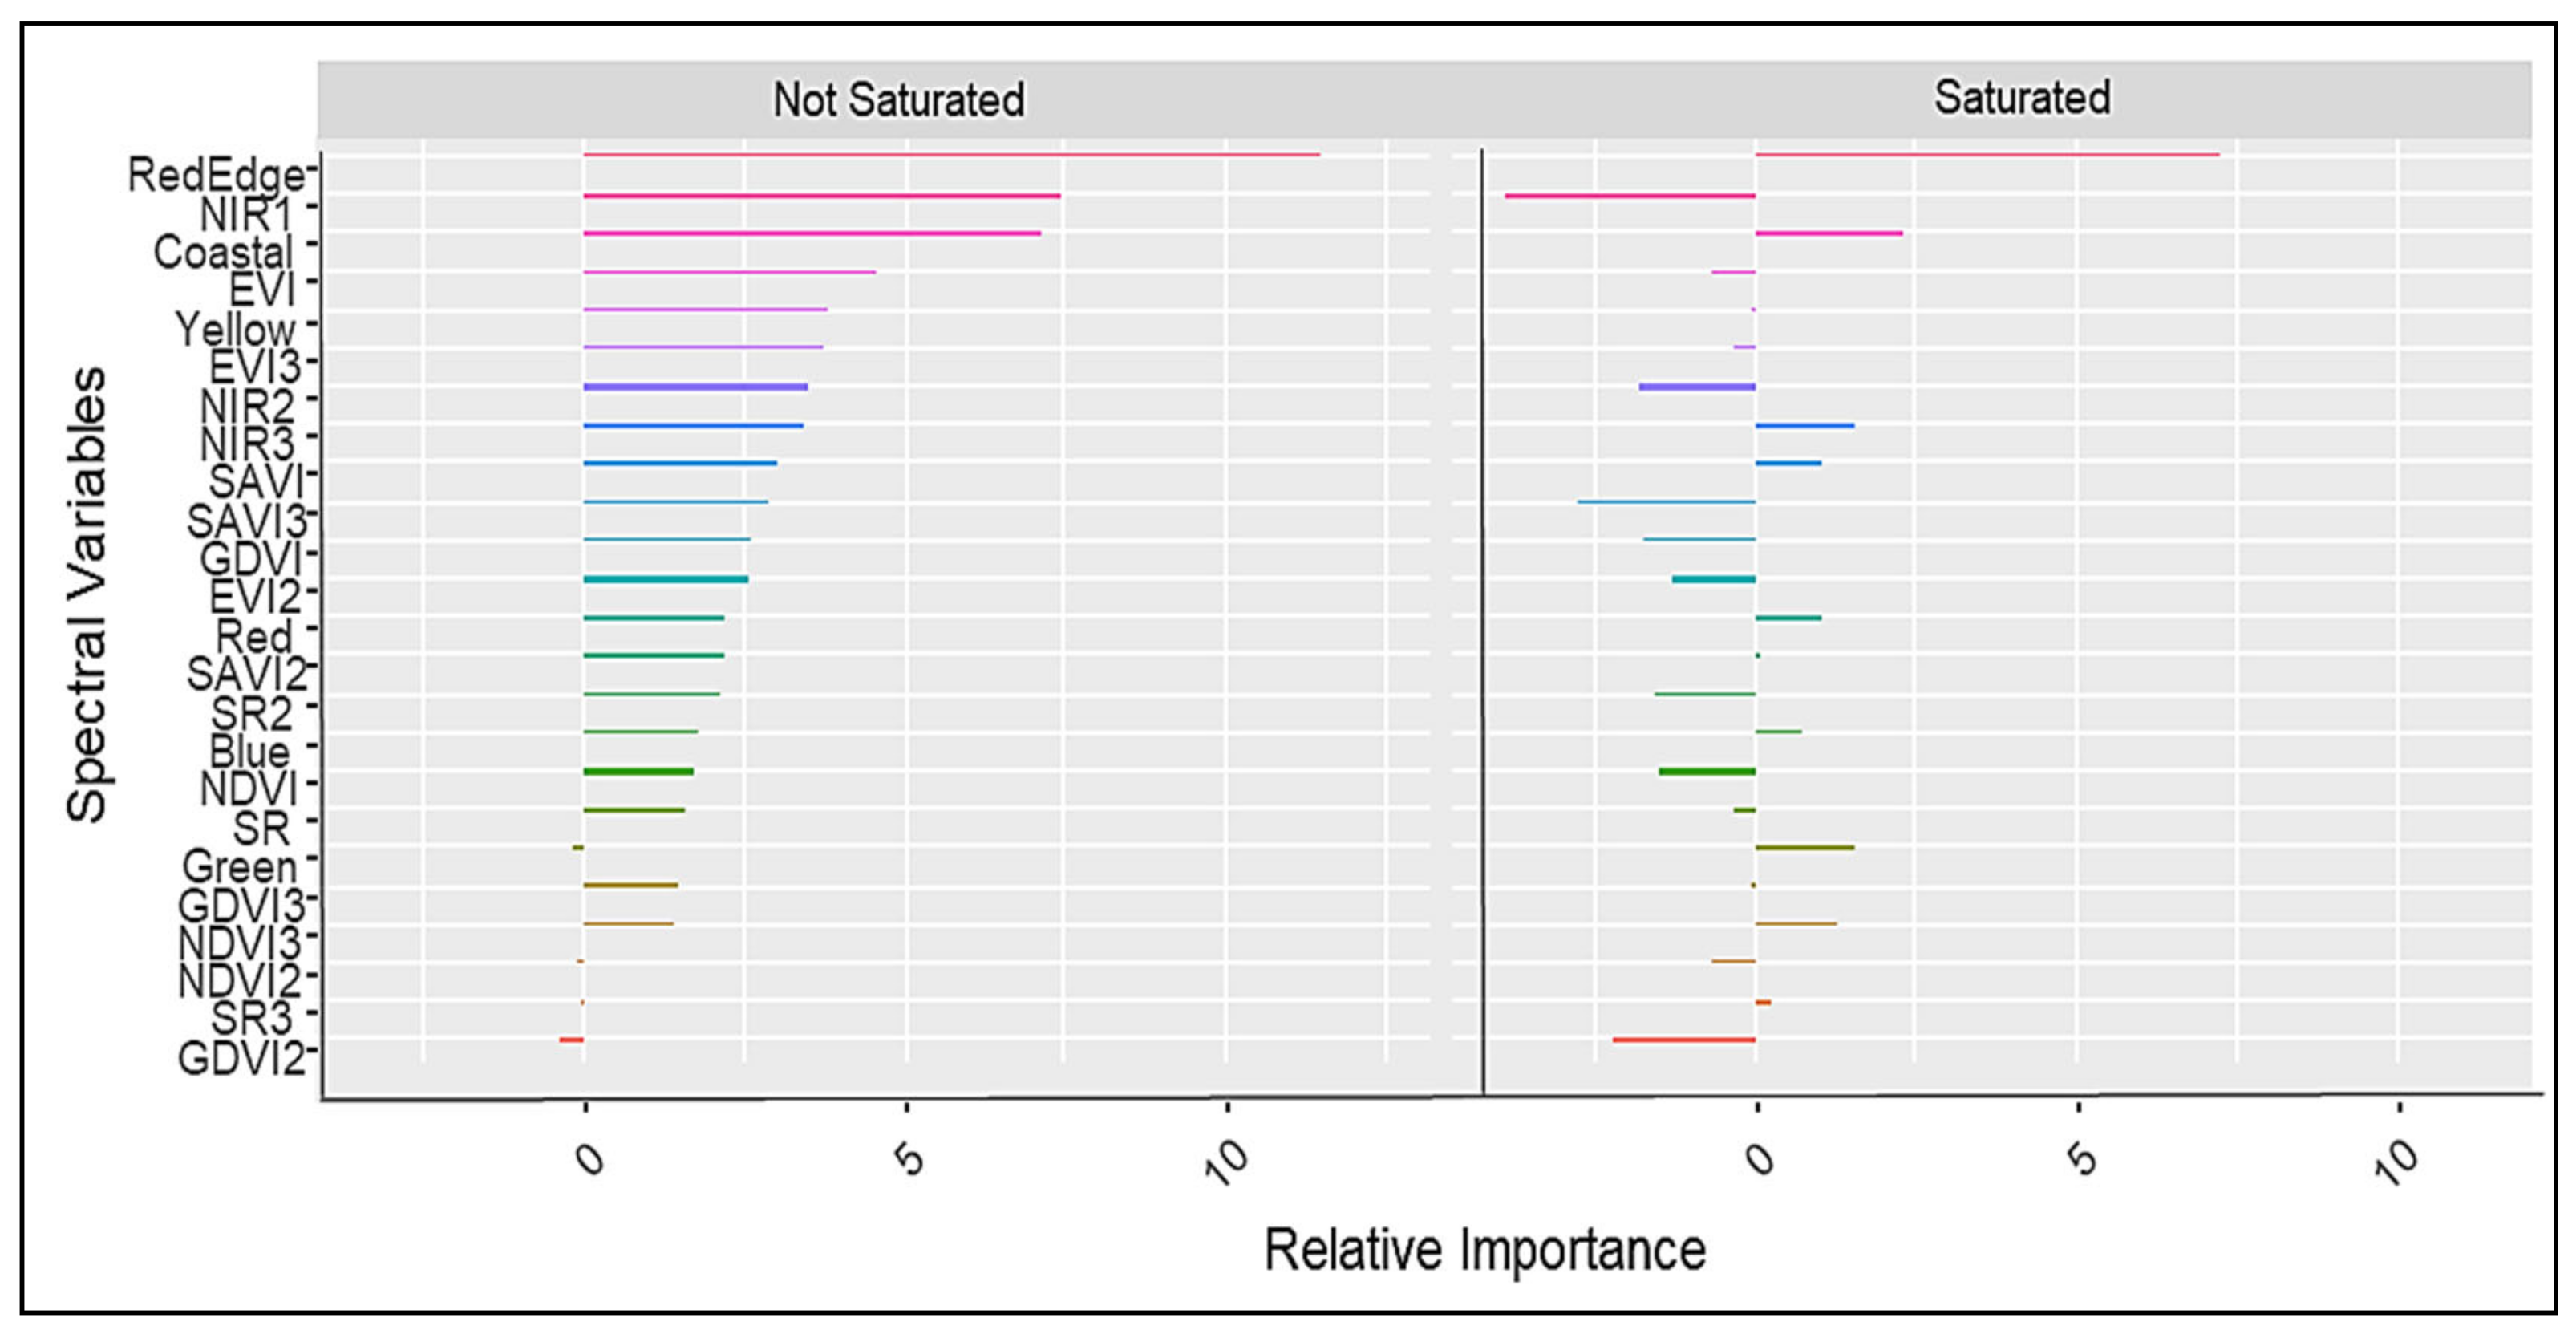
3.2. The Discrimination of Nitrogen-Saturated and -Unsaturated Plots Using Worldview-3 Imagery

Once the physiological criteria identified grassland plots within the initial stages of nitrogen saturation, Worldview-3 based wavebands and vegetation indices were then used to discriminate between the grassland plots characterised as either saturated or not saturated. The CART model produced an overall accuracy of 79%, with a user accuracy of 50% and a producer accuracy of 52% (Figure 5). The model was able to adequately characterise non-saturated grassland plots; however, it was unable to sufficiently classify nitrogen-saturated grassland plots as saturated. The RF model performed considerably better, with an overall accuracy of 91%, and associated user and producer accuracies of 83% and 89%, respectively (Figure 5). The RF model was able to effectively characterise both saturated and non-saturated grassland plots, with an average class error of 17.2%.
Fundamentally, the RF model, with a quantity disagreement of 4% and an allocation disagreement of 5%, had a lower level of overall disagreement in comparison to the CART model with a quantity disagreement of 19% and an allocation disagreement of 4%, respectively. The RF model, therefore, demonstrated a greater ability to reliably discriminate between nitrogen-saturated and -unsaturated grassland plots.
From the 24 spectral variables used, nine variables were identified as important in characterizing grassland plots within the initial stages of nitrogen saturation. The most important wavebands identified were the Red-Edge (705–745 nm), Coastal (400–450 nm), and NIR3 (838–950 nm) (Figure 6), whereas the most important vegetation indices identified were the SAVI and the Normalized Difference Vegetation Index 3 (NDVI3) (Figure 6).

4. Discussion

The effects of over-fertilization and ensuing nitrogen saturation have repeatedly delayed the successful rehabilitation of degraded grasslands [13]. As such, the development of a framework to identify grasslands at the brink of nitrogen saturation is fundamental in assisting rangeland management protocols and thus, safeguarding the well-being of South African grassland ecosystems. To this end, this study set out to characterize tropical grassland plots within the preliminary stages of nitrogen saturation using 2 m 8-band Worldview-3 satellite imagery (400–1040 nm) and decision tree techniques. The results produced from this study demonstrated that Worldview-3 spectral variables and the RF algorithm enabled the successful identification of nitrogen-saturated grassland plots. Furthermore, the Red-Edge (705–745 nm), Coastal (400–450 nm), and Near-Infrared (838–950 nm) parts of the electromagnetic spectrum, as well as the SAVI and the NDVI indices, were all proven to be highly influential spectral variables for identifying nitrogen-saturated grassland plots.

4.1. The Characterization of Nitrogen-Saturated Plots Using Physiological Properties

Physiological results obtained from the nitrogen-saturated plots within this study showed a reduction in net ammonium (NH4+-N) concentrations, whilst net nitrate (NO3-N) levels increased considerably. This outcome is indicative of the processes governing the nitrogen cycle and subsequent nitrogen saturation [28]. More specifically, once the required nitrogen uptake of the plant and microbial communities within the grassland were exceeded, the majority of excess ammonium (NH4+-N) was converted into nitrate (NO3-N) through the process of nitrification [16]. Thereafter, soils within the saturated plots began to acidify as pH levels decreased due to the abundance of NO3 cations [30]. The negatively charged NO3 cations combined with the high annual rainfall within the site (694 mm) attracted and facilitated the leaching of positively charged calcium and magnesium anions from the saturated plots [13]. This resulted in a highly acidic physiochemical environment with reduced and unbalanced soil nutrient profiles. These results are congruent with the early indicators and associated effects of early nitrogen saturation documented by Aber et al. [16]. Moreover, Wei et al. [28] achieved comparable results in their study of the impact of nitrogen deposition on the interactions between plants and microbes within Chinese grasslands. Their study demonstrated that at high nitrogen deposition, NO3-N concentrations were significantly elevated, whilst both NH4+-N and pH values were considerably lower. In addition, at extreme nitrogen deposition, they documented a decrease in both shoot and root biomass as well as species richness within the grassland [28]. Likewise, Zhang et al. [13], in their assessment of the effects of nitrogen fertilization on grassland soil within northern China, obtained similar outcomes. They stressed that fertilizer treatments in excess of 80 kg N ha−1 (which was exceeded within Ukulinga) will facilitate the accumulation of mobile NO3 within the soil, with possible NO3 and mineral leaching likely to occur soon after. Lastly, they found that rainfall above 655 mm per annum was significantly correlated to the rate of nitrification within Mongolian grasslands [13]. Finally, Wang et al. [18] found that nitrogen deposition at an average rate of 50 kg N ha−1 can cause a non-linear relationship with soil respiration; however, this varied with grass type in addition to the N gradients applied in the study.
Furthermore, the high net foliar nitrogen concentrations obtained for saturated plots, as well as a similar biomass yield between saturated and non-saturated plots demonstrated by this study, indicate that the ecosystem had not yet reached the final stage of nitrogen saturation. Moreover, this outcome is congruent with the indicators and related ecosystem impacts associated with the effects of early onset nitrogen saturation that was documented by Aber et al. [16]. This is further consolidated by the high nitrogen enrichment factor obtained for nitrogen-saturated grassland plots (Figure 4f), which correspond to findings by Garten Jr. and Miegroet [82]. Garten Jr. and Miegroet [82] highlighted that the natural abundance of foliar nitrogen would increase for systems approaching nitrogen saturation. Hence, this study maintains that the saturated grassland plots identified were within the initial stages of nitrogen saturation. From a spectral perspective, however, the increased availability of foliar nitrogen within saturated plots would intensify chlorophyll concentrations [83]; this will in turn facilitate greater visible leaf reflectance within the Red-Edge and Near-Infrared parts of the spectrum and thereby allow for a greater discernment of nitrogen-saturated plots [39,83].
Nonetheless, we caution that if further nitrogen deposition occurs within this ecosystem, the negative consequences associated with the final stage of nitrogen saturation will likely ensue. This will result in a decrease in overall grassland biomass and a reduction in species diversity [14,20,31]. For instance, Wei et al. [28] found that beyond a threshold of 0.4 mol N m−2 yr−1, plant functional dynamics within Chinese grasslands will change. Specifically, perennial grasses are often replaced by annual grasses, which are more adept at contending with high nitrogen levels and associated soil acidification and mineral leaching [28]. Peng et al. [14] explored the controlling factors of the N rate on above-ground net primary production in grasslands and support that the overuse of N has little benefits to pasture yield with negative consequences on the immediate environment. In this context, further detailed studies into the nitrogen saturation status of specific South African rangelands are required to supplement and improve current rangeland management protocols. Furthermore, as an indicator of grassland health and condition, studies assessing biomass variability within fertilizer-managed South African rangelands are also urgently required.

4.2. The Discrimination of Nitrogen-Saturated and -Unsaturated Plots Using Worldview-3 Imagery

The RF model identified nine important variables for characterizing grassland plots within the initial stages of nitrogen saturation (Figure 6). However, the most important wavebands identified were the Red-Edge (705–745 nm), Coastal (400–450 nm), and NIR3 (838–950 nm). The Red-Edge and NIR bands, which are sensitive to vegetation health, have been identified by several studies as crucial segments of the electromagnetic spectrum used for assessing foliar biochemicals [47,49,55]. In particular, the Red-Edge is sensitive to changes in chlorophyll concentration and is less affected by background effects [47,48]. Saturated grassland plots demonstrated elevated foliar nitrogen concentrations, which are consistent with higher chlorophyll levels. Subsequently, the Red-Edge facilitated a greater discernment between nitrogen-saturated and -unsaturated grassland plots. Likewise, Singh et al. [49] identified both the NIR and Red-Edge parts of the spectrum as crucial variables in mapping key grassland nutrients in KZN, South Africa. The Coastal band, however, is not usually associated with vegetation condition and is more typically applied for the imaging of shallow water and aerosol-based investigations [84,85]. Nevertheless, Wu et al. [86], in their study of mapping foliar nutrition in Queensland, Australia, similarly found both the Coastal and NIR bands as important variables for mapping foliar nitrogen.
The most important vegetation indices identified were the NDVI3 and the SAVI. The performance of these indices could be attributed to the fact that both indices contain the NIR region which responded positively to increases in foliar nitrogen content, that was associated with nitrogen-saturated plots. The normalized difference index is widely used as an indicator of vegetation condition and to assess the nutritional status of vegetation [48,54,87]. Ramoelo et al. [47] attained related results, noting that Red-Edge-based Simple ratio and NDVI were crucial in detecting both biomass variation and mapping leaf nitrogen concentrations. Likewise, Cabrera-Bosquet et al. [88] showed the importance of NDVI as a potential tool for predicting foliar nitrogen content (R2 = 0.86) and other physiological variables in wheat subjected to water and nitrogen stress. However, although SAVI was identified as an important predictor—likely due to the percentage of vegetation cover and various soil background influences prevalent within the site—this outcome contradicts studies such as Ullah et al. [52], Ren and Feng [89] and Shoko et al. [90], which did not find SAVI to be among the most important predictors for assessing vegetation condition.

4.3. The Performance of Decision Tree Techniques in Characterizing Nitrogen-Saturated Grassland Plots

The RF classification algorithm (overall accuracy of 91%) noticeably outperformed the CART analysis (overall accuracy of 79%) in characterizing nitrogen-saturated plots. These observations are in agreement with findings by Gómez-Chova et al. [91], Ham et al. [92] and Laliberte et al. [93] who report that because CART methods are stand-alone decision trees, they are often prone to a high variance caused by a heavy dependence upon the training data. The RF model circumvents this through a form of regularization provided via a multitude of decision trees [77,92]. The resultant lower variance facilitated an increase in discriminatory power and accuracy [94]. However, although decision tree model accuracy can be improved through increased iteration, the resultant model can easily overfit the data if cross validation is not applied [95]. Na et al. [94] arrived at a similar conclusion during their study of improving landcover mapping using Landsat TM imagery in China. They found that in addition to their RF model (91.3%) outperforming their CART model (89.2%), the RF model was also more resilient to a reduction in training data and amplified noise [94].
This study has shown that nitrogen-saturated grassland plots can be successfully identified using Worldview-3 imagery and the RF classification algorithm. This provides a platform to assist rangeland managers in identifying grasslands within the initial stages of nitrogen saturation and facilitate the rehabilitation and management of both degraded and pristine South African grasslands.

5. Conclusions and Implications

The burden placed upon grassland ecosystems by exponential population growth justifies the need for more accurate and expedient rangeland monitoring frameworks to safeguard grassland ecosystems for the foreseeable future. This necessitates the need for more prudent scientific research, which both informs and augments environmental policy and management protocols. Thus, the intention of this investigation was to develop a semi-autonomous framework to facilitate the detection of nitrogen saturation within grassland ecosystems. Based on the results of this study, it can be concluded that the RF classification algorithm and high-resolution 8-band Worldview-3-derived spectral variables can be used to successfully identify grassland plots at the brink of nitrogen saturation. In particular, the Red-Edge, NIR3 and Coastal parts of the electromagnetic spectrum were discovered as crucial wavebands for identifying nitrogen-saturated grassland plots. Moreover, the study identified the NDVI3 and SAVI as key vegetation indices for characterizing nitrogen saturation.
These findings provide insights into the possible environmental and spectral repercussions of excessive fertilization, as well as a sense of the practical ability of presently orbiting modern satellite sensors and remotely sensed techniques, in assessing grassland biochemical conditionality in regions susceptible to nutrient irregularities. Furthermore, this research provides a framework that is potentially capable of assisting rangeland managers in spatially characterizing and isolating grassland segments within the initial stages of nitrogen saturation. This will enable fertilization treatments to be adjusted in near-real-time according to ecosystem demand and thereby maintain the health and longevity of Southern African grasslands. However, this is just a small component within the overarching framework of sustainable nitrogen usage within the regional biogeochemical planetary boundary. In order to remain within a safe biogeochemical operating space, it is essential for future studies to establish specific nitrogen thresholds for individual rangelands within Southern Africa. Hence, the results, deductions and frameworks derived from this investigation will serve to crucially inform and expand current rangeland conservational cognizance in Southern Africa.

Author Contributions

Conceptualization, R.N., O.M. and K.P.; Methodology, R.N., O.M., K.P. and N.A.; Formal analysis, R.N. and K.P.; Writing—Original draft, R.N., K.P. and N.A.; Writing—Review and editing, R.N., O.M., K.P. and N.A.; Visualization, R.N.; Supervision, O.M. and K.P. All authors have read and agreed to the published version of the manuscript.

Funding

This research was financially supported the South African Research Chairs Initiative of the Department of Science and Innovation through the National Research Foundation of South Africa (grant no. 84157 and 114898).

Institutional Review Board Statement

Not applicable.

Informed Consent Statement

Not applicable.

Data Availability Statement

Data are available from the authors upon request.

Acknowledgments

This investigation was supported by the WOODRIGHTS Project and the eThekwini Municipality—through the Durban Research Action Partnership (as a part of The Global Environmental Change Programme).

Conflicts of Interest

The authors declare no conflict of interest.

References

  1. Egoh, B.N.; Reyers, B.; Rouget, M.; Richardson, D.M. Identifying priority areas for ecosystem service management in South African grasslands. J. Environ. Manag. 2011, 92, 1642–1650. [Google Scholar]
  2. Dzerefos, C.M.; Witkowski, E. Density and potential utilisation of medicinal grassland plants from Abe Bailey Nature Reserve, South Africa. Biodivers. Conserv. 2001, 10, 1875–1896. [Google Scholar] [CrossRef]
  3. Wilson, J.B.; Peet, R.K.; Dengler, J.; Pärtel, M. Plant species richness: The world records. J. Veg. Sci. 2012, 23, 796–802. [Google Scholar]
  4. Naicker, R.; Rouget, M.; Mutanga, O. Assessing habitat fragmentation of the KwaZulu-Natal Sandstone Sourveld, a threatened ecosystem. Bothalia Afr. Biodivers. Conserv. 2016, 46, 1–10. [Google Scholar]
  5. De Wit, M.; Blignaut, J.; Nazare, F. Monetary Valuation of the Grasslands in South Africa; South African National Biodiversity Institute: Pretoria, South Africa, 2006. [Google Scholar]
  6. Kowaljow, E.; Mazzarino, M.J.; Satti, P.; Jiménez-Rodríguez, C. Organic and inorganic fertilizer effects on a degraded Patagonian rangeland. Plant Soil 2010, 332, 135–145. [Google Scholar]
  7. Reinermann, S.; Asam, S.; Kuenzer, C. Remote sensing of grassland production and management—A review. Remote Sens. 2020, 12, 1949. [Google Scholar] [CrossRef]
  8. Omaliko, C.; Mammah, O.; Agbakoba, A. Some Aspects of Rangeland Improvement in a Derived Savanna Ecosystem. J. Range Manag. 1984, 37, 415–419. [Google Scholar] [CrossRef]
  9. Muir, J.P.; Sanderson, M.A.; Ocumpaugh, W.R.; Jones, R.M.; Reed, R.L. Biomass production of ‘Alamo’switchgrass in response to nitrogen, phosphorus, and row spacing. Agron. J. 2001, 93, 896–901. [Google Scholar]
  10. Curran, P.J. Remote sensing of foliar chemistry. Remote Sens. Environ. 1989, 30, 271–278. [Google Scholar]
  11. Ferwerda, J.G.; Skidmore, A.K. Can nutrient status of four woody plant species be predicted using field spectrometry? ISPRS J. Photogramm. Remote Sens. 2007, 62, 406–414. [Google Scholar] [CrossRef]
  12. Zhang, J.C.; Pu, R.L.; Huang, W.J.; Yuan, L.; Luo, J.H.; Wang, J.H. Using in-situ hyperspectral data for detecting and discriminating yellow rust disease from nutrient stresses. Field Crops Res. 2012, 134, 165–174. [Google Scholar]
  13. Zhang, X.; Wang, Q.; Gilliam, F.; Bai, W.; Han, X.; Li, L. Effect of nitrogen fertilization on net nitrogen mineralization in a grassland soil, northern China. Grass Forage Sci. 2012, 67, 219–230. [Google Scholar]
  14. Peng, Y.; Chen, H.Y.; Yang, Y. Global pattern and drivers of nitrogen saturation threshold of grassland productivity. Funct. Ecol. 2020, 34, 1979–1990. [Google Scholar]
  15. Lu, X.; Jiang, H.; Liu, J.; Zhou, G.; Zhu, Q.; Peng, C.; Wei, X.; Chang, J.; Liu, S.; Liu, S.; et al. Spatial and Temporal Variability of Nitrogen Deposition and Its Impacts on the Carbon Budget of China. Procedia Environ. Sci. 2012, 13, 1997–2030. [Google Scholar]
  16. Aber, J.D.; Nadelhoffer, K.J.; Steudler, P.; Melillo, J.M. Nitrogen saturation in northern forest ecosystems. BioScience 1989, 39, 378–386. [Google Scholar]
  17. Aber, J.; Mcdowell, W.; Nadelhoffer, K.; Magill, A.; Berntson, G.; Kamakea, M.; Mcnulty, S.; Currie, W.; Rustad, L.; Fernandez, I. Nitrogen saturation in temperate forest ecosystems. BioScience 1998, 48, 921–934. [Google Scholar] [CrossRef] [Green Version]
  18. Wang, C.; Ren, F.; Zhou, X.; Ma, W.; Liang, C.; Wang, J.; Cheng, J.; Zhou, H.; He, J.S. Variations in the nitrogen saturation threshold of soil respiration in grassland ecosystems. Biogeochemistry 2020, 148, 311–324. [Google Scholar]
  19. Socolow, R.H. Nitrogen management and the future of food: Lessons from the management of energy and carbon. Proc. Natl. Acad. Sci. USA 1999, 96, 6001–6008. [Google Scholar]
  20. Cassman, K.G.; Dobermann, A.; Walters, D.T. Agroecosystems, nitrogen-use efficiency, and nitrogen management. AMBIO A J. Hum. Environ. 2002, 31, 132–140. [Google Scholar]
  21. Galloway, J.N. The global nitrogen cycle: Changes and consequences. Environ. Pollut. 1998, 102, 15–24. [Google Scholar] [CrossRef]
  22. Galloway, J.N.; Townsend, A.R.; Erisman, J.W.; Bekunda, M.; Cai, Z.; Freney, J.R.; Martinelli, L.A.; Seitzinger, S.P.; Sutton, M.A. Transformation of the nitrogen cycle: Recent trends, questions, and potential solutions. Science 2008, 320, 889–892. [Google Scholar]
  23. Gruber, N.; Galloway, J.N. An Earth-system perspective of the global nitrogen cycle. Nature 2008, 451, 293–296. [Google Scholar] [PubMed] [Green Version]
  24. Pardo, L.H.; Fenn, M.E.; Goodale, C.L.; Geiser, L.H.; Driscoll, C.T.; Allen, E.B.; Baron, J.S.; Bobbink, R.; Bowman, W.D.; Clark, C.M. Effects of nitrogen deposition and empirical nitrogen critical loads for ecoregions of the United States. Ecol. Appl. 2011, 21, 3049–3082. [Google Scholar]
  25. Templer, P.H.; Mack, M.C.; Chaplin, F.S.I.; Christenson, L.M.; Compton, J.E.; Crook, H.D.; Currie, W.S.; Curtis, C.J.; Dail, D.B.; D’antonio, C.M.; et al. Sinks for nitrogen inputs in terrestrial ecosystems: A meta-analysis of 15N tracer field studies. Ecology 2012, 93, 1816–1829. [Google Scholar] [PubMed] [Green Version]
  26. Hoegberg, P.; Fan, H.; Quist, M.; Binkley, D.; Tamm, C.O. Tree growth and soil acidification in response to 30 years of experimental nitrogen loading on boreal forest. Glob. Chang. Biol. 2006, 12, 489–499. [Google Scholar]
  27. Peerbhay, K.; Adelabu, S.; Lottering, R.; Singh, L. Mapping carbon content in a mountainous grassland using SPOT 5 multispectral imagery and semi-automated machine learning ensemble methods. Sci. Afr. 2022, 17, 01344. [Google Scholar]
  28. Wei, C.; Yu, Q.; Bai, E.; Lü, X.; Li, Q.; Xia, J.; Kardol, P.; Liang, W.; Wang, Z.; Han, X. Nitrogen deposition weakens plant–microbe interactions in grassland ecosystems. Glob. Chang. Biol. 2013, 19, 3688–3697. [Google Scholar]
  29. Asner, G.P.; Townsend, A.R.; Riley, W.J.; Matson, P.A.; Neff, J.C.; Cleveland, C.C. Physical and biogeochemical controls over terrestrial ecosystem responses to nitrogen deposition. Biogeochemistry 2001, 54, 1–39. [Google Scholar]
  30. Emmett, B.A. Nitrogen Saturation of Terrestrial Ecosystems: Some Recent Findings and Their Implications for Our Conceptual Framework. Acid Rain-Deposition to Recovery; Springer: Berlin/Heidelberg, Germany, 2007. [Google Scholar]
  31. Zong, N.; Shi, P.; Song, M.; Zhang, X.; Jiang, J.; Chai, X. Nitrogen critical loads for an alpine meadow ecosystem on the Tibetan Plateau. Environ. Manag. 2016, 57, 531–542. [Google Scholar]
  32. Corre, M.D.; Beese, F.O.; Brumme, R. Soil nitrogen cycle in high nitrogen deposition forest: Changes under nitrogen saturation and liming. Ecol. Appl. 2003, 13, 287–298. [Google Scholar]
  33. Lu, X.; Mao, Q.; Gilliam, F.S.; Luo, Y.; Mo, J. Nitrogen deposition contributes to soil acidification in tropical ecosystems. Glob. Chang. Biol. 2014, 20, 3790–3801. [Google Scholar]
  34. Horneck, D.A.; Sullivan, D.M.; Owen, J.S.; Hart, J.M. Soil Test Interpretation Guide; Oregon State University, Extension Service: Redmond, OR, USA, 2011. [Google Scholar]
  35. Labconco, C. A Guide to Kjeldahl Nitrogen Determination Methods and Apparatus; Labconco Corporation: Houston, TX, USA, 1998. [Google Scholar]
  36. Domini, C.; Vidal, L.; Cravotto, G.; Canals, A. A simultaneous, direct microwave/ultrasound-assisted digestion procedure for the determination of total Kjeldahl nitrogen. Ultrason. Sonochemistry 2009, 16, 564–569. [Google Scholar] [CrossRef] [PubMed]
  37. Serrano, L.; Filella, I.; Penuelas, J. Remote sensing of biomass and yield of winter wheat under different nitrogen supplies. Crop Sci. 2000, 40, 723–731. [Google Scholar] [CrossRef] [Green Version]
  38. Curran, P.J.; Dungan, J.L.; Peterson, D.L. Estimating the foliar biochemical concentration of leaves with reflectance spectrometry: Testing the Kokaly and Clark methodologies. Remote Sens. Environ. 2001, 76, 349–359. [Google Scholar] [CrossRef]
  39. Serrano, L.; Peñuelas, J.; Ustin, S.L. Remote sensing of nitrogen and lignin in Mediterranean vegetation from AVIRIS data: Decomposing biochemical from structural signals. Remote Sens. Environ. 2002, 81, 355–364. [Google Scholar] [CrossRef]
  40. Mutanga, O.; Skidmore, A.K.; Prins, H.H.T. Predicting in situ pasture quality in the Kruger National Park, South Africa, using continuum-removed absorption features. Remote Sens. Environ. 2004, 89, 393–408. [Google Scholar]
  41. Ling, B.; Goodin, D.G.; Mohler, R.L.; Laws, A.N.; Joern, A. Estimating canopy nitrogen content in a heterogeneous grassland with varying fire and grazing treatments: Konza Prairie, Kansas, USA. Remote Sens. 2014, 6, 4430–4453. [Google Scholar] [CrossRef] [Green Version]
  42. Mutanga, O. Hyperspectral Remote Sensing of Tropical Grass Quality and Quantity. Ph.D. Thesis, Enschede and Wageningen University, Gelderland, The Netherlands, 2004. [Google Scholar]
  43. Ferwerda, J.G.; Skidmore, A.K.; Mutanga, O. Nitrogen detection with hyperspectral normalized ratio indices across multiple plant species. Int. J. Remote Sens. 2005, 26, 4083–4095. [Google Scholar] [CrossRef]
  44. Abdel-Rahman, E.M.; Ahmed, F.B.; Ismail, R. Random forest regression and spectral band selection for estimating sugarcane leaf nitrogen concentration using EO-1 Hyperion hyperspectral data. Int. J. Remote Sens. 2013, 34, 712–728. [Google Scholar] [CrossRef]
  45. Sibanda, M.; Mutanga, O.; Rouget, M. Examining the potential of Sentinel-2 MSI spectral resolution in quantifying above ground biomass across different fertilizer treatments. ISPRS J. Photogramm. Remote Sens. 2015, 110, 55–65. [Google Scholar] [CrossRef]
  46. Sibanda, M.; Mutanga, O.; Rouget, M.; Kumar, L. Estimating biomass of native grass grown under complex management treatments using worldview-3 spectral derivatives. Remote Sens. 2017, 9, 55. [Google Scholar] [CrossRef] [Green Version]
  47. Ramoelo, A.; Cho, M.A.; Mathieu, R.; Madonsela, S.; Van De Kerchove, R.; Kaszta, Z.; Wolff, E. Monitoring grass nutrients and biomass as indicators of rangeland quality and quantity using random forest modelling and WorldView-2 data. Int. J. Appl. Earth Obs. Geoinf. 2015, 43, 43–54. [Google Scholar] [CrossRef]
  48. Ramoelo, A.; Cho, M.; Mathieu, R.; Skidmore, A.K. Potential of Sentinel-2 spectral configuration to assess rangeland quality. J. Appl. Remote Sens. 2015, 9, 094096. [Google Scholar] [CrossRef] [Green Version]
  49. Singh, L.; Mutanga, O.; Mafongoya, P.; Peerbhay, K.Y. Multispectral mapping of key grassland nutrients in KwaZulu-Natal, South Africa. J. Spat. Sci. 2018, 63, 155–172. [Google Scholar] [CrossRef]
  50. Boegh, E.; Soegaard, H.; Broge, N.; Hasager, C.B.; Jensen, N.O.; Schelde, K.; Thomsen, A. Airborne multispectral data for quantifying leaf area index, nitrogen concentration, and photosynthetic efficiency in agriculture. Remote Sens. Environ. 2002, 81, 179–193. [Google Scholar] [CrossRef]
  51. Ramoelo, A.; Skidmore, A.K.; Cho, M.A.; Schlerf, M.; Mathieu, R.; Heitkönig, I.M.A. Regional estimation of savanna grass nitrogen using the red-edge band of the spaceborne rapideye sensor. Int. J. Appl. Earth Obs. Geoinf. 2012, 19, 151–162. [Google Scholar] [CrossRef]
  52. Ullah, S.; Si, Y.; Schlerf, M.; Skidmore, A.K.; Shafique, M.; Iqbal, I.A. Estimation of grassland biomass and nitrogen using MERIS data. Int. J. Appl. Earth Obs. Geoinf. 2012, 19, 196–204. [Google Scholar] [CrossRef]
  53. Karlson, M.; Ostwald, M.; Reese, H.; Sanou, J.; Tankoano, B.; Mattsson, E. Mapping tree canopy cover and aboveground biomass in Sudano-Sahelian woodlands using Landsat 8 and random forest. Remote Sens. 2015, 7, 10017–10041. [Google Scholar] [CrossRef] [Green Version]
  54. Adjorlolo, C.; Mutanga, O.; Cho, M.A. Estimation of canopy nitrogen concentration across c3 and c4 grasslands using worldview-2 multispectral data. IEEE J. Sel. Top. Appl. Earth Obs. Remote Sens. 2014, 7, 4385–4392. [Google Scholar] [CrossRef]
  55. Mutanga, O.; Adam, E.; Adjorlolo, C.; Abdel-Rahman, E.M. Evaluating the robustness of models developed from field spectral data in predicting African grass foliar nitrogen concentration using WorldView-2 image as an independent test dataset. Int. J. Appl. Earth Obs. Geoinf. 2015, 34, 178–187. [Google Scholar] [CrossRef]
  56. Gao, J.; Meng, B.; Liang, T.; Feng, Q.; Ge, J.; Yin, J.; Wu, C.; Cui, X.; Hou, M.; Liu, J. Modeling alpine grassland forage phosphorus based on hyperspectral remote sensing and a multi-factor machine learning algorithm in the east of Tibetan Plateau, China. ISPRS J. Photogramm. Remote Sens. 2019, 147, 104–117. [Google Scholar] [CrossRef]
  57. Gao, J.; Liu, J.; Liang, T.; Hou, M.; Ge, J.; Feng, Q.; Wu, C.; Li, W. Mapping the Forage Nitrogen-Phosphorus Ratio Based on Sentinel-2 MSI Data and a Random Forest Algorithm in an Alpine Grassland Ecosystem of the Tibetan Plateau. Remote Sens. 2020, 12, 2929. [Google Scholar] [CrossRef]
  58. Morris, C.; Fynn, R. The Ukulinga long-term grassland trials: Reaping the fruits of meticulous, patient research. Bull. Grassl. Soc. South. Afr. 2001, 11, 7–22. [Google Scholar]
  59. Fynn, R.W.; O’connor, T.G. Determinants of community organization of a South African mesic grassland. J. Veg. Sci. 2005, 16, 93–102. [Google Scholar] [CrossRef]
  60. Smith, W.H. Air pollution—Effects on the structure and function of the temperate forest ecosystem. Environ. Pollut. 1974, 6, 111–129. [Google Scholar] [CrossRef]
  61. Bormann, F. The Effects of Air Pollution on the New England Landscape; Ambio: Stockholm, Sweden, 1982. [Google Scholar]
  62. Koopmans, C.; Van Dam, D.; Tietema, A.; Verstraten, J. Natural 15 N abundance in two nitrogen saturated forest ecosystems. Oecologia 1997, 111, 470–480. [Google Scholar] [CrossRef] [PubMed] [Green Version]
  63. Balota, E.L.; Yada, I.F.; Amaral, H.; Nakatani, A.S.; Dick, R.P.; Coyne, M.S. Long-term land use influences soil microbial biomass P and S, phosphatase and arylsulfatase activities, and S mineralization in a Brazilian oxisol. Land Degrad. Dev. 2014, 25, 397–406. [Google Scholar] [CrossRef]
  64. EXELIS. ENVI4.0 Software; Exelis Visual Information Solutions: Boulder, CO, USA, 2010. [Google Scholar]
  65. Environmental Systems Research Institute. ArcGIS Desktop: Release 10; Environmental Systems Research Institute: Redlands, CA, USA, 2011. [Google Scholar]
  66. Jurgens, C. The modified normalized difference vegetation index (mNDVI) a new index to determine frost damages in agriculture based on Landsat TM data. Int. J. Remote Sens. 1997, 18, 3583–3594. [Google Scholar] [CrossRef]
  67. Mutanga, O.; Skidmore, A. Integrating imaging spectroscopy and neural networks to map grass quality in the Kruger National Park, South Africa. Remote Sens. Environ. 2004, 90, 104–115. [Google Scholar] [CrossRef]
  68. Mutanga, O.; Adam, E.; Cho, M.A. High density biomass estimation for wetland vegetation using WorldView-2 imagery and random forest regression algorithm. Int. J. Appl. Earth Obs. Geoinf. 2012, 18, 399–406. [Google Scholar] [CrossRef]
  69. Peerbhay, K.; Mutanga, O.; Lottering, R.; Ismail, R. Mapping Solanum mauritianum plant invasions using WorldView-2 imagery and unsupervised random forests. Remote Sens. Environ. 2016, 182, 39–48. [Google Scholar] [CrossRef]
  70. Rcore, T. R: A Language and Environment for Statistical Computing; R Foundation for Statistical Computing: Vienna, Austria, 2016. [Google Scholar]
  71. Shapiro, S.S.; Wilk, M.B. An analysis of variance test for normality (complete samples). Biometrika 1965, 52, 591–611. [Google Scholar] [CrossRef]
  72. Lewis, R.J. An introduction to classification and regression tree (CART) analysis. In Annual Meeting of the Society for Academic Emergency Medicine in San Francisco, California; Department of Emergency Medicine Harbor-UCLA Medical Center Torrance: San Francisco, CA, USA, 2000. [Google Scholar]
  73. Steinberg, D. CART: Classification and regression trees. In The Top Ten Algorithms in Data Mining; Chapman and Hall/CRC: Boca Raton, FL, USA, 2009. [Google Scholar]
  74. Lawrence, R.L.; Wright, A. Rule-based classification systems using classification and regression tree (CART) analysis. Photogramm. Eng. Remote Sens. 2001, 67, 1137–1142. [Google Scholar]
  75. Ismail, R.; Mutanga, O.; Kumar, L. Modeling the potential distribution of pine forests susceptible to sirex noctilio infestations in Mpumalanga, South Africa. Trans. GIS 2010, 14, 709–726. [Google Scholar] [CrossRef]
  76. Lin, X.; Sun, L.; Li, Y.; Guo, Z.; Li, Y.; Zhong, K.; Wang, Q.; Lu, X.; Yang, Y.; Xu, G. A random forest of combined features in the classification of cut tobacco based on gas chromatography fingerprinting. Talanta 2010, 82, 1571–1575. [Google Scholar] [CrossRef]
  77. Breiman, L. Random forests. Mach. Learn. 2001, 45, 5–32. [Google Scholar] [CrossRef] [Green Version]
  78. Genuer, R.; Poggi, J.-M.; Tuleau-Malot, C. Variable selection using random forests. Pattern Recognit. Lett. 2010, 31, 2225–2236. [Google Scholar] [CrossRef] [Green Version]
  79. Pontius, R.G., Jr.; Millones, M. Death to Kappa: Birth of quantity disagreement and allocation disagreement for accuracy assessment. Int. J. Remote Sens. 2011, 32, 4407–4429. [Google Scholar] [CrossRef]
  80. Sibanda, M.; Mutanga, O.; Rouget, M.; Odindi, J. Exploring the potential of in situ hyperspectral data and multivariate techniques in discriminating different fertilizer treatments in grasslands. J. Appl. Remote Sens. 2015, 9, 096033. [Google Scholar] [CrossRef]
  81. Sibanda, M. Remote Sensing Grass Quantity under Different Grassland Management Treatments Practised in the Southern African Rangelands. Ph.D. Thesis, Environmental Science, University of KwaZulu-Natal, Durban, South Africa, 2016. [Google Scholar]
  82. Garten, C.T., Jr.; Miegroet, H.V. Relationships between soil nitrogen dynamics and natural 15N abundance in plant foliage from Great Smoky Mountains National Park. Can. J. For. Res. 1994, 24, 1636–1645. [Google Scholar] [CrossRef]
  83. Gates, D.M.; Keegan, H.J.; Schleter, J.C.; Weidner, V.R. Spectral properties of plants. Appl. Opt. 1965, 4, 11–20. [Google Scholar] [CrossRef]
  84. Asadzadeh, S.; De Souza Filho, C.R. Investigating the capability of WorldView-3 superspectral data for direct hydrocarbon detection. Remote Sens. Environ. 2016, 173, 162–173. [Google Scholar] [CrossRef]
  85. Parente, C.; Pepe, M. Bathymetry from WorldView-3 satellite data using radiometric band ratio. Acta Polytech. 2018, 58, 109–117. [Google Scholar] [CrossRef] [Green Version]
  86. Wu, H.; Levin, N.; Seabrook, L.; Moore, B.; Mcalpine, C. Mapping Foliar Nutrition Using WorldView-3 and WorldView-2 to Assess Koala Habitat Suitability. Remote Sens. 2019, 11, 215. [Google Scholar] [CrossRef] [Green Version]
  87. Rouse, J.W., Jr.; Haas, R.; Schell, J.; Deering, D. Monitoring vegetation systems in the Great Plains with ERTS. NASA Spec. Publ. 1974, 351, 309. [Google Scholar]
  88. Cabrera-Bosquet, L.; Molero, G.; Stellacci, A.; Bort, J.; Nogues, S.; Araus, J. NDVI as a potential tool for predicting biomass, plant nitrogen content and growth in wheat genotypes subjected to different water and nitrogen conditions. Cereal Res. Commun. 2011, 39, 147–159. [Google Scholar] [CrossRef]
  89. Ren, H.; Feng, G. Are soil-adjusted vegetation indices better than soil-unadjusted vegetation indices for above-ground green biomass estimation in arid and semi-arid grasslands? Grass Forage Sci. 2015, 70, 611–619. [Google Scholar] [CrossRef]
  90. Shoko, C.; Mutanga, O.; Dube, T.; Slotow, R. Characterizing the spatio-temporal variations of C3 and C4 dominated grasslands aboveground biomass in the Drakensberg, South Africa. Int. J. Appl. Earth Obs. Geoinf. 2018, 68, 51–60. [Google Scholar] [CrossRef] [Green Version]
  91. Gómez-Chova, L.; Calpe, J.; Soria, E.; Camps-Valls, G.; Martin, J.; Moreno, J. CART-based feature selection of hyperspectral images for crop cover classification. In Proceedings of the 2003 International Conference on Image Processing (Cat. No. 03CH37429), Barcelona, Spain, 14–17 September 2003; IEEE: New York, NY, USA, 2003; p. III–589. [Google Scholar]
  92. Ham, J.; Chen, Y.; Crawford, M.M.; Ghosh, J. Investigation of the random forest framework for classification of hyperspectral data. IEEE Trans. Geosci. Remote Sens. 2005, 43, 492–501. [Google Scholar] [CrossRef] [Green Version]
  93. Laliberte, A.S.; Fredrickson, E.L.; Rango, A. Combining decision trees with hierarchical object-oriented image analysis for mapping arid rangelands. Photogramm. Eng. Remote Sens. 2007, 73, 197–207. [Google Scholar] [CrossRef]
  94. Na, X.; Zhang, S.; Li, X.; Yu, H.; Liu, C. Improved land cover mapping using random forests combined with landsat thematic mapper imagery and ancillary geographic data. Photogramm. Eng. Remote Sens. 2010, 76, 833–840. [Google Scholar] [CrossRef]
  95. Efron, B.; Gong, G. A leisurely look at the bootstrap, the jackknife, and cross-validation. Am. Stat. 1983, 37, 36–48. [Google Scholar]
Figure 1. Location of the study area within the Ukulinga research farm, near Pietermaritzburg, South Africa.
Applsci 13 04252 g001
Figure 2. Flow diagram showing the physiological criteria used to identify grassland plots undergoing the initial stages of nitrogen saturation, as characterized by Aber et al. [16].
Applsci 13 04252 g002
Figure 3. Mean differences in soil properties for saturated vs. not saturated grassland plots across the growing stages, where (a) represents net NO3−N concentrations, (b) represents changes in acidity (pH), (c) represents net calcium concentration (Ca), and (d) represents net magnesium concentration (Mg).
Applsci 13 04252 g003
Figure 4. Mean differences in additional site factors for saturated vs. not saturated grassland plots across the growing stages, where (a) represents net ammonium concentrations (NH4+−N), (b) represents changes in soil organic carbon levels, (c) represents net foliar nitrogen, (d) represents net soil nitrogen, (e) represents biomass yield, and (f) represents the nitrogen enrichment factor.
Applsci 13 04252 g004
Figure 5. Classification results for discriminating nitrogen-saturated vs. -unsaturated grassland plots, where RF = Random Forest, and CART = Classification and Regression Tree analysis.
Applsci 13 04252 g005
Figure 6. The relative importance of each spectral variable in classifying nitrogen-saturated vs. nitrogen-non-saturated grassland plots.
Applsci 13 04252 g006
Table 1. Detailed spectral range of the 8-band Worldview-3 image.
BandWavelength Range (nm)Designation
1400–450Coastal
2450–510Blue
3510–580Green
4585–625Yellow
5630–690Red
6705–745Red-Edge
7770–895Near–Infrared
8860–1040Near–Infrared 2
Disclaimer/Publisher’s Note: The statements, opinions and data contained in all publications are solely those of the individual author(s) and contributor(s) and not of MDPI and/or the editor(s). MDPI and/or the editor(s) disclaim responsibility for any injury to people or property resulting from any ideas, methods, instructions or products referred to in the content.

