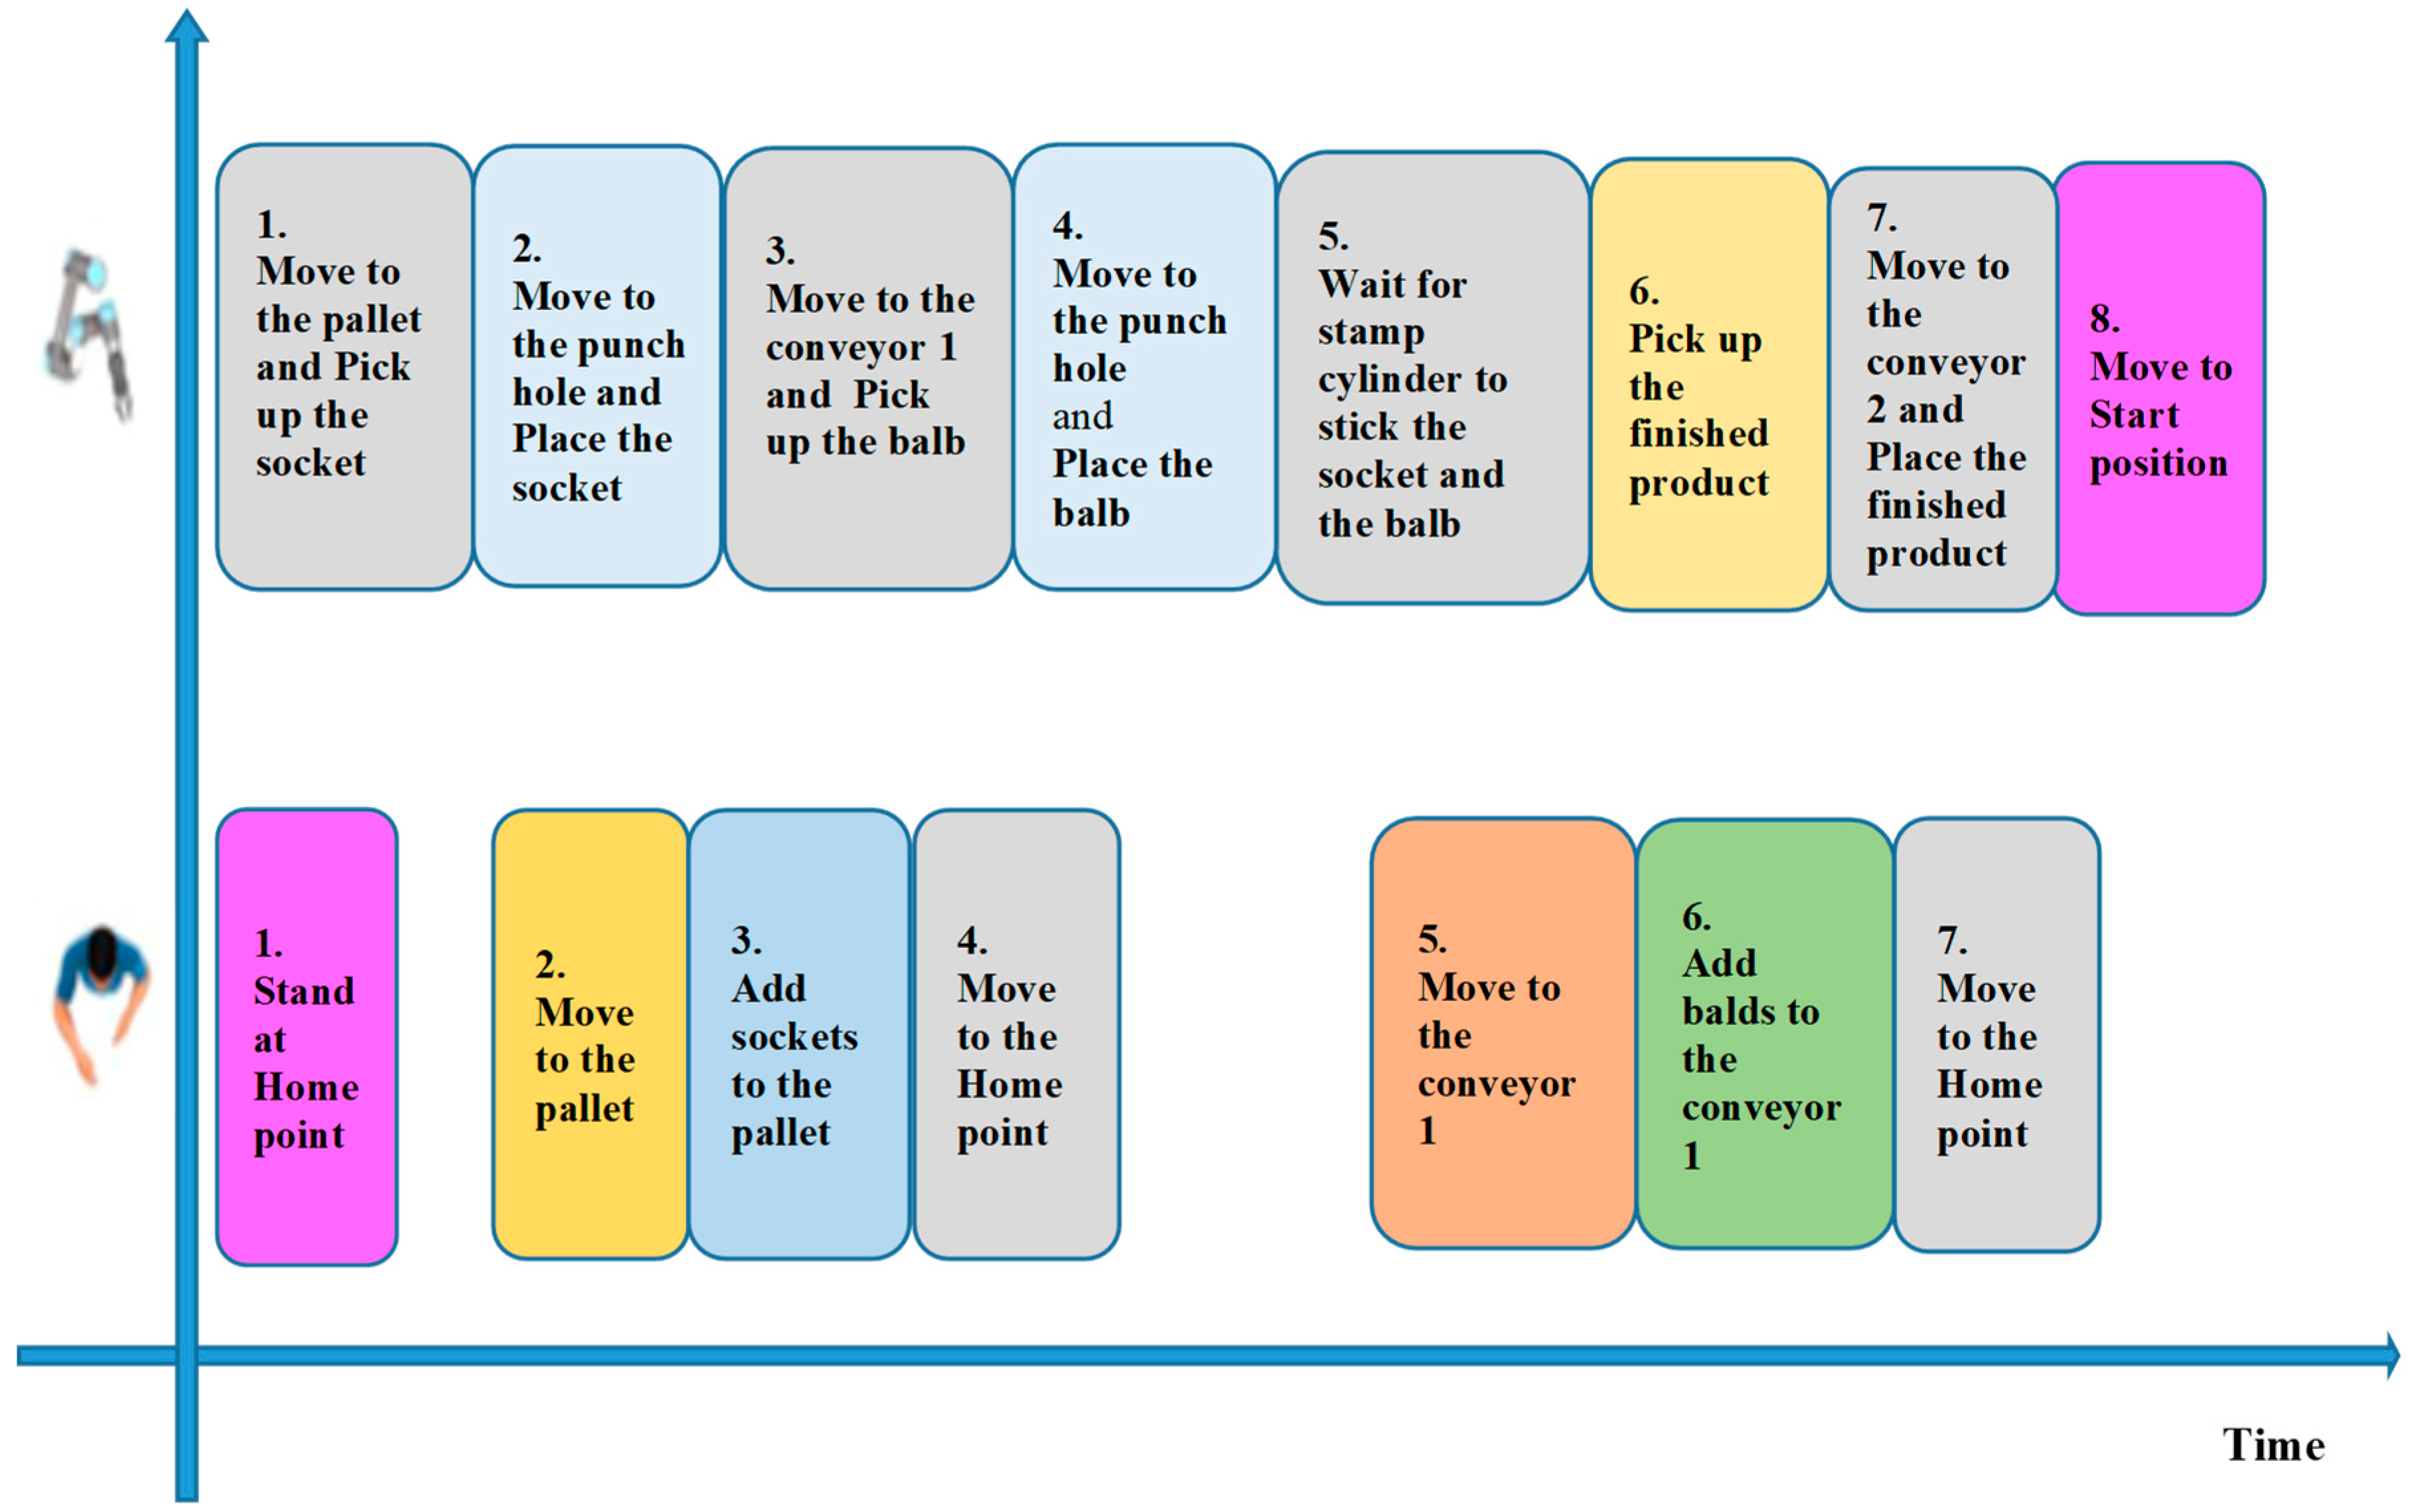
4.1. Description of the Problem and Initial Conditions
The problem for the miniature light bulb assembly system is minimizing the number of times the worker moves, as long as the robot’s operation is not interrupted by the lack of a bulb socket or bulb.
At the initial time (t = 0), it is assumed that the worker is standing at the Home position. On the pallet, there are enough S sockets, and on the conveyor belt, there are B bulbs.
The total time taken by a worker to provide sockets is as follows:
represents the total time it takes for the worker to complete a socket supply. is the time it takes for the worker to move from the Home position to Position 1 and then return to the Home position.
is the time it takes to supply the
ith socket, where
S represents the total number of sockets supplied in a single movement. Similarly, we can obtain the time it takes to supply bulbs to the assembly line using the following equation:
represents the total time it takes for the worker to provide bulbs. is the time it takes for the worker to move from the Home position to Position 2 and then return to the Home position. The time interval for this movement is approximately the same as the time it takes the worker to move from the Home position to Position 1 using a defined motion trajectory.
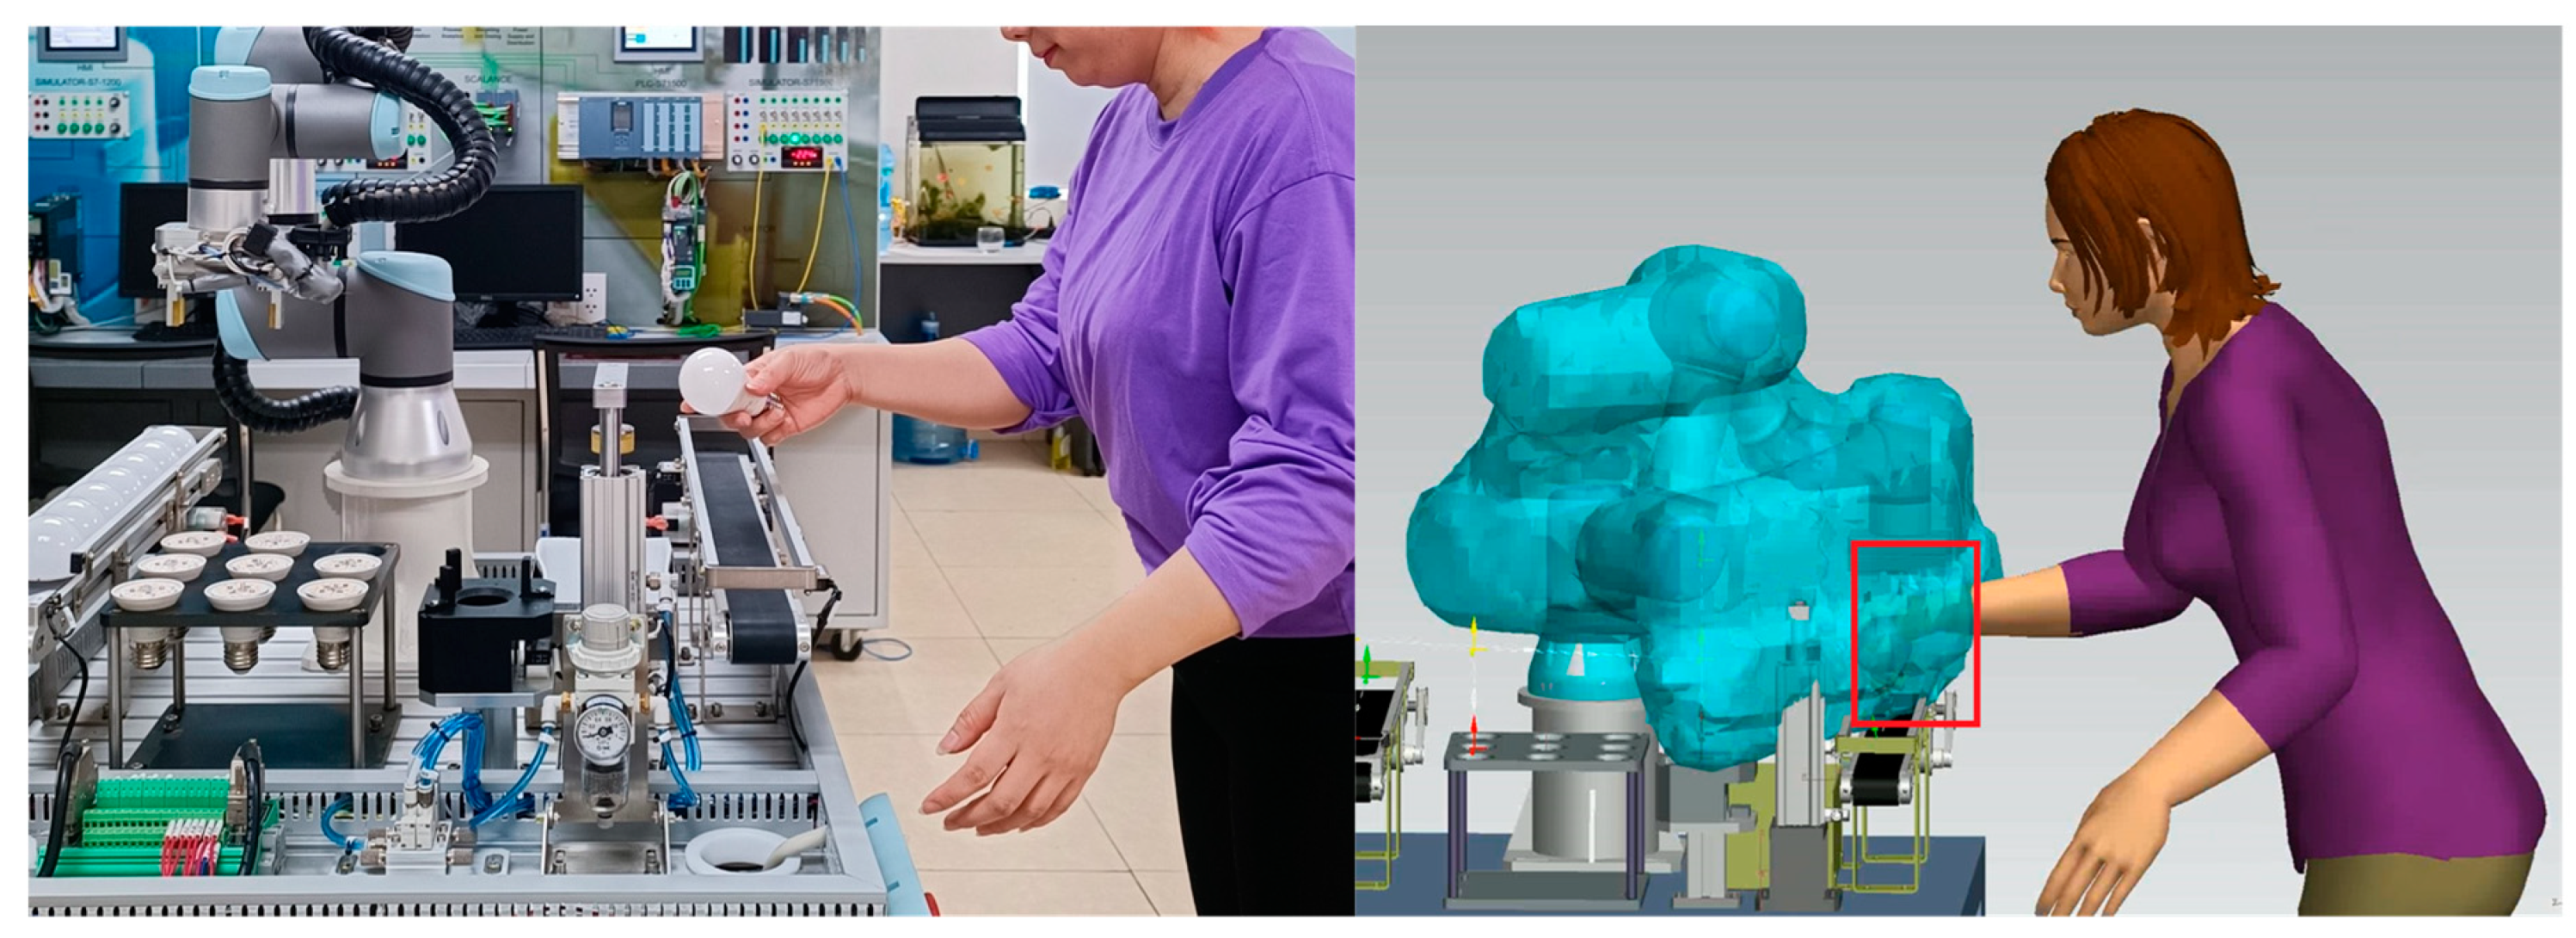
By observing the actual activity of the worker and the robot through a camera, we can determine that the operating speed and acceleration of the robot are 300 mm/s and 1300 mm/s2, respectively, and the average moving speed of the worker is 0.54 m/s. It is worth noting that the average time to complete the assembly of a single light bulb is 30 s.
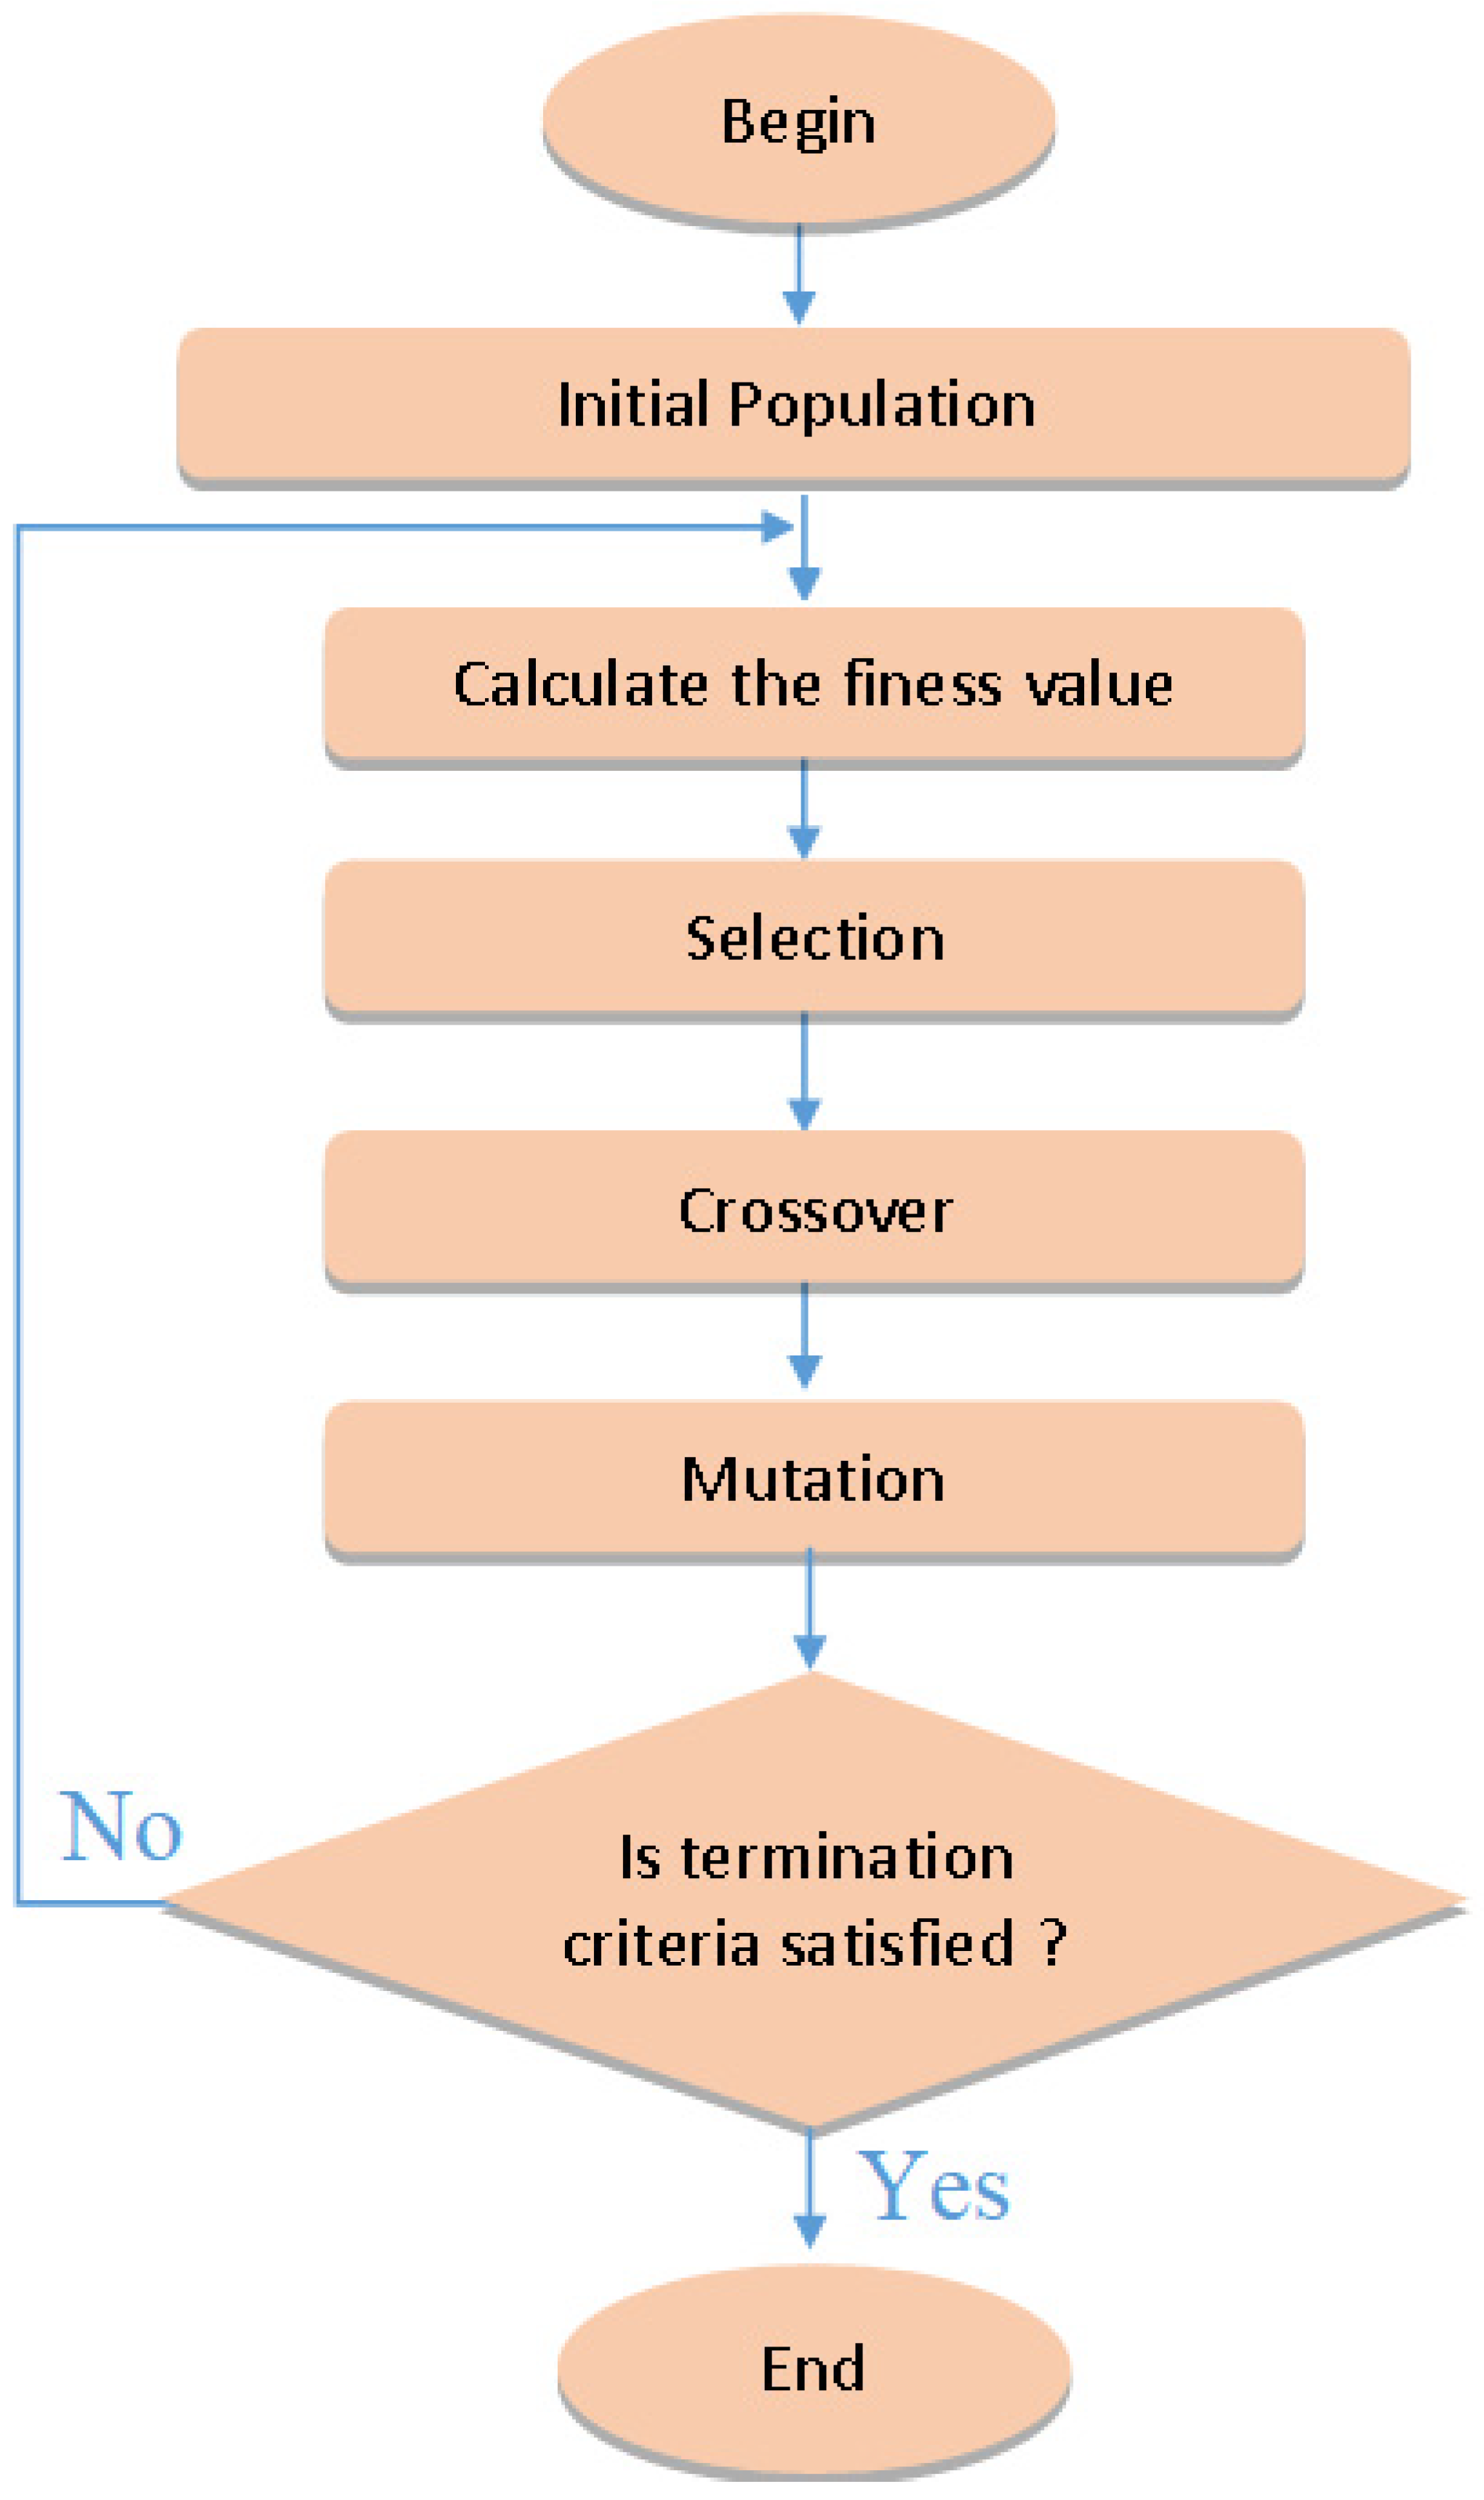
4.2. Designing a Multi-Adaptive Genetic Algorithm
A schematic diagram of the multi-adaptive genetic algorithm (MGA) is shown in
Figure 4 [
17].
A genetic algorithm applies the process of evolution in nature to solve optimization problems in practical applications. Starting from an initial population, an optimization function is created, and the optimal value is calculated to select the best-performing individuals. Then, the process of crossover and the impact of the mutation operator are performed to generate a new set of individuals with better optimal values. The process is repeated many times to allow for evolution. The final solution is an approximate optimal solution.
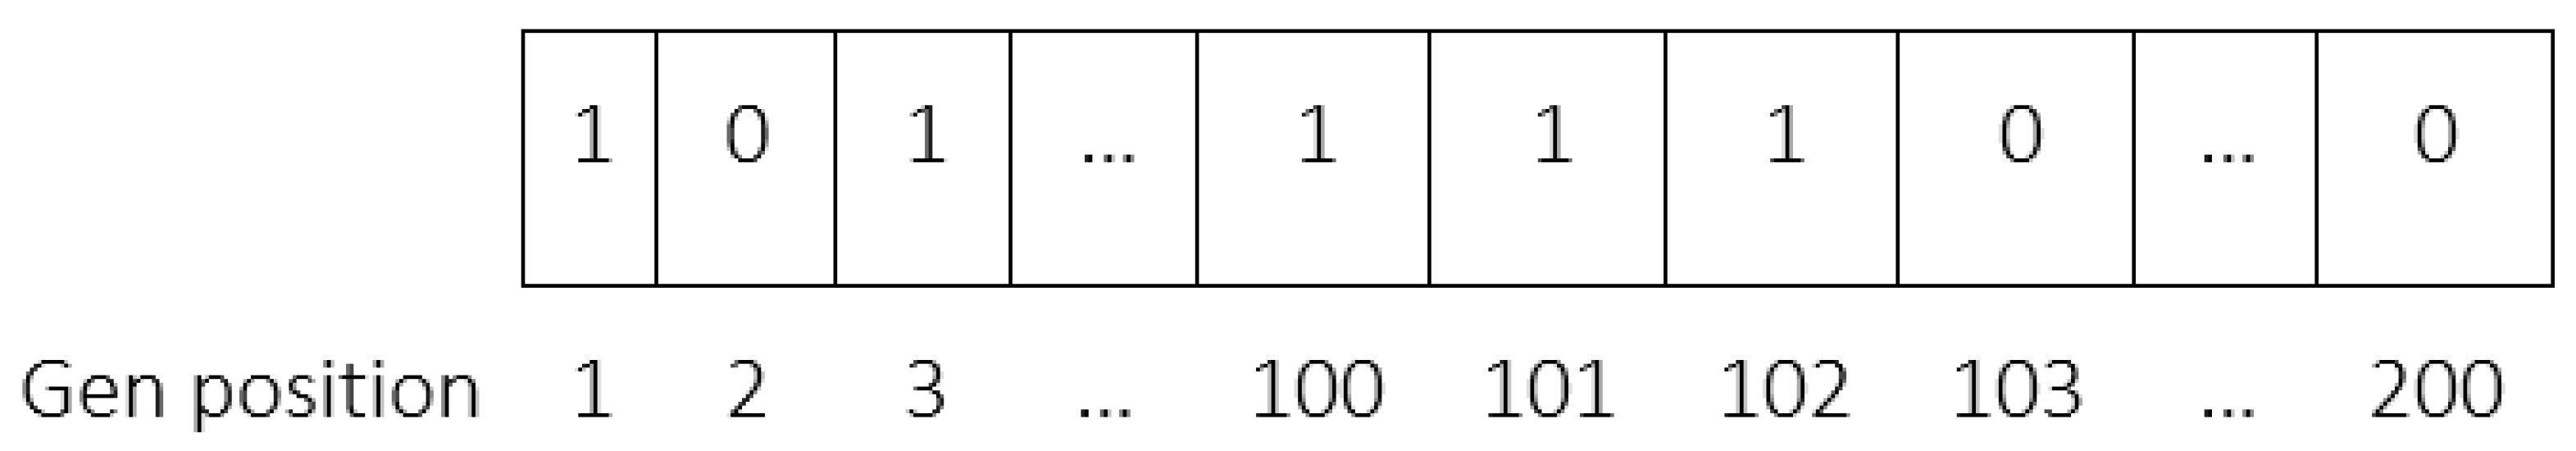
4.2.1. Chromosome Structure
‘N’ is the number of light bulbs that need to be assembled. The number of genes in a chromosome is twice the number of bulbs to be assembled, which is 2n. Each gene corresponds to a time slot of 30 s, which is the completion time of assembling a single light bulb. For instance, if we need to assemble 100 light bulbs, the chromosome consists of 200 genes, each of which corresponds to a 30 s time slot.
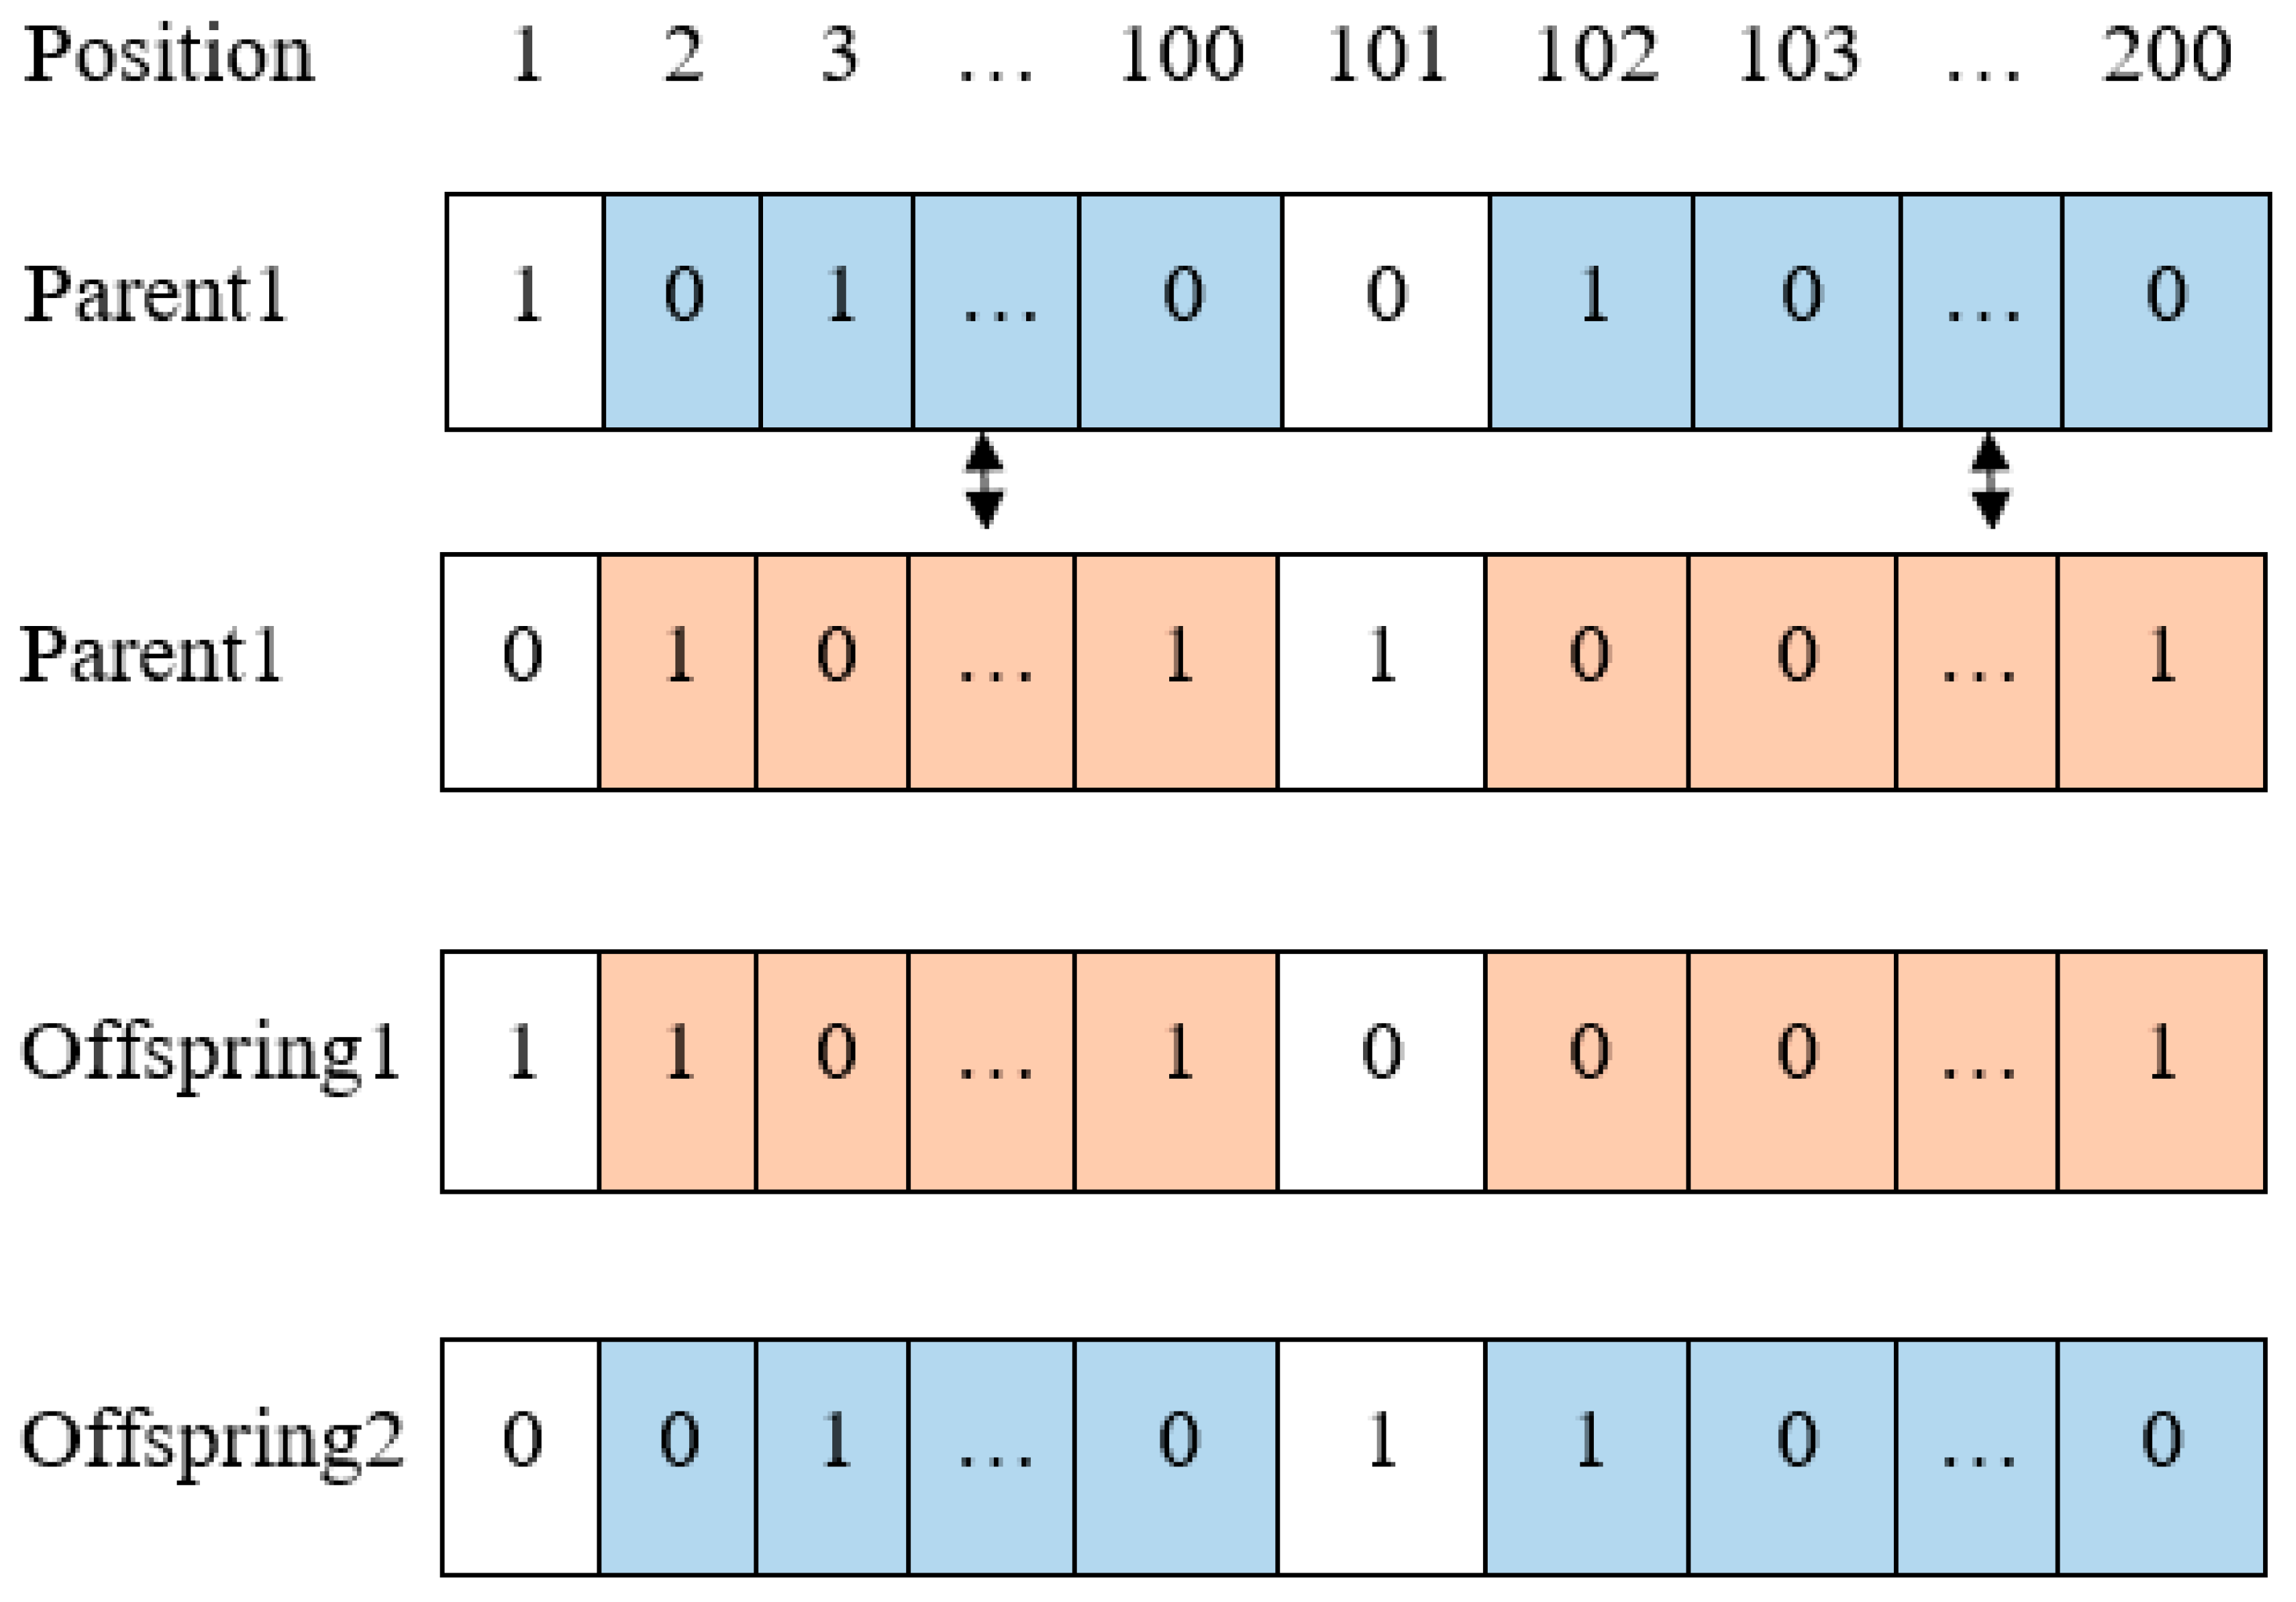
The first half of the chromosome indicates whether the worker is stationary or moving. The value ‘0’ means that the worker is stationary at the Home position, while the value ‘1’ means that the worker is moving to either Position 1 (socket providing) or Position 2 (bulb providing). The second half of the chromosome represents the direction of the worker’s movement. The value ‘1’ corresponds to the worker moving to Position 1, and the value ‘0’ corresponds to the worker moving to Position 2.
The first gene in the chromosome decides whether the worker moves from the Home position or not, and the (1 +
n)th gene determines the direction of movement at the beginning of the first 30 s. Therefore, the pair of genes (
i)th and (
i +
n)th determines whether the worker moves and which direction to move at the beginning of the (30 ×
i)th seconds. Chromosomes are paired as shown in
Figure 5.
The evaluation of the optimization criteria is based on the following parameters:
Es: this parameter assesses the level of available sockets on the pallet;
Eb: this parameter evaluates the level of available bulbs on the conveyor belt;
M: this parameter represents the optimal rating for the number of worker movements.
The formula for determining the Es index is:
For each gene index k (1 ≤ k ≤ n) on the chromosome, the value is calculated as follows:
If the left gene at position k has a value of 0 (the worker is not moving), or both left genes at positions k have a value of 1 and the corresponding right gene at position k + n has a value of 0 (the worker is moving and goes to Position 2 to provide bulbs), then is set to 0.
If the left gene at position
k and the corresponding right gene at position
k +
n both have a value of 1 (the worker moves to provide sockets), then
is calculated.
The time interval between the worker’s movement to Position 1 (to provide sockets) at the (k − 1)th and kth times is denoted by . The condition for avoiding a lack of sockets on the pallet is that the interval time between these two moves cannot be less than the time interval it takes the robot to assemble a number of bulbs equal to the maximum number of sockets on the pallet S. For instance, if the pallet can hold up to nine sockets, then S = 9. Therefore, is equal to the distance between the two genes responsible for moving to the pallet. If there are more than nine genes responsible for moving to the pallet, the robot is considered to be in a situation of material shortage and stops working. In this case, the parameter decreases and receives the inverse value of the parameter.
The index for assessing whether there are enough bulbs on the conveyor belt (Eb) has the same role as Es, and the formula for determining it is similar. The formula for determining the Eb parameter is:
where:
The time it takes for the worker to move between the (k − 1)th and kth positions for providing bulbs is denoted as . The maximum number of bulbs on the conveyor belt is B, and the value of is determined in a similar manner to .
The total number of stationary human gene positions M is calculated using the formula:
The genes encoded in the first half of the chromosome with a value of 1 correspond to the worker who moves during the assembly process. With a total time slot of 100, the number of genes assigned to the stationary worker is obtained by subtracting the number of genes assigned to the moving worker from 100. A greater number of stationary worker genes can be achieved by reducing the number of moving worker genes. The goal is to maximize the value of M. Pareto efficiency refers to the optimal allocation of resources in order to achieve the most efficient outcome [
18]. The fitness function, which encompasses all objectives, is formulated as follows:
In the multi-adaptive optimization problem, ωα represents the weight of the αth objective function, where the sum of all weights is equal to 1. The coefficient θα is used to adjust the range of values for the αth objective function, which helps to obtain a balanced range of values for all objectives.
For this particular study, the weights for the three objectives are 0.3, 0.3, and 0.4, respectively. To ensure that all objectives have a similar range of variation, adjustment coefficients of 1, 1.5, and 1.28 are used for the first, second, and third objectives, respectively.
The formula assigns weights based on the priority of each problem to be solved. After conducting experiments on the model, the values in Formula (9) are selected. The two parameters Es and Eb have equal priority and are of lesser importance than M. The overall fitness function is calculated using the following formula:
To determine the optimal value of the chromosomes, a maximization approach is utilized. The chromosome with a higher optimal value of f(x) is considered to be better and is, thus, preserved across generations.
According to [
19], the algorithm can be presented as below.
4.2.2. Initial Population
To begin the genetic algorithm, an initial population is randomly generated with randomly assigned genes. The resulting population has a certain level of diversity, but the optimality and fitness of the individuals are random. The size of the initial population greatly affects the efficiency of the algorithm. A small population with limited diversity may require many generations to produce optimal individuals, while a larger population with greater diversity may lead to faster convergence. However, it is important to balance the number of individuals with the number of genes and crossover rate to avoid duplications and save computational resources.
The initial population is created through a random process, but it is important to ensure that the initial population has sufficient diversity, meaning that the population entropy cannot be too small.
To represent and calculate population entropy, the solution space is divided into M non-overlapping regions (Q
1, Q
2, …, Q
M). The probability that an individual in the population belongs to Qi is denoted by
pi (
i = 1, 2, …, M). The population entropy of the
tth generation (
S(
t)) can be expressed as:
To estimate the population entropy, a range is used based on the fitness values instead of the solution space, where F
min represents the minimum fitness value from the initial iteration to the
tth generation, and F
max represents the maximum value. An expansion coefficient α (0 < α < 0.1) is used to expand the range ((1 − α)F
min, (1 + α)F
max). The entire interval is then divided into
N regions, where
N is the number of individuals in the population. The number of individuals whose fitness value falls within the
ith region is denoted by
li (
i = 1, 2, …,
N). The estimated value of
pi is calculated based on these values.
When the estimated value of
pi is substituted into Equation (12), it provides an estimation of the population entropy
:
4.2.3. Selection and Elitism
This study utilizes the roulette wheel selection [
20] method to select individuals for the next generation, and the best individual in each generation is directly transferred to the next generation in the elitism step.
4.2.4. Crossover
The first half of the chromosome (left) indicates whether the worker moves or not at the start of the time slot, and the second half (right) determines the direction of the movement. Because there is a correlation between the two halves of the chromosome, it is necessary to ensure that the information structure is not broken during the crossover operation. After the first half of the chromosome is exchanged with the infectious chromosomes, the corresponding left half also needs to be exchanged with the corresponding chromosomes to maintain the information structure. This process is illustrated in
Figure 6.
In this study, the crossover rate (
) is adaptively adjusted based on multiple factors. Initially, the basic crossover rate of the
tth generation (
) is determined using the population entropy, which is calculated by using the following equation:
The multi-adaptive adjustment of the crossover rate () in this study involves two steps. Firstly, the basic crossover rate () of the tth generation is determined based on the population entropy, where Smax is the maximum possible value of population entropy (i.e., Smax = lnN), and and are adjustable parameters. As population diversity decreases, the basic crossover rate increases to promote diversity.
Secondly, the crossover rate of an individual
() is determined based on its fitness value using Equation (15):
The formula determines the crossover rate () based on the fitness value of the two individuals being crossed over. The larger fitness value, denoted by F, results in a lower crossover rate, preserving the structure of the better individual. To maintain diversity in the population, a coefficient γ is used to increase the probability of individuals with lower fitness values entering the next generation.
4.2.5. Mutation
To preserve the diversity of both the population and individuals, a 0–1 variable (
) was introduced. If individual
i and individual
j differ in the
kth gene, then
equals 1; otherwise,
equals 0. The extent of diversity of the
kth gene in all individuals of the
tth generation population (
) can be mathematically represented as:
To determine the position for mutation in the mutation operation, the value of
is taken into consideration, where the probability of selecting the gene position for mutation increases as the genetic diversity decreases. Roulette wheel selection is used for this purpose. The mutation rate (
) in this study is also adaptively adjusted using a multi-step process. First, the basic mutation rate for the
tth generation (
) is calculated using 4.17, based on the population entropy.
The values of and can be adjusted as parameters, and, when the population diversity decreases, is increased to promote the creation of new individuals and improve population diversity.
After this, the mutation rate of an individual (
) is determined based on the individual’s fitness value using the following formula:
The mutation rate () of an individual is determined by its fitness value, as calculated by the following formula, where F is the fitness value of the individual after mutation. If the fitness value increases, the mutation rate is reduced to preserve the genes of high-performing individuals.
4.3. Results and Discussion
In
Section 4.2, the results and discussion of an experiment involving the assembly of 100 light bulbs are presented. Initially, a worker performs the assembly without using a genetic algorithm and relied on the worker’s observation and judgment to determine when to move to provide sockets and bulbs. Statistical data are collected over 30 rounds of observations, where 100 bulbs are assembled during each round, and the average number of moves made by the worker is found to be 42. Then, the same assembly task is performed using a genetic algorithm to determine when the worker moved and the direction of movement.
The equations to determine crossover rate and mutation rates are: pc = pc1Fmax/(γF), pc1 = pc2 + pc3(1 − β), pm = pm1Fmax/(γF), and pm1 = pm2 + pm3(1 − β).
During the actual experiment, appropriate parameter values are selected as follows:
pc2 = 0.6, pc3 = 0.3, pm2 = 0.04, pm3 = 0.06, γ = 2, and α = 0.08.
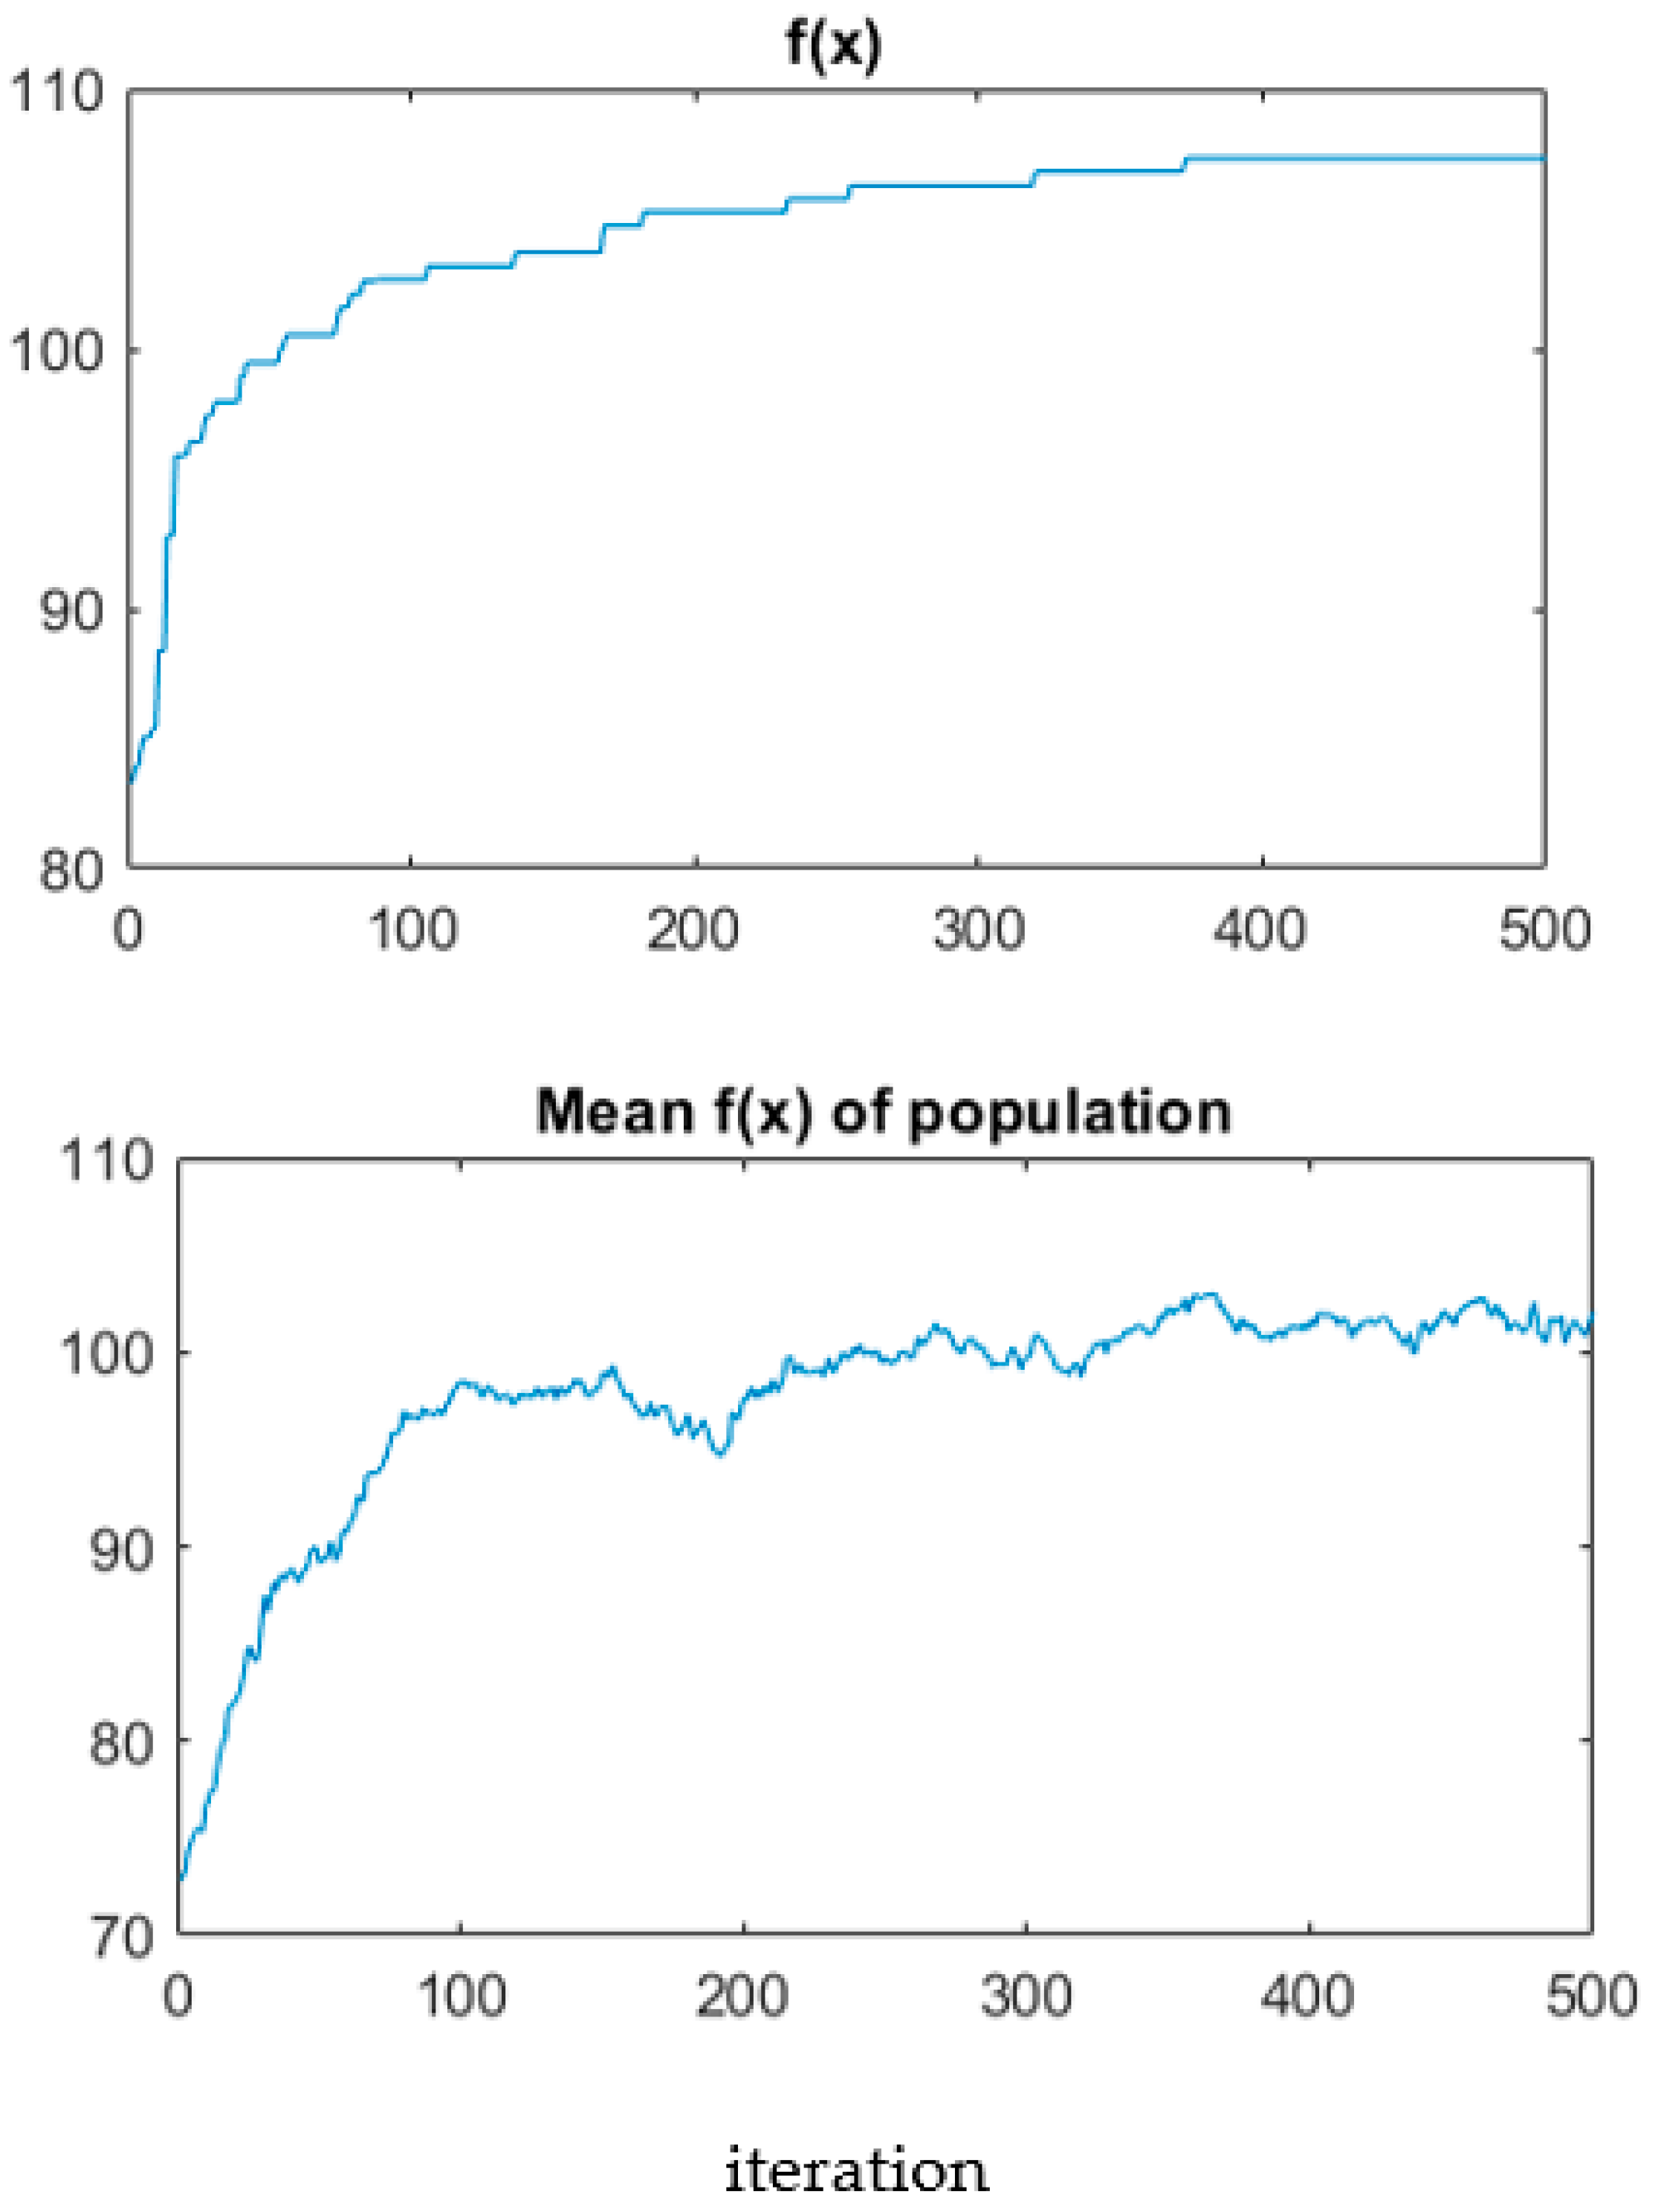
The MATLAB algorithm is executed 50 times with a population size of 100 for 500 iterations. The result of the average number of human movements is 36.48.
The performances of the algorithm in the experiment are shown in
Figure 7.
The graph indicates that the parameter f(x) consistently increases as generations progress, signifying that the individuals in the population improve over time.
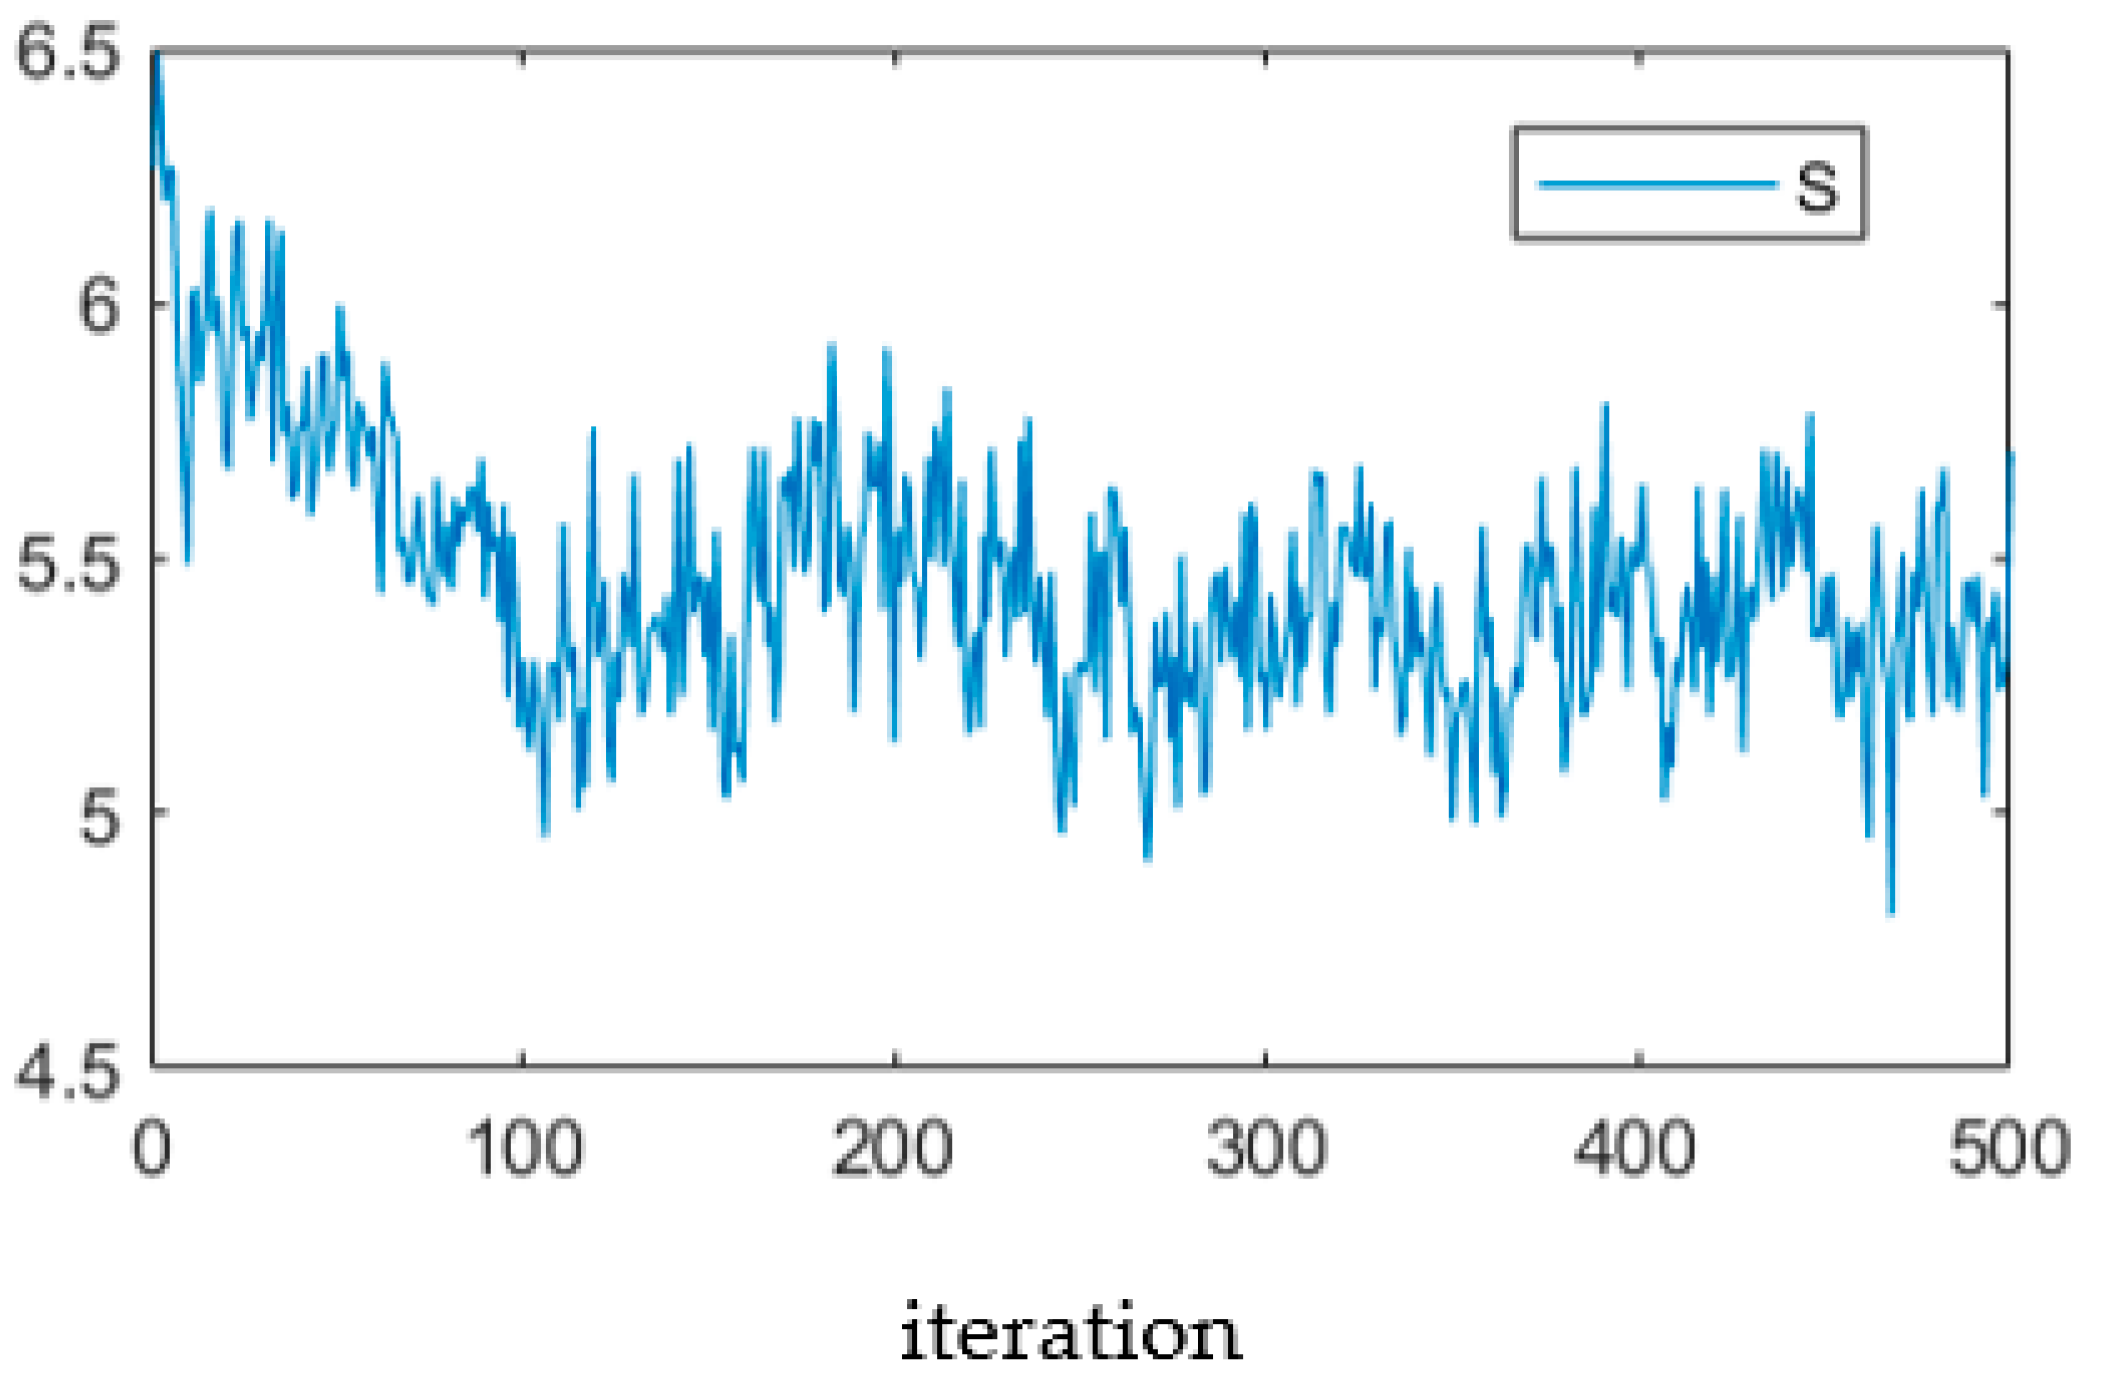
The changes in population entropy are shown in
Figure 8.
Figure 8 shows that the population’s S value tends to decrease, although it fluctuates strongly. The fluctuation in entropy is mostly caused by mutations that make the population less stable. Mutations are necessary to increase the population’s biodiversity. However, mutations also reduce the population’s stability.
Entropy is a scientific concept and a measurable physical property used to indicate a state of disorder, randomness, or uncertainty. Entropy (S) reflects the stability and uniformity of a population.
We can observe that the entropy of the population is highly dynamic but tends to decrease over time. The fluctuations in entropy are mainly caused by the impact of mutations that disrupt the stability of the population. The presence of mutations is necessary as it increases the biological diversity of the population. However, excessive mutations can also lead to a reduction in population stability and imbalance in the population’s various indices.
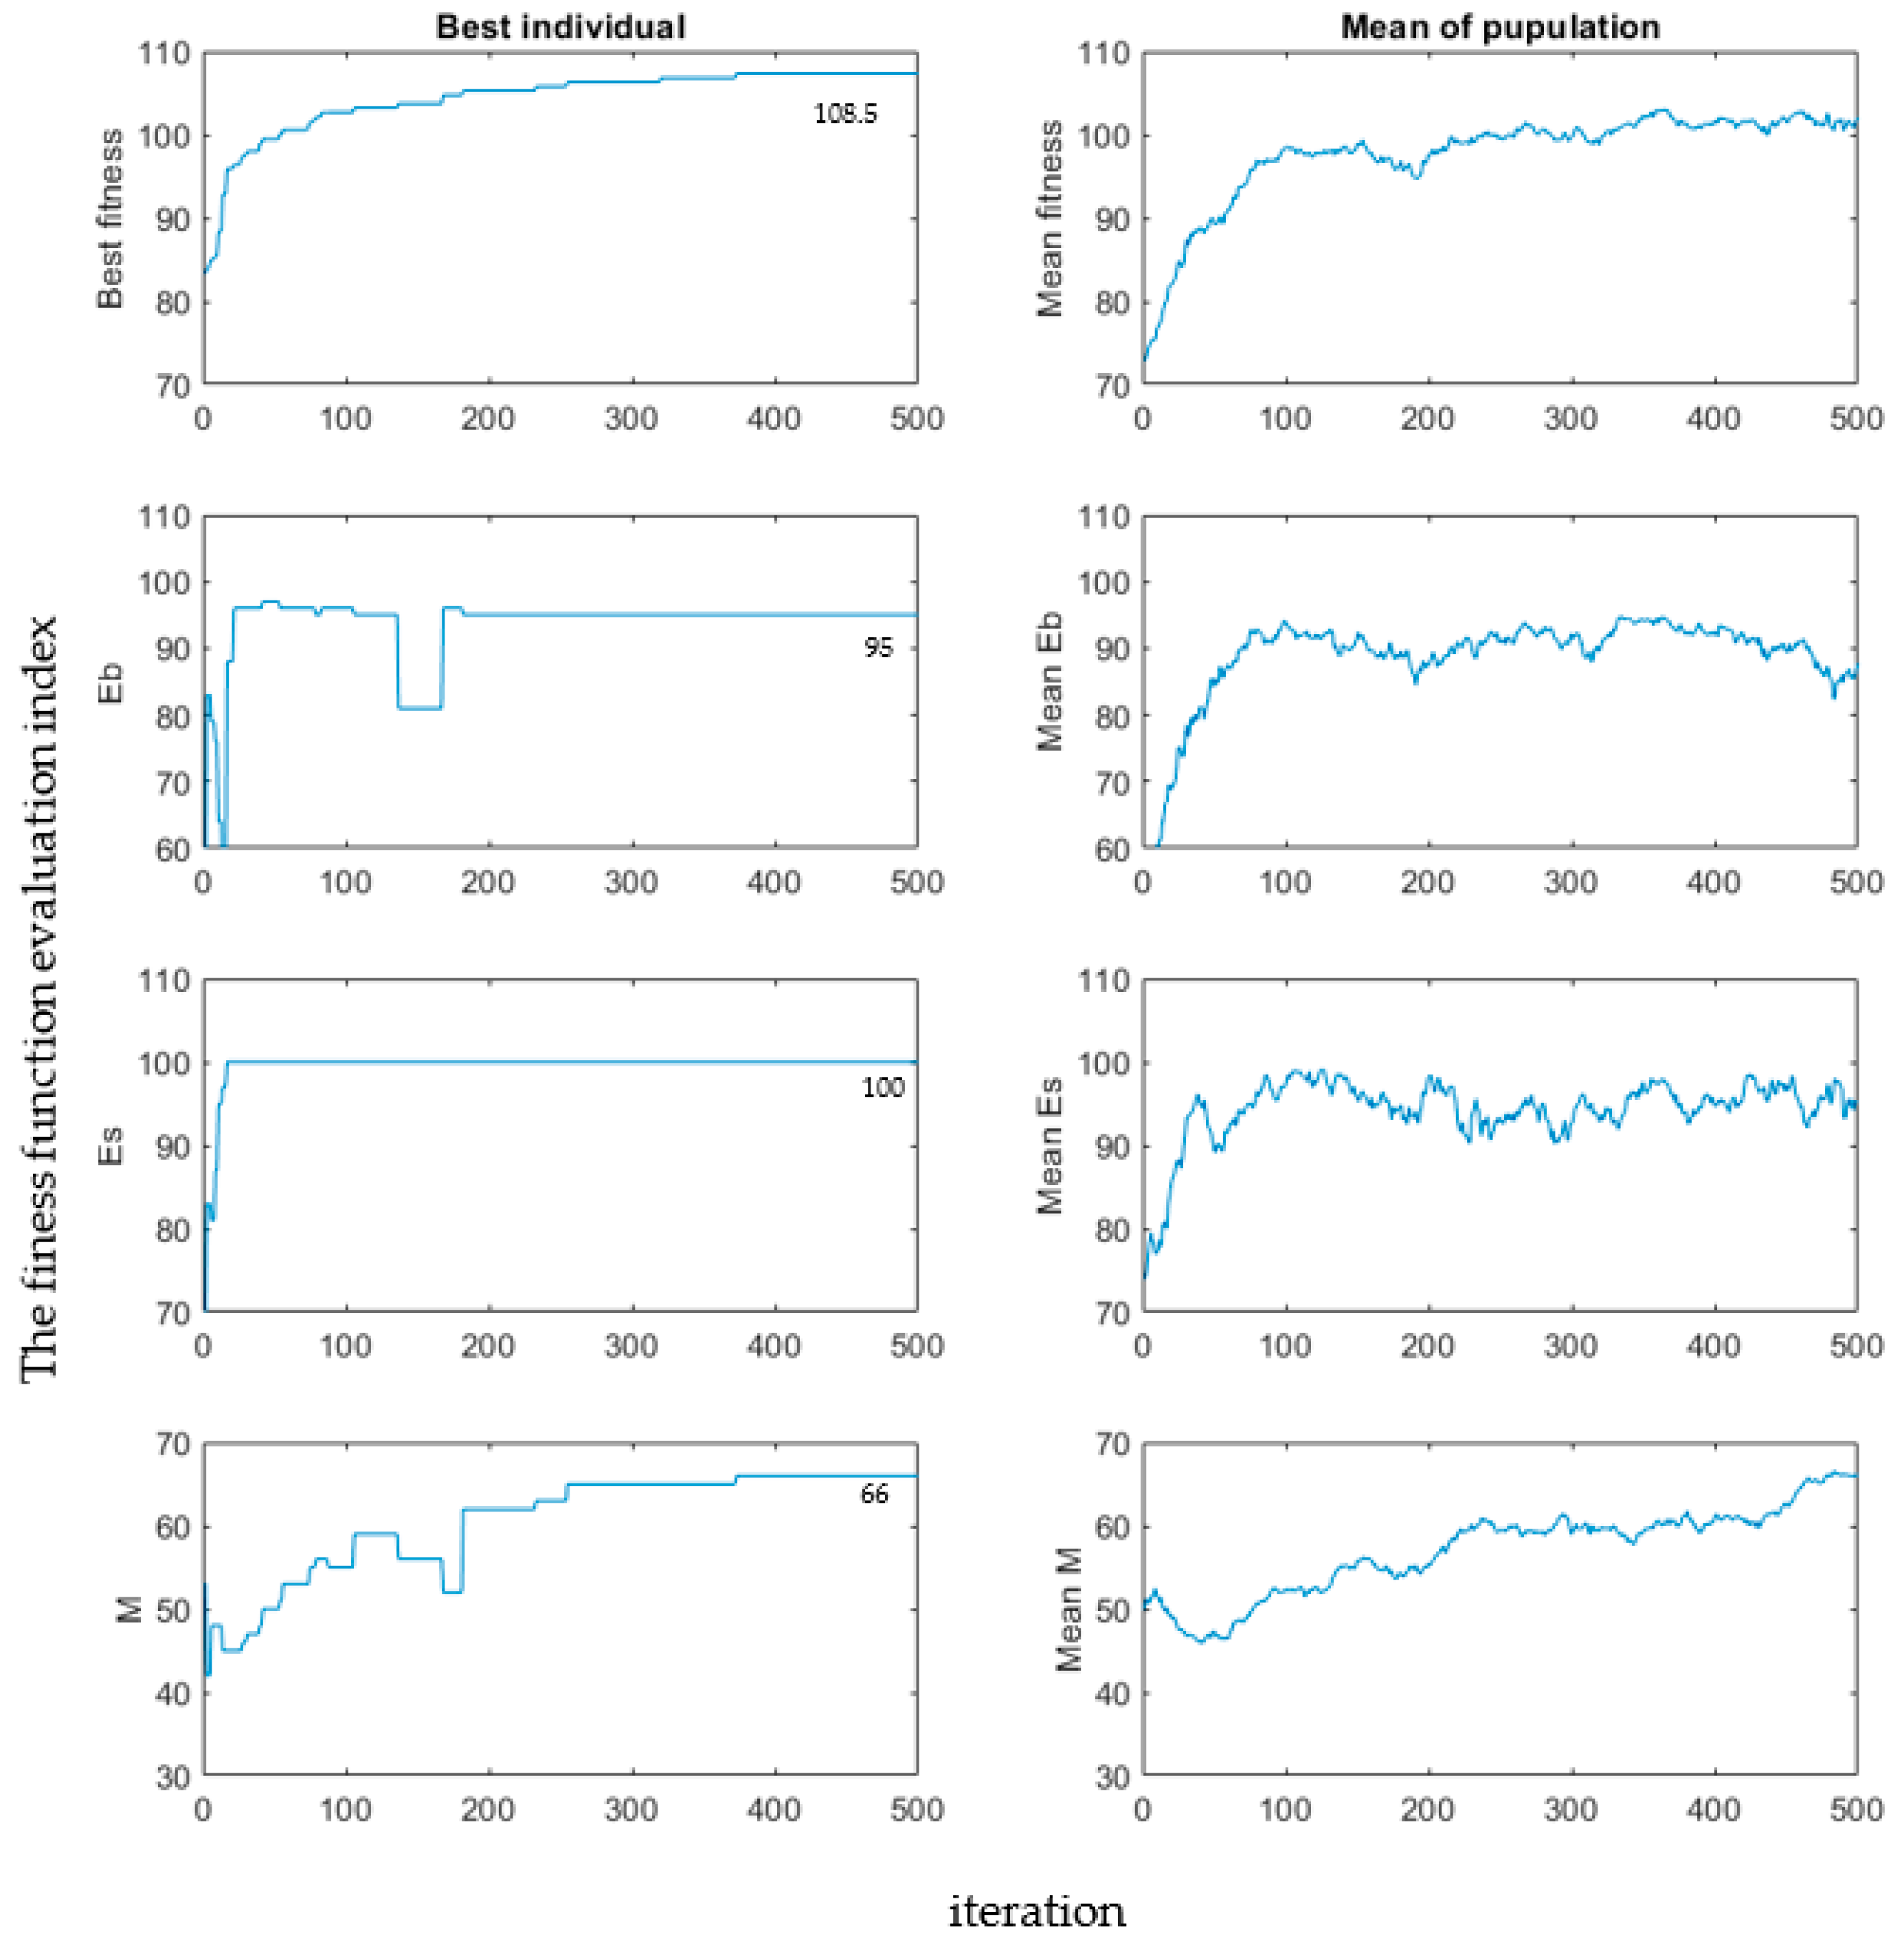
Figure 9 illustrates the variation of data for the mean and best individual values of the Es, Eb, M, and f(x) values.
The miniaturized system’s data changes indicate the average and optimal values of the population for each genetic generation. The best individual for each generation shows strong fluctuations in the initial and competitive stages of the three optimal parameters. Once Eb (30%) and Es (30%) reach a steady state, the algorithm continues to adjust parameter M (40%) until it also reaches a steady state. As for the mean parameters, which are the population’s average values for each genetic generation, they generally increase over time, exhibiting a similar trend to the best individual parameters, indicating that the population is moving towards the best individual.
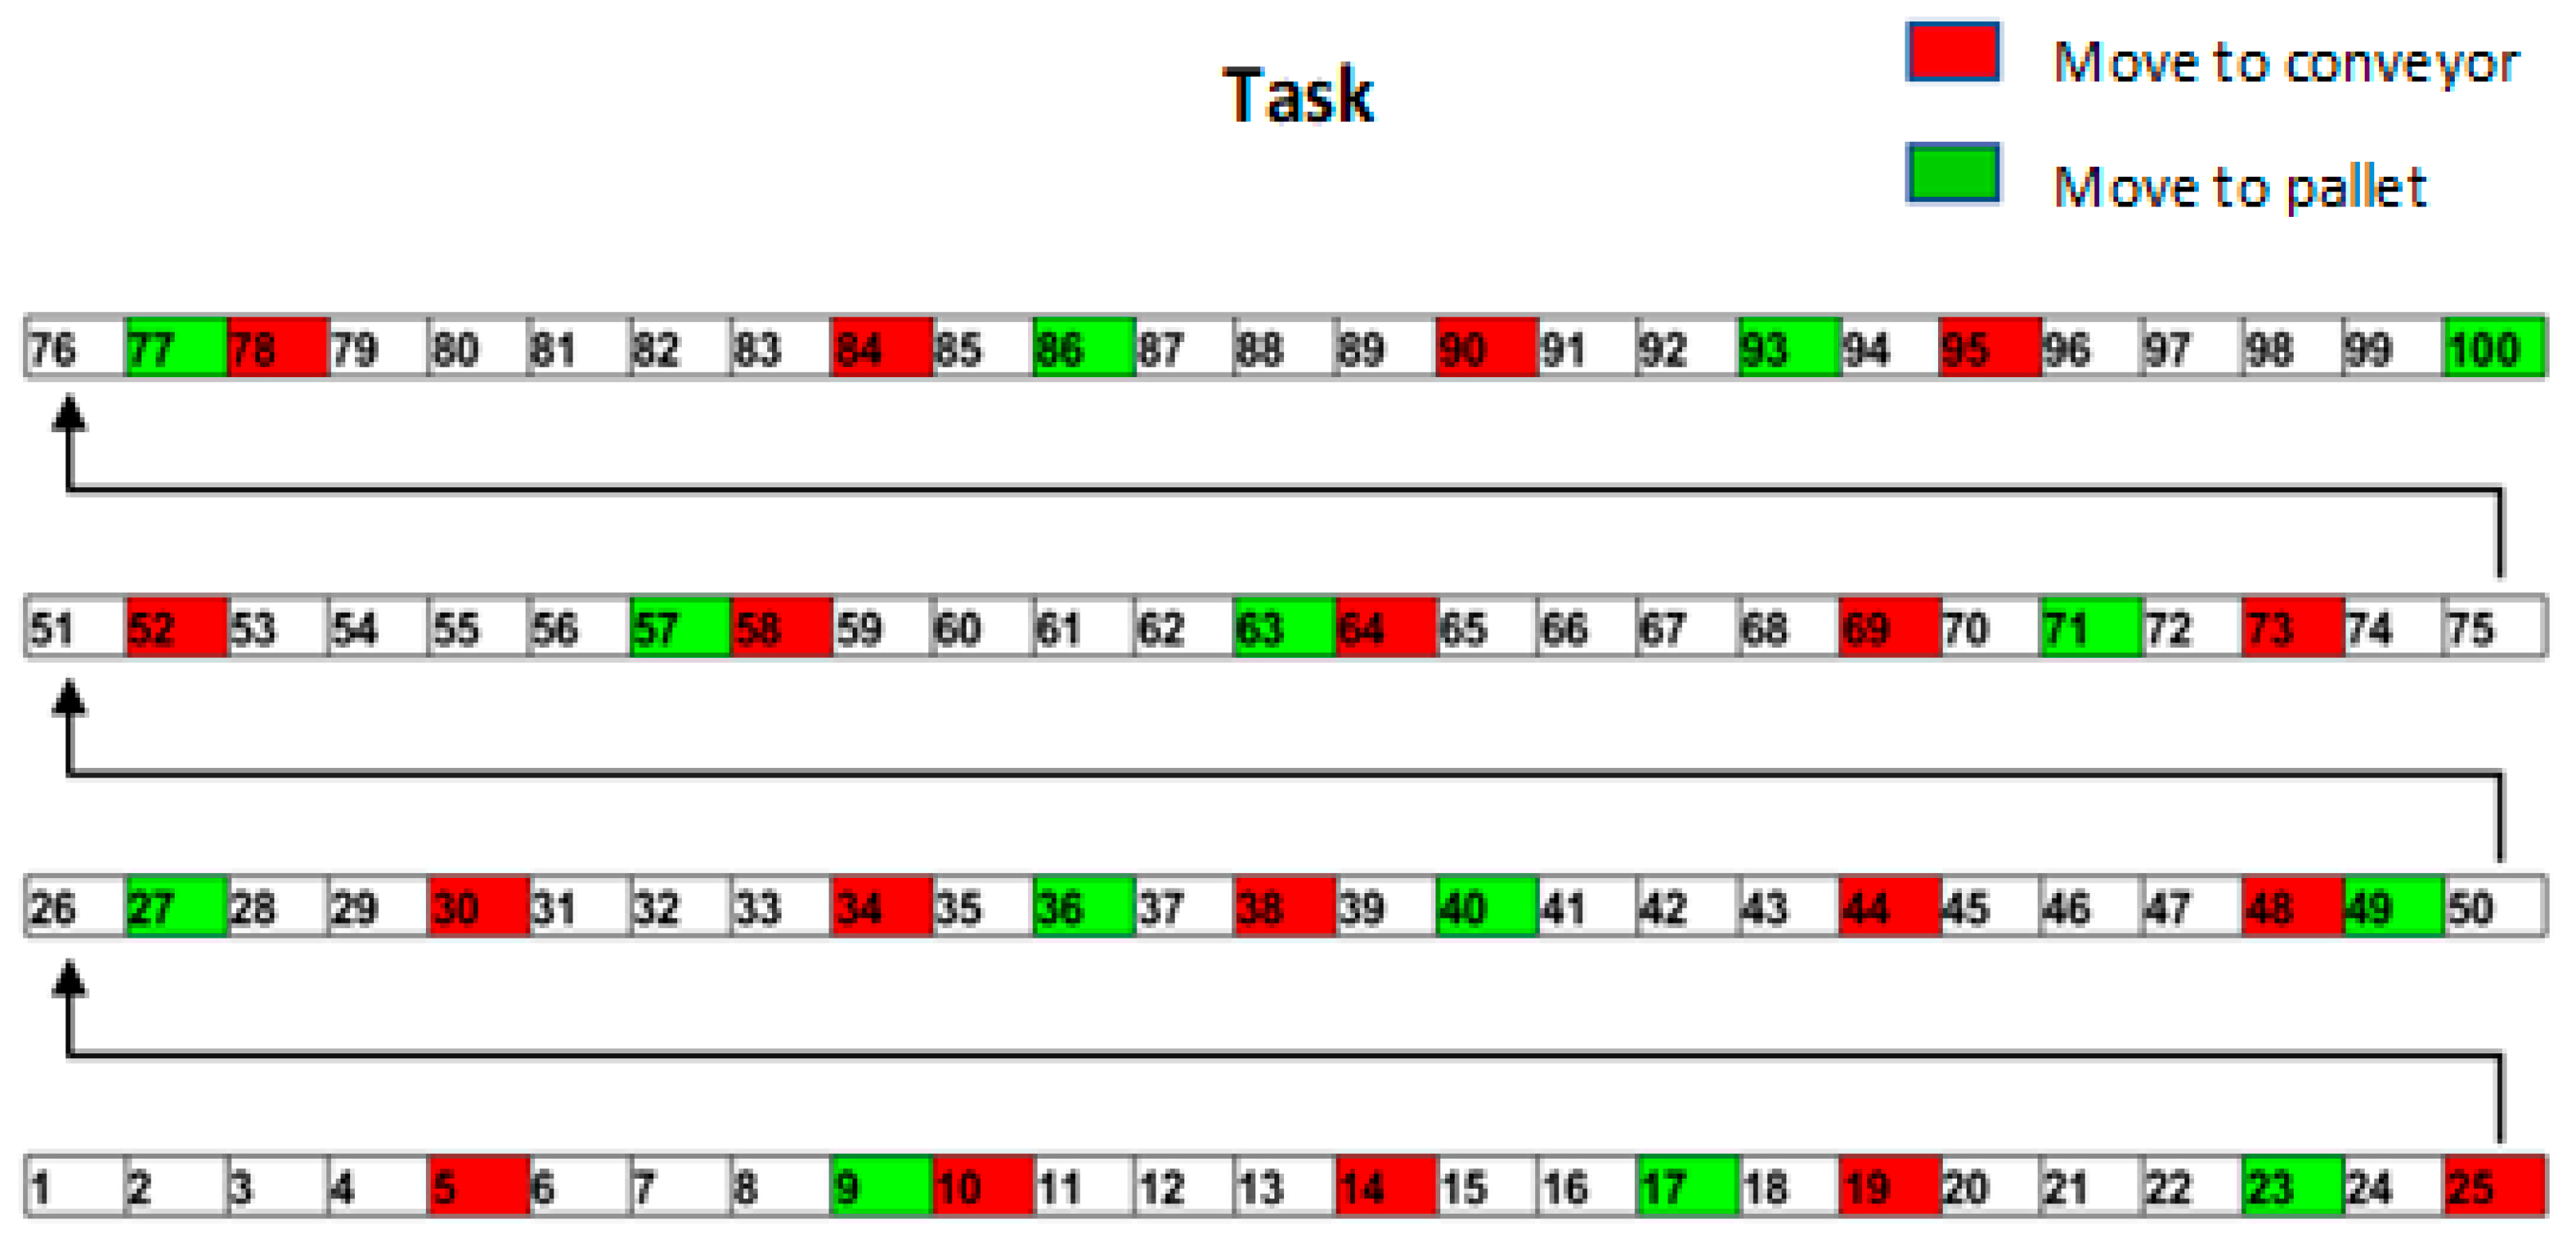
The output is a graphical representation of the assembly process, which includes assigning tasks to the worker and collaborating with the robot to ensure efficient operation. The process is divided into 100 cells that represent 30 s time slots. The color of each cell indicates the corresponding task: white represents the worker standing still, green indicates going to the pallet to provide sockets, and red represents going to the conveyor belt to provide bulbs.
Figure 10 illustrates this in detail.
Figure 10 illustrates the optimized workflow of the best individual obtained from the algorithm. The total working time is 3000 s. The process is divided into 100 cells that represent 30 s time slots. The color of each cell indicates the corresponding task; white represents the worker standing still, green indicates going to the pallet to provide sockets, and red represents going to the conveyor belt to provide bulbs.
Figure 9 illustrates this in detail.
Cells 1, 2, 3, and 4, in white, represent the first 120 s (30 s × 4) during which the person stands still in the Home position and does not move. Cell 5, in red, represents the worker moving to the conveyor to supply additional bulb caps at second 121 and then returning to the Home position. Cells 6, 7, and 8, in white, represent the next 90 s (from second 151 to second 240), during which the worker stands still in the Home position. Cell 9 (from second 241 to 270), in green, represents the worker moving to the pallet to supply socket materials to the system. An integrated speaker system follows the signal of each time slot to notify the person whether to stand still or move and in which direction to move.
The worker activities are optimized to minimize movement. The time between movement activities is consistent and does not overlap to ensure that the robot has sufficient materials to operate.
Before using the multi-adaptive genetic algorithm, four people assemble 100 light bulbs in 50 rounds based on their observation ability, and a camera is used to record information. The average results of all four participants in the experiment are: the average number of times the cap is supplied is 25.85 times; the average number of times the tube is supplied is 21.03 times; the total number of movements is 46.87 times.
After 50 runs of the MATLAB software program using the MGA algorithm, the average number of cap supplies is 21.52. The number of tube supplies is 15.02, and the total number of movements is 36.54.
After applying the multi-adaptive genetic algorithm, the number of movements of the person decreases by about 22%.


