Article

A Study on Detection of Malicious Behavior Based on Host Process Data Using Machine Learning

1
Department of Multimedia Engineering, Dongguk University, Seoul 04620, Republic of Korea
2
Department of Computer Engineering, Sejong University, Seoul 05006, Republic of Korea
3
Department of Convergence Engineering for Intelligent Drones, Sejong University, Seoul 05006, Republic of Korea
*
Author to whom correspondence should be addressed.
Appl. Sci. 2023, 13(7), 4097; https://doi.org/10.3390/app13074097
Submission received: 3 March 2023 / Revised: 18 March 2023 / Accepted: 22 March 2023 / Published: 23 March 2023

Abstract

:
With the rapid increase in the number of cyber-attacks, detecting and preventing malicious behavior has become more important than ever before. In this study, we propose a method for detecting and classifying malicious behavior in host process data using machine learning algorithms. One of the challenges in this study is dealing with high-dimensional and imbalanced data. To address this, we first preprocessed the data using Principal Component Analysis (PCA) and Uniform Manifold Approximation and Projection (UMAP) to reduce the dimensions of the data and visualize the distribution. We then used the Adaptive Synthetic (ADASYN) and Synthetic Minority Over-sampling Technique (SMOTE) to handle the imbalanced data. We trained and evaluated the performance of the models using various machine learning algorithms, such as K-Nearest Neighbor, Naive Bayes, Random Forest, Autoencoder, and Memory-Augmented Deep Autoencoder (MemAE). Our results show that the preprocessed datasets using both ADASYN and SMOTE significantly improved the performance of all models, achieving higher precision, recall, and F1-Score values. Notably, the best performance was obtained when using the preprocessed dataset (SMOTE) with the MemAE model, yielding an F1-Score of 1.00. The evaluation was also conducted by measuring the Area Under the Receiver Operating Characteristic Curve (AUROC), which showed that all models performed well with an AUROC of over 90%. Our proposed method provides a promising approach for detecting and classifying malicious behavior in host process data using machine learning algorithms, which can be used in various fields such as anomaly detection and medical diagnosis.

1. Introduction

With the popularization of smartphones, there has been a rapid growth of cyberspace, resulting in the development of an information society where all tasks are carried out in cyberspace [1]. However, such progress also provides attackers with a good opportunity to act maliciously.
Just three days after the Ukrainian invasion, on 27 February, cyber-attacks on the Ukrainian government/military increased by 196%, and in Russia, cyber-attacks on organizations increased by 4%. As shown in Figure 1, the weekly average cyber-attacks on the education/research industry increased by 18% compared to the previous year, followed by a 20% increase in the weekly average cyber-attacks on the government/military industry [2].
Cyber-attacks continue to increase every year, and many efforts are being made to prevent and detect them. Within companies, the usual way for ordinary employees to detect cyber-attacks is to install virus vaccines, malware prevention, and spyware prevention software on all devices that can be connected to cyberspace. This method involves running checks every midnight or overnight to prevent attacks. The disadvantage of this method is that it searches for known malicious files or computer memory [3]. Many studies for detecting cyber-attacks utilize pre-classified data by attack types [4,5,6,7,8,9]. This is an effective method for defending against known attacks. However, it is vulnerable to new attacks such as Advanced Persistent Threats (APT). A cyber-attack detection method that maintains and monitors detection logs identifies suspicious processes and regularly backs up and stores logs can provide some protection against APT attacks. However, cyber-attacks can be executed within minutes or even seconds, faster than human behavior. Thus, it is impossible to perfectly respond to APT attacks. In addition, monitoring detection logs requires shift work, resulting in high labor costs. To address this situation, automated technologies for detecting malicious behavior are necessary.
This paper emphasizes the critical importance of detecting and preventing cyber-attacks in today’s information society, where nearly all tasks are performed in cyberspace. It analyzes the limitations of existing methods that rely on pre-classified data by attack types and underscores the need for automated technologies to detect malicious behavior. To that end, the study proposes an approach that utilizes various machine learning algorithms to classify data as either malicious or normal. The proposed methodology integrates technologies such as machine learning algorithms to improve the performance of the models. The results of this study provide a valuable contribution to the field of cybersecurity.
In this study, we propose a method to detect malicious behavior (abnormal behavior) that occurs in cyber-attacks such as APT attacks in real-time using machine learning. To this end, we review related studies on cyber-attack detection based on behavior in Section 2 and introduce machine learning models for training normal and abnormal activity data. In Section 3, we describe the test environment for the experiments, and introduce and collect normal and abnormal activity data for a specific application. We then preprocess the normal and abnormal activity data and train the model. In Section 4, we present the experimental results, and in the final Section 5, we provide a summary of the study, future works, and practical applications.

2. Related Works

2.1. Research on Behavior-Based Cyber-Attack Detection

Aslan, O., et al. [10] proposed a malware detection system that operates in a cloud computing environment. The system’s behavior-based detection agents generate behaviors and features, considering system calls, system call types, system call paths, system resources, and various file types. To generate the training data, the authors collected malware samples from various sources including Das Malwerk, MalwareBazaar, Malware DB, Malware Benchmark, Malshare, Tekdefense, ViruSign, VirusShare, and KernelMode [11,12,13,14,15,16,17,18]. They then used machine learning algorithms such as J48 [19], Random Forest (RF) [20], logistic model trees (LMT) [21], and K-Nearest Neighbors (KNN) [22] to detect malicious behavior.
Jones, C.B., et al. [23] proposed an online anomaly detection method using the existing Adaptive Resonance Theory (ART) [24] algorithm. They deployed an intrusion detection system (IDS) in a real environment to collect behavioral data from hosts over a period of 72 h, including both normal and abnormal data. Adversarial behavior was identified through the analysis of ART algorithms.
Sarker, I.H. [25] proposed a Cyberlearning model to detect various types of attacks and anomalies such as Denial-of-Service (DoS), backdoors, and worms. When training the model, datasets such as UNSW-NB15 [26] and NSL-KDD [27] were used, and malicious behavior patterns were learned using Naïve Bayes (NB) [28], Linear Discriminant Analysis (LDA) [29], KNN, Extreme Gradient Boosting (XGBoost) [30], RF, Support Vector Machines (SVM) [31], Adaptive Boosting (AdaBoost) [32], Stochastic Gradient Descent (SGD) [33], and Logistic regression (LR) [34]. The model successfully detected various types of attacks.
Ibrahim, W.N.H., et al. [35] developed a botnet detection system that focused on identifying command and control servers based on network behavior. The authors used a flow-based behavior analysis that aggregated packet headers at 1-s intervals to analyze network traffic. The dataset used in this experiment was the CTU-13 dataset [36], which contains network traffic captured at CTU University, Czech Republic, in 2011 and labeled as Normal, Attack, or Background. The dataset includes various botnet types with centralized or decentralized structures and different protocols. The authors designed a structure- and protocol-independent botnet detection system that leveraged machine learning algorithms such as KNN, SVM, and Multilayer Perceptron (MLP) [37]. Through this analysis, they were able to detect whether packets were encapsulated, such as passing through a Virtual Private Network tunnel.
Wang, S., et al. [38] developed a graph-based invariant modeling approach for detecting malware called MatchGNet. To generate training data, the authors downloaded 10,000 known malicious programs and 10,000 benign programs from VirusTotal and extracted API call sequences and system events from each. They converted the data into heterogeneous graphs and used it to train the MatchGNet model. In addition, 5000 unknown malware and 5000 legitimate programs were downloaded from the Malware Zoo [13] and converted into heterogeneous graphs as well. MatchGNet was compared with other machine learning algorithms such as SVM, LR, MLP, and Graph Convolution Network (GCN) [39]. The proposed approach demonstrated high accuracy, achieving 97% in detecting malware.
Han, X., et al. [40] proposed an intelligent persistent threat detection model called UNICORN, which is based on behavioral analysis to identify APT attacks. To collect data for their study, the authors used a dynamic analysis tool called Cuckoo Sandbox to execute 20,000 known malicious programs and 20,000 benign programs. UNICORN was then applied to simulated and actual APT attack scenarios, demonstrating a 30% increase in accuracy compared to previous detection methods.
Ranjan, R., et al. [41] proposed a user behavior analysis system by combining big data analysis of application layer logs with RF algorithms. They collected application layer logs generated by web servers and web applications for a total of 12 months from January 2019 to December 2019. The system involved data preprocessing, data transformation, data analysis using RF algorithm, and result visualization. This approach could distinguish malicious users from normal users more accurately than existing signature-based methods and had the advantage of real-time detection and blocking. However, there were limitations in data collection, machine learning algorithms, and results visualization.
In related studies, there are research papers that propose behavior-based detection methods for detecting cyber-attacks, as shown in Table 1. However, most of these studies have focused on detecting anomalous behaviors in host data using system call data, and machine learning algorithms such as KNN and SVM are commonly used for detection (Aslan, O., et al. [10]; Sarker, I.H. [25]; Ibrahim, W.N.H., et al. [35]; Wang, S., et al. [38]). To make these detection methods more robust, cyber-attacks should be detected based on process data of applications used in hosts. Therefore, in this study, anomalous behavior is detected in real-time based on application process data, which is a different approach from that used in other studies. These studies have laid the groundwork for behavior-based cyber-attack detection using various data sources, machine learning algorithms, and techniques. However, there are some limitations that can be addressed in future research, such as improving data collection, validating algorithm performance, enhancing result visualization, and expanding the scope of detection methods to cover a wider range of cyber threats. By addressing these limitations, this paper presents a more efficient and resilient behavior-based detection algorithm that offers enhanced protection against cyber-attacks.

2.2. Machine Learning Algorithms

As investigated in Section 2.1, various algorithms have been employed for anomaly detection in related works. In this experiment, we selected KNN, NB, RF, Autoencoder (AE) [42], and Memory-augmented Deep Autoencoder (MemAE) [43] as our machine learning algorithms, based on their performance and suitability for the task.
The reasons for selecting these specific algorithms are as follows:
  • KNN: KNN is a simple and effective algorithm that has been used in many cyber-attack detection studies, including Aslan, O., et al. [10], Sarker, I.H. [25], and Ibrahim, W.N.H., et al. [35]. Its non-parametric nature and ease of implementation make it a popular choice for anomaly detection tasks.
  • NB: Naïve Bayes is a probabilistic classifier that has been employed in various cyber-attack detection research, such as Sarker, I.H. [25]. It is computationally efficient and performs well with discrete data, making it a suitable choice for our study.
  • RF: Random Forest is an ensemble learning method that has demonstrated high performance in multiple cyber-attack detection studies, including Aslan, O., et al. [10], Sarker, I.H. [25] and Ranjan, R., et al. [41]. Its ability to handle large datasets and perform feature selection makes it a relevant choice for our experiment.
  • AE: Autoencoders are unsupervised learning models that have been used in anomaly detection tasks due to their ability to learn useful representations of data. In this study, we chose AE for its potential to capture complex patterns in the application process data.
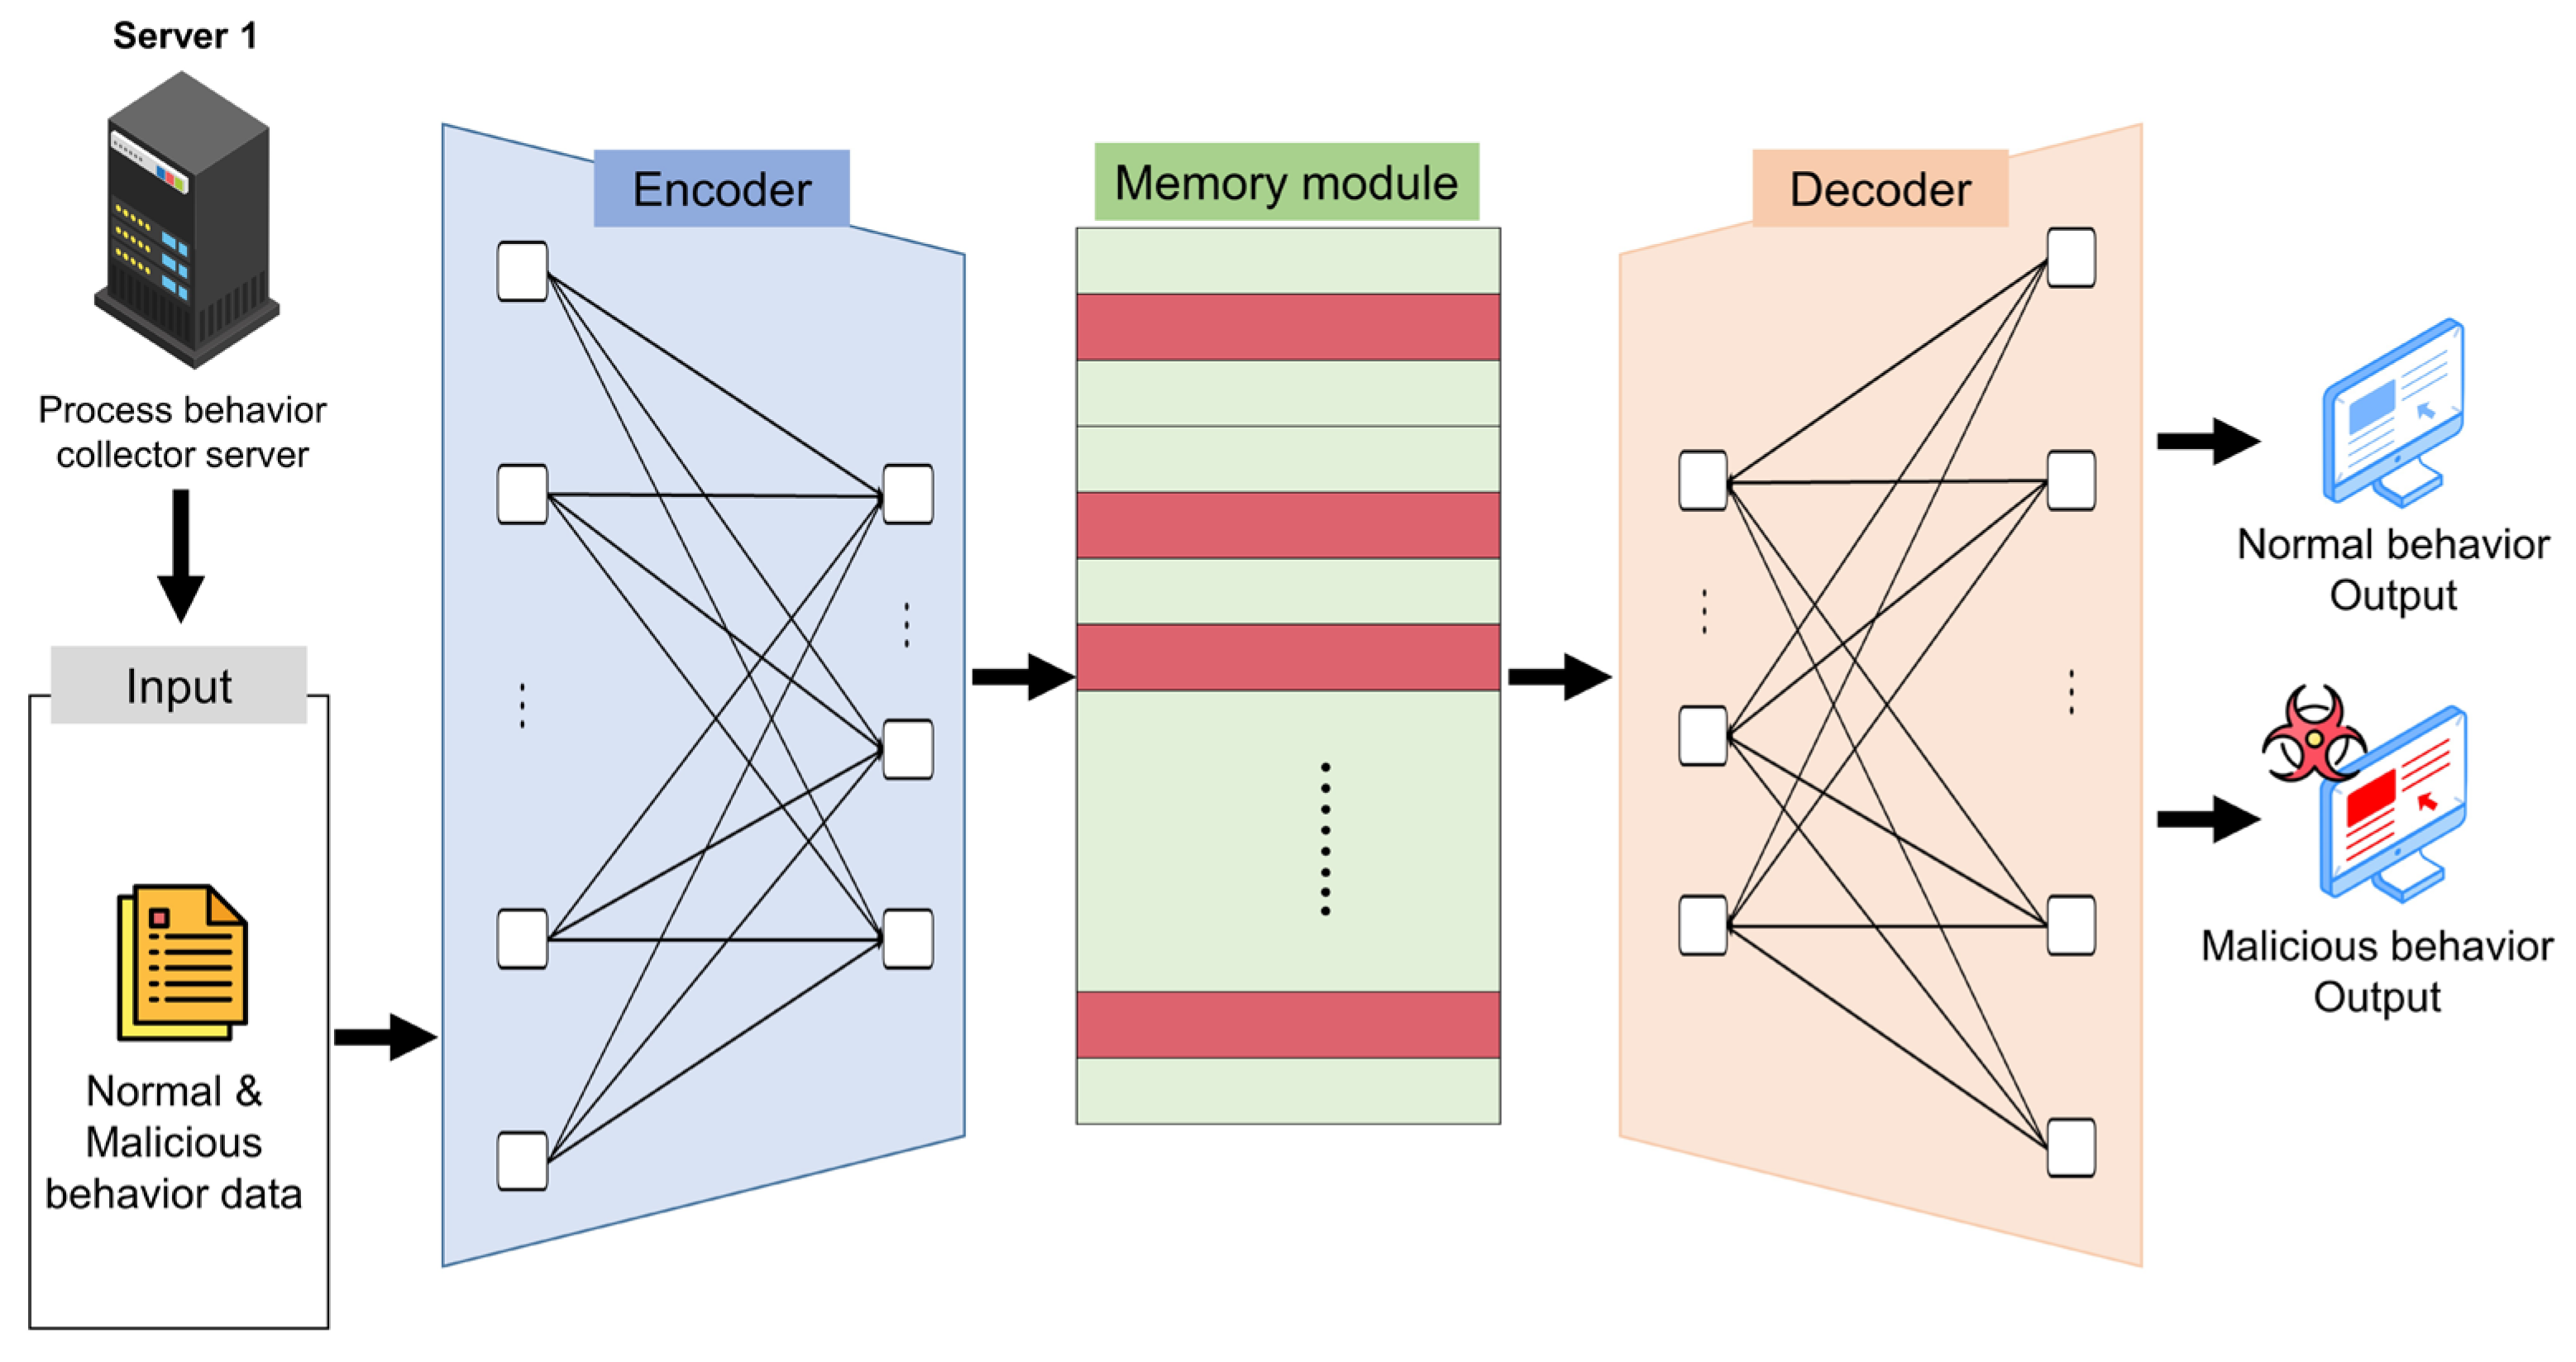
  • MemAE: Memory-augmented Deep Autoencoder is a deep learning model that incorporates memory mechanisms to enhance the representation learning capabilities of autoencoders. MemAE was selected for this study as it has demonstrated promising performance in detecting anomalies, particularly in complex and high-dimensional data.

2.2.1. K-Nearest Neighbors (KNN)

To detect anomalies in a dataset, it is necessary to measure the degree to which an anomaly is far from “normal” data points. KNN anomaly detection performs this task based on distance. Specifically, it finds the K-nearest neighbors of a given data point and measures the distance to them. If the distance between a given data point and its K-nearest neighbors is far, then the data point is considered an anomaly. Here, K is a hyperparameter that can be specified by the user. Generally, a smaller K value detects anomalies more sensitively, and a larger K value detects anomalies more conservatively. During anomaly detection, KNN calculates the distance as shown in Equation (1).
d ( x i , x j ) = k = 1 n ( x i , k x j , k ) 2  
To detect anomalies in the dataset, the distance from the “normal” data points of the anomalies must first be measured. KNN anomaly detection performs this based on distance. That is, it finds the K nearest neighbors to a given data point and measures the distance to them. If the distance between the given data point and its K neighbors is far, then the data point is determined to be an anomaly. Here, K is a hyperparameter that the user can specify. Generally, the smaller the value of K, the more sensitive it is to detect anomalies, and the larger the value of K, the more conservative it is to detect anomalies. When performing anomaly detection, KNN calculates distance using Equation (1), where x i and x j are two data points, and n is the number of dimensions of the data points. There are various ways to perform anomaly detection, but one of the representative methods is to use KNN distance. KNN distance uses the largest value among the distances between K neighbors. That is, it uses the distance to the K-th nearest neighbor. This can be used as an outlier score. The higher the anomaly score, the more likely the data point is an anomaly.

2.2.2. Naïve Bayes (NB)

NB estimates the conditional probability for each class C k given the data X , P ( C k | X ) , by calculating the conditional probability using Bayes’ theorem. To compute this probability, one needs to know the prior probability of each class P ( C k ) and the probability of each feature x i occurring in class C k , P ( x i | C k ) . Since NB assumes that each feature in the data is conditionally independent of the others, it calculates the conditional probability as shown in Equation (2).
P ( C k | X ) = P ( C k ) i = 1 n P ( x i | C k ) P ( X )
P ( C k ) is the prior probability of class C k , P ( x i | C k ) is the probability of feature x i occurring in class C k . P ( X ) is the denominator probability in Bayes’ theorem, and it is calculated as the sum of the numerator for all classes.

2.2.3. Random Forest (RF)

RF is an ensemble technique that is a classification and regression analysis algorithm based on Decision Trees. RF generates multiple decision trees, and the most frequently selected result among the results predicted by each tree is determined as the final prediction result. To achieve this, RF performs random sampling from the given dataset to create multiple datasets. Then, a decision tree is generated by performing random sampling from each dataset. Generally, Information Gain or Gini Index, and other split criteria are used to select the optimal split at each node. The most frequently selected result among the results predicted by each decision tree is determined as the final prediction result. RF generates trees as shown in Equation (3).
Random   Forest ( X ) = 1 T i = 1 T Decision   Tree i ( X )
In RF, X represents the input data, and T represents the number of decision trees to generate. Since each tree is created in parallel, RF can significantly reduce the computation time. Additionally, RF prevents overfitting by making each decision tree different through randomness. The split criterion at each node is determined in RF according to Equation (4).
split ( X ) = argmax j , t Δ I ( j , t )
In this equation, j is the index of the feature and t is the split point in that feature. Δ I ( j , t ) represents the information gain obtained by that split. RF estimates the probabilities of each class as shown in Equation (5).
P ( y = C k | X ) = 1 T i = 1 T P i ( y = C k | X )
The variable y = C k represents the probability of the data belonging to the class C k , and P i ( y = C k | X ) represents the probability of belonging to the class C k in the i -th decision tree. RF can be applied to both classification and regression problems and is known for its high predictive accuracy, interpretability, and low computational cost. Due to these features, RF is widely used in various fields.

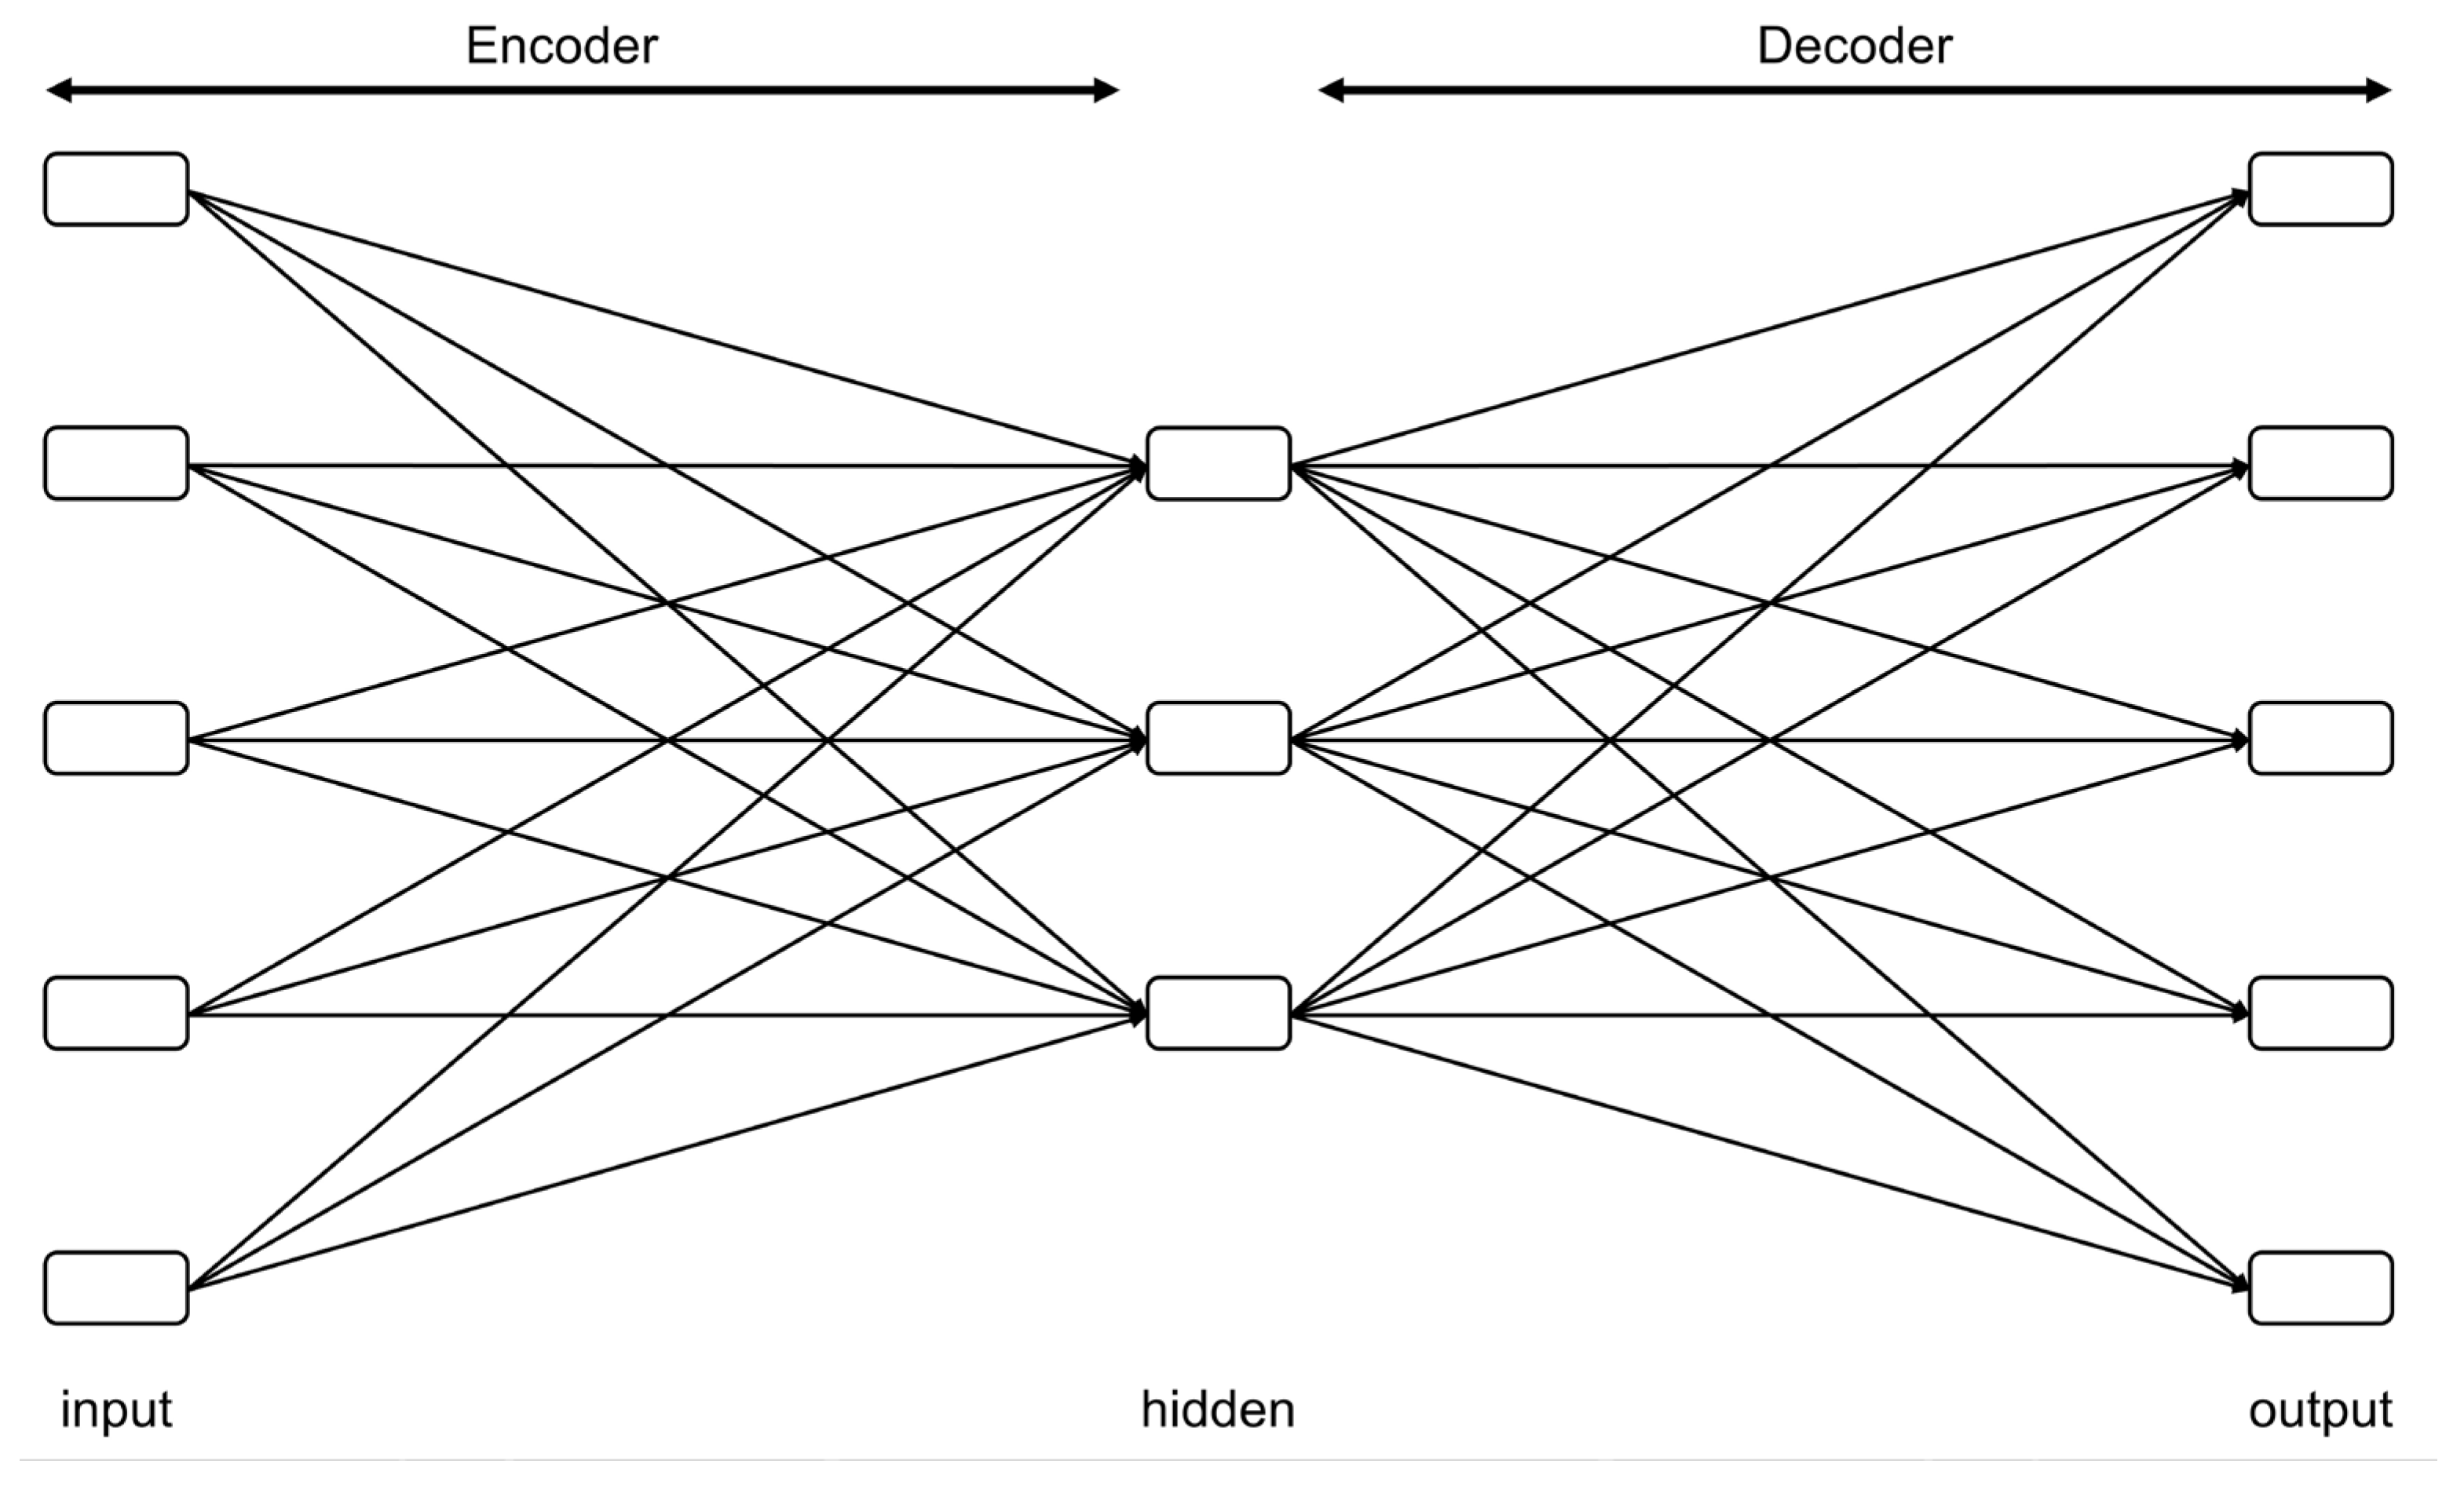
2.2.4. Autoencoder (AE)

AE is one of the Unsupervised Learning algorithms used to extract the features of input data. Autoencoder is composed of an encoder that compresses the input data and a decoder that reconstructs the compressed data, as shown in Figure 2. The encoder maps the input data to the latent space, and the decoder maps this low-dimensional representation back to the original dimension to reconstruct the input data. AE is trained by minimizing the reconstruction error between the input data and the reconstructed data. In this case, AE is used to extract the features of the input data using the learned encoder. AE maps the input data X to a low-dimensional vector h as shown in Equation (6).
h = f ( X ) = σ ( W X + b )
In this equation, W is the weight matrix, b is the bias vector, and σ is the activation function. The sigmoid function or hyperbolic tangent function are commonly used as activation functions. The output of the encoder, h , is a vector that maps the input data X to a low-dimensional space. The decoder maps the low-dimensional vector h back to the input data X as shown in Equation (7).
r = g ( h ) = σ ( W h + b )
In this equation, W is the weight matrix of the decoder and b′ is the bias vector of the decoder. The output of the decoder, r , is the reconstructed data from the input data X . AE is trained to minimize the reconstruction error between the input data and the reconstructed data. The reconstruction error is defined as Equation (8).
L ( X , r ) = | | X r | | 2 2
In this equation, | | | | 2 represents the L 2 norm. Therefore, the objective function of AE is defined as Equation (9).
( X , r ) = L ( X , r ) = | | X r | | 2 2
The AE can compress the dimension of input data into a lower dimension to extract features, which can be used for various problems such as classification, clustering, and dimensionality reduction.

2.2.5. Memory-Augmented Deep Autoencoder (MemAE)

In MemAE, an algorithm based on AE, an encoder and a decoder are used to compress and reconstruct input data. However, unlike the traditional AE, MemAE uses a memory module to store and extract the features of the input data. The encoder maps the input data to a low-dimensional space as shown in Equation (10).
h t = f ( x t , m t 1 ) = σ ( W x h x t + W h h h t 1 + W m h m t 1 + b h )
In this equation, x t is the input data at time t , and m t 1 is the external memory at time t 1 . W x h ,   W h h ,     W m h are weight matrices, and b h is the bias vector. MemAE computes the similarity between the input data and the memory to store and extract the features of the input data. Each position in memory is computed as shown in Equation (11).
m t [ i ] = ( 1 α t ) m t 1 [ i ] + α t h t
In this equation, i is the index of memory, α t calculates the similarity between the input data x t and the memory m t 1 , and determines the weight based on the similarity. Each location in the memory stores the extracted features of the input data, which are used as inputs to the decoder along with the low-dimensional vector h t generated by the encoder. The decoder, Equation (12), takes the low-dimensional vector h t and memory m t as inputs to reconstruct the input data x t .
r t = g ( h t , m t ) = σ ( W h r h t + W m r m t + b r )
In this equation, W h r ,   W m r ,   b r are the weight matrix and bias vector of the decoder. The decoder’s output r t is the reconstructed result of the input data x t . The training is performed using the objective function as shown in Equation (13).
( x t , r t ) = | | x t r t | | 2 2
Using this structure, MemAE can store and extract the features of input data by using external memory. By using this memory-based structure, it can extract more features of data than Autoencoder, and these features can be used in various problems such as dimension reduction, classification, and clustering.

3. Experimental Environment and Data Description

For this study, data for detecting malicious behaviors that occur in APT attacks were collected as shown in Figure 3 and Figure 4. To collect normal and malicious behaviors, two PCs and two servers were set up. PC1 was set up as the cyber-attack target PC to perform normal and malicious behaviors. Another PC2 was set up as the cyber-attack PC to send malware to the cyber-attack target PC. Server1 continuously collected the process data of PC1’s normal and malicious behaviors. Server2 was set up as a C&C server to execute and install additional malware on PC1. Malicious behaviors used actions and tools, such as the Kimsuky phishing attack analyzed by Youn, J., et al. [44], which exploited the COVID-19 vaccine issue.
Figure 3 illustrates the process of collecting malicious behaviors. Malware scripts are sent from PC2 to PC1 via chat, email, or other means. PC1 runs the malware script on Microsoft Edge Browser, and Server1 collects abnormal behavior data generated during the execution of the malware. The malware script also executes functions that can receive commands from the C&C server via Microsoft PowerShell. The C&C server performs tasks such as collecting information and remote control of PC1. Figure 4 shows normal behavior performed by PC1 on Microsoft Edge Browser, and Server1 collects process data generated while performing normal behavior. Using this method, normal and malicious behavior data were collected for about 3 days (approximately 67 h) with the PC continuously powered on, resulting in a total of 16 GB of data.
The data collected from Server1 is shown in Table 2, and the descriptions of the data columns are shown in Table 3. In some cases, malicious code creates processes and deletes executable files. For kernel drivers, even if the driver file itself is deleted after being loaded into the kernel, there is no problem with execution. Therefore, if the ‘Removed’ value is 1 (deleted), the probability of malicious behavior is very high. If a 32-bit process is executed on a 64-bit operating system, the ‘Is_wow’ value is 1. Initially, there were many programs that had not yet been converted to 64-bit when transitioning from 32-bit to 64-bit environments, but most have now been converted to 64-bit, so if the Is_wow field is 1, the probability of malicious behavior is high.
The normal and malicious behavior data collected from Server 1 was experimented using the algorithms introduced in Section 2.2. Among these algorithms, the experiment can be explained based on the MemAE algorithm structure, as shown in Figure 5. The normal and malicious behavior data collected from Server 1 is fed into the algorithm for training. After the training is complete, the memory module transforms the potential vector of the cyber-attack input through the most relevant general memory item and makes it closer to the general instance when reconstructed by the decoder.

4. Experiments

In this section, we use the models and data mentioned in Section 2 and Section 3 to preprocess and conduct experiments and present the results.

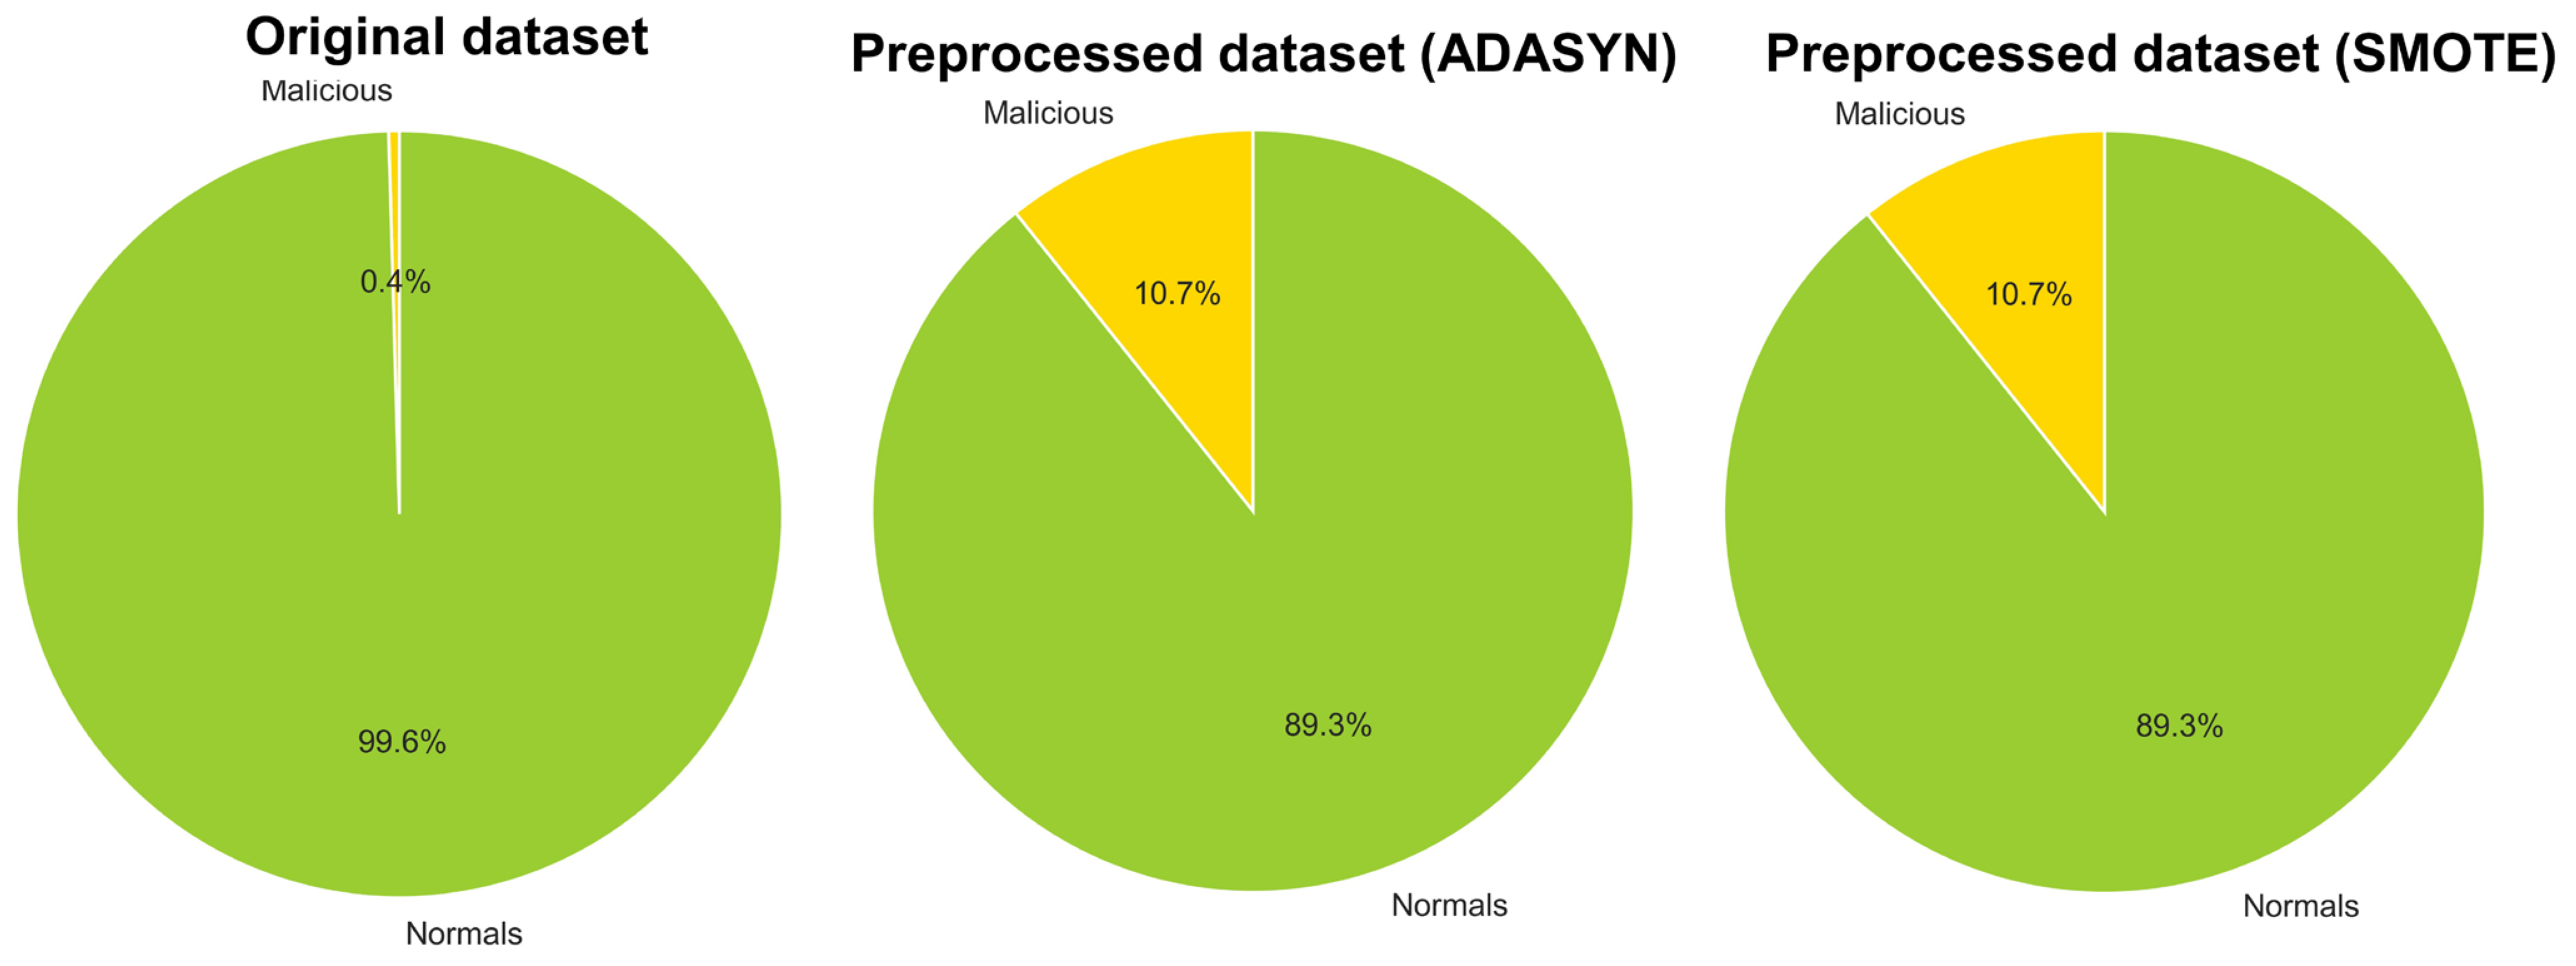
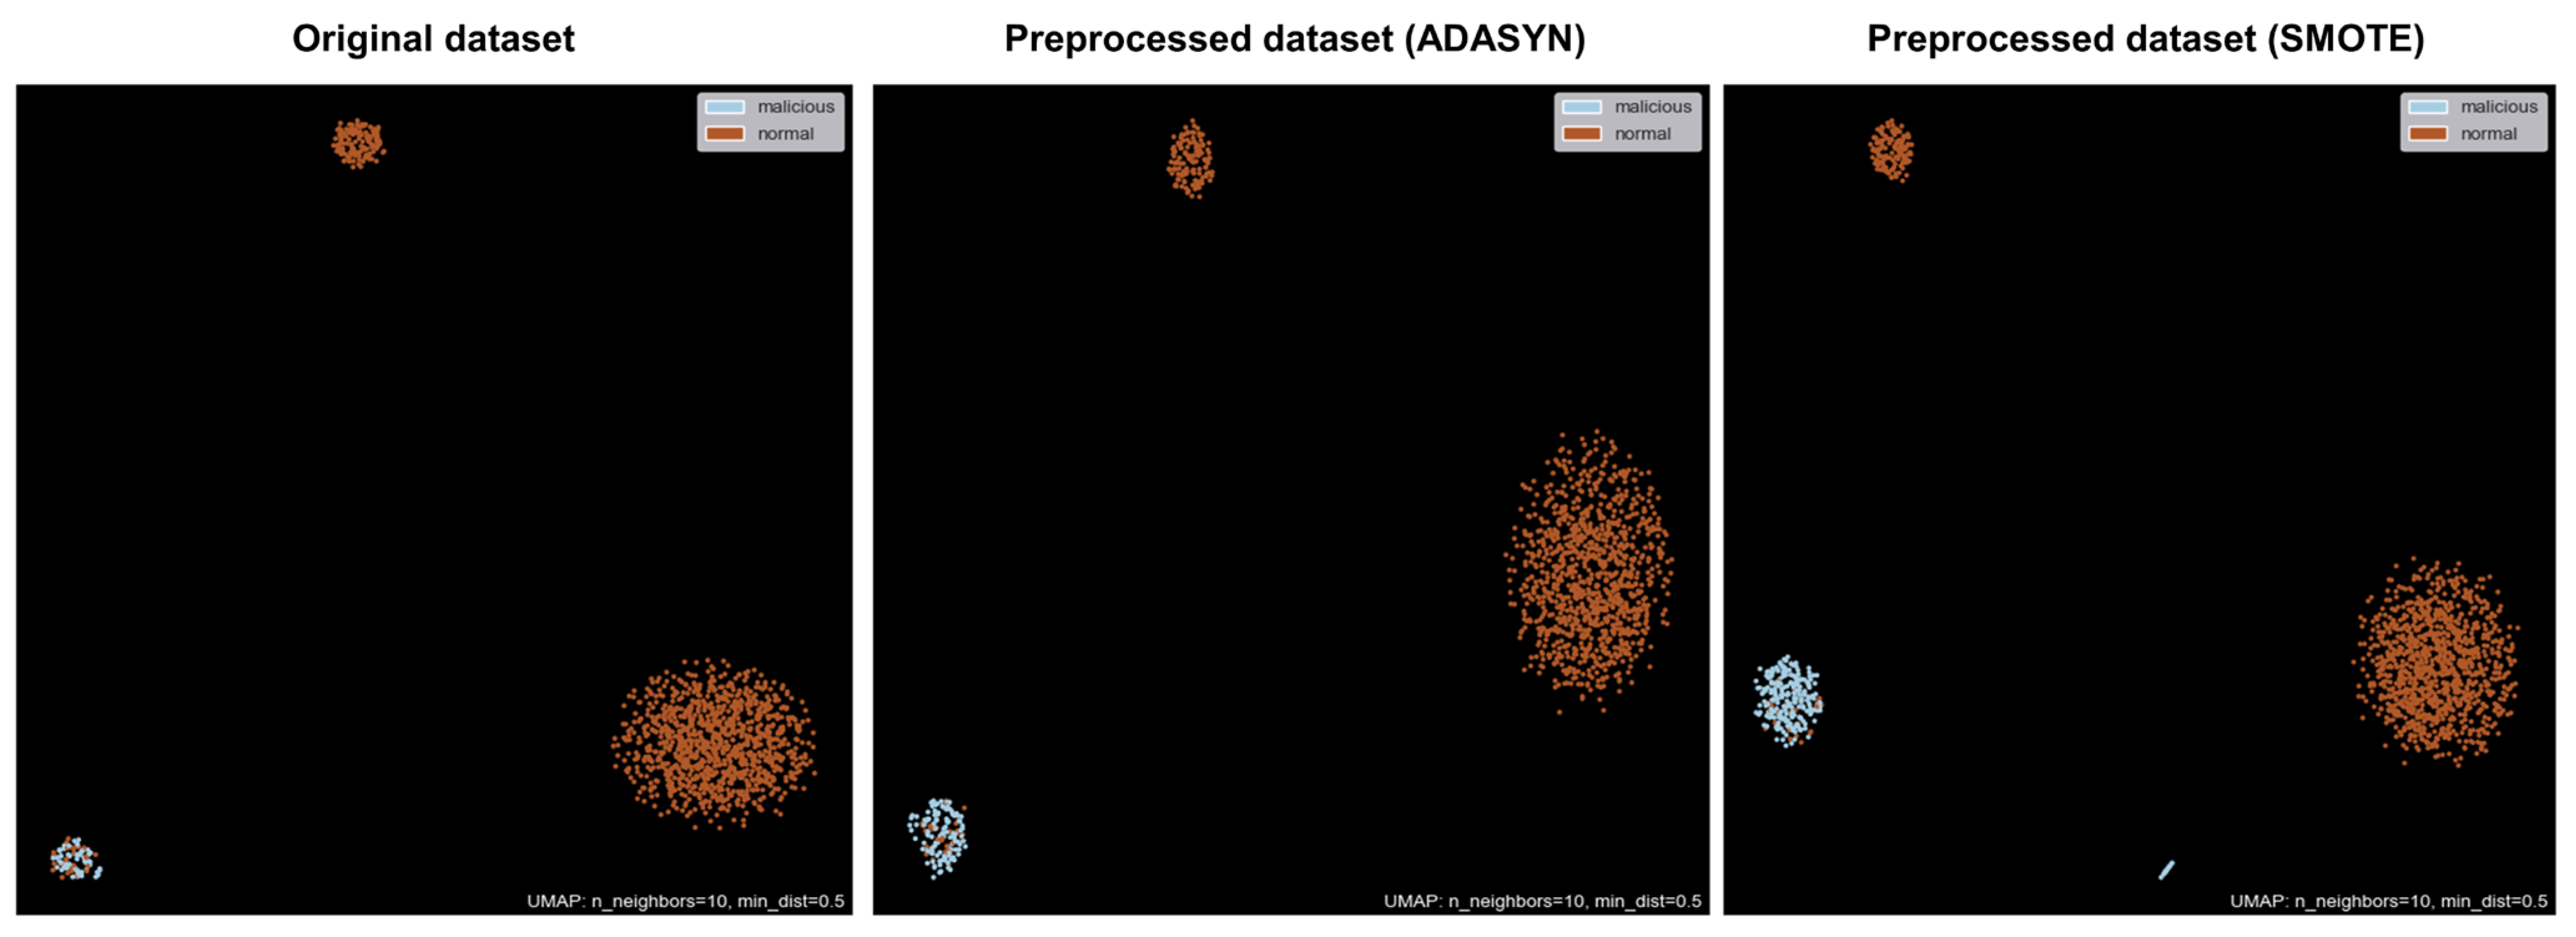
4.1. Data Preprocess

The collected data, excluding null data such as NaN, was used for preprocessing and experiments, as mentioned in Section 2 and Section 3. Upon examining the data distribution using the left pie chart in Figure 6, it was found that there was a severe data imbalance. When the proportion of abnormal data is too low in the dataset, the model may fail to correctly classify abnormal data. Therefore, to set an appropriate ratio, the Synthetic Minority Over-sampling Technique (SMOTE) [45] and Adaptive Synthetic (ADASYN) [46] sampling methods, which are representative oversampling algorithm, were used.
ADASYN is another oversampling technique that generates synthetic data points by considering the density distribution of the minority class. It focuses on generating more synthetic samples for those minority class instances that are harder to learn. This adaptiveness allows the algorithm to shift the decision boundaries to focus on difficult samples, thus improving the overall classification performance.
SMOTE is a technique that can improve classification performance by allowing classification models to better learn from minority class data. It works by synthetically generating new samples from the minority class to balance the dataset. The algorithm selects one of the minority class data points and finds k nearest neighbors of the selected data. It then generates new data points between the selected data point and the neighboring data points and adds the generated data to the minority class data. This process is repeated until the desired number of data points is generated. SMOTE is widely used in various fields such as anomaly detection, face recognition, and medical diagnosis, where imbalanced datasets are common.
In this study, ADASYN and SMOTE were chosen as the oversampling methods due to their proven effectiveness in addressing class imbalance, which could help the model learn the minority class better and improve the overall classification performance. We created new datasets using ADASYN and SMOTE with a sampling strategy option of 0.1, and the resulting datasets can be seen in the middle and right pie charts of Figure 6. Accordingly, the experiment compares the original dataset, the preprocessed dataset (ADASYN), and the preprocessed dataset (SMOTE), evaluating the performance of each dataset.
Before training the model, it is important to understand the distribution of the data. To visualize the data, dimensionality reduction is usually performed. The most common method of dimensionality reduction is Principal Component Analysis (PCA) [47], which represents high-dimensional data in a low-dimensional space. However, since PCA uses linear analysis, it may cause problems in distinguishing clustered data after dimensionality reduction. To solve this problem, dimensionality reduction algorithms based on a neighboring graph, such as t-distributed Stochastic Neighbor Embedded (t-SNE) [48] and Uniform Manifold Approximation and Projection (UMAP) [49], have been developed. UMAP is like t-SNE in that it uses a neighboring graph, but it creates a graph from high-dimensional space data and projects it onto a low-dimensional space, making it faster than t-SNE. In this study, due to the large amount of data in the dataset as mentioned in Section 3, UMAP was used for visualization. Figure 7 shows the distribution of the original dataset, the preprocessed dataset (ADASYN), and the preprocessed dataset (SMOTE). When looking at the distribution of the data, the malicious behavior data is clustered on the left side. This indicates that the original dataset, as well as the preprocessed datasets (ADASYN and SMOTE), are somewhat classified. However, the original dataset has very few malicious behavior data distributed, while both the preprocessed datasets (ADASYN and SMOTE) have more appropriate distributions of malicious behavior data.

4.2. Parameters and Performance Evaluation of Models

We conducted experiments by training the KNN, NB, RF, AE, and MemAE algorithms using the original dataset, the preprocessed dataset (ADASYN) and the preprocessed dataset (SMOTE). The parameters used for the training of the AE and MemAE algorithms are shown in Table 4.
The purpose of this experiment is to detect malicious behaviors based on the behavior data that occur within the host. Such study can be defined as an anomaly detection problem. The following performance indicators are mainly used for such anomaly detection problems.
  • Precision: It indicates the ratio of true positive samples among the samples classified as abnormal by the model. In other words, precision is a metric that aims to reduce False Positive (FP) cases. Higher precision means that the model correctly classifies most of the samples as abnormal.
  • Recall: It indicates the ratio of true positive samples among the actual abnormal samples. In other words, recall is a metric that aims to reduce False Negative (FN) cases. Higher recall means that the model correctly classifies most of the actual abnormal samples as abnormal.
  • F1-Score: It is the harmonic mean of precision and recall, representing the balance between precision and recall. Higher F1-score means that the model has both high precision and high recall.
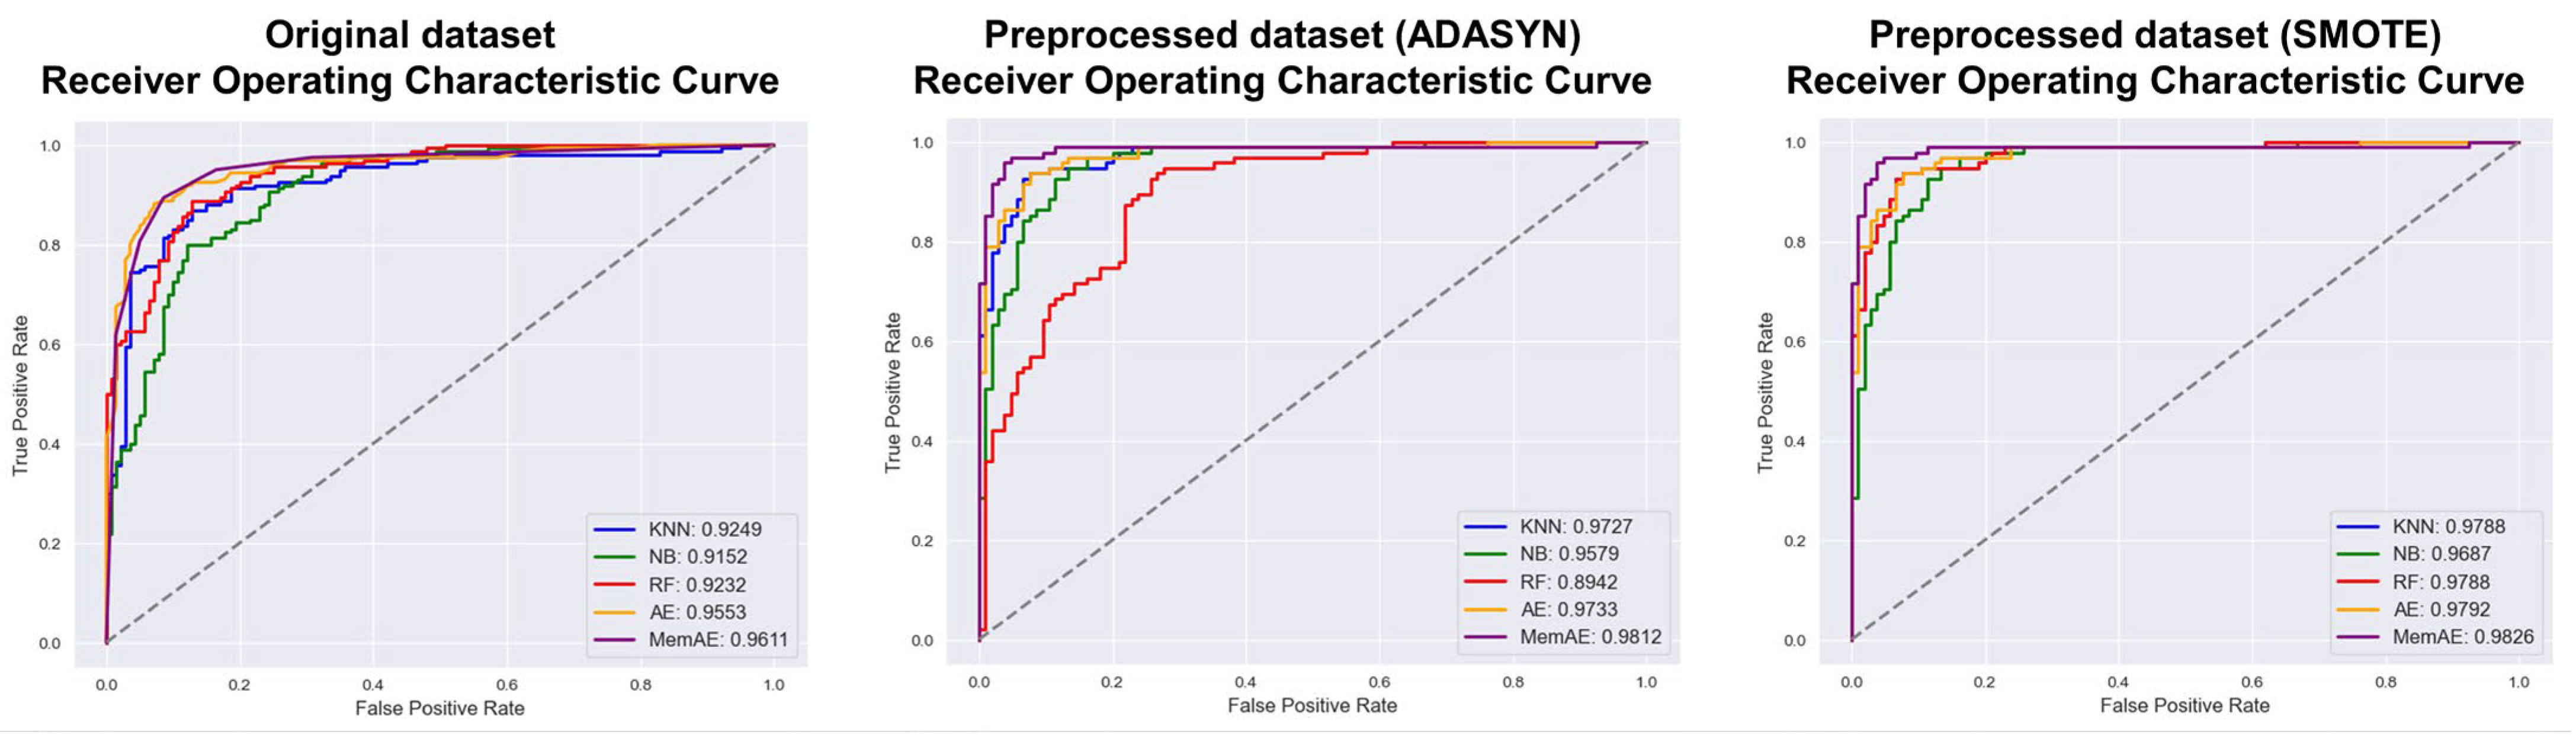
  • Receiver Operating Characteristic (ROC) Curve: It is one of the ways to visualize the performance of the anomaly detection model. The ROC curve is a graph that shows the changes in True Positive Rate (TPR) and False Positive Rate (FPR) as the classification threshold of the model is changed. The better the model’s performance, the closer the ROC curve is to the upper left corner, and the performance of the anomaly detection model is also expressed by the Area Under the Curve (AUC).
These metrics are calculated based on the confusion matrix, as shown in Table 5, using Equations (14)–(18). In these equations, True Positive (TP) represents the number of cases that the model classified as abnormal and are truly abnormal, FP represents the number of cases that the model classified as abnormal but are normal, FN represents the number of cases that the model classified as normal but are actually abnormal, and True Negative (TN) represents the number of cases that the model classified as normal and are truly normal. TPR represents the ratio of true positives to actual positives, while FPR represents the ratio of false positives to actual negatives.
Precision = TP TP + FP
Recall = TP TP + FN
F 1 - Score = 2 Precision Recall Precision + Recall
TPR = TP TP + FN
FPR = FP FP + TN

4.3. Experiments Results

The experimental results were evaluated using the Area Under the Receiver Operating Characteristic Curve (AUROC) to determine how well the models distinguished between normal and malicious behaviors. AUROC is a metric that calculates the area under the ROC Curve, which indicates how well the classification model can distinguish between normal and abnormal data. It is based on the changes in TPR and FPR as the classification threshold of the model is adjusted.
Table 6 shows the AUROC performance of the datasets used in the experiment. Most of the models used in the experiment showed high performance. KNN, NB, and RF models using the original dataset showed 91–92% performance, while AE and MemAE showed higher performance at 95–96%. Models using the Preprocessed dataset (ADASYN) showed performance ranging from 89–98%, while models using the Preprocessed dataset (SMOTE) showed high performance of 97–98%. The lowest performance difference between KNN and MemAE was only 0.0038, indicating very little difference.
The Figure 8 shows the ROC curves and AUROC values for each dataset, and the performance evaluation results of the malicious behavior detection models using original dataset, preprocessed dataset (ADASYN), and preprocessed dataset (SMOTE) are presented in Table 7, Table 8 and Table 9, respectively. The evaluated models include KNN, NB, RF, AE, and MemAE, and the evaluation metrics used to assess the model performance are Precision, Recall, and F1-Score. The results indicate that both the preprocessed datasets (ADASYN and SMOTE) significantly improved the model performance, with all models achieving higher Precision, Recall, and F1-Score values than the original dataset. Notably, in the case of MemAE, the F1-Score for the original dataset was 0.94. However, for the preprocessed dataset (ADASYN), the F1-Score increased to 0.96, and for the preprocessed dataset (SMOTE), the F1-Score increased further to 1.00, demonstrating a significant improvement in the results.

5. Conclusions

In conclusion, this study focused on detecting malicious behavior based on host process data using machine learning. The study utilized a number of machines learning algorithms, including KNN, NB, RF, AE, and MemAE, to classify data as either malicious or normal. Additionally, the study incorporated dimensionality reduction techniques such as PCA and UMAP and employed the ADASYN and SMOTE sampling method to improve the classification performance of the models. The performance of the models was evaluated using several metrics, including Precision, Recall, F1-Score, and AUROC.
The results indicate that the preprocessed dataset (SMOTE) improved the performance of the models and that all models achieved higher Precision, Recall, F1-Score, and AUROC values than the original dataset. The results indicate that both the preprocessed datasets (ADASYN and SMOTE) improved the performance of the models and that all models achieved higher Precision, Recall, F1-Score, and AUROC values than the original dataset. In particular, the best performance was obtained when using the preprocessed dataset (SMOTE) with the MemAE model, yielding an F1-Score of 1.00 and an AUROC value of 0.9826.
This study is important because it provides a valuable framework for detecting malicious behavior based on host process data using machine learning. The results of this study can be used to enhance the security of computer systems and protect against various types of attacks, including malware and intrusion attempts. Additionally, the techniques and methods used in this study can be applied to other domains and datasets to improve the performance of machine learning models. Overall, this study demonstrates the potential of machine learning in detecting malicious behavior and offers a valuable contribution to the field of cybersecurity. It is an excellent thesis that provides a comprehensive overview of the problem and a thorough analysis of the techniques used to address it. The methods and findings presented in this study can be used to inform future study and to develop practical tools for detecting and preventing malicious behavior in a wide range of settings.
For future study, more sophisticated machine learning algorithms and analysis techniques can be applied to improve the detection of malicious behavior in host process data. This involves exploring the use of state-of-the-art technologies such as deep learning algorithms to enhance the performance of the models. Additionally, while our study collected and analyzed data from a single host, it is necessary to analyze data from multiple hosts to achieve a more accurate detection of malicious behavior at the network level.
Furthermore, while our study only utilized host process data, a more comprehensive detection model for various types of malicious behavior can be developed by leveraging other types of data such as network traffic, system logs, and user behavior data, addressing the limitations of relying solely on host process data. Moreover, potential challenges and limitations of using machine learning algorithms for detecting malicious behavior in real-world settings should be considered, such as issues with data privacy, algorithm bias, and real-time detection requirements.
Strategies to mitigate these concerns, including bias-correction techniques, compliance with privacy regulations, and optimization of processing times and computational costs for real-time deployment, should be explored. While our study focused on analyzing static malicious code, there is a need to conduct study on analyzing dynamic malicious code. To achieve this, dynamic analysis techniques can be used to monitor the execution process of malicious code and develop models for detecting malicious behavior based on this.
Lastly, while our study focused on analyzing host process data, there is a need for study on detecting malicious behavior in cloud environments. In cloud environments, multiple users share resources simultaneously, and virtual resources such as virtual machines are used. Therefore, it is important to develop a detection model that considers these factors. In conclusion, further study in these areas can provide valuable insights for the development of effective and efficient models for detecting malicious behavior in various settings. By incorporating the latest technologies and analysis techniques, we can develop more accurate and comprehensive detection models that can be applied to real-world situations, including real-time systems where rapid response and minimal computational overhead are critical.

Author Contributions

Conceptualization, R.H., K.K. and B.C.; Funding acquisition, R.H.; Methodology, R.H., K.K. and B.C.; Software, K.K.; Supervision, Y.J.; Validation, Y.J.; Writing-original draft, R.H. and K.K.; Writing-review & editing, B.C. and Y.J.; All authors have read and agreed to the published version of the manuscript.

Funding

This research was supported by the Future Challenge Defense Technology Research and Development Project (9129156) hosted by the Agency for Defense Development Institute in 2020.

Institutional Review Board Statement

Not applicable.

Informed Consent Statement

Not applicable.

Data Availability Statement

Not applicable.

Acknowledgments

Data used in this study was sponsored by SOMMA, Inc.

Conflicts of Interest

The authors declare no conflict of interest.

Abbreviations

APTAdvanced Persistent Threats
RFRandom Forest
LMTlogistic model trees
KNNK-Nearest Neighbors
ARTAdaptive Resonance Theory
DoSDenial-of-Service
NBNaïve Bayes
LDALinear Discriminant Analysis
XGBoostExtreme Gradient Boosting
SVMSupport Vector Machines
AdaBoostAdaptive Boosting
SGDStochastic Gradient Descent
LRLogistic regression
MLPMultilayer Perceptron
AEAutoencoder
MemAEMemory-augmented Deep Autoencoder
SMOTESynthetic Minority Over-sampling Technique
PCAPrincipal Component Analysis
t-SNEt-distributed Stochastic Neighbor Embedded
UMAPUniform Manifold Approximation and Projection
FPFalse Positive
FNFalse Negative
ROCReceiver Operating Characteristic
TPRTrue Positive Rate
FPRFalse Positive Rate
AUCArea Under the Curve
TPTrue Positive True Negative
TNTrue Negative
AUROCArea Under the Receiver Operating Characteristic Curve

References

  1. Arora, B. Exploring and analyzing Internet crimes and their behaviours. Perspect. Sci. 2016, 8, 540–542. [Google Scholar] [CrossRef] [Green Version]
  2. Check Point Research: Third Quarter of 2022 Reveals Increase in Cyberattacks and Unexpected Developments in Global Trends. Available online: https://blog.checkpoint.com/2022/10/26/third-quarter-of-2022-reveals-increase-in-cyberattacks (accessed on 18 March 2023).
  3. Wanjala, M.Y.; Jacob, N.M. Review of Viruses and Antivirus patterns. Glob. J. Comput. Sci. Technol. 2017, 17, 1–3. [Google Scholar]
  4. Xiao, Y.; Xing, C.; Zhang, T.; Zhao, Z. An intrusion detection model based on feature reduction and convolutional neural networks. IEEE Access 2019, 7, 42210–42219. [Google Scholar] [CrossRef]
  5. Papamartzivanos, D.; Mármol, F.G.; Kambourakis, G. Introducing deep learning self-adaptive misuse network intrusion detection systems. IEEE Access 2019, 7, 13546–13560. [Google Scholar] [CrossRef]
  6. Mayuranathan, M.; Murugan, M.; Dhanakoti, V. Best features based intrusion detection system by RBM model for detecting DDoS in cloud environment. J. Ambient. Intell. Humaniz. Comput. 2021, 12, 3609–3619. [Google Scholar] [CrossRef]
  7. Jiang, F.; Fu, Y.; Gupta, B.B.; Liang, Y.; Rho, S.; Lou, F.; Meng, F.; Tian, Z. Deep learning based multi-channel intelligent attack detection for data security. IEEE Trans. Sustain. Comput. 2018, 5, 204–212. [Google Scholar] [CrossRef]
  8. Tian, Q.; Han, D.; Li, K.-C.; Liu, X.; Duan, L.; Castiglione, A. An intrusion detection approach based on improved deep belief network. Appl. Intell. 2020, 50, 3162–3178. [Google Scholar] [CrossRef]
  9. Zhang, C.; Costa-Pérez, X.; Patras, P. Tiki-taka: Attacking and defending deep learning-based intrusion detection systems. In Proceedings of the 2020 ACM SIGSAC Conference on Cloud Computing Security Workshop, Virtual Event, 9 November 2020; pp. 27–39. [Google Scholar]
  10. Aslan, Ö.; Ozkan-Okay, M.; Gupta, D. Intelligent behavior-based malware detection system on cloud computing environment. IEEE Access 2021, 9, 83252–83271. [Google Scholar] [CrossRef]
  11. Das Malwerk. Available online: https://dasmalwerk.eu/ (accessed on 18 March 2023).
  12. MalwareBazaar. Available online: https://bazaar.abuse.ch/ (accessed on 18 March 2023).
  13. TheZoo Aka. Available online: https://thezoo.morirt.com/ (accessed on 18 March 2023).
  14. Malshare. Available online: https://malshare.com/ (accessed on 18 March 2023).
  15. Tekdefense. Available online: http://www.tekdefense.com/downloads/ (accessed on 18 March 2023).
  16. Virussign. Available online: https://virussign.com/ (accessed on 18 March 2023).
  17. Virusshare. Available online: https://virusshare.com/ (accessed on 18 March 2023).
  18. Kernelmode. Available online: https://www.kernelmode.info/forum/ (accessed on 18 March 2023).
  19. Quinlan, J.R. Bagging, boosting, and C4. 5. In Proceedings of the Aaai/Iaai, Portland, OR, USA, 4–8 August 1996; Volume 1, pp. 725–730. [Google Scholar]
  20. Breiman, L. Random forests. Mach. Learn. 2001, 45, 5–32. [Google Scholar] [CrossRef] [Green Version]
  21. Landwehr, N.; Hall, M.; Frank, E. Logistic model trees. Mach. Learn. 2005, 59, 161–205. [Google Scholar] [CrossRef] [Green Version]
  22. Peterson, L.E. K-nearest neighbor. Scholarpedia 2009, 4, 1883. [Google Scholar] [CrossRef]
  23. Jones, C.B.; Chavez, A.; Hossain-McKenzie, S.; Jacobs, N.; Summers, A.; Wright, B. Unsupervised online anomaly detection to identify cyber-attacks on internet connected photovoltaic system inverters. In Proceedings of the 2021 IEEE Power and Energy Conference at Illinois (PECI), Urbana, IL, USA, 1–2 April 2021; pp. 1–7. [Google Scholar]
  24. Carpenter, G.A.; Grossberg, S. Adaptive Resonance Theory; Springer: New York, NY, USA, 2010. [Google Scholar]
  25. Sarker, I.H. CyberLearning: Effectiveness analysis of machine learning security modeling to detect cyber-anomalies and multi-attacks. Internet Things 2021, 14, 100393. [Google Scholar] [CrossRef]
  26. Moustafa, N.; Slay, J. UNSW-NB15: A comprehensive data set for network intrusion detection systems (UNSW-NB15 network data set). In Proceedings of the 2015 Military Communications and Information Systems Conference (MilCIS), Canberra, Australia, 10–12 November 2015; pp. 1–6. [Google Scholar]
  27. Tavallaee, M.; Bagheri, E.; Lu, W.; Ghorbani, A.A. A detailed analysis of the KDD CUP 99 data set. In Proceedings of the 2009 IEEE Symposium on Computational Intelligence for Security and Defense Applications, Ottawa, ON, Canada, 8–10 July 2009; pp. 1–6. [Google Scholar]
  28. Murphy, K.P. Naive bayes classifiers. Univ. Br. Columbia 2006, 18, 1–8. [Google Scholar]
  29. Balakrishnama, S.; Ganapathiraju, A. Linear discriminant analysis—A brief tutorial. Inst. Signal Inf. Process. 1998, 18, 1–8. [Google Scholar]
  30. Chen, T.; He, T.; Benesty, M.; Khotilovich, V.; Tang, Y.; Cho, H.; Chen, K.; Mitchell, R.; Cano, I.; Zhou, T. Xgboost: Extreme Gradient Boosting; R Package Version 0.4-2; 2015; Volume 1, pp. 1–4. Available online: https://cran.r-project.org/web/packages/xgboost/vignettes/xgboost.pdf (accessed on 2 March 2023).
  31. Wang, L. Support Vector Machines: Theory and Applications; Springer Science & Business Media: Berlin/Heidelberg, Germany, 2005; Volume 177. [Google Scholar]
  32. Freund, Y.; Schapire, R.E. A decision-theoretic generalization of on-line learning and an application to boosting. J. Comput. Syst. Sci. 1997, 55, 119–139. [Google Scholar] [CrossRef] [Green Version]
  33. Bottou, L. Stochastic gradient descent tricks. In Neural Networks: Tricks of the Trade, 2nd ed.; Springer: Berlin/Heidelberg, Germany, 2012; pp. 421–436. [Google Scholar]
  34. DeMaris, A. A tutorial in logistic regression. J. Marriage Fam. 1995, 57, 956–968. [Google Scholar] [CrossRef]
  35. Ibrahim, W.N.H.; Anuar, S.; Selamat, A.; Krejcar, O.; Crespo, R.G.; Herrera-Viedma, E.; Fujita, H. Multilayer framework for botnet detection using machine learning algorithms. IEEE Access 2021, 9, 48753–48768. [Google Scholar] [CrossRef]
  36. García, S.; Grill, M.; Stiborek, J.; Zunino, A. An empirical comparison of botnet detection methods. Comput. Secur. 2014, 45, 100–123. [Google Scholar] [CrossRef]
  37. Gardner, M.W.; Dorling, S. Artificial neural networks (the multilayer perceptron)—A review of applications in the atmospheric sciences. Atmos. Environ. 1998, 32, 2627–2636. [Google Scholar] [CrossRef]
  38. Wang, S.; Philip, S.Y. Heterogeneous graph matching networks: Application to unknown malware detection. In Proceedings of the 2019 IEEE International Conference on Big Data (Big Data), Los Angeles, CA, USA, 9–12 December 2019; pp. 5401–5408. [Google Scholar]
  39. Kipf, T.N.; Welling, M. Semi-supervised classification with graph convolutional networks. arXiv 2016, arXiv:1609.02907. [Google Scholar]
  40. Han, X.; Pasquier, T.; Bates, A.; Mickens, J.; Seltzer, M. Unicorn: Runtime provenance-based detector for advanced persistent threats. arXiv 2020, arXiv:2001.01525. [Google Scholar]
  41. Ranjan, R.; Kumar, S.S. User behaviour analysis using data analytics and machine learning to predict malicious user versus legitimate user. High-Confid. Comput. 2022, 2, 100034. [Google Scholar] [CrossRef]
  42. Gaddam, A.; Mukhopadhyay, S.C.; Gupta, G.S. Elder care based on cognitive sensor network. IEEE Sens. J. 2010, 11, 574–581. [Google Scholar] [CrossRef]
  43. Gong, D.; Liu, L.; Le, V.; Saha, B.; Mansour, M.R.; Venkatesh, S.; Hengel, A.v.d. Memorizing normality to detect anomaly: Memory-augmented deep autoencoder for unsupervised anomaly detection. In Proceedings of the IEEE/CVF International Conference on Computer Vision, Seoul, Republic of Korea, 27 October–2 November 2019; pp. 1705–1714. [Google Scholar]
  44. Youn, J.; Kim, K.; Kang, D.; Lee, J.; Park, M.; Shin, D. Research on Cyber ISR Visualization Method Based on BGP Archive Data through Hacking Case Analysis of North Korean Cyber-Attack Groups. Electronics 2022, 11, 4142. [Google Scholar] [CrossRef]
  45. Chawla, N.V.; Bowyer, K.W.; Hall, L.O.; Kegelmeyer, W.P. SMOTE: Synthetic minority over-sampling technique. J. Artif. Intell. Res. 2002, 16, 321–357. [Google Scholar] [CrossRef]
  46. He, H.; Bai, Y.; Garcia, E.A.; Li, S. ADASYN: Adaptive synthetic sampling approach for imbalanced learning. In Proceedings of the 2008 IEEE International Joint Conference on Neural Networks (IEEE World Congress on Computational Intelligence), Hong Kong, China, 1–8 June 2008; pp. 1322–1328. [Google Scholar]
  47. Wold, S.; Esbensen, K.; Geladi, P. Principal component analysis. Chemom. Intell. Lab. Syst. 1987, 2, 37–52. [Google Scholar] [CrossRef]
  48. Van der Maaten, L.; Hinton, G. Visualizing data using t-SNE. J. Mach. Learn. Res. 2008, 9, 2579–2605. [Google Scholar]
  49. McInnes, L.; Healy, J.; Melville, J. Umap: Uniform manifold approximation and projection for dimension reduction. arXiv 2018, arXiv:1802.03426. [Google Scholar]
Figure 1. Average Weekly Cyber-attacks per Organization by Industry–Global 2022 Q3.
Applsci 13 04097 g001
Figure 2. Autoencoder structure.
Applsci 13 04097 g002
Figure 3. Abnormal behavior collection process.
Applsci 13 04097 g003
Figure 4. Normal behavior collection process.
Applsci 13 04097 g004
Figure 5. Malicious process behavior detection model.
Applsci 13 04097 g005
Figure 6. Data ratio pie graphs.
Applsci 13 04097 g006
Figure 7. Data distribution plot of original dataset and preprocessed dataset (SMOTE).
Applsci 13 04097 g007
Figure 8. ROC Curve graph of each model.
Applsci 13 04097 g008
Table 1. Behavior-based data and detection methods in related works.
StudyDataDetection TechniqueLimitations
Aslan, O., et al. [10]Host (System calls, …) [11,12,13,14,15,16,17,18,19]J48 [19], RF [20], LMT [21], KNN [22]No analysis of false positives/negatives
Jones, C. B., et al. [23]IDS Data, Host (System calls, …) [23]ART [24]Limited to online anomaly detection
Sarker, I. H. [25]UNSW-NB15 [26], NSL-KDD [27]RF [20], KNN [22], NB [28], LDA [29], XGBoost [30], SVM [31], AdaBoost [32], SGD [33], LR [34]No evaluation on real-world attacks
Ibrahim, W. N. H., et al. [35]CTU-13 [36]KNN [22], SVM [31], MLP [37]Limited to botnet command and control server detection
Wang, S., et al. [38]Host (System calls, …) [13]SVM [31], LR [34], MLP [37], MatchGNet [38], GCN [39]No analysis of false positives/negatives
Han, X., et al. [40]Host (System calls, …) [40]Graph-based [40]Limited evaluation on real-world data
Ranjan, R., et al. [41]Host (server, app, …) [41]RF [20]Limited data collection, algorithm validation, and visualization methods
Table 2. Part of normal and abnormal behavior data.
Parent_ElevatedElevatedElevated_TypeRemovedImage_CodesignIs_WowLabel
0010001
1110300
0010001
0030001
Table 3. Normal and abnormal behavior data column description.
ColumnDescription
Parent_elevatedWhether the parent process’s token is elevated
 0: Token not elevated (Not admin rights)
 1: Token elevated (Elevate to Administrator privileges)
ElevatedWhether the token is elevated
 0: Token not elevated (Not admin rights)
 1: Token elevated (Elevate to Administrator privileges)
Elevated_typeToken elevation type
 1: TokenElevationTypeDefault
 2: TokenElevationTypeFull
 3: TokenElevationTypeLimited
RemovedWhether to delete the execution image of Process
 0: Execution image not deleted
 1: Execution image deleted
Image_codesignElectronic Signature Verification Value
 Unknown = 0
 NoSignature = 1
 Trusted = 2
 Expired = 3
 Revoked = 4
 Distrust = 5
 SecuritySettings = 6
 BadSignature = 7
Is_wow 0: Not a WoW process
 1: WoW process
Label 0: Malicious behavior
 1: Normal behavior
Table 4. Parameters used in the experiment.
ParametersAE ValueMemAE Value
Epochs1001
Batch size321
Activation functionLeakyReLU, Linearrelu, sigmoid
Optimizeradamadam
Memory size-100
Loss functionMean squared errorMean squared error
Table 5. Confusion Matrix.
Actual Values
PositiveNegative
Predicted ValuesPositiveTPFP
NegativeFNTN
Table 6. AUROC performance for each dataset.
ModelsOriginal DatasetPreprocessed Dataset (ADASYN)Preprocessed Dataset (SMOTE)
KNN0.92490.97270.9788
NB0.91520.95790.9687
RF0.92320.89420.9788
AE0.95530.97330.9792
MemAE0.96110.98120.9826
Table 7. Malicious behavior detection results by model using the original dataset.
ModelsPrecisionRecallF1-Score
KNN0.900.930.91
NB0.770.820.79
RF0.890.920.90
AE0.930.960.94
MemAE0.920.960.94
Table 8. Malicious behavior detection results by model using the preprocessed dataset (ADASYN).
ModelsPrecisionRecallF1-Score
KNN0.940.910.93
NB0.930.880.90
RF0.830.780.80
AE0.920.930.92
MemAE0.970.940.96
Table 9. Malicious behavior detection results by model using the preprocessed dataset (SMOTE).
ModelsPrecisionRecallF1-Score
KNN0.980.960.97
NB0.860.860.86
RF0.980.960.97
AE1.000.990.99
MemAE1.001.001.00
Disclaimer/Publisher’s Note: The statements, opinions and data contained in all publications are solely those of the individual author(s) and contributor(s) and not of MDPI and/or the editor(s). MDPI and/or the editor(s) disclaim responsibility for any injury to people or property resulting from any ideas, methods, instructions or products referred to in the content.

