Communication

Salivary Volatile Organic Compound Analysis: An Optimised Methodology and Longitudinal Assessment Using Direct Injection Mass Spectrometry

Department of Surgery and Cancer, St Mary’s Hospital, Imperial College London, London W2 1NY, UK
*
Author to whom correspondence should be addressed.
Appl. Sci. 2023, 13(7), 4084; https://doi.org/10.3390/app13074084
Submission received: 2 March 2023 / Revised: 18 March 2023 / Accepted: 21 March 2023 / Published: 23 March 2023
(This article belongs to the Special Issue Application of Gas Phase Ion Chemistry)

Abstract

:
Analysis of salivary volatile organic compounds (VOCs) may offer a novel noninvasive modality for disease detection. This study aims to optimise saliva headspace VOC analysis and assess longitudinal variation of salivary VOCs. Whole saliva from healthy participants was acquired in order to assess four methodological parameters: saliva collection, volume, dilution, and acidification. Saliva VOCs were analysed using untargeted proton transfer reaction time-of-flight mass spectrometry. Using the optimised method, five saliva samples collected over 3 weeks assessed the longitudinal VOC variability and reproducibility with targeted selected ion flow tube-mass spectrometry analysis. The method of saliva collection influenced VOC detection and was a source of contamination. An amount of 500 µL of whole saliva by passive drool yielded optimal VOCs. Longitudinal variation was negligible with target short chain fatty acids and aldehydes. However, certain compounds showed variability suggesting the influence of potential exogenous factors. Overall, there was an acceptable range of inter- and intraindividual VOC variability. Standardisation with morning sampling after a 6 h fast is recommended demonstrating minimal intersubject variability. Future studies should seek to establish salivary VOC levels in healthy and diseased populations.

1. Introduction

Volatile organic compounds (VOCs) have the potential to be noninvasive biomarkers of disease. Variations in VOC levels in various biological matrices, such as breath and urine, have been extensively described and linked to a number of disease states [1,2]. Comparably little is known about the VOC profile of saliva and its link to health and disease.
Saliva is a complex liquid composed of electrolytes, enzymes, mucin, and microbiota suspended in water [3]. Disease-specific salivary VOCs have been reported in benign (halitosis, oral abscess, and diabetes) and malignant (gastrointestinal cancer) states [4,5]. However, the oral cavity is influenced by multiple endogenous and exogenous factors that contribute to VOC production. Local modifiable factors include oral hygiene and smoking status, as well as systemic factors, including disease, medications, and diet [6,7]. The molecular composition of saliva is also altered with autonomic stimulation resulting in compositional differences between unstimulated and stimulated saliva [3,8]. As a consequence of autonomic stimulation, salivary flow rates can reach up to 4 mL/minute compared to unstimulated baseline flow rates of 0.3–0.4 mL/minute [9]. Various methods have been used in salivary VOC analysis, largely with indirect gas chromatography platforms. Stimulated methods may allow the acquisition of larger volumes. However, it is recognised that morning unstimulated saliva sampling in keeping with the circadian cycle may reduce bias from exogenous influences [4,5,10,11]. Other studies have allowed patients to rinse their oral cavities with water to encourage saliva production; however, dilution methods may affect VOC detection [4,10]. Similarly, others have centrifugated and removed cellular debris to analyse the supernatant, which may eliminate important salivary components for analysis.
This study reports on direct headspace VOC analysis with real-time quantification and elimination of preprocessing steps. To mitigate any bias, the collection and analysis of salivary VOCs need to be standardised. Furthermore, before the wider adoption of salivary volatolomics, it is important to establish the variation in VOC profiles both within and between healthy subjects over a defined period.
This study aims to (i) establish an optimised method to standardise collection for salivary VOC analysis and (ii) assess the intra- and interindividual variability of VOC levels within whole saliva as a potential method for clinical diagnostics.

2. Material and Methods

2.1. Participant Selection

All healthy participants were recruited from St Mary’s Hospital (Imperial College Healthcare NHS Trust London) between February 2020 to July 2021. Inclusion criteria included: age > 18 years and the ability to provide written informed consent. Exclusion criteria included: current smoker, known oral disease, uncontrolled systemic disease, use of immunosuppressive medications, and use of antibiotics within four weeks.
All participants provided written informed consent. Ethical approval was obtained by the Health Research Authority National Research Ethics Service (NRES) Committee London Camden and Islington (REC number: 14/LO/1136), and Imperial College Healthcare Tissue Bank (REC Wales approval: 17/WA/0161 (R20059)).

2.2. Optimal Saliva Sampling Parameters

For methodological optimisation of salivary VOC analysis, a standardised approach was taken across all participants, who maintained a clear fluid diet for a minimum of six hours and subsequently provided whole saliva between 07:00 and 09:00 h. Each participant maintained their normal oral hygiene routines at least two hours prior to saliva sampling.
Five sampling conditions were evaluated to establish the optimal sampling method for VOC headspace analysis of whole saliva: (i) method of collection; (ii) sample volume; (iii) sample dilution; (iv) sample acidification; (v) negative controls (background contamination)
Saliva collection method: Saliva (n = 11) was collected using three techniques, (i) passive drool into a sterile container over 5 min, (ii) unstimulated saliva by holding the Salivette® (Sarstedt, Nümbrecht, Germany) between the lateral teeth and buccal mucosa, or beneath the tongue, for two minutes, and (iii) stimulated saliva by chewing the Salivette® for one minute. The Salivette® is a commercially available saliva collection device composed of a cotton roll within a plastic collection tube suitable for centrifugation. As per the manufacturer’s instructions, the tube was centrifuged for two minutes at 1000 g. Salivette® was selected due to the ease of saliva sampling and simple instructions for potential patients. The osmolality of saliva was determined for each method using an osmometer (Advanced Instruments OsmoTech Promulti-Sample Micro Osmometer; Advanced Instruments, Wimborne, UK). Salivary flow rates (mL/min) were also calculated by saliva volume (mL) divided by time (minutes).
Saliva volume: The headspace of 500 µL and 1000 µL saliva (n = 11) was selected according to literature findings for headspace VOC assessment.
Saliva dilution: The headspace of 500 µL of whole saliva (n = 11) was compared to 500 µL of whole saliva diluted to 1 mL with deionised water.
Saliva acidification: A standardised protocol within the institution was used to acidify each sample (n = 11) with pure hydrochloric acid to pH 2.0 (FiveGoTM pH meter F2, Mettler Toledo, Columbus, OH, USA). An average of 3.7 µL hydrochloric acid was used (range 3–5 µL). Calibration checks were performed with standard buffer solutions of pH 4.0 and pH 7.0.
Negative controls: A baseline of headspace VOCs produced by the experimental materials was assessed to define their potential contribution to background VOCs. Triplicate negative controls included: (i) a dry Salivette® (cotton roll); (ii) a Salivette® saturated with deionised water for two minutes; (iii) a Salivette® saturated with deionised water followed by centrifugation; (iv) 20 mL headspace vials containing 500 µL, 1000 µL and 1500 µL of deionised water.
Saliva samples were stored at 4 °C and analysed within 2 h of collection. Samples were aliquoted into 20 mL glass headspace vials sealed with 18 mm screw-tops and a polytetrafluoroethylene (PTFE) septum. Vials were incubated for 30 min at 37 °C in a hot water bath to reflect the physiological body temperature. Septa were pierced with a sterile blunt needle (18 G, 1 ½ (1.2 mm × 40 mm)) for real-time direct headspace VOC analysis.
Analysis: Direct injection mass spectrometry platforms provide soft chemical ionisation reducing fragmentation rates and allowing tentative compound annotation using specific molecular weights. The proton transfer reaction time of flight-mass spectrometer (PTR-ToF-MS; Ionicon Analytik GmbH, Innsbruck, Austria) uses an untargeted analytical approach with a hydronium ion (H3O+) as the primary reagent ion. The proton (H+) is transferred from the hydronium ion (H3O+) to the volatile compounds (VOC) due to their proton affinity being greater than water (VOC.H + H2O). Hydronium ions formed from humidified air within the ionisation chamber are propelled by electric fields into the drift tube to interact with the injected sample (inlet flow 40 sccm). The protonated analyte is detected by the time-of-flight (ToF) detector according to their mass-to-charge ratio (m/z), with heavier ions travelling at a slower pace. The drift tube parameters are optimised at a temperature of 110 °C, a pressure of 2.29 mbar, and a voltage of 350 V, resulting in an E/N of 84 Td (E = electric field, N = gas number density). Quality control checks were employed for the characterisation of impurities, accuracy, fragmentation rates, and resolution of the three reagent ions. Select compounds from a permeation unit (ES 4050P, Eso Scientific, Stroud, Gloucestershire, UK) provided a steady flow of acetone, benzene, and phenol directly into the PTR-ToF-MS. Twenty seconds of headspace sampling (19–19.5 mL headspace volume) was followed by a 10 s interval. PTR-ToF-MS data was extracted using PTR-MS Viewer version 3.2.8.0 (Ionicon Analytik) and analysed using an in-house generated R script.

2.3. Longitudinal Assessment of Salivary VOCs

Saliva (3 mL) from 10 participants were collected using the optimised methodology (as determined by the above experiments) on five mornings: three samples in week one, one sample in week two, and one sample in week three. The timings were selected to assess intra- and interindividual day-to-day and week-to-week variability of the saliva of salivary VOC analysis.
Sample processing: All saliva samples were frozen at −80 °C until batch analysis. Samples were aliquoted into 20 mL glass headspace vials sealed with 18 mm screw-tops and a polytetrafluoroethylene (PTFE) septum. Vials were incubated for 30 min at 37 °C in a hot water bath to reflect the physiological body temperature. Septa were pierced with a sterile blunt needle (18 G, 1 ½ (1.2 mm × 40 mm)) for real-time direct headspace VOC analysis. Longitudinal saliva analysis was performed in triplicates of 500 µL.
Analysis: Selected ion flow tube-mass spectrometry (SIFT-MS) was chosen for the longitudinal analysis of salivary VOCs owing to its ability to perform online and real-time analysis of target VOC coupled with a user-friendly interface that is well suited to applications in large-scale clinical trials.
SIFT-MS (VoiceUltra 200; Syft Technologies, Anatune, UK) used a real-time targeted approach for VOC quantification based on soft chemical ionisation between selected reagent ions and the gaseous sample. Reagent ions (H3O+, NO+, and O2+) produced by a microwave discharge source and selected by a quadrupole mass filter are injected into an inert helium carrier gas via a flow tube to react with the sample. Product ions are separated and detected according to their mass-to-charge ratio with multiple simultaneous ion quantification. Automated daily validation cycles for data quality assurance, with an ambient operating temperature between 10–30 °C, were employed. An inlet flow rate of 25 mL/min and an analytical time frame of 20 s was selected for a 19.5 mL headspace volume. Targeted VOCs included short chain fatty acids (C2–C6) and aldehydes which have been shown to be linked to human disease [12]. Data were retrieved using the LabSyft v1.7 Software Suite.

3. Statistical Analysis

Descriptive statistics were used for data interpretation. Absolute VOCs were compared using the median and interquartile range (IQR). The coefficient of variation was used to assess the reproducibility of the longitudinal data, with <20% considered acceptable. Friedman’s test identified statistical differences in VOC variability in the longitudinal assessment (IBM SPSS Statistics version 25; Armonk, NY, USA).

4. Results

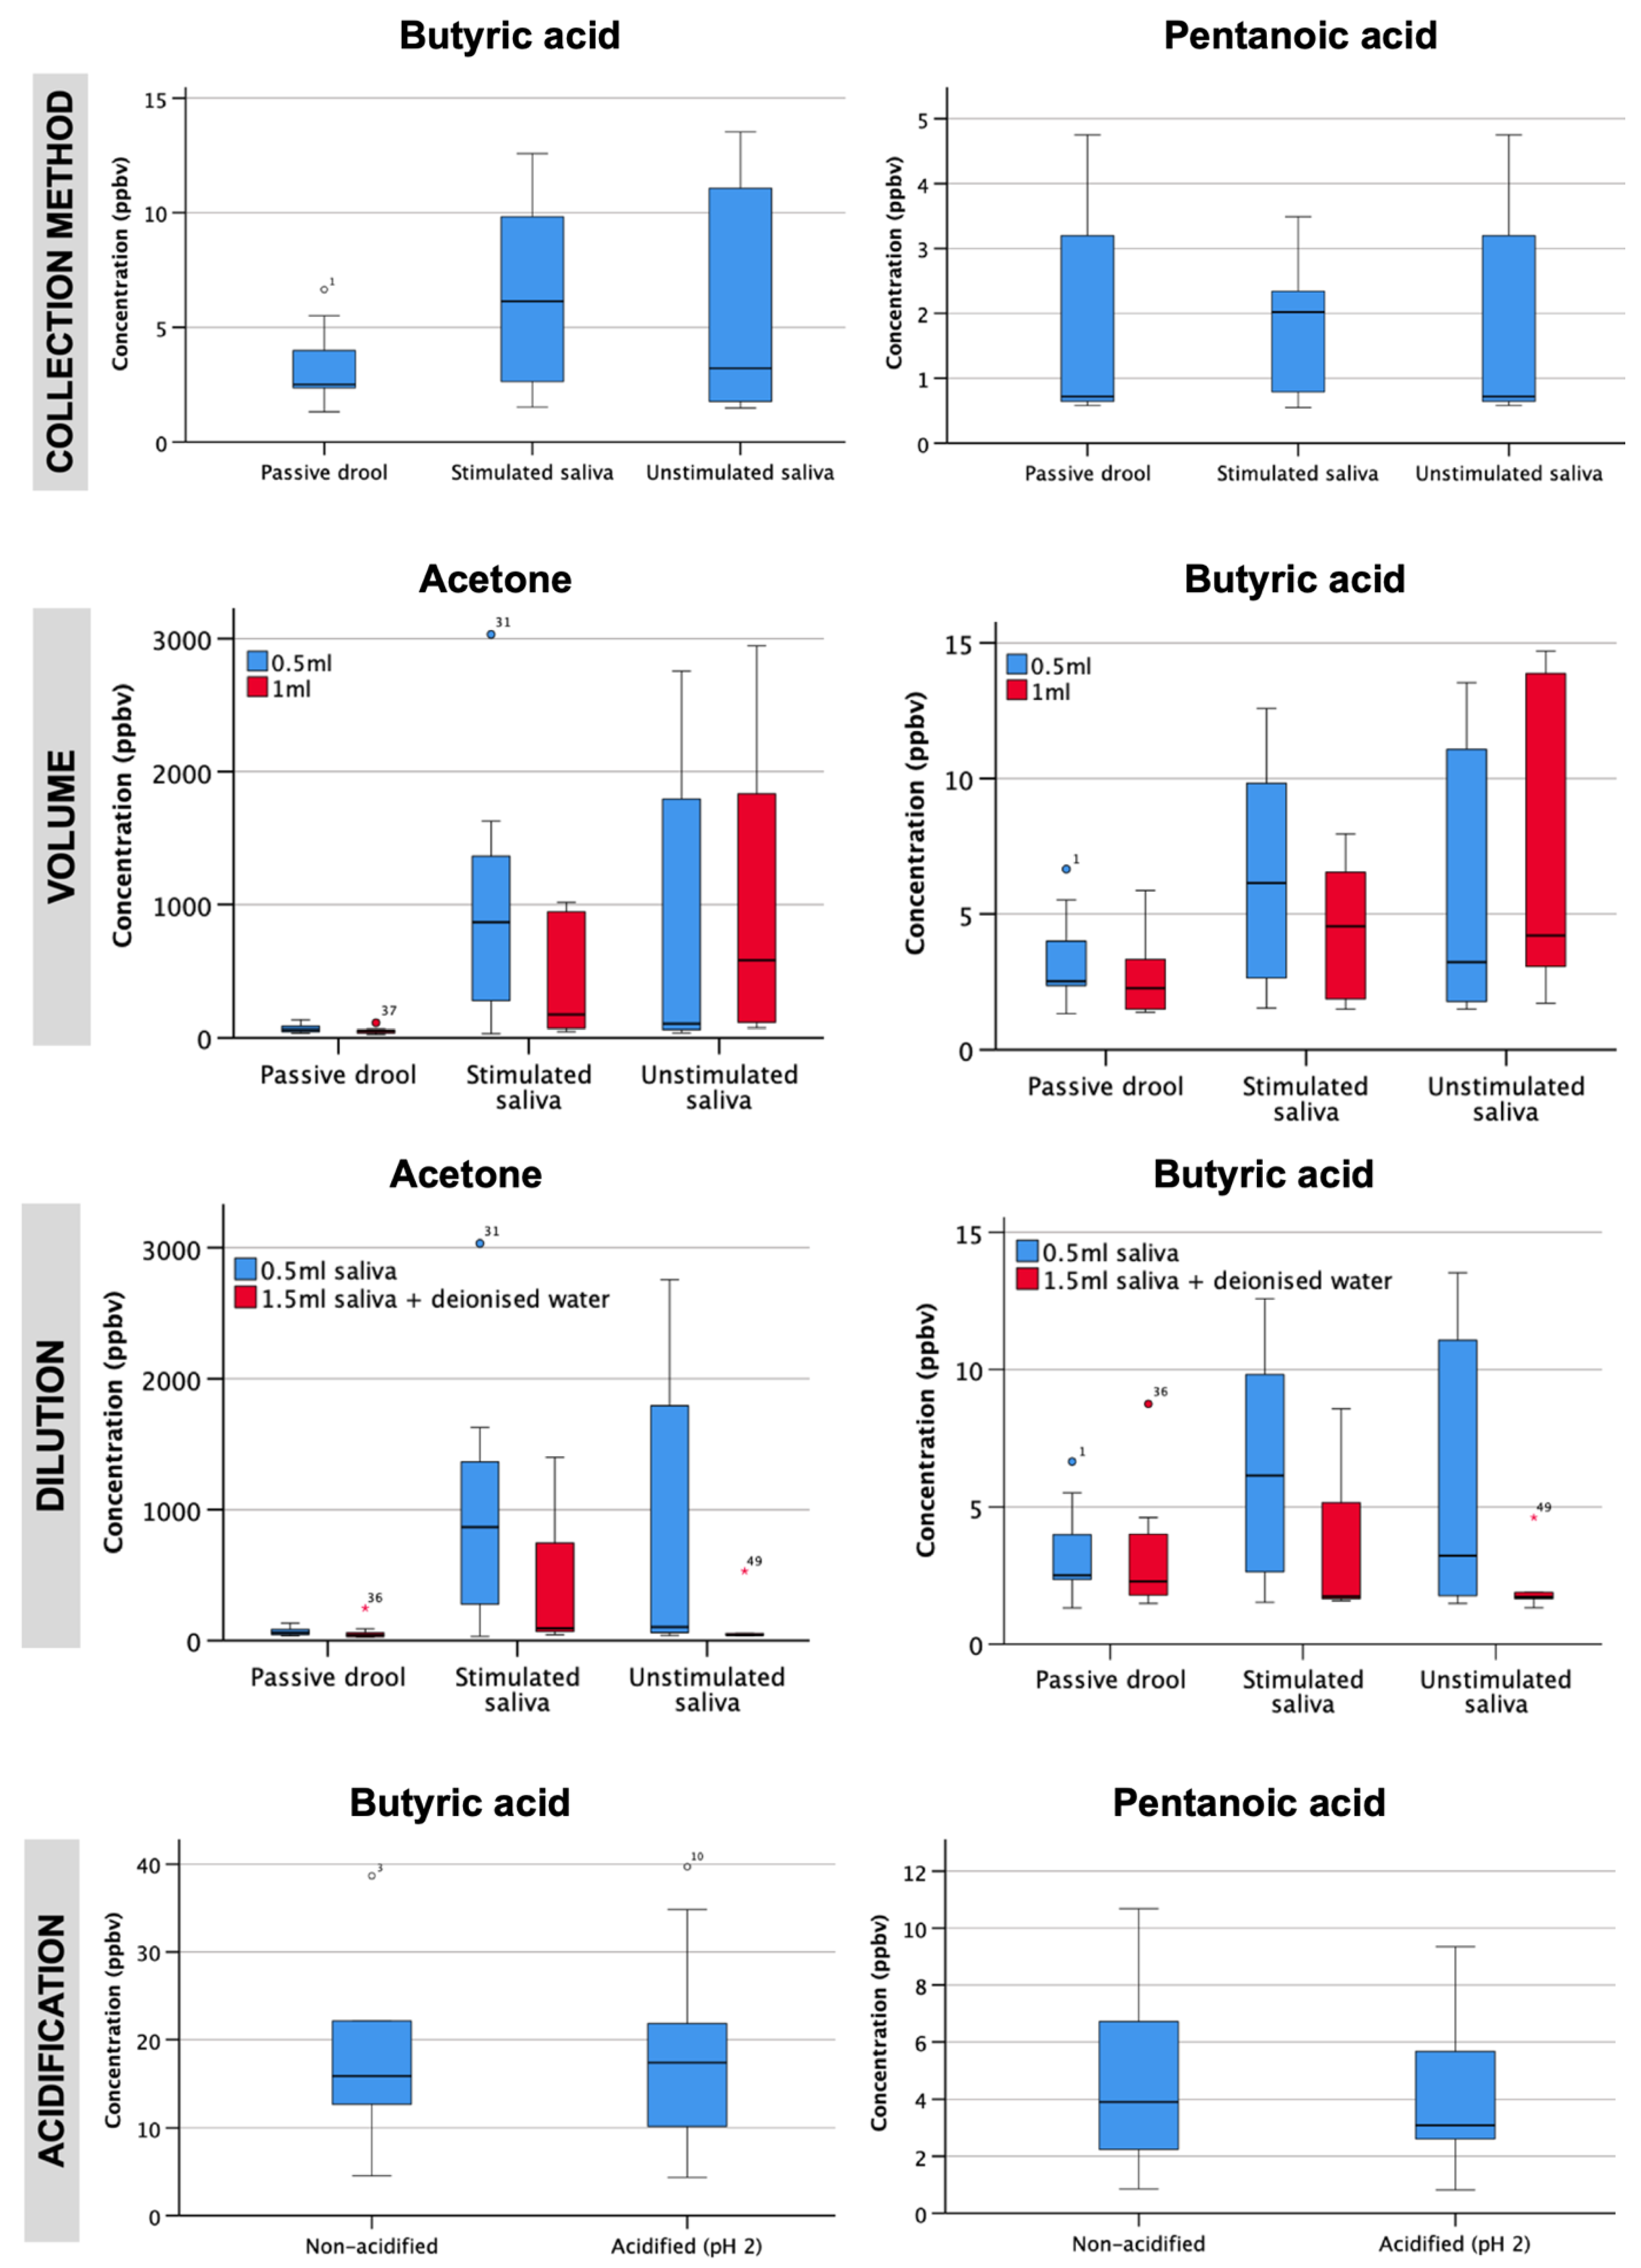
4.1. Optimal Saliva Sampling Parameters

Eleven healthy participants were recruited with a median age of 25 years (IQR: 20–29 years), and 7 (58%) were female. Details of the concentrations (ppbv) of headspace saliva VOC across all four methodological parameters and saliva collection methods are presented in Table 1 and Figure 1.
Negative controls: Headspace concentrations (ppbv) and coefficient of variation (%) using the Salivette® (various treatment conditions) and aliquots of deionised water (n = 3) were used as negative controls. Across all compounds of interest, all VOCs remained consistent with a low coefficient of variation (<10%) (Supplementary File S1). The dry Salivette® cotton roll demonstrated a high concentration of all SCFA (e.g., butyric acid at 23 ppbv) and acetone (3649 ppbv). The cotton roll saturated with deionised water showed reduced levels of butyric acid at 11 ppbv and acetone at 444 ppbv. Following centrifugation, headspace VOC analysis of the supernatant showed further reduction in butyric acid to 3.1 ppbv. This was consistent across the remaining compounds suggesting this method of collection posed a potentially significant source of contamination to saliva samples.
Saliva collection method: Saliva collection method by passive drool and unstimulated saliva yielded comparable concentrations of acetone and SCFA of interest; acetic acid 14 (IQR: 13–14) vs. 14 (IQR: 14–37) ppbv, butyric acid 2.5 (IQR: 2.4–4.0) vs. 3.2 (1.8–11.1) ppbv, respectively. Stimulated saliva generated up to 2-fold higher VOC concentrations.
Saliva volume: Both 500 µL and 1000 µL volumes of saliva across the three collection methods with a negligible variation of VOC concentrations with the passive drool method (butyric acid: 2.5 (IQR: 2.3–3.9) vs. 2.3 (IQR: 1.6–3.2) ppbv). In comparison, 500 µL of unstimulated and stimulated saliva using the Salivette® generated a 2-fold higher concentration of VOCs, with wide variability, suggestive of contributory effects from the Salivette® cotton roll.
Saliva dilution: Saliva dilution with deionised water demonstrated minimal variability with the passive drool method, including between participating subjects (butyric acid: 2.5 (IQR: 2.4–4.0) vs. 2.3 (IQR: 1.8–4.0) ppbv).
Saliva acidification: Saliva acidification to pH 2.0 did not influence the concentrations of volatile SCFA with comparable results to nonacidified saliva (butyric acid 16 (IQR: 13–21) vs. 17 (IQR: 10–22) ppbv).

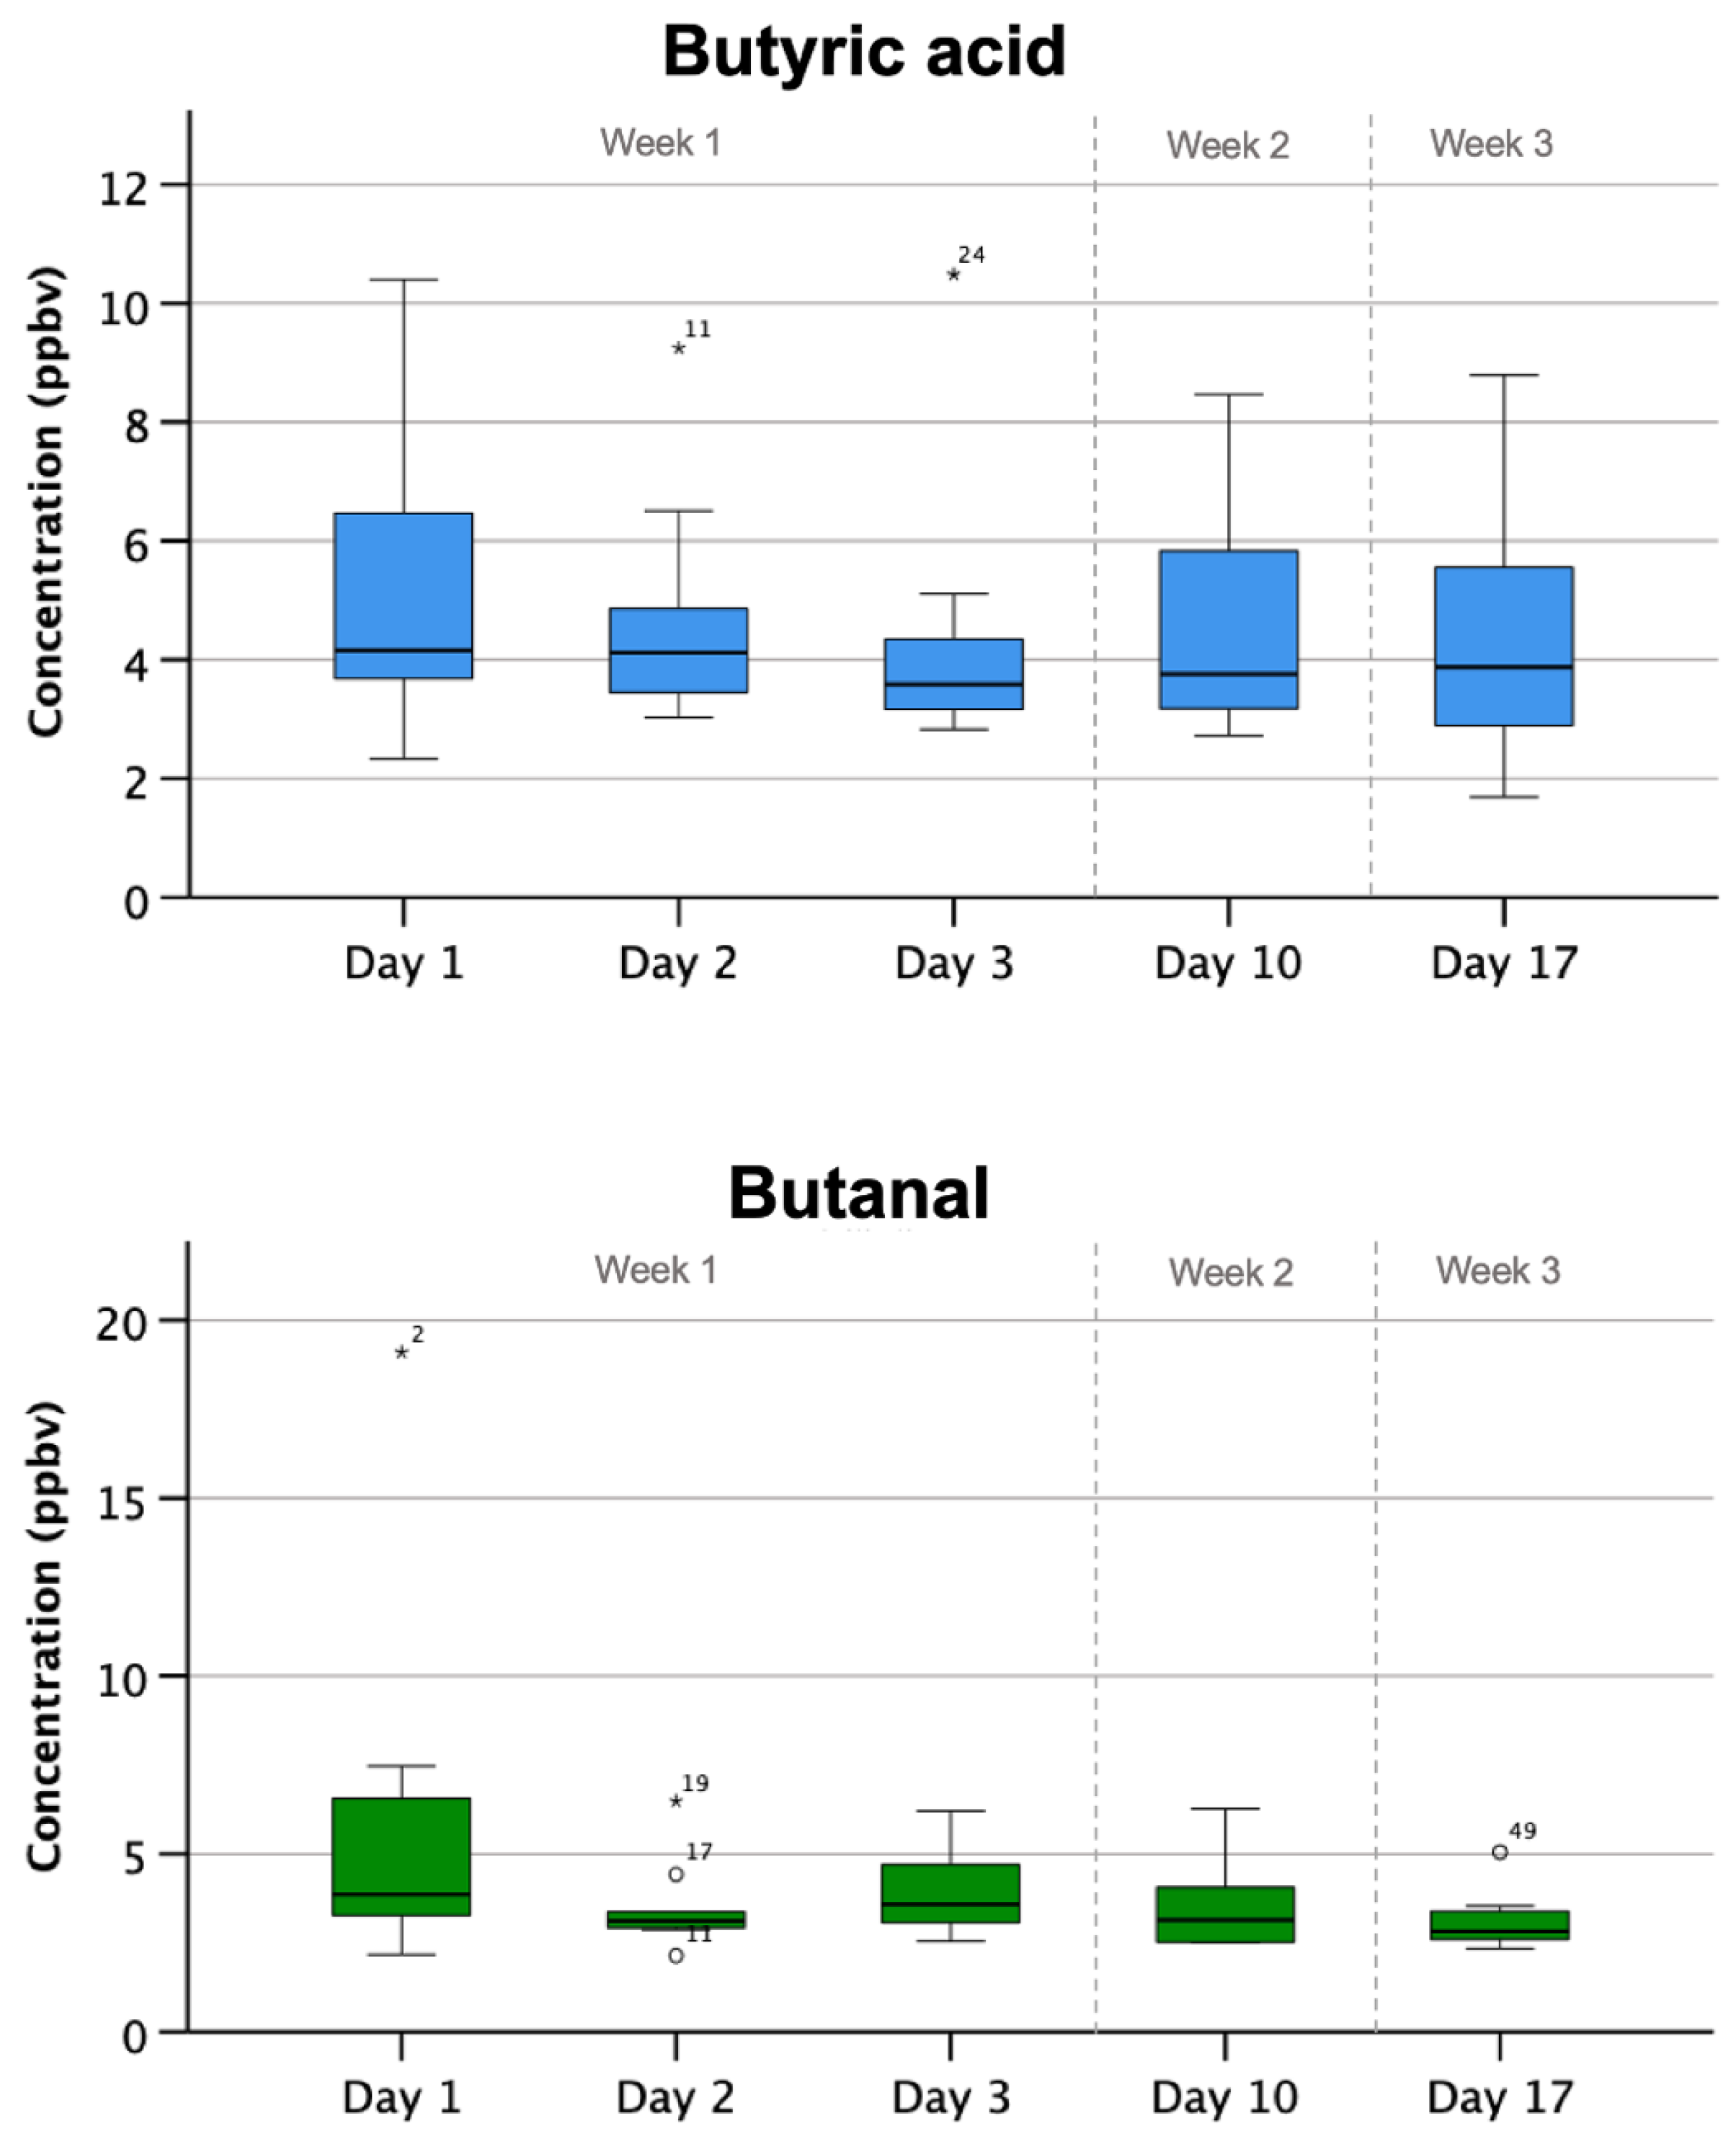
4.2. Longitudinal Assessment of Salivary VOCs

The methodology experiments suggested 500 µL of passive drool saliva sample yielded optimal results. Ten healthy participants were recruited with a median age of 30 (IQR: 25–32), with seven (70%) females. Saliva (3 mL) was collected via the passive drool method with a mean salivary flow rate of 0.7 mL/min (IQR: 0.5–0.9) and osmolality 77 mOsm (IQR: 57–89).
Intraindividual variability: For most compounds, there was an acceptable variation in levels of selected VOCs over the five assessed time points.
Concentrations of salivary VOCs over a three-week period demonstrated SCFA, including hexanoic- and pentanoic acids, were consistent, with an acceptable CV < 20%. The remaining SCFAs, butyric-, propanoic-, and acetic acids showed a wider range of variability, with CV reaching 50%. A similar trend was observed for aldehydes with acceptable concentrations between days and weeks for saliva; for example, butanal ranged from 3.3 to 4.4 ppbv (CV 12%), and pentanal from 8.3 to 14.0 ppbv (CV 19%). Concentrations of VOCs and the associated coefficient of variation across the 3 weeks are presented in Table 2.
Interindividual variability: Interindividual variability, assessing daily and weekly variation over 3 weeks, was minimal for all target compounds. Butyric acid had a CV 6.3% (concentrations of 4.2, 4.1, 3.6, 3.8, and 3.9 ppbv; p = 0.28), suggesting adequate reproducibility and limited influence from external factors. Butanal and pentanal also showed a narrow range of variation with a CV of 12.5% (p = 0.05) and 10.1% (p = 0.3), respectively. Five of the 15 compounds were statistically different, although CV% was deemed acceptable (acetic acid CV 9.6%, p = 0.03, propanoic acid CV 15.5%, p < 0.001, and heptanal CV 12.9%, p < 0.02). Acceptable VOC variability as a cohort is presented in Figure 2.

5. Discussion

The principal findings of this study were the following: (i) saliva collected by the passive drool method presents the least contaminated collection method, with negligible variability between subjects, (ii) a volume of 500 µL of saliva is acceptable for VOC headspace analysis, and (iii) salivary VOCs have an acceptable level of day-to-day and week-to-week variation. This study presents the simplest form of saliva collection with no preprocessing steps, which can introduce contamination. Salivary VOCs may therefore offer a simple, inexpensive, and acceptable method for noninvasive assessment of health and disease.
The composition of saliva is influenced by factors such as flow rate and time of sampling, which are interlinked. Unstimulated saliva flows at 0.3–0.4 mL/min and is reduced by a further 0.1 mL/minute during sleep [9]. Therefore, morning saliva samples following an overnight fast are likely to be more concentrated with reduced flow. Stimulated saliva associated with higher flow rates has demonstrated a different electrolyte profile compared to unstimulated morning saliva [13]. Zheng et al. reported the expression of genes associated with circadian patterns and supported by varying concentrations of salivary electrolytes [14]. This was supported in this study with higher osmolality and reduced flow rates identified in unstimulated samples (i.e., passive drool; 99 mOsm, 0.7 mL/min) compared with stimulated samples with higher flow rates and reduced osmolality (64 mOsm, 1.9 mL/min). The passive drool and unstimulated method yielded comparable results; however, the Salivette® cotton roll introduced significant contamination of target compounds. Sample collection by passive drool is simple and inexpensive and minimises potential sources of bias. To establish a standardised method, we suggest a collection of morning saliva samples to reduce potential exogenous sources of bias/contamination introduced by daily activities.
With a standardised methodology, the reproducibility of headspace salivary VOCs showed that longitudinal VOC variation was specific to target VOCs. Acetaldehyde and propanal showed wide variation over a three-week period with a high coefficient of variation > 50%. This suggests that certain VOCs may be labile either due to their volatility or systemic factors. However, the majority of compounds were stable, with a comparable median and low coefficient of variation. Comparisons between VOCs in healthy controls and disease-specific states should consider the range and variation. A narrow range of concentrations may not be as important as the differences in levels between both control and disease groups. Higher levels of certain VOCs in disease states relative to healthy states can mean that a wider variation is acceptable.
Although this study presents a standardised model for saliva collection, the lack of normalisation of the results has been considered. Saliva normalisation has largely been established in the field of proteomics research, where osmolality or protein content, a measure of solute concentration within the given volume, can be used effectively. Consideration has been given to a variety of normalisation techniques; however, they did not yield valuable information. In this case, salivary flow rates and osmolality were within acceptable ranges supporting the reported study outcomes. The current study relied on two direct injection mass spectrometry methods for VOC analysis. Future biomarker discovery studies may benefit from using alternative analytical platforms, such as gas chromatography–mass spectrometry, that may provide broader untargeted analysis of the salivary volatilome.

6. Conclusions

Whole saliva collected by a passive drool method at a minimum volume of 500 µL is sufficient for direct headspace analysis of VOCs. Standardisation with morning sampling after a fasted state of six hours is recommended and supported by this study demonstrating minimal intersubject variability. Increased volume and dilution techniques to concentrate headspace VOCs demonstrated no significant benefit. Saliva collection tools have been shown to be a potential source of contamination for VOC analysis. Therefore, the simplest method of saliva collection and pre-processing is considered optimal for headspace VOC analysis. Negligible longitudinal changes in the level of target VOCs suggest salivary VOCs may be a feasible method for clinical diagnostics. However, it is important to carry out further studies to establish a normal range of VOCs in healthy and diseased populations to ascertain clinically significant VOCs. Optimising salivary VOC methods is critical with a view of its importance in clinical translation. Salivary VOCs present a simple, cost-effective, and acceptable method for noninvasive assessment of health and disease.

Supplementary Materials

The following supporting information can be downloaded: https://www.mdpi.com/article/10.3390/app13074084/s1. File S1: Background concentrations (ppbv) of selected VOC originating from saliva collection equipment.

Author Contributions

Conceptualization, B.V., P.R.B.; methodology, B.V., I.B.; formal analysis, J.J., M.P., B.V., I.B.; data curation, J.J., M.P.; writing—original draft preparation, B.V.; writing—review and editing, I.B., P.R.B., G.B.H.; supervision, I.B., P.R.B., G.B.H. All authors have read and agreed to the published version of the manuscript.

Funding

This research received no external funding.

Institutional Review Board Statement

The study was conducted in accordance with the Declaration of Helsinki, and approved by the Imperial College Healthcare NHS Trust Tissue Bank, REC Wales approval 17/WA/0161 (R20059).

Informed Consent Statement

Informed consent was obtained from all subjects involved in the study.

Data Availability Statement

The data presented in this study are available on request from the corresponding author.

Conflicts of Interest

The authors declare no conflict of interest.

Abbreviations

Coefficient of variation percentage, CV%.

References

  1. Phillips, M.; Herrera, J.; Krishnan, S.; Zain, M.; Greenberg, J.; Cataneo, R.N. Variation in volatile organic compounds in the breath of normal humans. J. Chromatogr. B Biomed. Sci. Appl. 1999, 729, 75–88. [Google Scholar] [CrossRef] [PubMed]
  2. Pal, V.K.; Li, A.J.; Zhu, H.; Kannan, K. Diurnal variability in urinary volatile organic compound metabolites and its association with oxidative stress biomarkers. Sci.Total Environ. 2022, 818, 151704. [Google Scholar] [CrossRef] [PubMed]
  3. Humphrey, S.P.; Williamson, R.T. A review of saliva: Normal composition, flow, and function. J. Prosthet. Dent. 2001, 85, 162–169. [Google Scholar] [CrossRef] [PubMed]
  4. Bel’skaya, L.V.; Sarf, E.A.; Shalygin, S.P.; Postnova, T.V.; Kosenok, V.K. Identification of salivary volatile organic compounds as potential markers of stomach and colorectal cancer: A pilot study. J. Oral Biosci. 2020, 62, 212–221. [Google Scholar] [CrossRef]
  5. Monedeiro, F.; Milanowski, M.; Ratiu, I.A.; Zmysłowski, H.; Ligor, T.; Buszewski, B. VOC Profiles of Saliva in Assessment of Halitosis and Submandibular Abscesses Using HS-SPME-GC/MS Technique. Molecules 2019, 24, 2977. [Google Scholar] [CrossRef] [Green Version]
  6. Vadhwana, B.; Belluomo, I.; Boshier, P.R.; Pavlou, C.; Španěl, P.; Hanna, G.B. Impact of oral cleansing strategies on exhaled volatile organic compound levels. Rapid Commun. Mass Spectrom. 2020, 34, e8706. [Google Scholar] [CrossRef]
  7. Bhattarai, K.R.; Kim, H.R.; Chae, H.J. Compliance with Saliva Collection Protocol in Healthy Volunteers: Strategies for Managing Risk and Errors. Int. J. Med. Sci. 2018, 15, 823–831. [Google Scholar] [CrossRef] [Green Version]
  8. Inui, T.; Palmer, R.J., Jr.; Shah, N.; Li, W.; Cisar, J.O.; Wu, C.D. Effect of mechanically stimulated saliva on initial human dental biofilm formation. Sci. Rep. 2019, 9, 11805. [Google Scholar] [CrossRef] [Green Version]
  9. Iorgulescu, G. Saliva between normal and pathological. Important factors in determining systemic and oral health. J. Med. Life 2009, 2, 303–307. [Google Scholar] [PubMed]
  10. Al-Kateb, H.; de Lacy Costello, B.; Ratcliffe, N. An investigation of volatile organic compounds from the saliva of healthy individuals using headspace-trap/GC-MS. J. Breath Res. 2013, 7, 036004. [Google Scholar] [CrossRef] [PubMed] [Green Version]
  11. Martin, H.J.; Riazanskaia, S.; Thomas, C.L. Sampling and characterisation of volatile organic compound profiles in human saliva using a polydimethylsiloxane coupon placed within the oral cavity. Analyst 2012, 137, 3627–3634. [Google Scholar] [CrossRef] [PubMed] [Green Version]
  12. Markar, S.R.; Wiggins, T.; Antonowicz, S.; Chin, S.T.; Romano, A.; Nikolic, K.; Evans, B.; Cunningham, D.; Mughal, M.; Lagergren, J.; et al. Assessment of a Noninvasive Exhaled Breath Test for the Diagnosis of Oesophagogastric Cancer. JAMA Oncol. 2018, 4, 970–976. [Google Scholar] [CrossRef] [PubMed] [Green Version]
  13. Dawes, C. Circadian rhythms in human salivary flow rate and composition. J Physiol. 1972, 220, 529–545. [Google Scholar] [CrossRef] [PubMed]
  14. Zheng, L.; Seon, Y.J.; McHugh, J.; Papagerakis, S.; Papagerakis, P. Clock genes show circadian rhythms in salivary glands. J Dent. Res. 2012, 91, 783–788. [Google Scholar] [CrossRef] [PubMed] [Green Version]
Figure 1. Four methodological parameters of saliva headspace optimised by VOC concentration (ppbv) assessment. Circles and asterisks denote outlying values.
Applsci 13 04084 g001
Figure 2. Longitudinal variation of the concentrations (ppbv) of butyric acid and butanal in saliva. Circles and asterisks denote outlying values.
Applsci 13 04084 g002
Table 1. Influence of sampling methodology on the selected salivary VOC concentrations (ppbv).
Acetone
(m/z 59)
Acetic Acid
(m/z 61)
Butyric Acid
(m/z 89)
Pentanoic Acid
(m/z 103)
Hexanoic Acid
(m/z 117)
Saliva collection
Passive drool60 (46–86)14 (13–14)2.5 (2.4–4.0)1.0 (0.8–1.1)0.8 (0.7–0.9)
Unstimulated saliva104 (61–1793)14 (14–37)3.2 (1.8–11.1)0.7 (0.6–3.2)0.7 (0.6–2.3)
Stimulated saliva866 (278–1365)24 (16–27)6.1 (2.6–9.8)2.0 (0.8–2.3)1.1 (0.8–1.5)
Volume
Passive drool
500 µL57 (46–90)14 (13–14)2.5 (2.3–3.9)0.9 (0.8–1.1)0.8 (0.7–0.9)
1000 µL51 (37–58)13 (13–14)2.3 (1.6–3.2)0.8 (0.7–1.0)0.8 (0.5–0.8)
Unstimulated saliva
500 µL1430 (390–1883)28 (16–44)8.2 (4.0–12)2.0 (0.9–3.9)1.8 (0.8–2.3)
1000 µL581 (213–1538)18 (15–44)4.2 (3.3–12)1.2 (0.8–4.3)1.0 (0.7–2.4)
Stimulated saliva
500 µL866 (453–1365)24 (19–27)6.1 (3.2–9.7)2.0 (1.3–2.6)1.3 (0.9–1.6)
1000 µL173 (71–946)14 (13–26)4.5 (1.9–6.5)0.8 (0.6–2.9)0.7 (0.6–1.6)
Dilution
Passive drool
500 µL saliva60 (46–86)14 (13–14)2.5 (2.4–4.0)1.0 (0.8–1.1)0.8 (0.7–0.9)
500 µL saliva + 1 mL deionised water41 (29–59)13 (13–14)2.3 (1.8–4.0)0.9 (0.7–0.9)0.8 (0.7–0.9)
Unstimulated saliva *
500 µL saliva104 (55–104)14 (14–14)1.8 (1.6–3.2)0.7 (0.6–0.7)0.6 (0.6–0.7)
500 µL saliva + 1 mL deionised water43 (40–55)14 (14–15)1.7 (1.7–1.9)0.7 (0.7–0.7)0.6 (0.6–0.7)
Stimulated saliva †
500 µL saliva1589288.92.21.8
500 µL saliva + 1 mL deionised water512194.01.31.0
Acidification
Non-acidified761 (635–1500)85 (43–108)16 (13–21)3.9 (2.6–6.0)2.0 (1.2–2.7)
Acidified (pH 2.0)692 (556–932)91 (47–160)17 (10–22)3.1 (2.6–5.7)2.0 (1.2–2.5)
Values are median concentration, ppbv (interquartile range). All experiments included 11 participants unless otherwise stated. * Five participants; † three participants.
Table 2. Longitudinal variation of the concentrations (ppbv) of target short chain fatty acids and aldehydes in saliva.
CompoundMedian Concentration (ppbv)CV%p Value
Day 1Day 2Day 3Day 10Day 17
Acetone179145184196246190.06
Short chain fatty acids
Acetic acid8.26.76.56.96.79.60.03
Butanoic acid4.24.13.63.83.96.30.28
Hexanoic acid1.41.31.01.21.0150.15
Pentanoic acid4.33.73.73.53.87.90.12
Propanoic acid5.34.23.93.64.216<0.001
Aldehydes
Acetaldehyde153175207135210190.049
Butanal3.93.13.63.12.8130.05
Decanal1.61.51.81.81.58.10.71
Heptanal2.42.32.62.51.8130.02
Hexanal6.74.85.64.34.5190.4
Nonanal3.22.93.43.12.96.70.03
Octanal2.82.22.62.32.2110.69
Pentanal14.813.512.011.512.6100.3
Propanal28.220.028.519.928.318.40.69
Disclaimer/Publisher’s Note: The statements, opinions and data contained in all publications are solely those of the individual author(s) and contributor(s) and not of MDPI and/or the editor(s). MDPI and/or the editor(s) disclaim responsibility for any injury to people or property resulting from any ideas, methods, instructions or products referred to in the content.

