Article

Prediction and Classification of User Activities Using Machine Learning Models from Location-Based Social Network Data

1
School of Communication & Information Engineering, Shanghai University, Shanghai 200444, China
2
Institute of Smart City, Shanghai University, Shanghai 200444, China
3
School of Computer Science, University of Technology Sydney, Ultimo, NSW 2007, Australia
4
Department of CS & IT, University of Azad Jammu and Kashmir, Muzaffarabad 13100, Pakistan
*
Author to whom correspondence should be addressed.
Appl. Sci. 2023, 13(6), 3517; https://doi.org/10.3390/app13063517
Submission received: 18 January 2023 / Revised: 3 March 2023 / Accepted: 7 March 2023 / Published: 9 March 2023
(This article belongs to the Special Issue Recent Applications of High-Performance Computing)

Abstract

:
The current research has aimed to investigate and develop machine-learning approaches by using the data in the dataset to be applied to classify location-based social network data and predict user activities based on the nature of various locations (such as entertainment). The analysis of user activities and behavior from location-based social network data is often based on venue types, which require the input of data into various categories. This has previously been done through a tedious and time-consuming manual method. Therefore, we proposed a novel approach of using machine-learning models to extract these venue categories. In this study, we used a Weibo dataset as the main source of research and analyzed machine-learning methods for more efficient implementation. We proposed four models based on well-known machine-learning techniques, including the generalized linear model, logistic regression, deep learning, and gradient-boosted trees. We designed, tested, and evaluated these models. We then used various assessment metrics, such as the Receiver Operating Characteristic or Area Under the Curve, Accuracy, Recall, Precision, F-score, and Sensitivity, to show how well these methods performed. We discovered that the proposed machine-learning models are capable of accurately classifying the data, with deep learning outperforming the other models with 99% accuracy, followed by gradient-boosted tree with 98% and 93%, generalized linear model with 90% and 85%, and logistic regression with 86% and 91%, for multiclass distributions and single class predictions, respectively. We classified the data using our machine-learning models into the 10 classes we used in our previous study and predicted tourist destinations among the data to demonstrate the effectiveness of using machine learning for location-based social network data analysis, which is vital for the development of smart city environments in the current technological era.

1. Introduction

The research on Location-Based Social Network (LBSN) data has gained huge attention from scholars with the rapid growth of mobile technologies. The LBSN data have been used for analysis in various specialized fields, such as the study of people’s behavior in festivals, shopping malls, food venues, tourism, and many more. These kinds of data contain heterogeneous attributes about users from multiple venues; researchers need to filter out the data relevant to specific venues in order to conduct more specialized studies. The dataset often includes thousands or millions of records before the data analysis and requires the filtering out of data relevant to specific venue classes previously done manually, which is a time-consuming and troublesome issue for this kind of research [1,2,3,4,5,6,7]. Therefore, some machine-learning methodologies that can classify the data based on some specific characteristics are required so that the multivenue data can be classified without the need for manual work. With the interactive web-based interface of modern LBSNs, researchers have more opportunities to utilize the data regarding the majority of the population for various kinds of analysis. These data provide a sample of various aspects of human behavior and traits while interacting with the LBSN during a variety of activities through check-ins from different venues. The study of these behaviors provides valuable insights into the general trends within the population for the planning and development of events, festivals, parks, shopping malls, restaurants and, ultimately, a smart city [8]. The LBSN data have also been used in more specialized studies like finding the popularity factors of restaurants, the role of parks, tourism behavior, and many more, which are proved to be tremendously valuable in these fields. However, for these specialized studies, it is important to consider the data relevant only to these venues within the huge number of records and manually classify the specific data for each individual research. As one of the strengths of using LBSN data for human behavior is the availability of huge amounts of data, it is often difficult and more time-consuming to classify the data for finding relevant records [5].
An important domain of LBSN analysis is based on multiple venue types, such as observing check-in analysis [3,4,5,6,7,8,9] or the analysis of user activities and behavior of a single venue category like the attraction feature of restaurants as well as an analysis of parks, tourist destinations, and many more [10,11,12,13,14,15,16] The fundamental goal of this research is to find and develop machine-learning methods that can be used to classify the LBSN data into the most commonly used venue categories and predict the tourism venues for analyzing the behavior of tourists and residents in Shanghai city while showing the efficiency of the proposed models for LBSN studies. This research question was formulated after finding the research gap from our rigorous literature review, suggesting that many previous studies have been conducted in the field of LBSN analysis with the manual classification of data. The use of machine learning provides a more efficient way to conduct these studies while keeping the integrity and validity of the research intact so that the researchers and developers can focus on more beneficial analysis without worrying about going through each record among the piles of “Big Data” manually [17]. In the same context, Wang et al. [18] also pointed out some additional detriments of manual classification while discussing the imperfection and unreliability of classifications generated with the human eye. Therefore, the computerized, digitized, machine-learning-based classification of the data is proposed. To show the feasibility of the dataset used in this study, we initially applied statistical analysis using IBM SPSS 25, followed by the proposed machine learning through Rapid Miner [19]. After consideration of the research gap, we addressed the following research question in this study:
  • How can we use machine learning to categorize LBSN data into specialized fields? And which machine-learning model best fits the LBSN data to predict a specific class of venues (tourism) for the study of a particular research domain.
In the current research, we analyzed various machine-learning methodologies and proposed a novel approach to the venue classification problem by using machine learning with the help of four models that show promising performance in the classification of data into multiple classes and predicting the designated class of users based on the information about activities performed at different venues from their check-in records. Once the models are trained and implemented, they can remove the overhead of manual classification in the field of venue-based LBSN analysis.

2. Literature Review

One of the major sources of big data used in different kinds of analysis is LBSN. It is a valuable research field that is considered the center of various research domains like geography analysis, human behavior, activities, preferences, etc. This kind of research initially used manual data collection methods such as surveys, interviews, questionnaires, and other statistical methods [20,21,22]. However, with the passage of time, the manual collection of data is not deemed appropriate due to the requirement of big data in the true sense for finding significant patterns within the data. The data collection method evolved into the use of global positioning systems coordinates, location-based online services, and smart cards with the developments in mobile technology [23,24]. As communication devices became more and more portable, data collection about user activities through these devices became easier and more accessible to researchers. One of the earlier research studies by Gonzalez et al. [25] used data from about 100,000 users. It was the early-stage introduction of portable devices, and the technology to pinpoint the exact location of users was not mature enough. However, it provided a reasonable approximation of the users with the nearest base tower while making a call. Numerous researchers have discussed the importance of using location-based data for user behavior and activity patterns, including the articles [10,26,27,28,29,30,31].
The user activity analysis then shifted to the use of online social networks as a source of big data because portable mobile devices became more readily available almost everywhere in the world [32]. The facility of posting activities and preferences with locations provided by the online services not only interests users to share their life with friends, but also works as a tool for generating huge amounts of data, which can be used to find patterns in the general user behavior by exploring the similarities and differences in these activities as discussed in the articles [33,34,35]. Many research articles are published comprising the study of users’ behavior, including user mobility [36], geo-social recommendations [37], recommendation systems based on the study of two different cities in the United Kingdom [11], etc.
One of the major research fields in the study of LBSN is the exploration of patterns in the data with respect to venues [9]. An enormous dataset was used by Li et al. [12] containing about 2.4-million sites in 14 different countries from Foursquare to find the popularity features of different venues. The authors concluded three core features - a venue’s profile, age, and nature of the activities—as the most influential factors in the popularity of venues. Similarly, Bawazeer et al. [38] conducted a study about “Food” venues and the general behavior of users in the capital of Saudi Arabia, Riyadh. They suggested that people share their experiences more frequently from food venues as compared to other venues. A study based on Foursquare containing nearly 19,000 users from New York, San Francisco, and Hong Kong was conducted by Xie et al. [39] for the purpose of finding about preferences among different types of venues during different times of the day.
Most of the literature mentioned above is based on data from mobile phones or some of the most famous LBSNs used almost all over the world, such as Twitter, Foursquare, etc. The study of patterns within the LBSN data is based mostly on these internationally recognized platforms, which represent the most common user behavior and trends [40]. However, these renowned applications are not commonly used in China. One of the most frequently used LBSNs in China is called Sina Weibo (or Weibo), which is utilized by the majority of people and, therefore, famous amongst researchers for LBSN data analysis. Some examples of studies based on Weibo include finding the attraction feature of famous tourism venues in Shenzhen [16], the study of human mobility and activity patterns for the analysis of Beijing’s urban borders [41], the sentiment analysis of user opinions within the contextual data for finding tourism attraction features and many more [6,7]. In our previous work, we used similar Weibo check-in data for an analysis of user behavior with respect to time and venues and the contribution of different types of venues in city dynamics while considering the preferences of the users and the comparative analysis of the behavior of tourists and residents within the Shanghai city [5,9].
Automated data collection and analysis can provide more efficient ways for the exploration of big data. Some of the significant applications of machine learning in exploring different aspects of web-based data include disease diagnosis using IoT [42], web mining [43], channel propagation [44], various similar domains [45,46,47,48], and many more. However, previous research studies in the LBSN data analysis domain are based on huge data collected online automatically in order to get more insights, but the classification of data into multiple activities or venues has been done manually by searching through thousands or millions of records of user data, which takes a lot of time and effort by the researcher. Therefore, in this study, we propose different implementations of various machine-learning methods for venue classification into multiple classes and for predicting a desired class using the same data from Weibo for Shanghai, applied in our previous research.

3. Materials and Methods

In this section, we describe the general framework and methodology of the research and the steps involved in this study. Figure 1 illustrates the workflow of our classification methodology.
The pictorial representation of the experimental setup for the location category-based activity predictions and classification using RapidMiner include the following steps:
  • Data collection and preprocessing: The first step is to collect the data and prepare it for the analysis. This involves cleaning the data, removing any duplicates, and encoding categorical variables. The data used in this research can be acquired using Weibo API.
  • Feature Selection and Data splitting: The data attributes used in this research are selected after verifying the variable significance using linear regression. The data are then split into training and testing sets. The training set is used to build the model, while the testing set is used to evaluate the performance of the model.
  • Model Training: Several machine-learning models are used to classify the location categories, including generalized linear model, deep learning, logistic regression, and gradient-boosted trees. Each model is trained and evaluated on the training and testing sets.
  • Model evaluation: The performance of each model is evaluated using metrics such as accuracy, precision, recall, F1-score, ROC curve, AUC, confusion matrices, and lift chart.
  • Model Comparisons: The best-performing model can be highlighted based on its overall performance and ability to accurately classify and predict the location categories.
The experiments were performed on a computer with an Intel Core i7 processor, 16GB of RAM, and a Nvidia GeForce GTX 1060 graphics card. The software used included RapidMiner 9.7, Python 3.8, and IBM SPSS. Further details of the dataset and methodology are provided in the following sections.

3.1. Data Source

The data source used in the current study is acquired from Weibo, which was used in our previous research for venue classification [9]. The dataset includes the following features as extracted during the data acquisition and pre-processing:
  • User ID (unique for every user; however, available multiple times with subsequent check-ins).
  • Gender of the user.
  • Check-in day (day of the week including weekends/weekdays).
  • Check-in time.
  • Check-in location name (such as Shanghai University, Lingnan Park, etc.).
  • Check-in category (used for training during the supervised learning).
The dataset used in this study was acquired from 441,471 check-ins by 144,582 users from 20,171 venues. We utilized the previously classified data based on their names and the nature of activities performed at each venue, which demonstrates the efficiency of the proposed models for the supervised learning of the classification and prediction. We utilized a 10-fold cross-validation method for dividing the datasets for training and testing with a stratification for the evaluation of these models.

3.2. Statistical Analysis

One of the most widely used statistical software, IBM SPSS 25, was applied for statistical analysis to show the significance of using the variables for classification and analysis, and to identify the correlation between these variables to assess which variables should be used for such modeling. More details, including the results, are provided in Section 4.1. The LBSN datasets include several features used for research in variety of domains. Although these features possess value in one way or another, it is imperative to choose the best possible features for research in any individual domain. We used the famous multiple linear regression and correlation matrix to include attributes with p-values with a threshold of 0.05 [49] for selecting the best suitable attributes within the dataset for the current research.

3.3. Model Evaluation

The proposed models are implemented using the famous machine-learning platform called RapidMiner [19]. An important part of machine learning is the model evaluation to estimate the effectiveness and efficiency of the methods used for analysis [50]. A portion of data is always used for training methods, and some portion of unseen data is kept justifying that the said model is good or bad and that the classification or prediction is made correctly. The evaluation techniques used in this study include accuracy and Confusion Matrices for Classification, Area Under the Curve (AUC), or Receiver Operating Characteristic (ROC), accuracy, precision, recall, F-score, and sensitivity for tourism venue prediction problem. Most of these well-known evaluation methods are self-explanatory, and some are described here. The AUC shows the association of true-to-false positive rates [51] containing threshold, each producing a 2 × 2 contingency matrix. The precision is a measure of the true positive predations that are accurately classified. The recall refers to the true positive prediction out of all positive values in the dataset. The F-score captures both the recall and precision into a single value to show both these properties, and the sensitivity is the true positive recognition ratio.

4. Results

This section provides our results with a detailed explanation with the evaluation and comparison of the proposed models.

4.1. Statistical Modelling

To find the importance of variables expected in this study, it was necessary to look at the predictors and their effect on the number of check-ins statistically before the implementation of the machine-learning algorithms [4]. In order to show the significance of the variables used in this research, we present multiple linear regression as shown in Equation (1):
Y   =   β 0 +   β 1 x 1 +   β 2 x 2 +   β 3 x 3 + +   β k x k + ϵ ,
where  Y  is the response,  β k is the  k - th coefficient,  x k  is the  k - th observation ( k = 1 , , n ), and  ϵ  is the noise term. The parameters and considered variables are shown in Equation (2).
Y   =   β 0 +   β 1   User _ ID   +   β 2   Gender +   β 3   Time +   β 4   Day         +   β 5   Location _ Name +   β 6   Educational   +   β 7   Entertainment           +   β 8   Food   +   β 9   General _ Location +   β 10 Hotel           +   β 11   Professional   +   β 12   Residential           +   β 13   Shopping   &   Services   +   β 14   Sports   +   β 15   Travel + ϵ
With the application of this regression model, the values are shown in Equation (3).
y ^ =   b 0 +   b 1   User _ ID   +   b 2   Gender +   b 3   Time +   b 4   Day +   b 5   Location _ Name +   b 6   Educational   +   b 7   Entertainment   +   b 8   Food   +   b 9   General _ Location +   b 10   Hotel   +   b 11   Professional   +   b 12   Residential   +   b 13   Shopping   &   Services   +   b 14   Sports   +   b 15   Travel + ϵ ,
The model coefficients are presented in Table 1, where “Education” depicts a unit increase in the value; the check-ins raised approximately 1.6% times with a low p-value; likewise, the number of check-ins in other categories have low p-values, demonstrating the significant variables.
The feasibility and significance of the data attributes used in this research can also be observed in the correlation matrix, as shown in Table 2:
The statistical analysis provides the means of selecting the most efficient variables for successful classification and prediction before using machine-learning techniques. In the next stage, we used these significant variables for our proposed machine-learning models’ implementation for LBSN data analysis.

4.2. Classification into Multiple Venue Types

The following four machine-learning methods have been proposed in this study based on the generalized linear model, deep learning, logistic regression, and gradient-boosted trees for venue classification in order to improve the classification of LBSN data that have been done manually for decades in many fields by a variety of researchers. The previously studied 10 venue classes have been used for supervised learning, namely “Educational,” “Entertainment,” “Food,” “General Location,” “Hotel,” “Professional,” “Residential,” “Shopping & Services,” “Sports,” and “Travel.” Figure 2 shows the overall performance of these methods for classification problems.
The results show the high accuracy of deep learning for our classification problem of LBSN data into prespecified categories. The other models, including the generalized linear model, logistic regression, and gradient-boosted trees, also performed very well in the classification of LBSN data. The deep-learning model has a high accuracy, which suggests that it is able to accurately predict the location category of a given user based on the input variables. The gradient-boosted tree model also has a high accuracy, which indicates that it is able to make accurate predictions. The linear regression models are simple, easy to interpret, and fast to train. They are best suited for linear problems, where the relationship between the predictors and the target is approximately linear. In these cases, linear regression models can provide accurate predictions and good interpretability. The gradient-boosted trees, on the other hand, are more flexible and powerful and can handle non-linear relationships between the predictors and the target. They are based on decision trees, which are decision-making models that can capture complex relationships in the data. Gradient-boosted trees can also handle missing or noisy data, and they can learn interactions between predictors. In general, gradient-boosted trees tend to outperform linear regression models when the relationship between the predictors and the target is non-linear, and when the data contains noise or missing values. However, gradient-boosted trees can be more difficult to interpret and can be slower to train than linear regression models. It is important to note that the choice of the best model depends on the specific requirements of the task, the nature of the data, and the desired performance characteristics. In the following section, we provide the confusion matrix for each implemented model to show how significantly they performed on the testing data. The performance of each individual model is provided in the following sections.

4.2.1. Generalized Linear Model

It is one of the fastest and most efficient methods working as a probabilistic classifier that has been used in a variety of applications in the past decades. This method has been implemented due to its competence in classification problems, precision, and robustness, as seen in numerous research articles over the years [52]. This method is an enhancement of the linear models by using the maximum likelihood estimator. The model provides high speed with parallel computations achieving high accuracy, as shown in Table 3.

4.2.2. Deep Learning

It is a famous neural network-based method developed from the famous H2O framework that uses information within the data in a layered form to extract useful patterns and classes. Each neuron is trained by modification based on the available information and combinedly predicts the output acting as a classifier [53,54]. It works in an adaptive manner by optimizing the neurons instinctively through learning without human interaction saving the effort and time required for the classification. This deep-learning algorithm is based on the feedforward artificial neural network architecture. The hidden layers provide the capacity to learn complex relationships between the input and output variables. It uses a supervised learning approach, which requires labeled training data to train the model provided by our previous research. During the training process, the model learns the relationships between the input variables and the target classes through the optimization of a loss function. The loss function is a measure of the error between the predicted outputs and the true outputs. It performs exceptionally for our classification-and-prediction problem, as shown in the Table 4 confusion matrices for test data.

4.2.3. Logistic Regression

Logistic Regression is another famous machine-learning method that is widely used as a statistical model for classification [55]. It is mostly used to predict nominal variables and fits our data for classification, as demonstrated in Table 5.

4.2.4. Gradient-Boosted Trees

Gradient-boosted trees use parallel computing to boost the classification process by using a gradient-boosting machine [56]. It provides accuracy with the help of the effective linear model. The effectiveness of using a gradient-boosted trees-based model for the classification of LBSN data can be observed in Table 6.
The above results demonstrate a high efficiency in the use of machine learning instead of manual classification by providing more accurate and timely results with a high potential in the implementation of LBSN analysis. The deep-learning model performed very well in multiclass prediction, with an accuracy reaching 99% in our experimentation. These models can also be used for binominal predictions targeting the desired class, for example, in our case, tourism with others. The following section provides similar research in which we used machine learning to predict the tourism venues with the help of supervised learning based on our acquired dataset from Weibo.

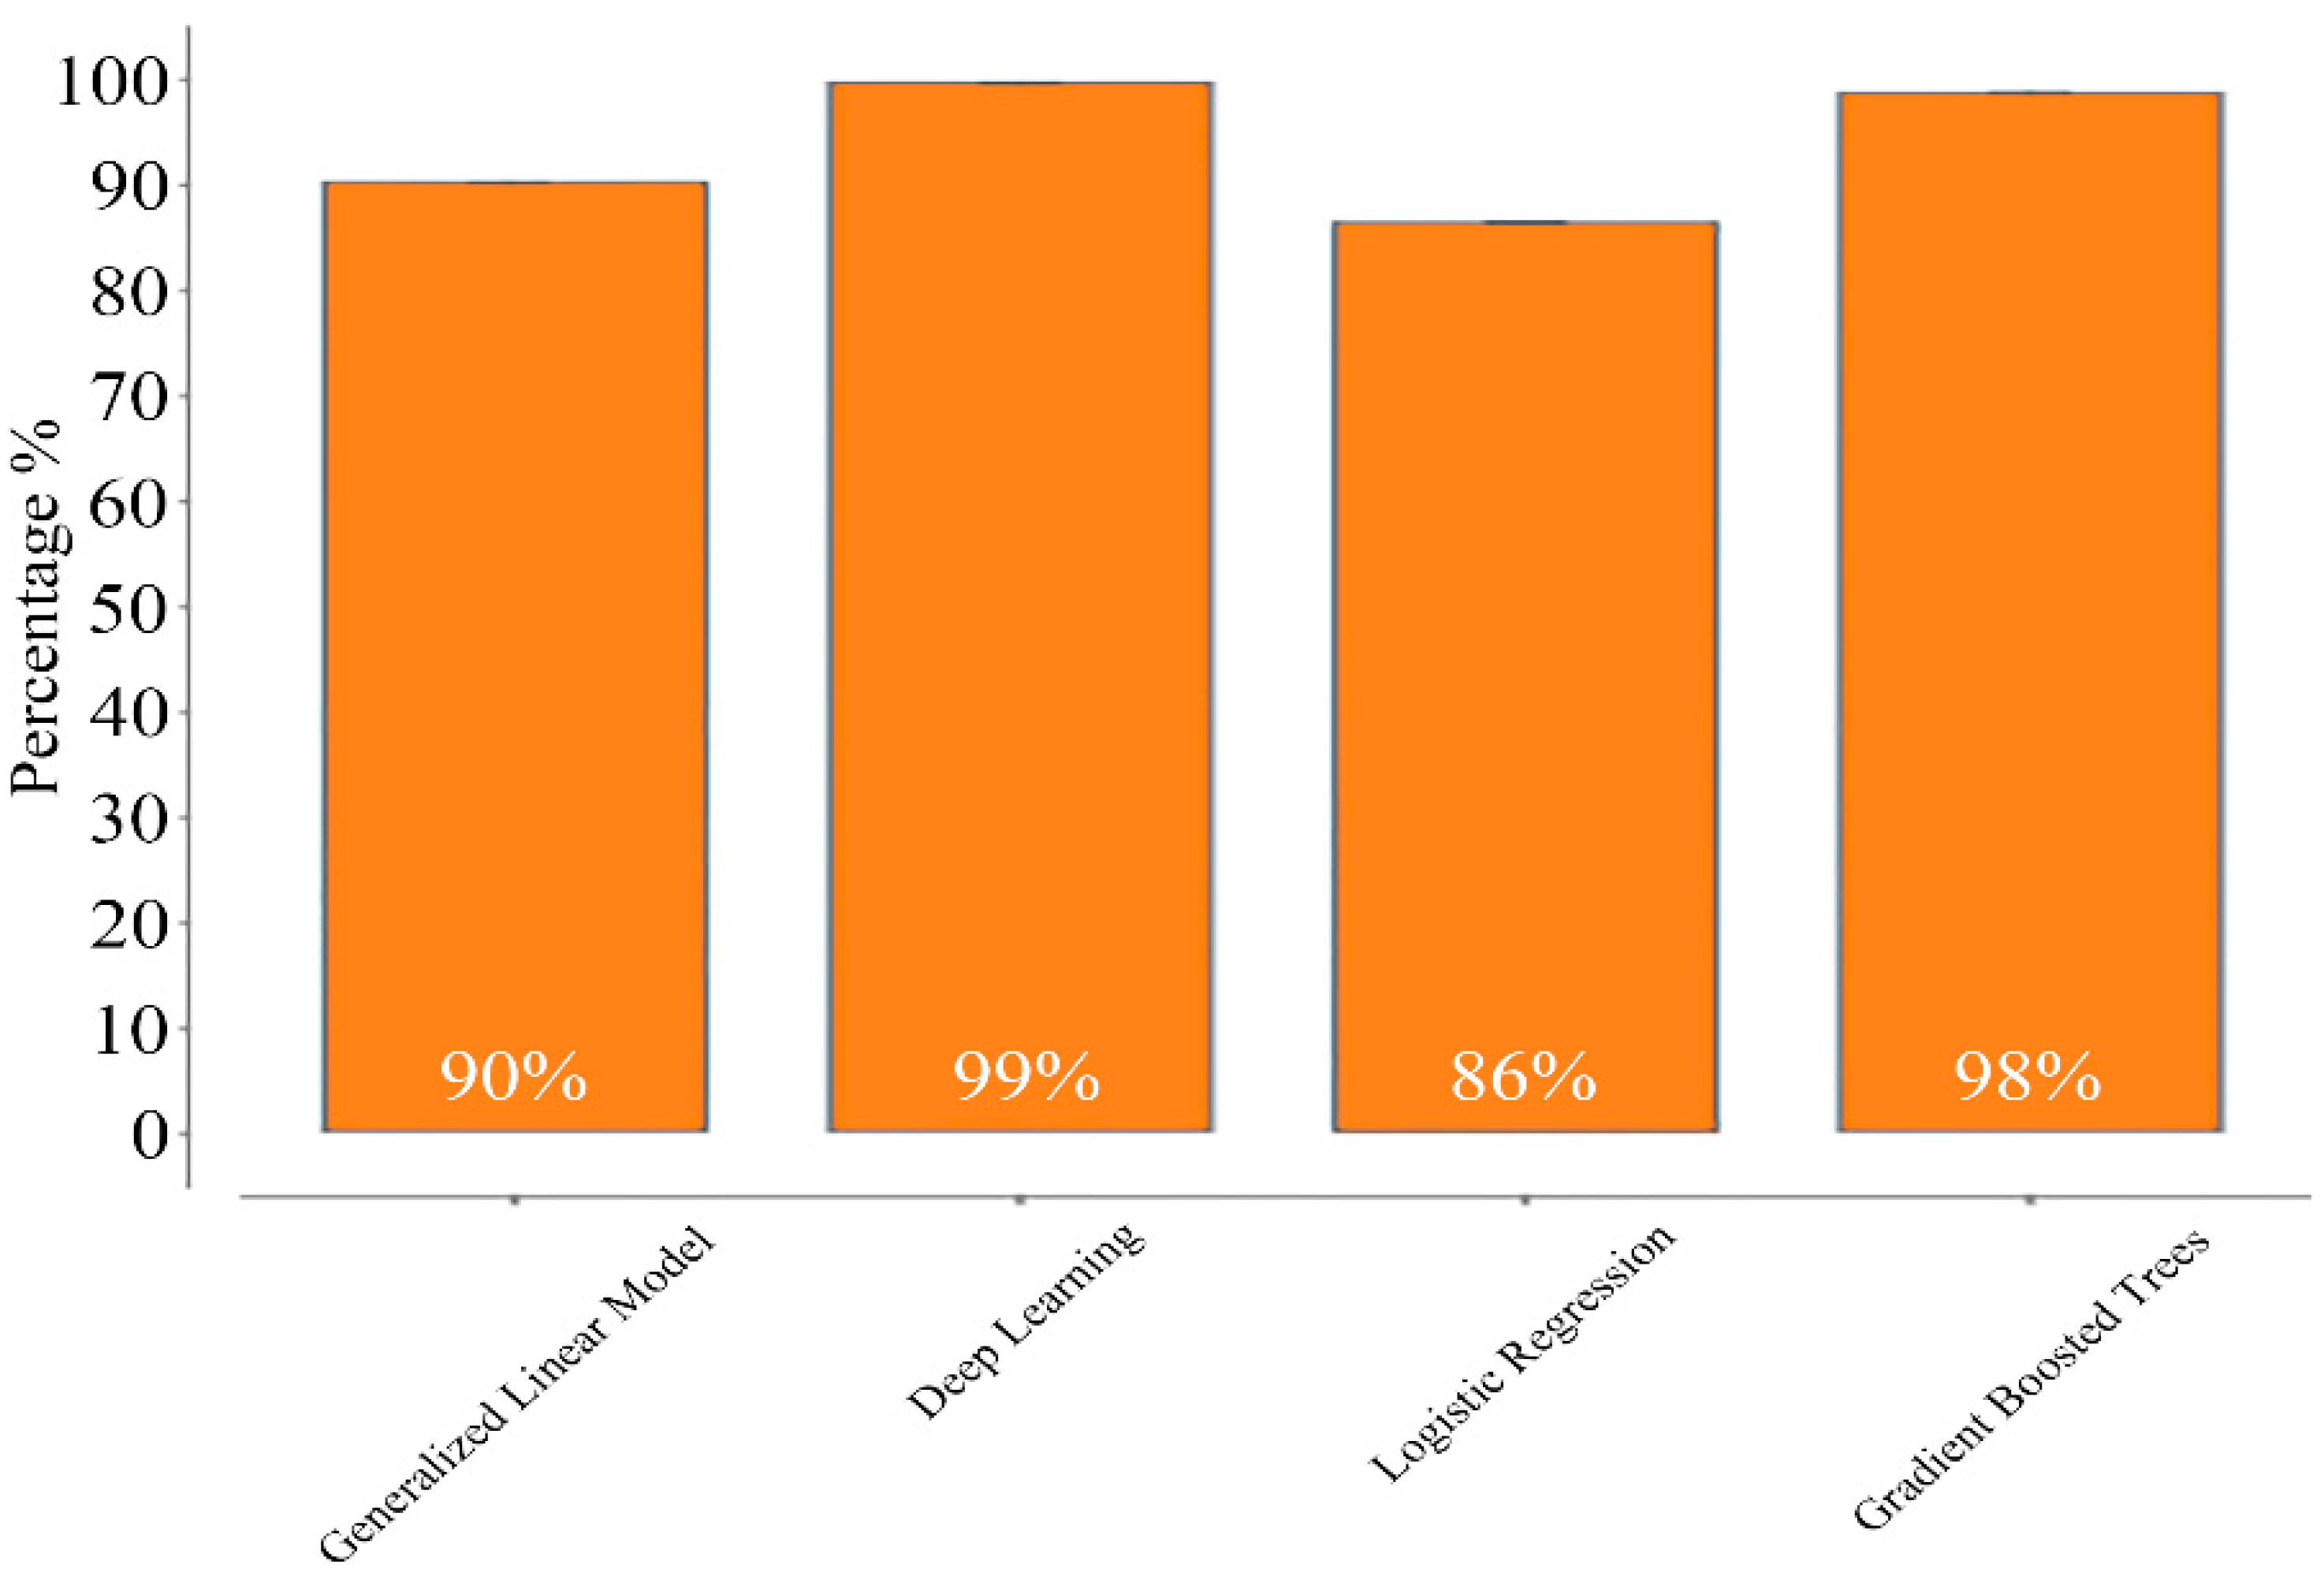
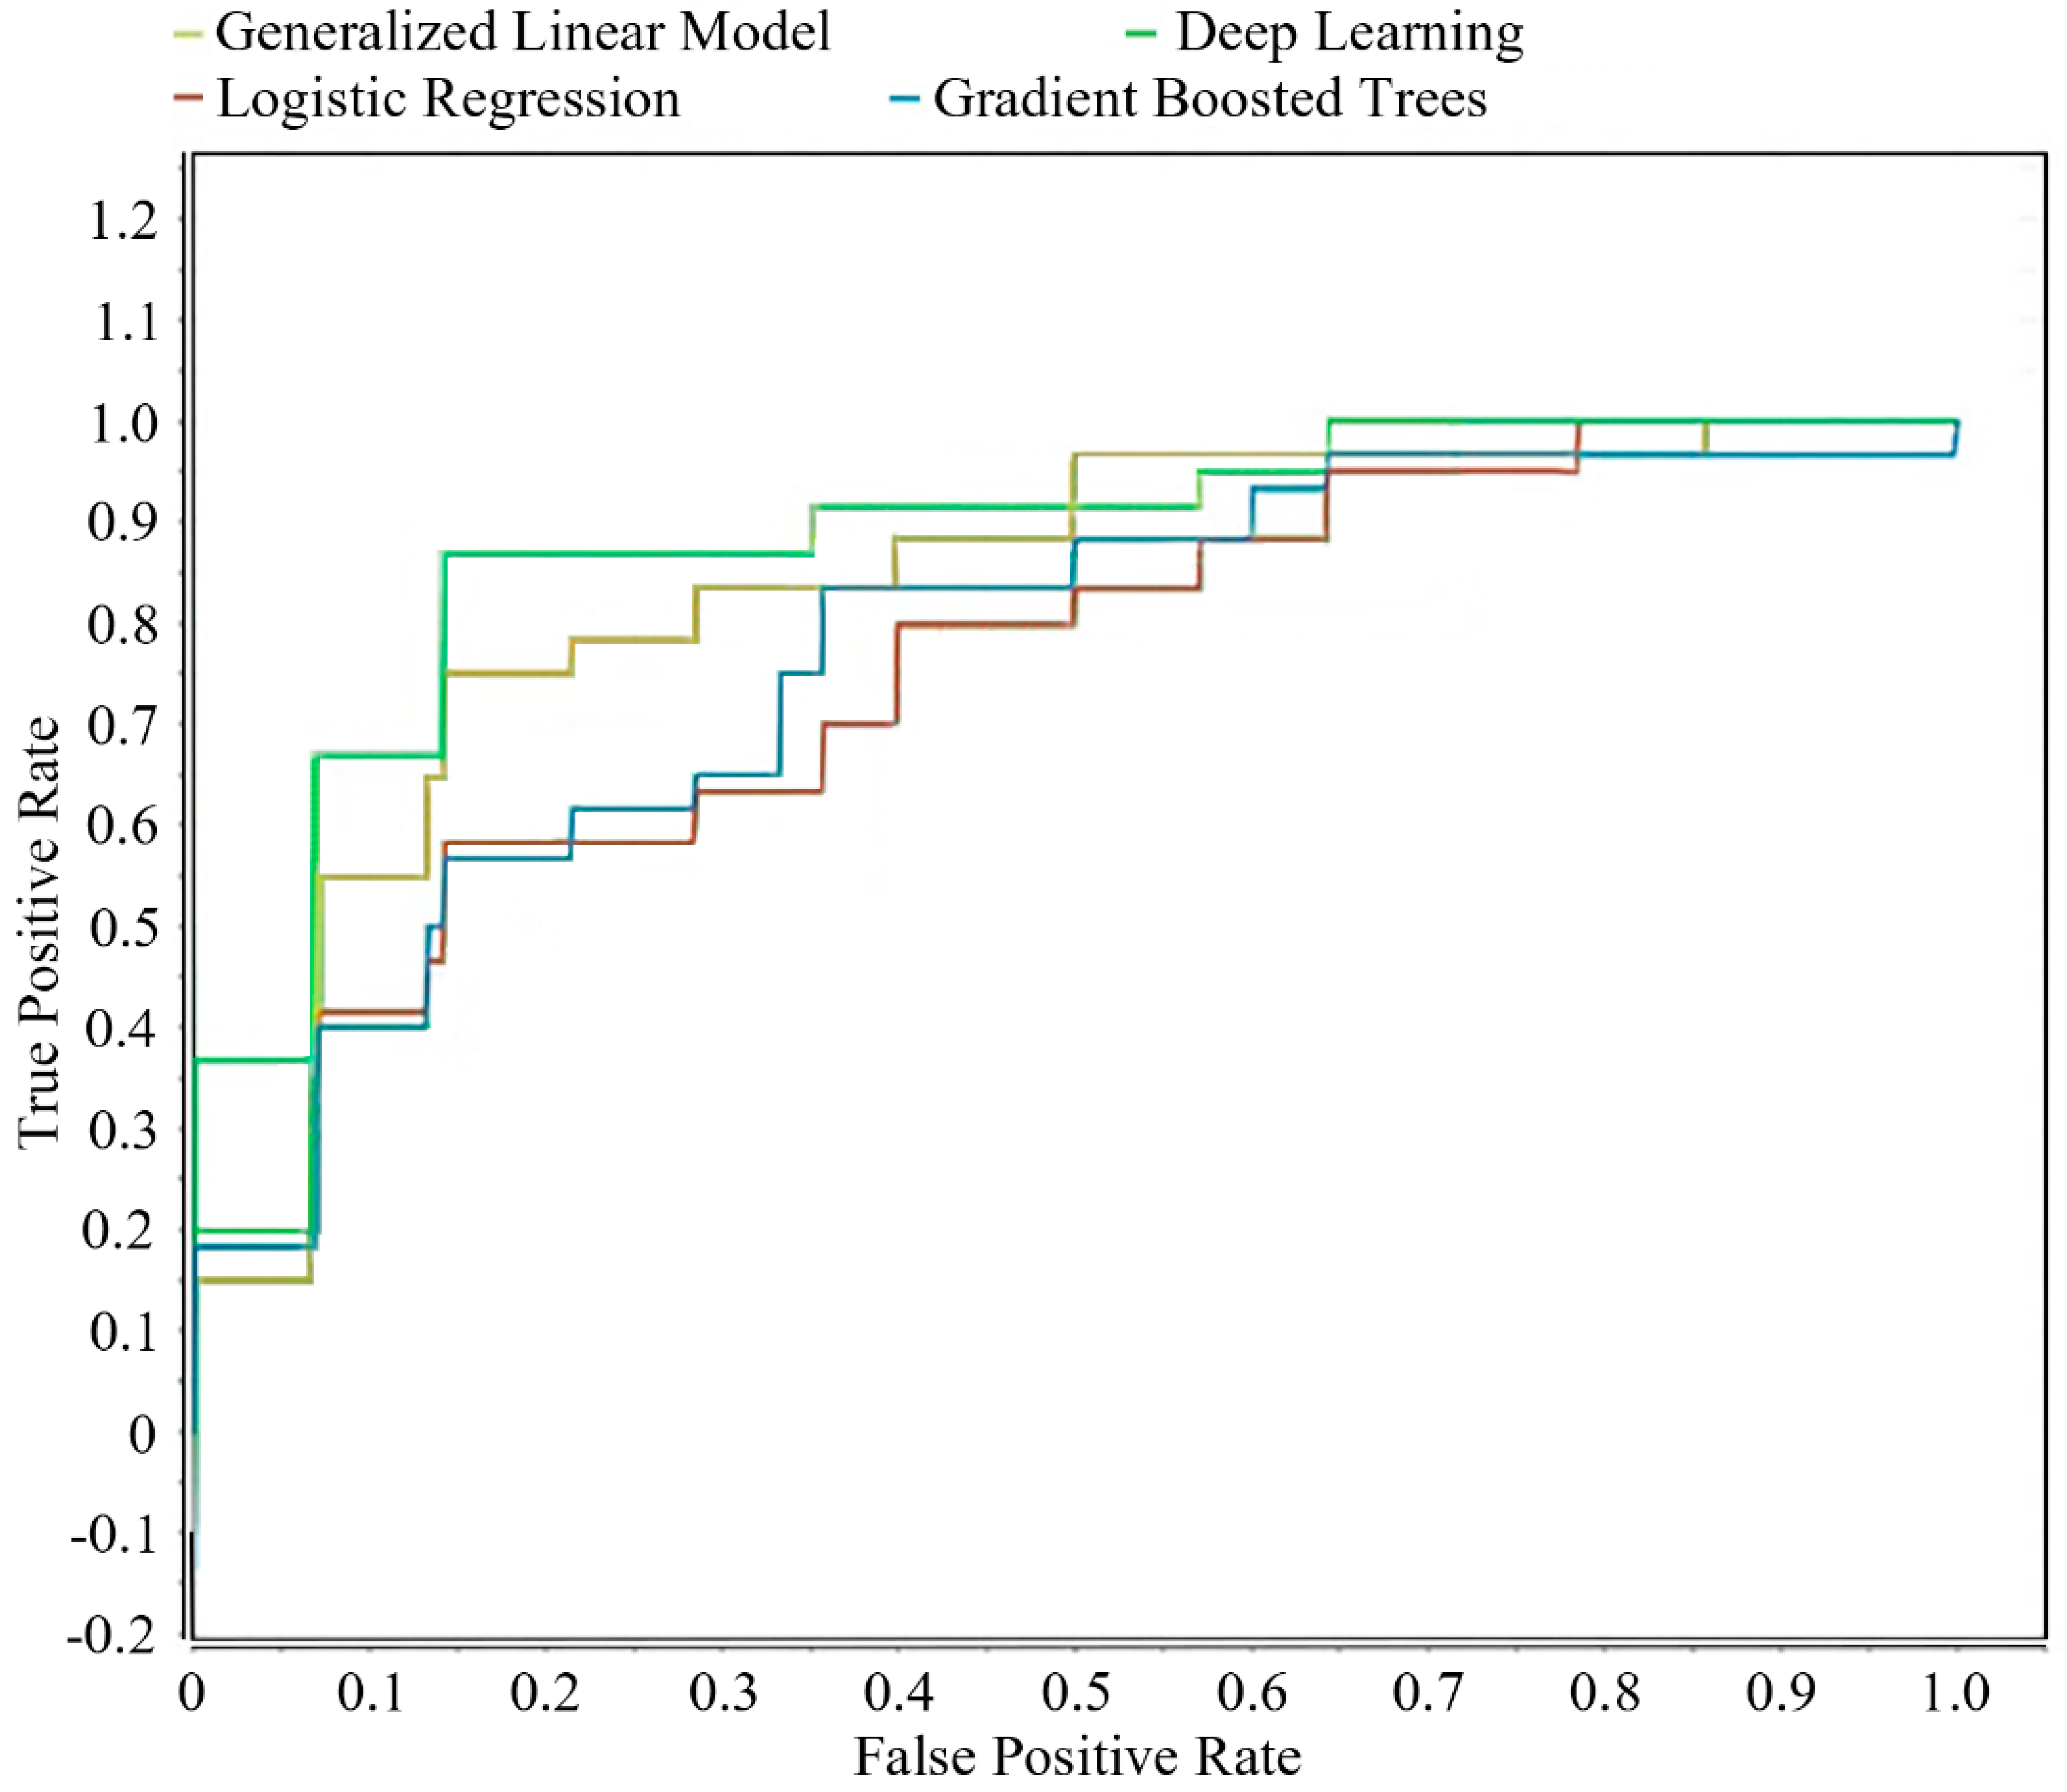
4.3. Binary Classification for Predicting Tourism Class

The proposed machine-learning models can be used to predict an individual class among the huge LBSN-based heterogeneous data, which are given in this section. In the current research, we used the proposed models to predict tourism venues with the help of supervised methods from our previously used dataset from Weibo. These venues are predicted based on the proximity to the information provided in the dataset, including the gender of the specific user, previously visited venues within a particular time of the day, day of the week, latitude/longitude, and venue names. The results presented in this section provide evidence of the efficiency and effectiveness of using machine learning for extracting useful traits and patterns in the behavior of users, more specifically, tourists. This information can be used to conduct useful research in predicting the preferences of tourists, as presented in our research.
Figure 3 represents the ROC curve, also known as AUC. The ROC curve is a graphical representation of the performance of a binary classifier system as its discrimination threshold is varied. The ROC graph is a plot of the true positive rate (TPR) against the false positive rate (FPR) for all possible threshold values. The TPR is the proportion of actual positive samples that are correctly classified as positive, while the FPR is the proportion of actual negative samples that are incorrectly classified as positive. The ROC graph plots TPR against FPR as the discrimination threshold of the classifier is varied, and the resulting curve provides a visual representation of the trade-off between the TPR and FPR. In the ROC graph, the TPR is plotted on the y-axis and the FPR is plotted on the x-axis. A classifier with a perfect performance will have a TPR of 1.0 and an FPR of 0.0 and will be located at the top-left corner of the graph. A classifier with a poor performance will have a TPR that is close to 0.0 and an FPR that is close to 1.0 and will be located close to the bottom-right corner of the graph. AUC values greater than 0.9 represent excellent results; values from 0.8 to 0.9 are ranked as good, 0.7 to 0.8 are fair, and AUC values less than 0.6 are considered poor [57]. Figure 4 shows high values of the AUC for our models, and Figure 5 suggests a high accuracy in the prediction of tourism venues among all other types available in the LBSN dataset.
Figure 6 shows a different aspect of the results in predicting the tourism venues. The deep-learning model attained maximum accuracy for predictions, representing a 99% prediction accuracy, followed by logistic regression with 91% and a generalized linear model and gradient-boosted trees showing 85% and 75% accuracy, respectively. There are multiple reasons contributing to the high accuracy of these models. For example, the supervised learning methods used in this analysis, which use labeled data for training and generally produce more accurate results as compared to unsupervised machine-learning models. Another reason may be the huge number of instances in the dataset as most of the check-ins may be recoded from similar venues, and also the names of the locations often include terms like schools, ports, parks etc., which helps in identifying the venue class more accurately. Accuracy is not the only metric to evaluate the performance of the models, and a single accuracy score may not accurately reflect the performance of a model. In such cases, it is important to consider other evaluation metrics such as precision, recall, F-score, and ROC curve.
Figure 7 represents the lift charts for each of the implemented machine-learning models. A lift chart is defined as a graphical representation of the improvement of a model in comparison with a random guess, which also means evaluating the efficiency of the model by using the ratio between the results “with and without a model” [57,58].
The lift chart plots the percentage of positive samples correctly classified by the classifier on the y-axis, and the cumulative percentage of all samples on the x-axis. The chart is divided into a number of equal-sized deciles, and the lift of the classifier at each decile is calculated as the ratio of the number of positive samples correctly classified by the classifier to the number of positive samples that would be correctly classified by a random selection. Figure 7 shows the high learning and accuracy of using machine-learning methods to predict tourism venues among the massive amount of data in the dataset. It can be seen that the deep-learning model can predict tourism venues with very high accuracy as compared to others, while the proposed generalized linear model, logistic regression, and gradient-boosted trees have significant performance. The proposed models can be used to classify data into multiple categories and predict a single class based on the nature and activities performed at these venues, which removes the overhead of manually filtering through vast piles of records for analysis and modeling LBSN data. This can be helpful in research in various fields, such as tourism, restaurants, parks, etc., with applications in the development and planning of smart cities.

5. Conclusions

This study proposes a novel approach to LBSN venue-based analysis by the implementation of machine-learning models for the prediction of venue classes used in the research of patterns in the behavior of different LBSN users. The classification task has always been done manually, which is very tiresome and time-consuming as most of the LBSN research is based on big-data analysis comprising thousands and millions of check-in records. There are several robust machine-learning methods that can be used to carry out this task more efficiently and effectively. In this research, we developed four machine-learning models based on famous classification and prediction methods, including the generalized linear model, deep learning, logistic regression, and gradient-boosted trees for our experiments. These data mining techniques on LBSN data are rigorous tasks due to the fact that many features are related to many different domains in various research fields. After careful and systematic filtering, we extracted the feasible input features for the prediction of our targeted class, which followed the training and testing of our developed models. The results revealed that the deep-learning model performs exceptionally well for classifying and predicting venues within the LBSN data, achieving 99% accuracy. The gradient-boosted trees model attained 93% accuracy for our tourism class prediction problem, followed by logistic regression and the generalized linear model, reaching 91% and 85% accuracy, respectively. The machine-learning models perform well, but the research has some limitations. For example, the models must be tested on LBSN data from other platforms and other research domains in order to provide a more generalized solution to the LBSN classification and prediction problem. The presented results can be beneficial in a variety of research fields by specifying and predicting the desired class of venues and users. It can also provide the basis to conduct LBSN data analysis to predict the interests, behavior, and trends of the population within a specific time of the day or day of the week. The use of machine learning for such kind of research can benefit both researchers and end users for better planning, targeted marketing, and development of a smart-city environment. Therefore, the proposed models can have many advantages, both practically and educationally. In future research, we will try to implement these machine-learning models to analyze the behavioral traits of tourists by finding the similarities and differences in Shanghai’s local, nonlocal, and international tourists with the help of statistical analysis and density estimation. We will also try to perform in-dept analysis with the proposed machine-learning models to predict the interests and preferences of these tourists with respect to time and days based on the historical data from Location-Based Social Networks.

Author Contributions

Conceptualization, N.U.K. and W.W.; methodology, N.U.K.; software, W.W.; validation, N.U.K. and W.W.; formal analysis, investigation, resources, data curation, visualization, writing—original draft, N.U.K., S.J. and X.W.; writing—review and editing, W.W. and R.R.; supervision, project administration, funding acquisition, W.W. All authors have read and agreed to the published version of the manuscript.

Funding

This research is partially funded by Anhui Natural Science Foundation (No: 1908085MF178) and Anhui Key Research and Development Plan Project (No. 202104b11020031).

Data Availability Statement

Weibo has open geo-database, which can be downloaded using its API. More information is available at: https://open.weibo.com/wiki/Index accessed on 1 March 2023.

Conflicts of Interest

The authors declare no conflict of interest.

References

  1. Wu, J.; Li, J.; Ma, Y. A comparative study of spatial and temporal preferences for waterfronts in Wuhan based on gender differences in check-in behavior. ISPRS Int. J. Geo-Inf. 2019, 8, 413. [Google Scholar] [CrossRef] [Green Version]
  2. Liu, C.Y.; Chen, J.; Li, H. Linking migrant enclave residence to employment in urban China: The case of Shanghai. J. Urban Aff. 2019, 41, 189–205. [Google Scholar] [CrossRef] [Green Version]
  3. Muhammad, R.; Zhao, Y.; Liu, F. Spatiotemporal analysis to observe gender based check-in behavior by using social media big data: A case study of Guangzhou, China. Sustainability 2019, 11, 2822. [Google Scholar] [CrossRef] [Green Version]
  4. Ali Haidery, S.; Ullah, H.; Khan, N.U.; Fatima, K.; Rizvi, S.S.; Kwon, S.J. Role of big data in the development of smart city by analyzing the density of residents in Shanghai. Electronics 2020, 9, 837. [Google Scholar] [CrossRef]
  5. Khan, N.U.; Wan, W.; Yu, S. Location-based social network’s data analysis and spatio-temporal modeling for the mega city of Shanghai, China. ISPRS Int. J. Geo-Inf. 2020, 9, 76. [Google Scholar] [CrossRef] [Green Version]
  6. Rizwan, M.; Mahmood, S.; Wanggen, W.; Ali, S. Location based social media data analysis for observing check-in behavior and city rhythm in shanghai. In Proceedings of the 4th International Conference on Smart and Sustainable City (ICSSC 2017), Shanghai, China, 5–6 June 2017. [Google Scholar]
  7. Rizwan, M.; Wan, W. Big data analysis to observe check-in behavior using location-based social media data. Information 2018, 9, 257. [Google Scholar] [CrossRef] [Green Version]
  8. Singh, R.; Zhang, Y.; Wang, H. Exploring human mobility patterns in Melbourne using social media data. In Proceedings of the Databases Theory and Applications: 29th Australasian Database Conference, ADC 2018, Gold Coast, QLD, Australia, 24–27 May 2018; pp. 328–335. [Google Scholar]
  9. Khan, N.U.; Wan, W.; Yu, S.; Muzahid, A.; Khan, S.; Hou, L. A Study of User Activity Patterns and the Effect of Venue Types on City Dynamics Using Location-Based Social Network Data. ISPRS Int. J. Geo-Inf. 2020, 9, 733. [Google Scholar] [CrossRef]
  10. Loo, B.P.; Yao, S.; Wu, J. Spatial point analysis of road crashes in Shanghai: A GIS-based network kernel density method. In Proceedings of the 2011 19th International Conference on Geoinformatics, Shanghai, China, 24–26 June 2011; pp. 1–6. [Google Scholar]
  11. Colombo, G.B.; Chorley, M.J.; Williams, M.J.; Allen, S.M.; Whitaker, R.M. You are where you eat: Foursquare checkins as indicators of human mobility and behaviour. In Proceedings of the 2012 IEEE International Conference on Pervasive Computing and Communications Workshops, Lugano, Switzerland, 19–23 March 2012; pp. 217–222. [Google Scholar]
  12. Li, Y.; Steiner, M.; Wang, L.; Zhang, Z.-L.; Bao, J. Exploring venue popularity in foursquare. In Proceedings of the 2013 Proceedings IEEE INFOCOM, Turin, Italy, 14–19 April 2013; pp. 3357–3362. [Google Scholar]
  13. Hu, Q.; Bai, G.; Wang, S.; Ai, M. Extraction and monitoring approach of dynamic urban commercial area using check-in data from Weibo. Sustain. Cities Soc. 2019, 45, 508–521. [Google Scholar] [CrossRef]
  14. Vassakis, K.; Petrakis, E.; Kopanakis, I.; Makridis, J.; Mastorakis, G. Location-based social network data for tourism destinations. In Big Data and Innovation in Tourism, Travel, and Hospitality: Managerial Approaches, Techniques, and Applications; Springer: Berlin/Heidelberg, Germany, 2019; pp. 105–114. [Google Scholar]
  15. Maeda, T.N.; Yoshida, M.; Toriumi, F.; Ohashi, H. Extraction of tourist destinations and comparative analysis of preferences between foreign tourists and domestic tourists on the basis of geotagged social media data. ISPRS Int. J. Geo-Inf. 2018, 7, 99. [Google Scholar] [CrossRef] [Green Version]
  16. Gu, Z.; Zhang, Y.; Chen, Y.; Chang, X. Analysis of attraction features of tourism destinations in a mega-city based on check-in data mining—A case study of ShenZhen, China. ISPRS Int. J. Geo-Inf. 2016, 5, 210. [Google Scholar] [CrossRef] [Green Version]
  17. Hussain, M.; Zhu, W.; Zhang, W.; Abidi, S.M.R.; Ali, S. Using machine learning to predict student difficulties from learning session data. Artif. Intell. Rev. 2019, 52, 381–407. [Google Scholar] [CrossRef]
  18. Wang, Y.; Baker, R. Content or platform: Why do students complete MOOCs. MERLOT J. Online Learn. Teach. 2015, 11, 17–30. [Google Scholar]
  19. RapidMiner. RapidMiner Documentation. Available online: https://docs.rapidminer.com/latest/studio/operators/ (accessed on 1 March 2023).
  20. Chai, Y.; Shen, Y.; Xiao, Z.; Zhang, Y.; Zhao, Y.; Ta, N. Review for space-time behavior research: Theory frontiers and application in the future. Prog. Geogr. 2012, 31, 667–675. [Google Scholar]
  21. Kwan, M.-P.; Lee, J. Geovisualization of human activity patterns using 3D GIS: A time-geographic approach. Spat. Integr. Soc. Sci. 2004, 27, 721–744. [Google Scholar]
  22. Polak, J.; Jones, P. The acquisition of pre-trip information: A stated preference approach. Transportation 1993, 20, 179–198. [Google Scholar] [CrossRef]
  23. Che, Q.; Duan, X.; Guo, Y.; Wang, L.; Cao, Y. Urban spatial expansion process, pattern and mechanism in Yangtze River Delta. Acta Geogr. Sin 2011, 66, 446–456. [Google Scholar]
  24. Graham, M.; Shelton, T. Geography and the future of big data, big data and the future of geography. Dialogues Hum. Geogr. 2013, 3, 255–261. [Google Scholar] [CrossRef] [Green Version]
  25. Gonzalez, M.C.; Hidalgo, C.A.; Barabasi, A.-L. Understanding individual human mobility patterns. Nature 2008, 453, 779–782. [Google Scholar] [CrossRef]
  26. Todd, A.W.; Campbell, A.L.; Meyer, G.G.; Horner, R.H. The effects of a targeted intervention to reduce problem behaviors: Elementary school implementation of check in—Check out. J. Posit. Behav. Interv. 2008, 10, 46–55. [Google Scholar] [CrossRef]
  27. Hollenstein, L.; Purves, R. Exploring place through user-generated content: Using Flickr tags to describe city cores. J. Spat. Inf. Sci. 2010, 21–48. [Google Scholar] [CrossRef]
  28. Zhu, X. GIS and urban mining. Resources 2014, 3, 235–247. [Google Scholar] [CrossRef] [Green Version]
  29. Yuan, J.; Zheng, Y.; Xie, X. Discovering regions of different functions in a city using human mobility and POIs. In Proceedings of the 18th ACM SIGKDD International Conference on Knowledge Discovery and Data Mining, Beijing, China, 12–16 August 2012; pp. 186–194. [Google Scholar]
  30. Wesolowski, A.; Qureshi, T.; Boni, M.F.; Sundsøy, P.R.; Johansson, M.A.; Rasheed, S.B.; Engø-Monsen, K.; Buckee, C.O. Impact of human mobility on the emergence of dengue epidemics in Pakistan. Proc. Natl. Acad. Sci. USA 2015, 112, 11887–11892. [Google Scholar] [CrossRef] [Green Version]
  31. Pappalardo, L.; Simini, F.; Rinzivillo, S.; Pedreschi, D.; Giannotti, F.; Barabási, A.-L. Returners and explorers dichotomy in human mobility. Nat. Commun. 2015, 6, 1–8. [Google Scholar] [CrossRef] [PubMed] [Green Version]
  32. Preoţiuc-Pietro, D.; Cohn, T. Mining user behaviours: A study of check-in patterns in location based social networks. In Proceedings of the 5th annual ACM Web Science Conference, Paris, France, 2–4 May 2013; pp. 306–315. [Google Scholar]
  33. Cheng, C.; Jain, R.; van den Berg, E. Location Prediction Algorithms for Mobile Wireless Systems. 2003. Available online: https://dl.acm.org/doi/10.5555/989684.989696 (accessed on 1 March 2023).
  34. Cho, E.; Myers, S.A.; Leskovec, J. Friendship and mobility: User movement in location-based social networks. In Proceedings of the 17th ACM SIGKDD International Conference on KNOWLEDGE Discovery and Data Mining, San Diego, CA, USA, 21–24 August 2011; pp. 1082–1090. [Google Scholar]
  35. Gao, H.; Tang, J.; Liu, H. Exploring social-historical ties on location-based social networks. In Proceedings of the International AAAI Conference on Web and Social Media, Dublin, Ireland, 4–7 June 2012; pp. 114–121. [Google Scholar]
  36. Fan, C.; Liu, Y.; Huang, J.; Rong, Z.; Zhou, T. Correlation between social proximity and mobility similarity. Sci. Rep. 2017, 7, 1–8. [Google Scholar] [CrossRef] [PubMed] [Green Version]
  37. Zhang, J.-D.; Chow, C.-Y. iGSLR: Personalized geo-social location recommendation: A kernel density estimation approach. In Proceedings of the 21st ACM SIGSPATIAL International Conference on Advances in Geographic Information Systems, Orlando, FL, USA, 5–8 November 2013; pp. 334–343. [Google Scholar]
  38. Alrumayyan, N.; Bawazeer, S.; AlJurayyad, R.; Al-Razgan, M. Analyzing user behaviors: A study of tips in Foursquare. In Proceedings of the 5th International Symposium on Data Mining Applications, Riyadh, Saudi Arabia, 21–22 March 2018; pp. 153–168. [Google Scholar]
  39. Lin, S.; Xie, R.; Xie, Q.; Zhao, H.; Chen, Y. Understanding user activity patterns of the swarm app: A data-driven study. In Proceedings of the 2017 ACM International Joint Conference on Pervasive and Ubiquitous Computing and 2017 ACM International Symposium on Wearable Computers, Maui, HI, USA, 11–15 September 2017; pp. 125–128. [Google Scholar]
  40. Shi, B.; Zhao, J.; Chen, P.-J. Exploring urban tourism crowding in Shanghai via crowdsourcing geospatial data. Curr. Issues Tour. 2017, 20, 1186–1209. [Google Scholar] [CrossRef]
  41. Long, Y.; Han, H.; Tu, Y.; Shu, X. Evaluating the effectiveness of urban growth boundaries using human mobility and activity records. Cities 2015, 46, 76–84. [Google Scholar] [CrossRef]
  42. Alam, T.M.; Shaukat, K.; Khelifi, A.; Khan, W.A.; Raza, H.M.E.; Idrees, M.; Luo, S.; Hameed, I.A. Disease diagnosis system using IoT empowered with fuzzy inference system. Comput. Mater. Contin. 2022, 70, 5305–5319. [Google Scholar]
  43. Hassan, M.U.; Shaukat, K.; Niu, D.; Mahreen, S.; Ma, Y.; Zhao, X.; Shabir, M.A. Web-Logs Prediction with Web Mining. In Proceedings of the 2018 2nd IEEE Advanced Information Management, Communicates, Electronic and Automation Control Conference (IMCEC), Xi’an, China, 25–27 May 2018; pp. 1295–1299. [Google Scholar]
  44. Saleem, A.; He, Y. Investigation of Massive MIMO Channel Spatial Characteristics for Indoor Subway Tunnel Environment. In Proceedings of the 2021 Computing, Communications and IoT Applications (ComComAp), Shenzhen, China, 26–28 November 2021; pp. 162–167. [Google Scholar]
  45. Shaukat, K.; Alam, T.M.; Luo, S.; Shabbir, S.; Hameed, I.A.; Li, J.; Abbas, S.K.; Javed, U. A review of time-series anomaly detection techniques: A step to future perspectives. In Proceedings of the Future of Information and Communication Conference, Vancouver, BC, Canada, 29–30 April 2021; pp. 865–877. [Google Scholar]
  46. Khan, N.U.; Wan, W. A review of human pose estimation from single image. In Proceedings of the 2018 International Conference on Audio, Language and Image Processing (ICALIP), Shanghai, China, 16–17 July 2018; pp. 230–236. [Google Scholar]
  47. Ali, S.; Adeel, M.; Johar, S.; Zeeshan, M.; Baseer, S.; Irshad, A. Classification and Prediction of Software Incidents Using Machine Learning Techniques. Secur. Commun. Netw. 2021, 2021, 9609823. [Google Scholar] [CrossRef]
  48. Saleem, A.; Cui, H.; He, Y.; Boag, A. Channel Propagation Characteristics for Massive MIMO Systems in Tunnel Environment. IEEE Antennas Propag. Mag. 2022, 64, 126–142. [Google Scholar] [CrossRef]
  49. Abidi, S.M.R.; Hussain, M.; Xu, Y.; Zhang, W. Prediction of confusion attempting algebra homework in an intelligent tutoring system through machine learning techniques for educational sustainable development. Sustainability 2018, 11, 105. [Google Scholar] [CrossRef] [Green Version]
  50. Abidi, S.M.R.; Ni, J.; Ge, S.; Wang, X.; Ding, H.; Zhu, W.; Zhang, W. Demystifying help-seeking students interacting multimodal learning environment under machine learning regime. In Proceedings of the Eleventh International Conference on Graphics and Image Processing (ICGIP 2019), Hangzhou, China, 12–14 October 2019; p. 113732V. [Google Scholar]
  51. Abidi, S.M.R.; Xu, Y.; Ni, J.; Wang, X.; Zhang, W. Popularity prediction of movies: From statistical modeling to machine learning techniques. Multimed. Tools Appl. 2020, 79, 35583–35617. [Google Scholar] [CrossRef]
  52. Ng, V.K.; Cribbie, R.A. The gamma generalized linear model, log transformation, and the robust Yuen-Welch test for analyzing group means with skewed and heteroscedastic data. Commun. Stat. Simul. Comput. 2019, 48, 2269–2286. [Google Scholar] [CrossRef] [Green Version]
  53. Xing, W.; Du, D. Dropout prediction in MOOCs: Using deep learning for personalized intervention. J. Educ. Comput. Res. 2019, 57, 547–570. [Google Scholar] [CrossRef]
  54. Li, W.; Gao, M.; Li, H.; Xiong, Q.; Wen, J.; Wu, Z. Dropout prediction in MOOCs using behavior features and multi-view semi-supervised learning. In Proceedings of the 2016 international joint conference on neural networks (IJCNN), Vancouver, BC, Canada, 24–29 July 2016; 2016; pp. 3130–3137. [Google Scholar]
  55. Peng, C.-Y.J.; Lee, K.L.; Ingersoll, G.M. An introduction to logistic regression analysis and reporting. J. Educ. Res. 2002, 96, 3–14. [Google Scholar] [CrossRef]
  56. Cobos, R.; Wilde, A.; Zaluska, E. Predicting attrition from massive open online courses in FutureLearn and edX. In Proceedings of the 7th International Learning Analytics and Knowledge Conference, Simon Fraser University, Vancouver, BC, Canada, 13–17 March 2017; pp. 13–17. [Google Scholar]
  57. Metz, C.E. Basic Principles of ROC Analysis. Available online: http://gim.unmc.edu/dxtests/ROC1.htm (accessed on 1 March 2023).
  58. Microsoft. Lift Chart (Analysis Services—Data Mining). Available online: https://learn.microsoft.com/en-us/analysis-services/data-mining/lift-chart-analysis-services-data-mining?view=asallproducts-allversions (accessed on 1 March 2023).
Figure 1. Pictorial representation of classification.
Applsci 13 03517 g001
Figure 2. Venue Classification into 10 classes using Machine Learning.
Applsci 13 03517 g002
Figure 3. ROC of the proposed machine-learning models.
Applsci 13 03517 g003
Figure 4. Graphical representation of AUC.
Applsci 13 03517 g004
Figure 5. Accuracy of the candidate models.
Applsci 13 03517 g005
Figure 6. (ad) Performance matrices for proposed machine-learning models.
Applsci 13 03517 g006aApplsci 13 03517 g006b
Figure 7. (ad) Lift chart of proposed models.
Applsci 13 03517 g007aApplsci 13 03517 g007b
Table 1. Multiple Linear-Regression Model.
CoefficientsEstimateStd. Errort ValuePr (>|t|)
Intercept4.83210880.0158305289.703<2 × 10⁻¹⁶***
User_ID1.8666740.17761510.51<2−16***
Gender0.6120280.1665623.6740.000249***
Time0.9403880.1261427.4551.71 × 10−13**
Day0.8719490.224723.880.00011***
Location_Name0.8379610.2026064.1363.78 × 10−5***
Educational0.01655320.00304416.3825.69 × 10−8***
Entertainment0.00558560.00195464.1060.002245**
Food0.00801450.00196444.1910.001325**
General_Location0.01539660.00202938.6691.88 × 10−14***
Hotel0.00159870.0020763.8140.004152**
Professional0.00400080.00092753.9380.003307**
Residential0.00798510.00198254.7170.000202***
Shopping & Services0.0150820.00300926.3339.86 × 10−8***
Sports0.00887360.00183754.712.50 × 10−6***
Travel0.00909360.00194945.1842.89 × 10−5***
Annotation *** Significance level: 0.001, p-value: [0, 0.001], **: significance level: 0.01, p-value: (0.001, 0.01].
Table 2. Correlations Matrix.
TimeGenderCategoryCheck-In DateWeekdays
Time1−0.050 **−0.005−0.053 **0.017 **
Gender−0.050 **10.015 **−0.017 **−0.012 **
Category−0.0050.015 **1−0.039 **−0.013 **
Check-in Date−0.053 **−0.017 **−0.039 **1−0.037 **
Weekdays0.017 **−0.012 **−0.013 **−0.037 **1
**. Correlation is significant at the 0.01 level (2-tailed).
Table 3. Confusion Matrix for Generalized Linear Model.
TrueTravelResidentialProfessionalEducationalShopping
& Services
FoodGeneral LocationEntertainmentSportsHotel
Predicted
Travel437822913126314011
Residential997764133137511914933266
Professional5172685125464118
Educational285215728860155564732
Shopping &
Services
2738195588833761731115
Food3911862483784812100106865134153
General7713944621042922811994935
Location
Entertainment25221084264584514,2889830
Sports861130313815138290
Hotel52131321213430132514
Applsci 13 03517 i001
Table 4. Confusion Matrix for Deep-Learning Model.
TrueTravelResidentialProfessionalEducationalShopping &
Services
FoodGeneral LocationEntertainmentSportsHotel
Predicted
Travel5008010000000
Residential0812440014000
Professional0032310010000
Educational2308041001000
Shopping &
Services
0310969522000
Food4610022551000
General Location3740012427000
Entertainment751204500314615,93100
Sports0120000042220
Hotel1020002002862
Applsci 13 03517 i001
Table 5. Confusion Matrix for Logistic Regression Model.
TrueTravelResidentialProfessionalEducationalShopping &
Services
FoodGeneral LocationEntertainmentSportsHotel
Predicted
Travel4814501240109
Residential18080022021702238
Professional279195470981011
Educational103469810323012
Shopping &
Services
1713311968220251
Food004306501030
General Location49422004317530629
Entertainment10413123294710153970415,9281297848
Sports20127061027173
Hotel0029041021916
Applsci 13 03517 i001
Table 6. Confusion Matrix for Gradient-Boosted Trees Model.
TrueTravelResidentialProfessionalEducationalShopping &
Services
FoodGeneral LocationEntertainmentSportsHotel
Predicted
Travel1432010000000
Residential0231010010200
Professional008760000000
Educational00022450901100
Shopping &
Services
0020272530100
Food000005010000
General Location0920012696700
Entertainment0040901160442200
Sports00000204111740
Hotel001002000807
Applsci 13 03517 i001
Disclaimer/Publisher’s Note: The statements, opinions and data contained in all publications are solely those of the individual author(s) and contributor(s) and not of MDPI and/or the editor(s). MDPI and/or the editor(s) disclaim responsibility for any injury to people or property resulting from any ideas, methods, instructions or products referred to in the content.

