Article

A Numerical Investigation of Induced and Embedded Trench Installations for Large-Diameter Thermoplastic Pipes under High Fill Stresses

1
Civil Engineering, Yıldız Technical University, İstanbul 34220, Turkey
2
Civil Engineering, Namık Kemal University, Tekirdağ 59860, Turkey
*
Author to whom correspondence should be addressed.
Appl. Sci. 2023, 13(5), 3040; https://doi.org/10.3390/app13053040
Submission received: 20 January 2023 / Revised: 17 February 2023 / Accepted: 23 February 2023 / Published: 27 February 2023
(This article belongs to the Special Issue Advances in Underground Pipeline Technology)

Abstract

:
The induced trench installation method is applied by placing material with high compressibility on rigid pipes to reduce the earth pressures acting on them. Although the performance of this method for rigid pipes has been investigated, research on thermoplastic pipes is very limited. In this study, induced trench installation (ITI) and embedded trench installation (ETI) of large-diameter thermoplastic pipes subjected to high fill stresses were investigated by numerical analysis. The numerical model has been verified by considering the field experiments, and a series of analyses were carried out by placing Expanded Polystyrene Foam (EPS Geofoam) in ITI and ETI models. Pipe stresses and deflections were evaluated by considering the pipe diameter, stiffness, and backfill properties. The ITI and ETI models in thermoplastic pipes reduced the stresses acting on the pipes and increased the positive arching regardless of the deflection of the pipe. For pipes with an inner diameter of 0.762 to 1.524 m under 30 m of fill stress, approximately 1.5 to 3.0% deflection occurred. In the ETI model, the horizontal earth pressure in the spring line of the pipe decreased from 65 to 40% depending on the backfill type, and an approximately uniform stress distribution was formed around the pipe.

1. Introduction

Thermoplastic pipes are infrastructure elements that change shape under soil stress, and pipe deflection is considered the primary design criterion. Although it has many advantages, such as low cost, lightweight, ease of mobilization, and corrosion resistance, the usability of thermoplastic pipes under high fill stresses is very limited.
The most important feature that makes the behavior of thermoplastic pipes different from rigid pipes is that the interaction with the backfill affects the structural behavior of the pipe. The structural performance of the thermoplastic pipe is affected by the pipe’s rigidity (material property, profile geometry, and diameter) and the type of backfill material surrounding the pipe, its stiffness and placement quality, etc. [1]. The pipe–soil interaction response affects soil stresses around the buried pipes, pipe deflections, and pipe wall strains. The type of backfill soil used to surround the pipes influences pipe behavior considerably. Backfill is placed around and over a thermoplastic pipe, and as the soil pressure increases, the pipe deflects vertically and expands laterally into the backfill soil. The lateral expansion of the pipe mobilises passive resistance in the soil that combines with the pipe’s inherent stiffness to resist further lateral expansion and, consequently, further vertical deflection. The magnitude of the deflection and the stress depends not only on the pipe’s properties but also on the properties of the backfill soil. The magnitude of deflection and stress must be kept safely within the thermoplastic pipe’s performance limits. Excessive deflection may cause a loss of stability, while excessive compressive stress may cause wall crushing or ring buckling. Numerous experimental studies and numerical analyses have been carried out examining the pipe–soil interaction for various types of thermoplastic pipes [1,2,3,4,5,6,7,8,9,10,11,12,13,14,15,16,17,18,19,20].
High embankments impose significant earth stresses on buried infrastructures. Because the stiffness of the buried pipe is generally not the same as that of the backfill, the magnitude of vertical stress on a deeply buried pipe depends on the arching (positive or negative) that develops over the pipe. When high embankments are required for rigid culverts, the installation methods typically used are positive projection or induced trench and embedded trench installations. The induced trench installation (ITI) and embedded trench installation (ETI) models require a compressible soft zone such as EPS Geofoam above or surrounding the pipe (Figure 1). The ITI method for rigid culverts buried under high embankments has been used since the early 1900s. Numerous research studies have been conducted on the soil–structure interaction of EPS Geofoam using laboratory tests and field instrumentation [21,22,23,24,25,26,27,28,29,30,31,32]. Numerical analyses were also performed to better understand method uncertainties [10,22,24,25,27,31,33,34,35,36,37,38,39,40,41,42,43,44,45].
The ITI and ETI models reduce vertical stress on the culvert by including a lower-density material (compressible soft zone) to increase positive arching. Compressible material in the ITI and ETI models for the culvert causes differential settlement of the soil column directly above the pipe relative to the adjacent soil. The earth load from the soil column directly above the culvert is partially supported by the shear forces developed on the soil interface with adjacent soil columns, thereby resulting in some of the load being redistributed to the adjacent fill (Figure 1). Vaslestad et al. [26] observed soil stresses on four rigid culverts buried using an ITI model with EPS Geofoam in Norway from 1988 to 1992. At the end of 20 years, the average measured earth pressure above the crown of the pipe ranged from 23 to 25% of the overburden pressure for installations with granular backfill material and about 45% for the ones with cohesive backfill material. The ITI model using Geofoam to reduce earth pressure has also been used on concrete culverts below high fill (see [22,46,47]).
For circular pipes, Vaslestad et al. [48] studied a condition where the pipe was inserted into a zone of soft material. Kang [49] concluded that, based on many parametric studies, surrounding the pipe with a soft zone was the most effective way of reducing earth pressures [49]. According to the numerical analysis of the embedded trench installation (ETI) model, Kang et al. [10] suggested the optimum soft zone geometry for deeply buried PVC pipes. Recent studies claimed that the ITI method [38,43] does not mitigate the earth pressure at the spring line and the invert of the structures. Therefore, creating a soft zone around the pipe was recommended, known as an ETI model.
Simplified arching theories assume that shear strength is fully mobilized at the vertical boundaries of the soil prism on the pipe [50,51], but the degree of positive soil arching depends on the magnitude of the relative settlement. The induced trench method can increase the degree of positive soil arching on a buried thermoplastic pipe regardless of pipe deflection. As a result, a significant reduction in pipe deflections can be achieved. A buried thermoplastic pipe installed in the conventional method deflects vertically downwards under soil load. Since the displacement of the pipe crown is more than the side backfill soil, differential settlements occur in the soil medium above the pipe crown level. Differential settlements lead to the development of a positive soil arching within the soil medium, and as a result, a smaller vertical stress than geostatic stress reaches the thermoplastic pipe. Being a low-stiffness material, EPS deforms more than the soil adjacent to the thermoplastic pipe and, therefore, causes larger differential settlements in the soil medium above the pipe. When the thermoplastic pipe is buried in the ITI and ETI methods using EPS Geofoam, as shown in Figure 1, there will be an additional vertical settlement in the pipe crown, and positive arching will be increased regardless of the pipe deflection. For this purpose, there are a limited number of laboratory tests and numerical analyses studies in the published literature on the ITI and ETI models using EPS Geofoam surrounding the thermoplastic pipes [10,27,36,39,49,52,53,54,55,56,57,58,59]. Kang et al. [36] pioneered studies about PVC pipes protected by embedded trench installation using EPS Geofoam, investigating the optimum compressible zone geometry for a deeply buried thermoplastic pipe using finite element analyses. Akınay; Kılıç and Akınay [52,55] investigated the effects of using EPS Geofoam compressible inclusion by performing full-scale laboratory tests on the responses of a buried small-diameter, lined, corrugated wall HDPE pipe to deflections, soil stresses, and settlements around the pipe. EPS Geofoam with 10 and 15 kg/m3 nominal densities were selected as the compressible material, and five different pipe compressible inclusion configurations were designed for the laboratory test program. It was reported that the induced trench installation (the single EPS panel above the pipe crown) offered the best solution regarding pipe performance and cost efficiency. Embedded trench installations (one EPS saddle above the pipe crown and one below the pipe invert) significantly reduced the soil stresses around the pipe and improved the pipe behavior [59]. Azizian et al. and Moghaddas Tafreshi et al. [60,61,62] investigated through full-scale laboratory tests the efficacy of using EPS alone or in combination with other geosynthetics (i.e., geogrid or geocell) in protecting the high-density polyethene (HDPE) pipe buried in a shallow trench against repeated surface loads. Moghaddas Tafreshi et al. [61] showed that using EPS with a density of at least 30 kg/m3, combined with geocell over the HDPE pipe, provided the best solution in terms of both pipe performance and trench surface settlements. However, since design concerns (i.e., burial depths and load types) are different, the optimal configuration proposed by [61] is not deemed suitable for the induced trench installation of the thermoplastic pipe under high embankment fills.
In this current study, induced trench installation (ITI) and embedded trench installation (ETI) models in large diameter (0.762 m to 1.524 m inner diameter) thermoplastic pipes subjected to high fill stresses were investigated by numerical analysis. The study evaluated the effects of crushed stone, sand, and clay backfill material on the pipe deflections and stresses by considering the pipe diameter, rigidity, and thermoplastic material type (HDPE and PVC). Using EPS Geofoam as compressible material, the ETI and ITI models proposed by [10] were used for the soft zone geometry. The numerical model of the [63] field experiment was created in [64] and verified by comparing the calculated stress and pipe deflections with the field measurements. According to the results, using EPS Geofoam in the ITI and ETI models for thermoplastic pipes increased positive arching independent of the pipe deflection. As a result, the ETI model in the thermoplastic pipe with EPS Geofoam completely changed the distribution of stresses affecting the pipe. The positive arching increase caused a decrease in the vertical stress acting on the pipe crown, and the stress was transferred to the adjacent soil. Since the stresses were concentrated on the pipe spring lines, these regions had increased vertical and horizontal stresses. With increasing lateral stress resulting from positive arching, the pipe showed peaking and moved vertically toward the EPS Geofoam. As a result of this movement, the pipe shortened in the horizontal axis, and thus the stresses on the spring line of the pipe decreased from the at-rest state toward the active state. As a result of using EPS Geofoam with the ETI method in the thermoplastic pipes, a significant reduction in horizontal stresses occurred.

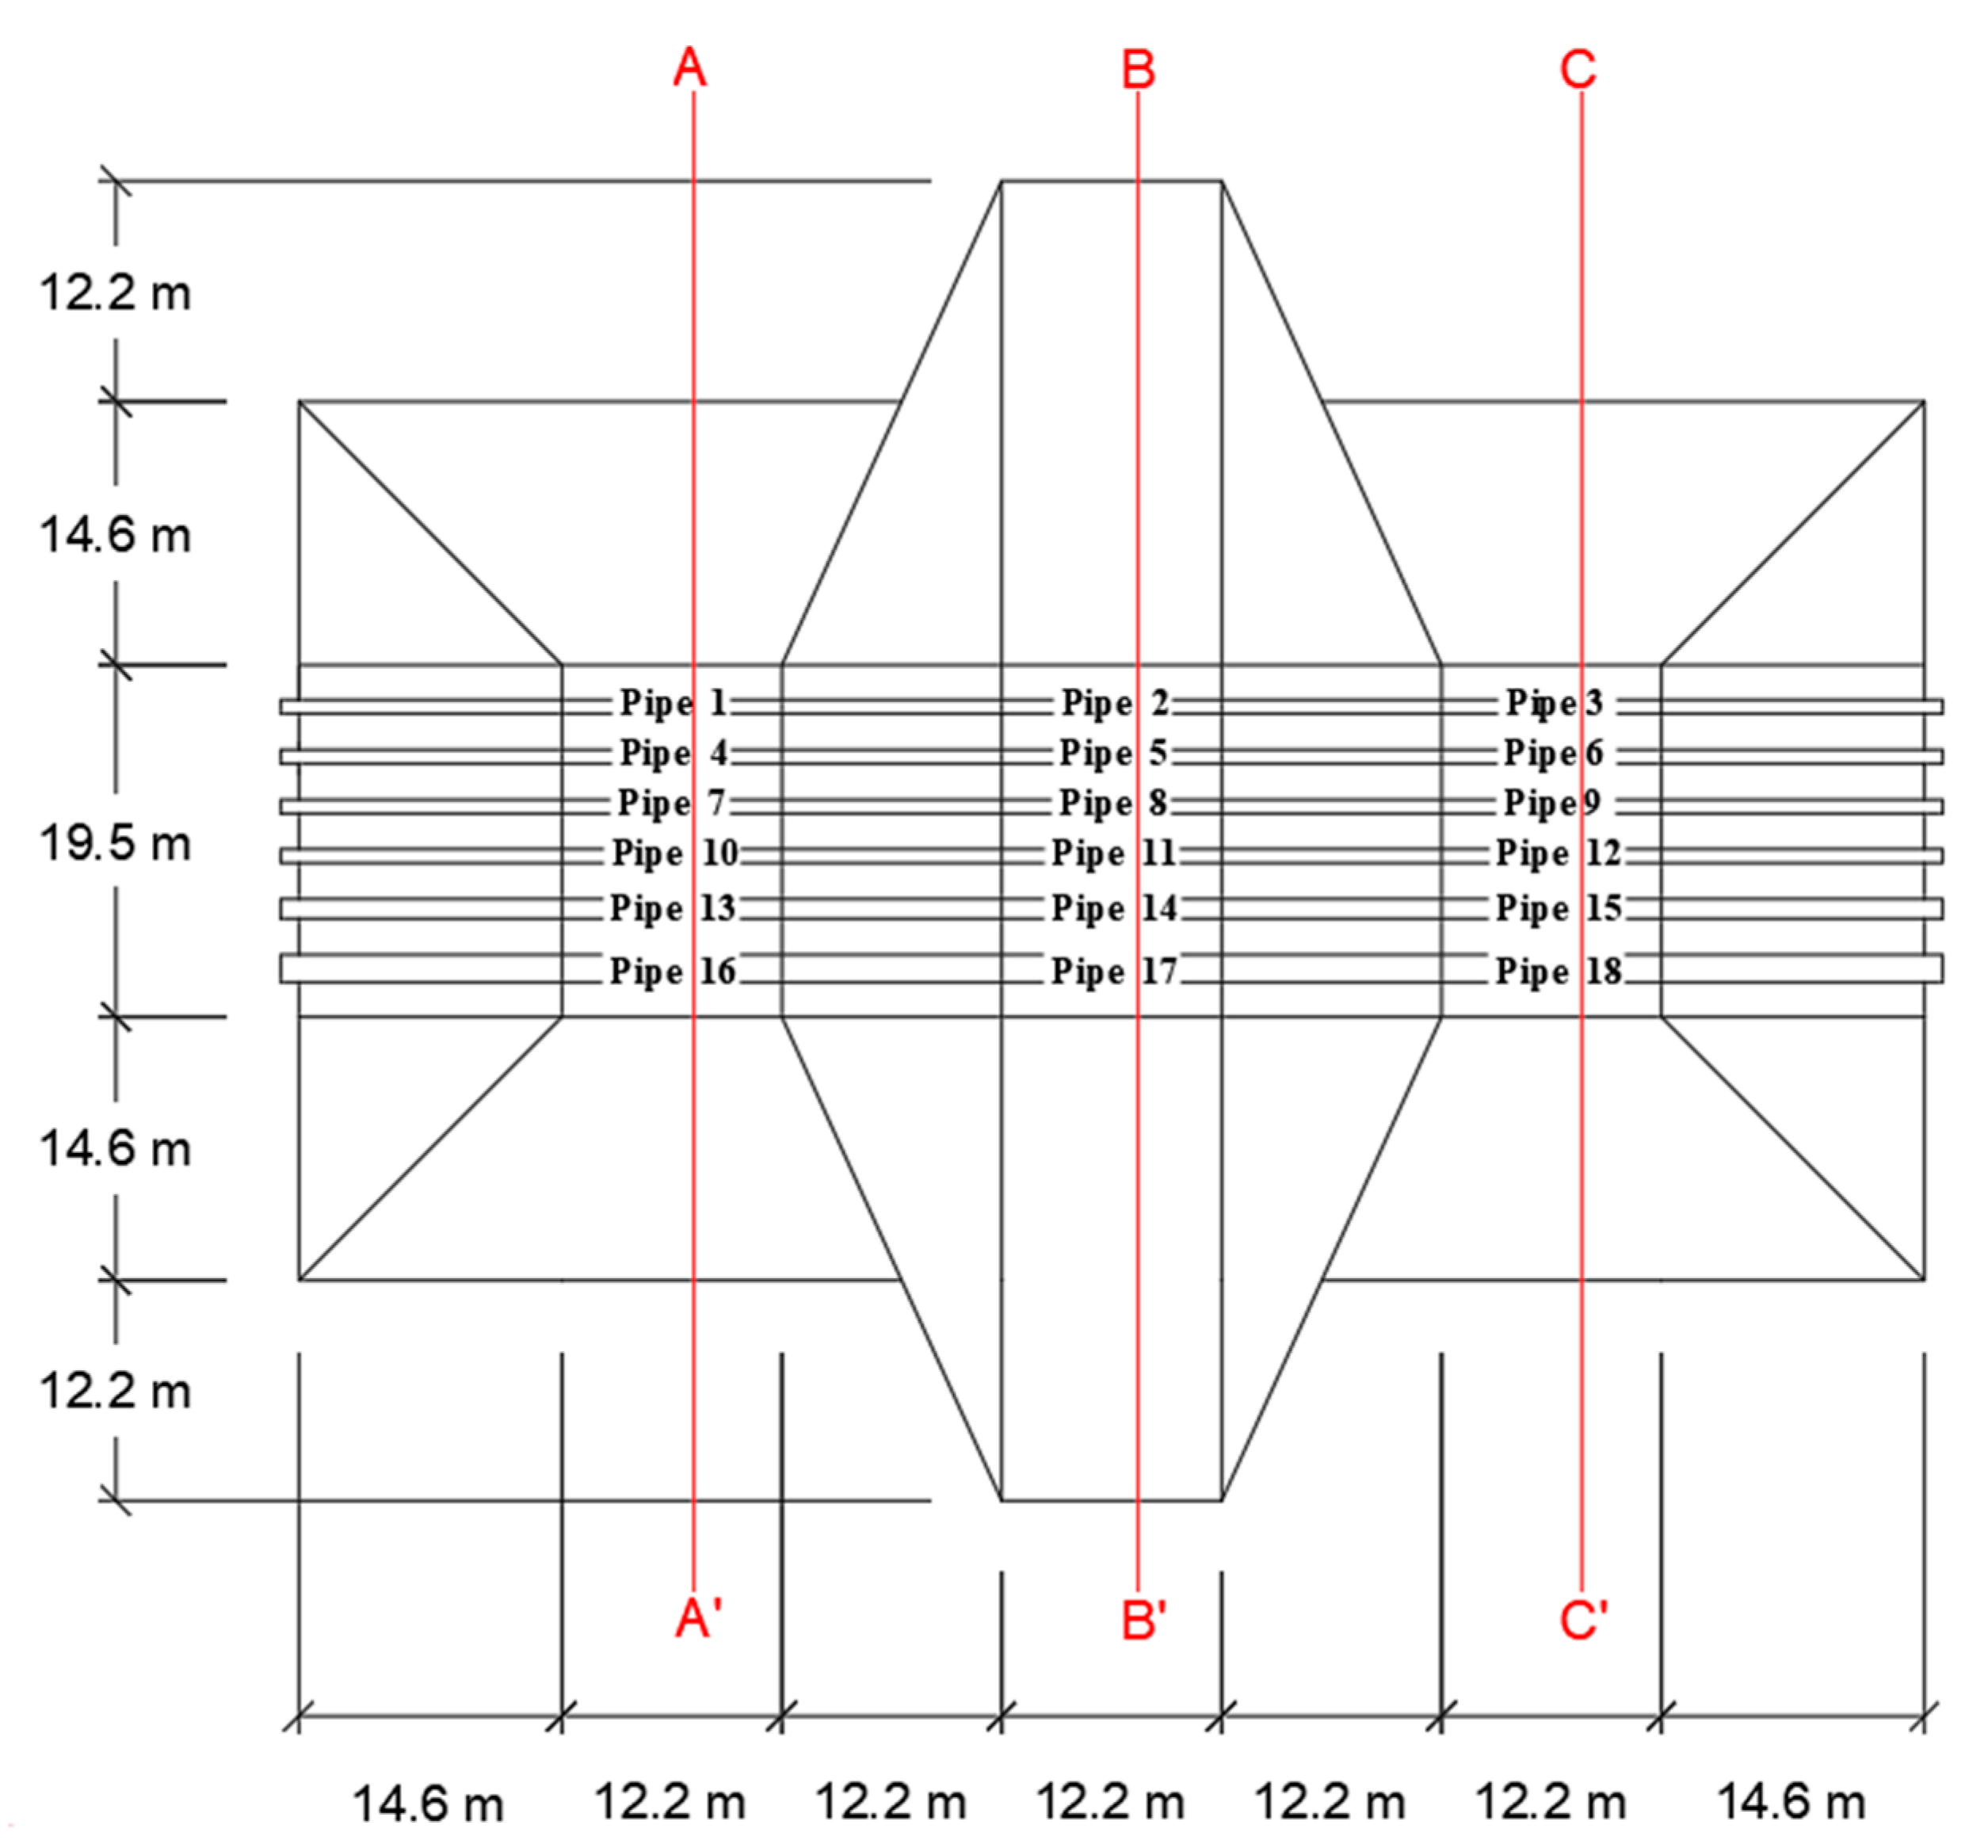
2. ORITE Project Field Experiment

ORITE (Ohio Research Institute for Transportation and the Environment) and ODOT (Ohio Department of Transportation) conducted a comprehensive soil experimentation program to identify the behavior of PVC and HDPE pipes buried under high fills [63]. Under the scope of the testing program, pipes used a negative projection installation in narrow and shallow trenches dug in native soil. As a backfill material, sand and crushed stone (Cr. S.) materials were used at 86, 90, and 96% relative compaction levels. Following the backfill, the embankment fill was constructed at two heights (6.1 and 12.2 m) using native soil. The pipe installation plan and directions for the cross-sections are shown in Figure 2. Test pipe installation conditions are summarized in Table 1 [63]. Compaction was not used on the mid 1/3 section of the bedding layer to maintain thermoplastic pipe seating in the bedding layer. In addition, bedding material was prepared at different thicknesses. Letters A, B, C, D, E, and F, listed under the pipe type section in Table 1, indicate the pipe wall profile. Sargand et al. [63] provided more details about pipe wall profiles. In this project, native soil was used as embankment fill material. The liquid limit of the soil was 27.2%, and the plastic limit was 16.5%. The Unified Soil Classification System (USC) classifies this as low-plasticity clay (CL). After embankment construction, consolidated–undrained (CU) triaxial compression tests were conducted on soil samples taken, and shear strength parameters (c and φ) were determined for sand and crushed stone used as backfill material. In addition, sieve analysis, compaction, one-dimensional compression, and consolidated–drained (CD) triaxial compression tests were conducted [65]. The field study data and evaluations based on this study were published in many periodicals [63,66,67,68,69,70,71,72,73,74]. More information on the work performed in the field test can be obtained from these articles.

3. Materials and Method

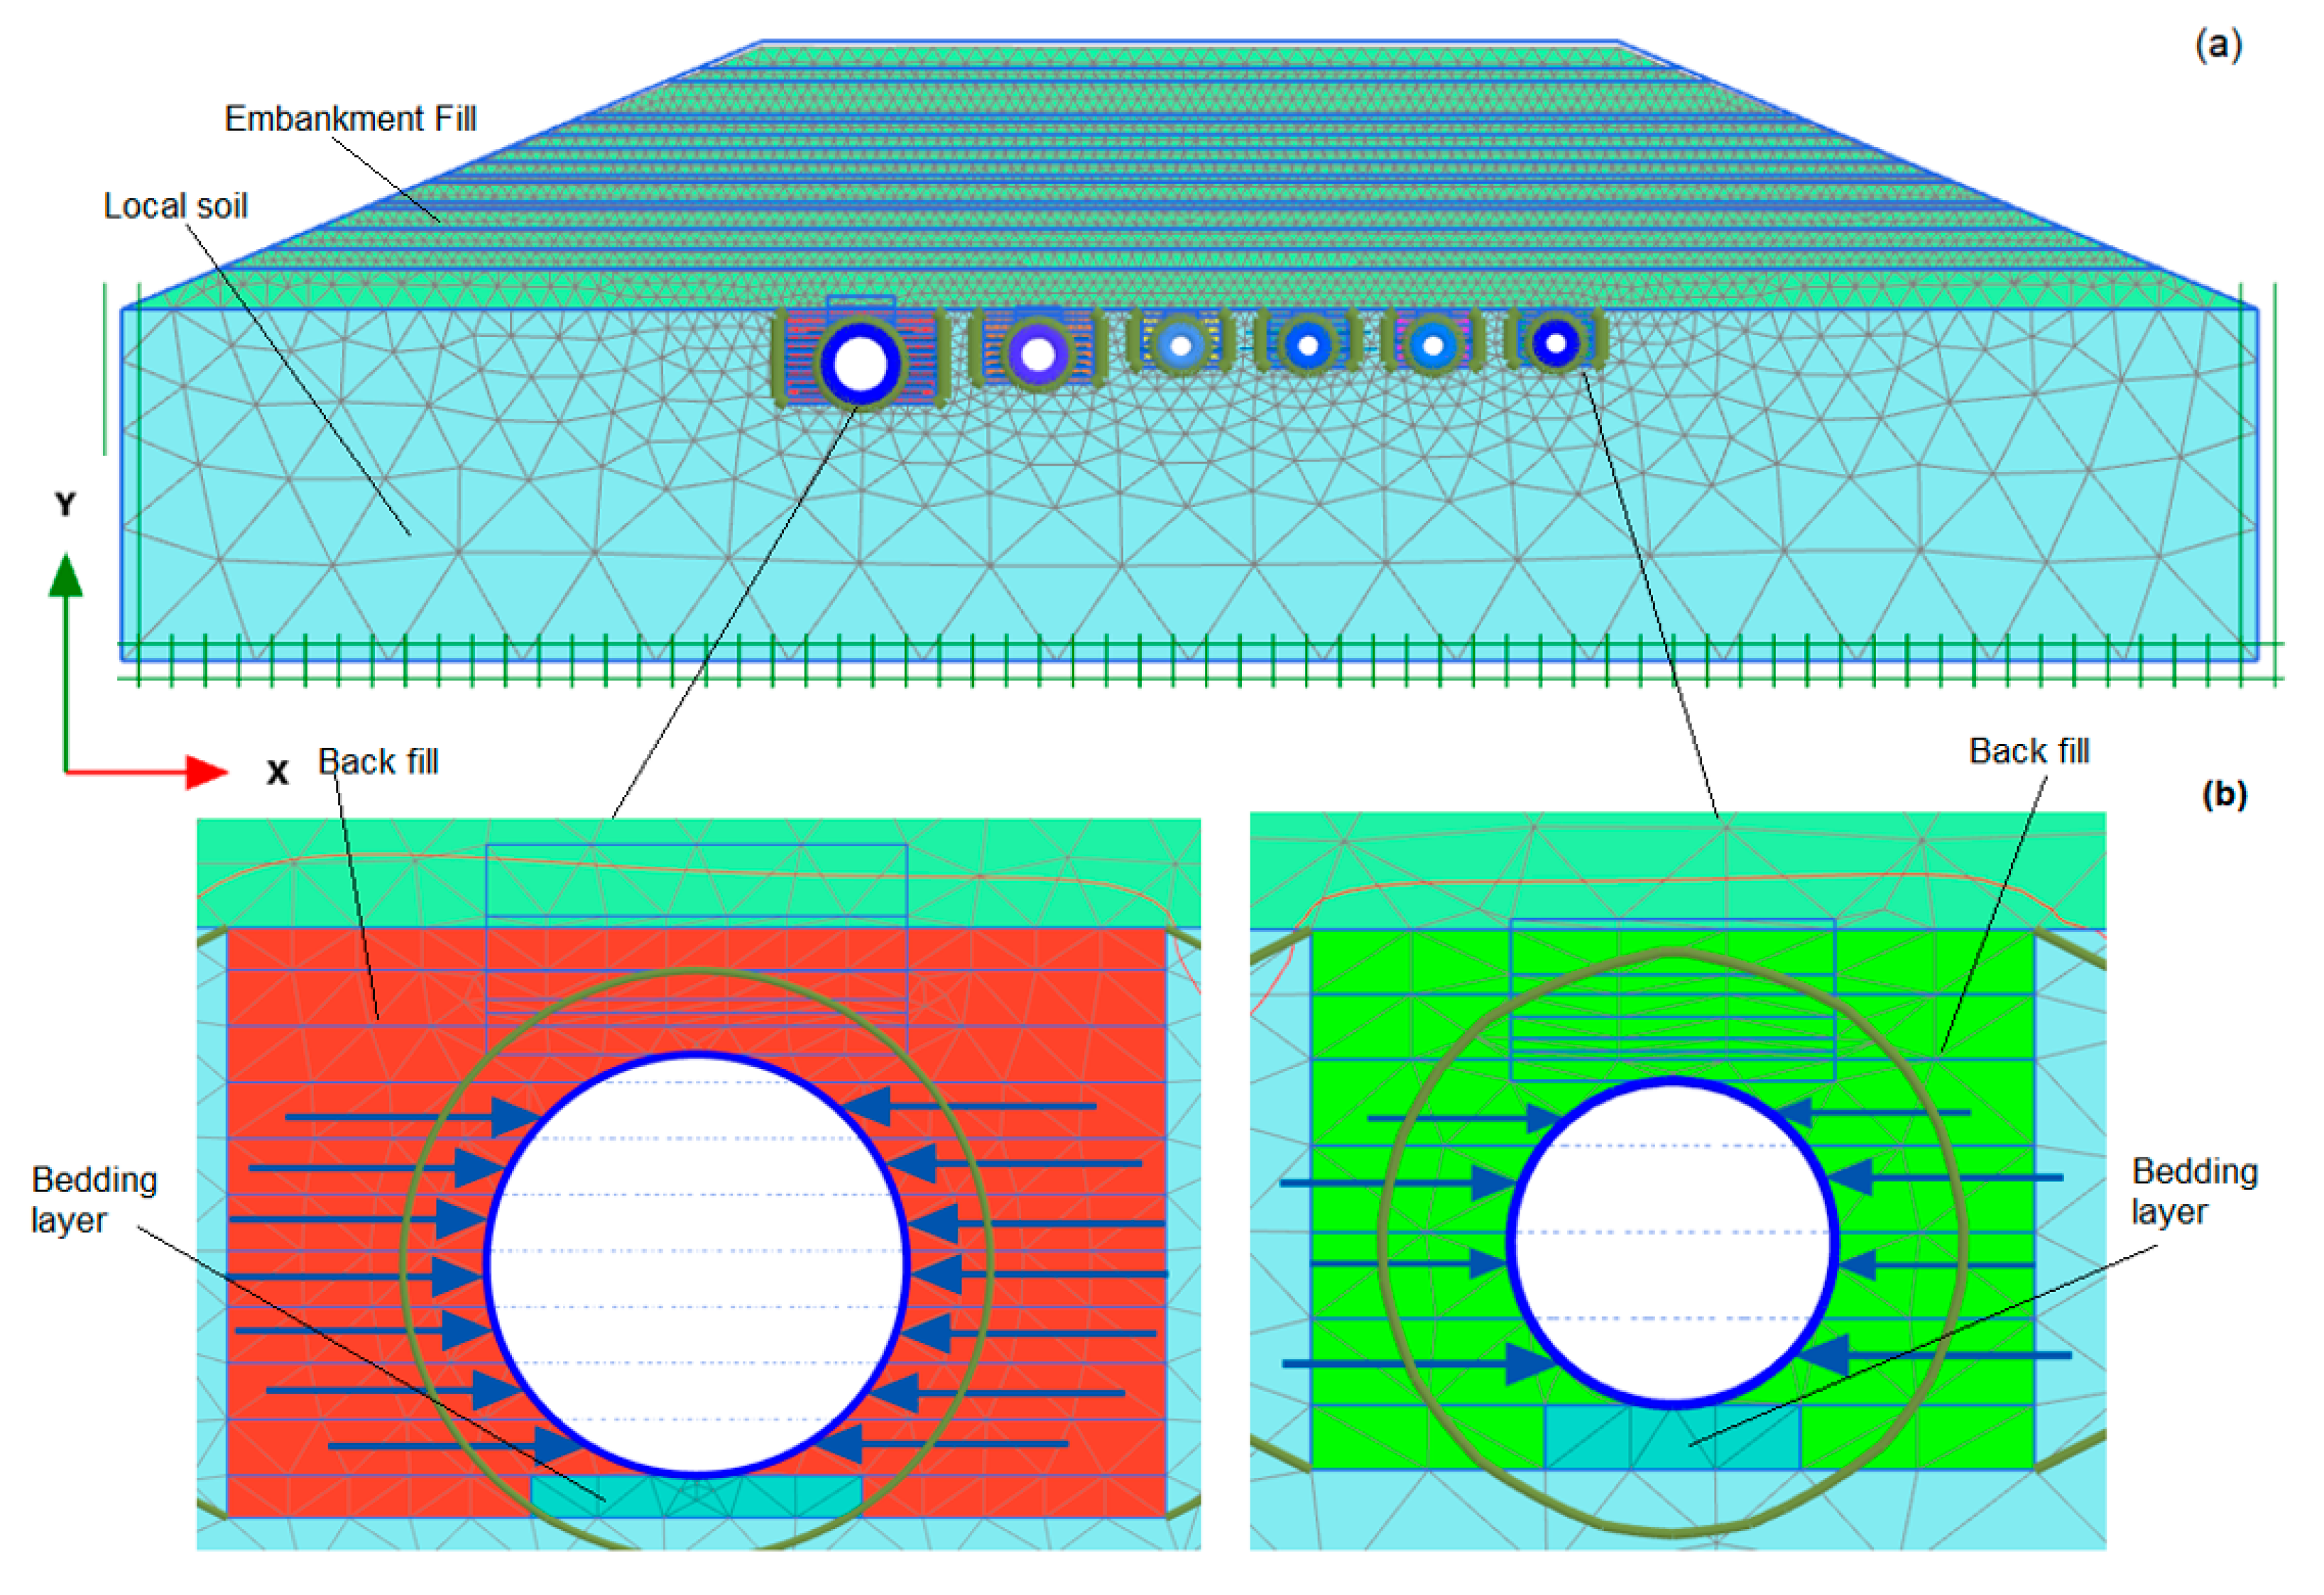
3.1. Numerical Modeling Method

The A-A′, B-B′, and C-C′ sections in Figure 2 were used to create numerical models in the [64] finite element program. The medium-density finite element mesh consisted of 15-node triangular elements (Figure 3).
Numerical analyses were conducted by considering the loading stages suitable for burial and embankment construction in the field experiment. The numerical model was verified by comparing the calculated results with the field measurements.

3.2. Soil and Pipe Parameters

In the analyses, embankment fill and backfill around the pipe and local soil were modeled by considering the Hardening Soil (HS) Model, using the uncoupled flow rule and the elastoplastic Mohr–Coulomb failure criteria. The material parameters of the soils are presented in Table 2.
The reference secant modulus ( E 50 r e f ) of backfill (sand, Cr. S) and local soil was calculated from Equation (1) below by considering the secant modulus E 50 obtained from triaxial compression tests [63]. The reference unloading–reloading module ( E u r r e f ) is E u r r e f = 3 × E 50 r e f and the reference pressure pref = 100 kPa was taken into account [64].
E 50 = E 50 r e f c Cos ϕ σ 3 Sin ϕ c Cos ϕ + p r e f Sin ϕ m
The thermoplastic pipe wall was elastically modeled, and the parameters of the pipes are presented in Table 3. A and B are PVC; the others are HDPE.

3.3. Interface Parameters

Angles of interface strength adopted for the local soil trench wall-backfill interface, pipe-backfill interface, pipe-EPS interface, and the EPS-backfill interface and corresponding interface strength reduction factors (Rinter) are given in Table 4. Interface strength reduction factors were obtained from the literature review [75,76,77].

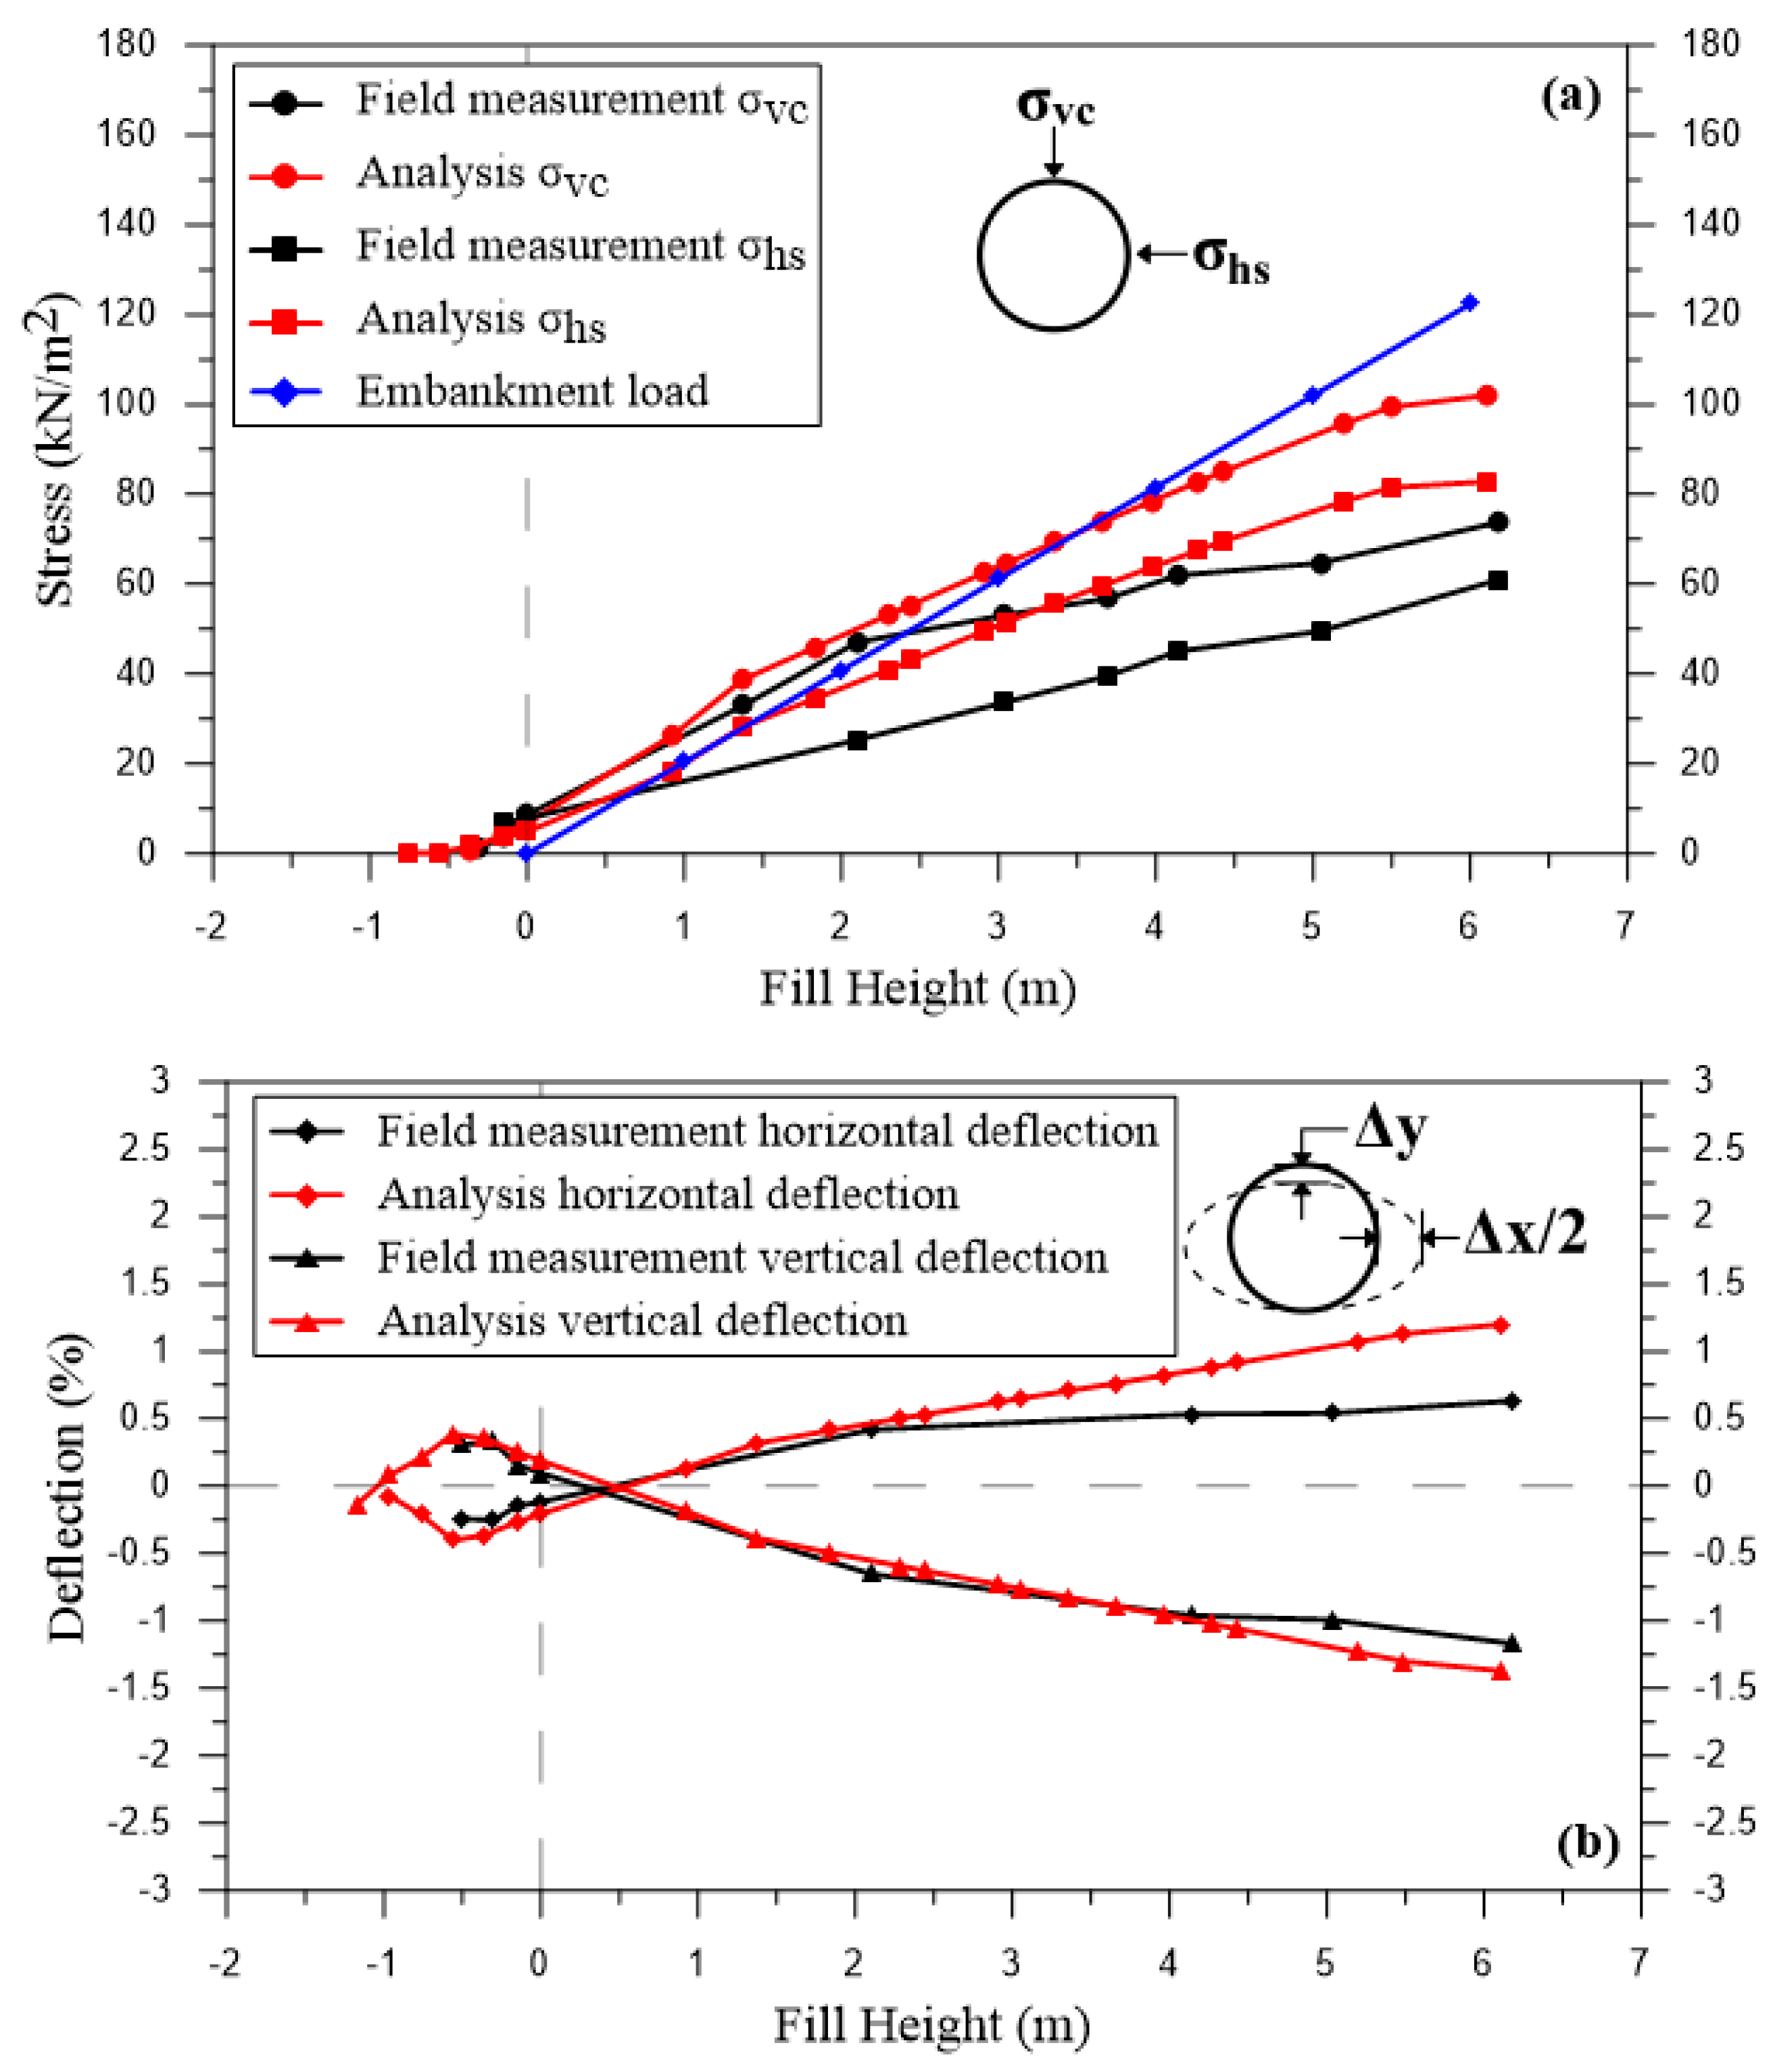
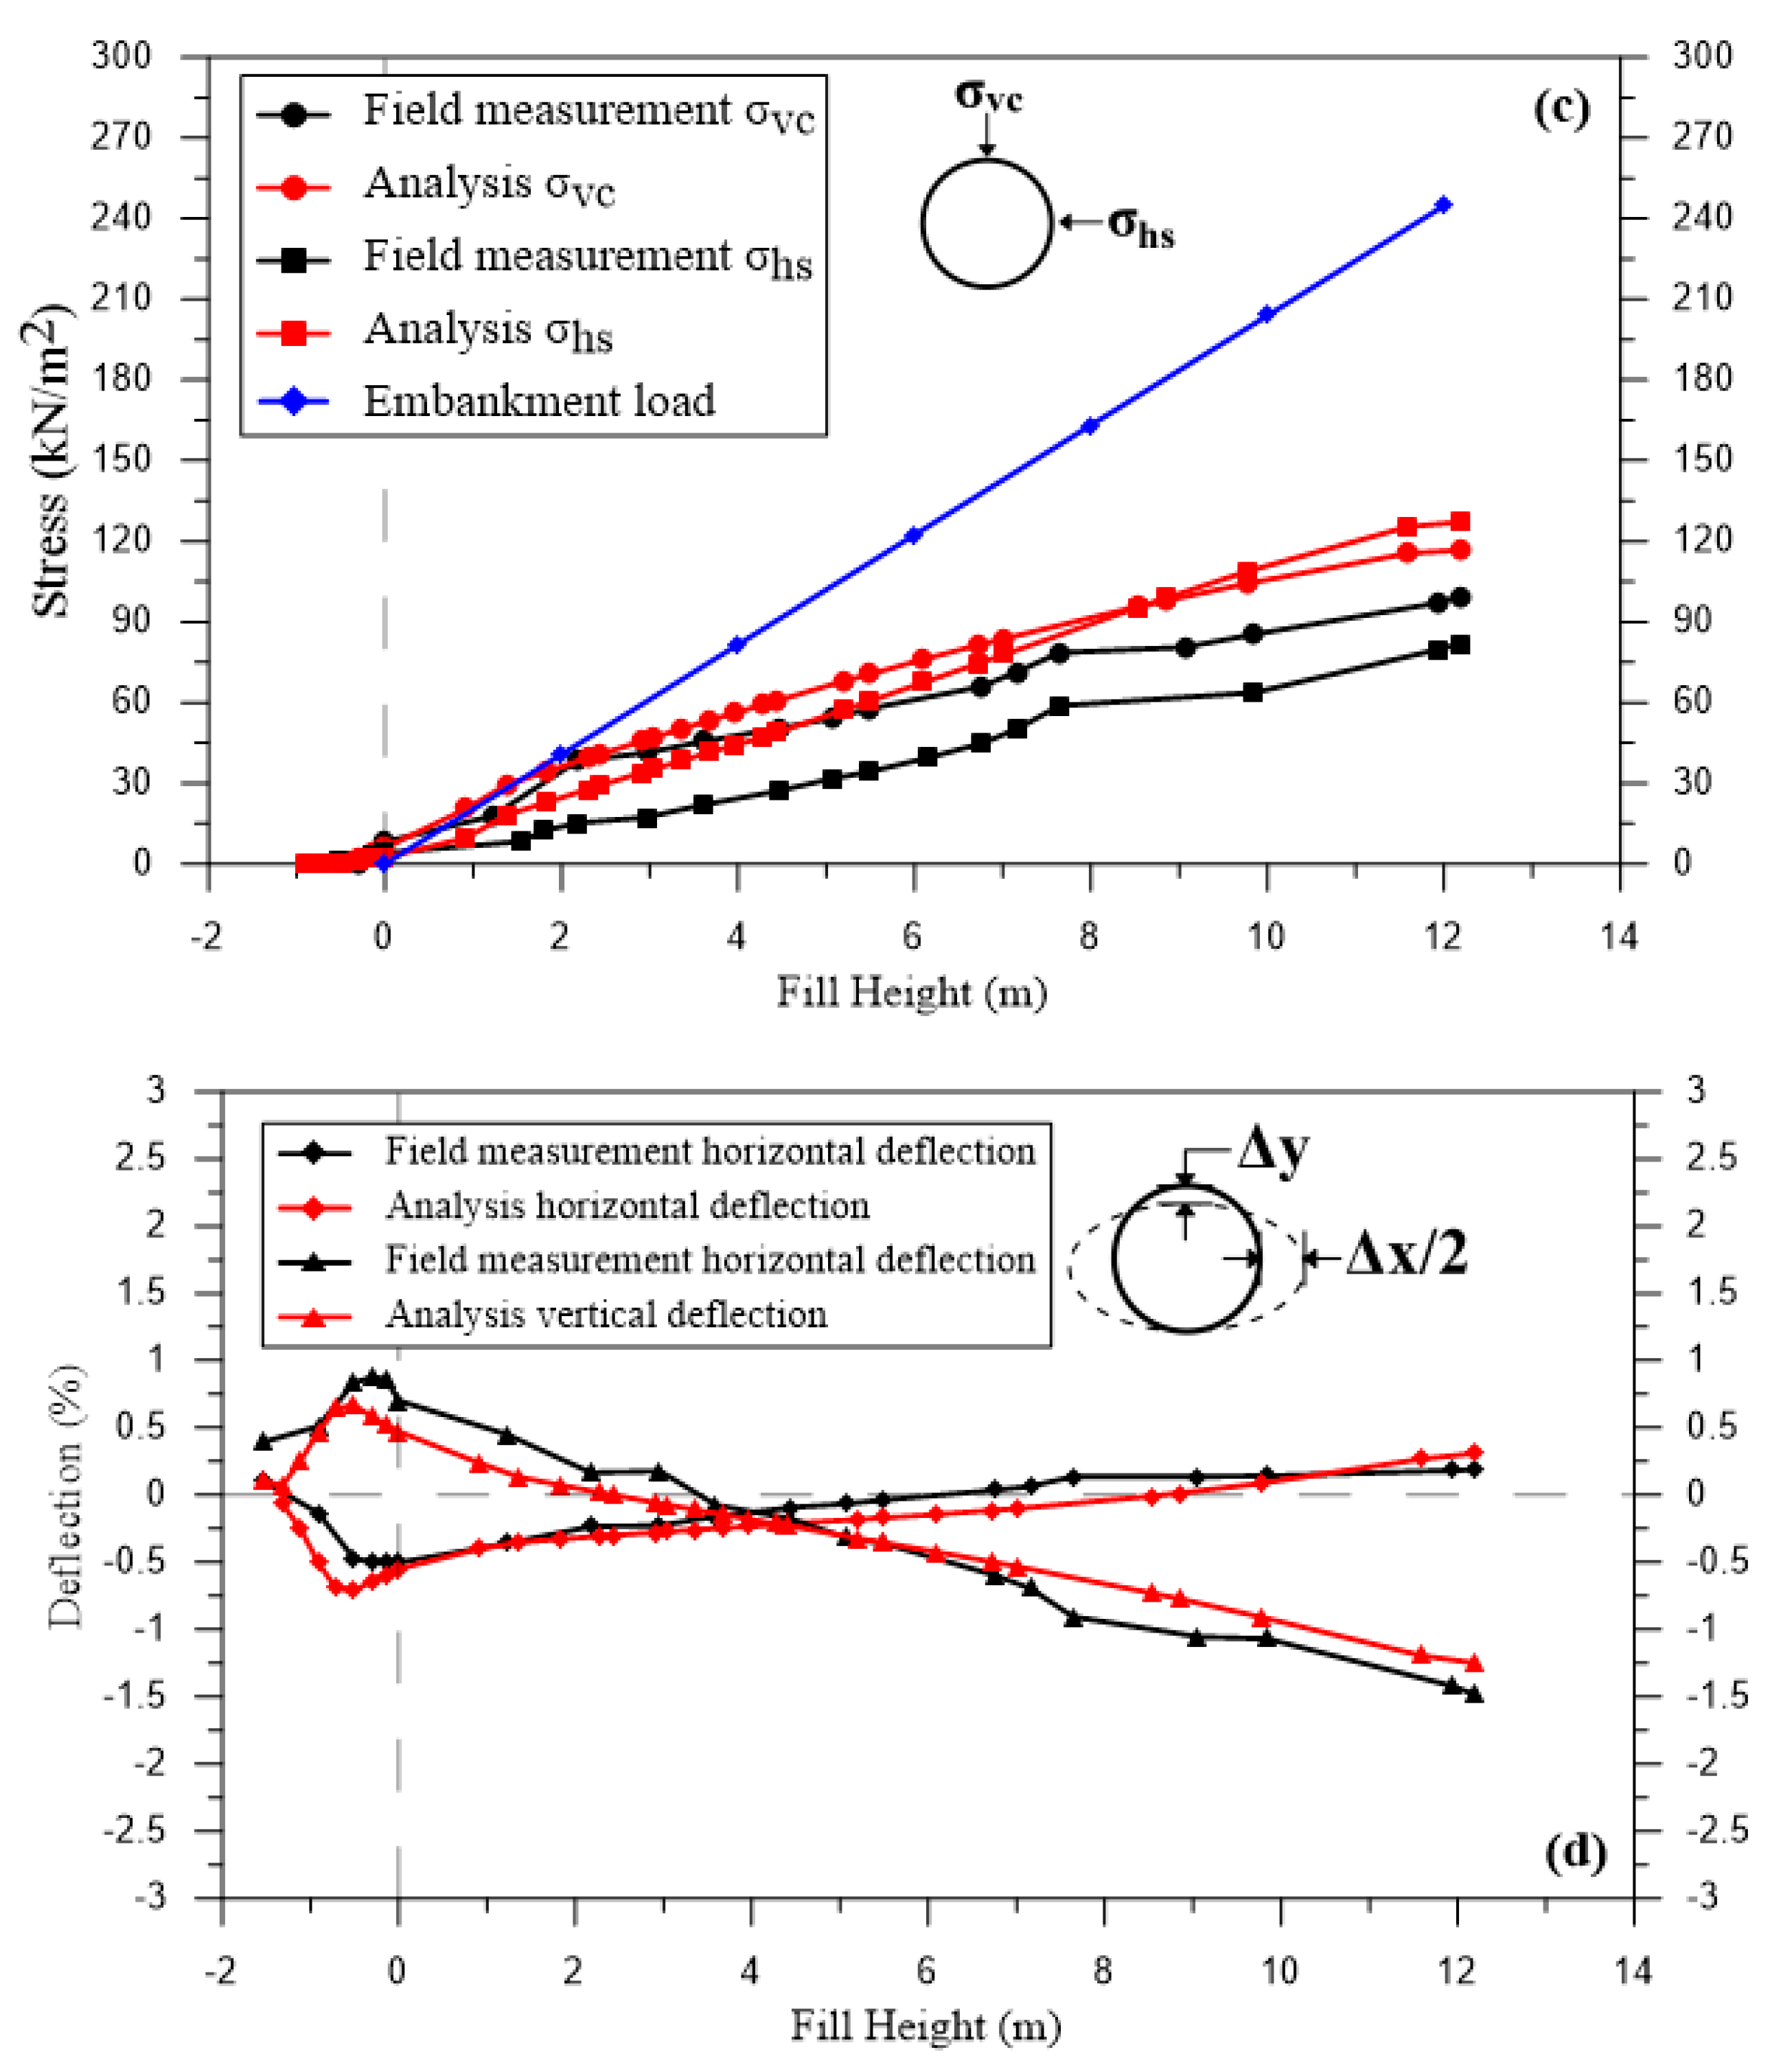
3.4. Verification of the Numerical Model

Numerical analyses were performed for all pipes shown in the plan in Figure 2 [78]. However, for verification analysis within the scope of the article, only the results for Pipe 4 (A-A′ section) and Pipe 14 (B-B′ section) were compared with field measurements and presented in Figure 4.
In the field test, after the pipe was placed in the trench, it was compacted by placing a backfill layer around it. To consider the effect of the compaction process on the pipe in the numerical analysis, the loads indicated in Table 5 were applied laterally to the pipe sidewall (Figure 3b). Thus, the deflection of the pipes during the backfill phase could be modeled more realistically. The magnitude of the point loads was determined by trial and error, considering the relative compaction values. Since the 6.1 m and 12.2 m embankment fills built over the negatively projected pipes were also placed by compaction, the embankment fill construction was modeled by applying a distributed load of 6 kN/m in the first fill layer and 12.5 kN/m in the other fill layers. After the trench backfill was completed in 11 steps, the 6.1 m- and 12.2 m-thick embankment was constructed in 15 and 22 steps, respectively. The values up to zero shown on the horizontal axis in Figure 4 show the trench backfill of the pipe placed with negative projection and then the backfill construction (6.1 m or 12.2 m).
It was seen that the calculated deflection for both pipes was in approximate agreement with the field measurements, but the horizontal and vertical stresses were greater than those measured. In Figure 4a, there was a difference of roughly 25 kPa in stresses between numerical analysis and field measurement for Pipe 4. In comparison, a difference of 17 kPa in vertical stresses and 45 kPa in horizontal stresses occurred in Pipe 14 in Figure 4c, and the horizontal stress exceeded the vertical stress after 8.5 m of fill. In addition, it was seen that the measured vertical and horizontal stresses are quite close to each other. The vertical and horizontal stresses calculated from the analyses are close. Under the applied stress, positive arching occurred with vertical deflection of the pipe. As a result of the decrease in the vertical stresses, an increase in the horizontal stresses occurred.
In the verification analysis, approximately similar pipe deflections were considered. In Figure 4b, the vertical deflection was more compatible with the measurements, while the horizontal deflection was slightly higher. In Figure 4d, both the vertical and horizontal deflection values were more consistent with the measurements.
The response of a pressure cell as an inclusion within a soil medium depends on the interaction between the cell and soil, which is controlled by many factors such as soil type and grain size, cell type, cell-to-soil stiffness ratio, aspect ratio, membrane deflection, installation procedure, etc. [79,80,81,82]. Therefore, instead of the values by the field measurement, the percentage changes concerning the values calculated in the Reference installation in Figure 5 were utilized in the discussion of calculated stresses.

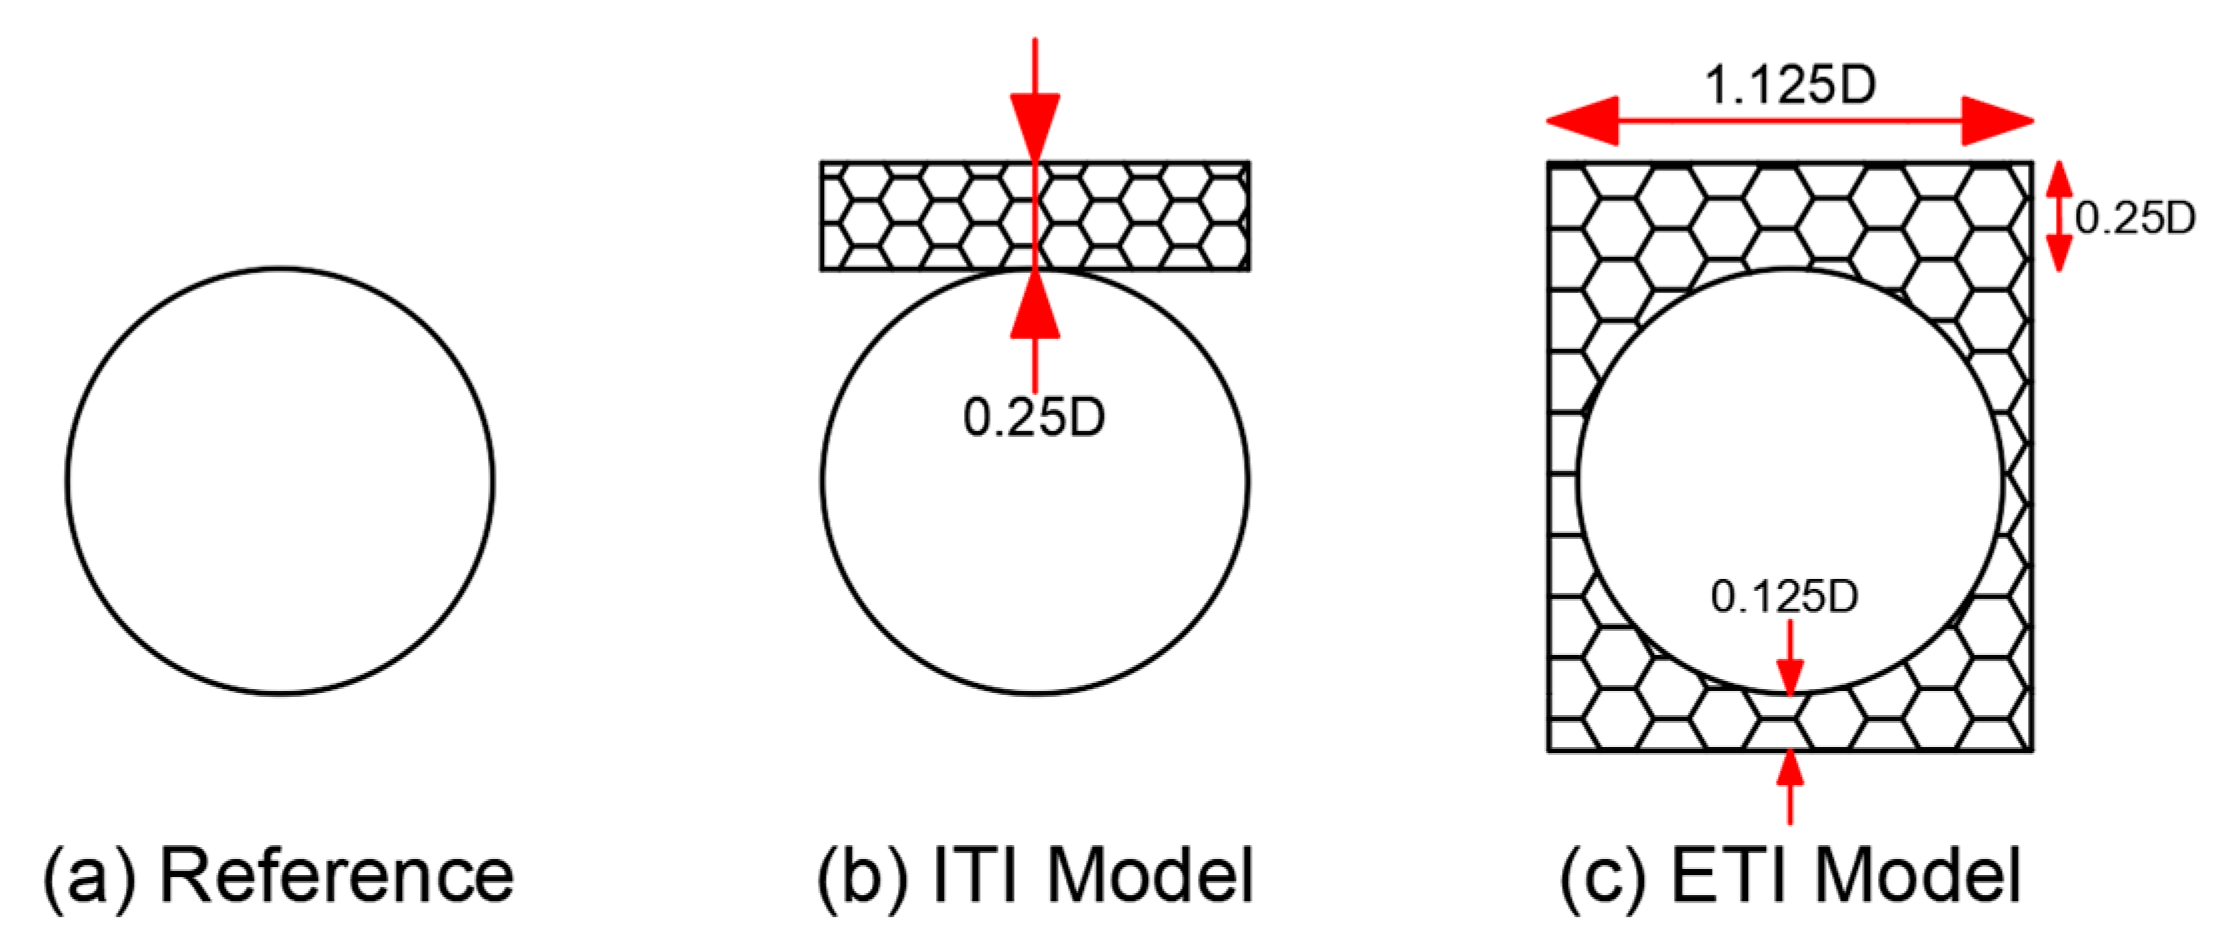
3.5. Use of EPS Geofoam with Thermoplastic Pipes under High Fill Stresses
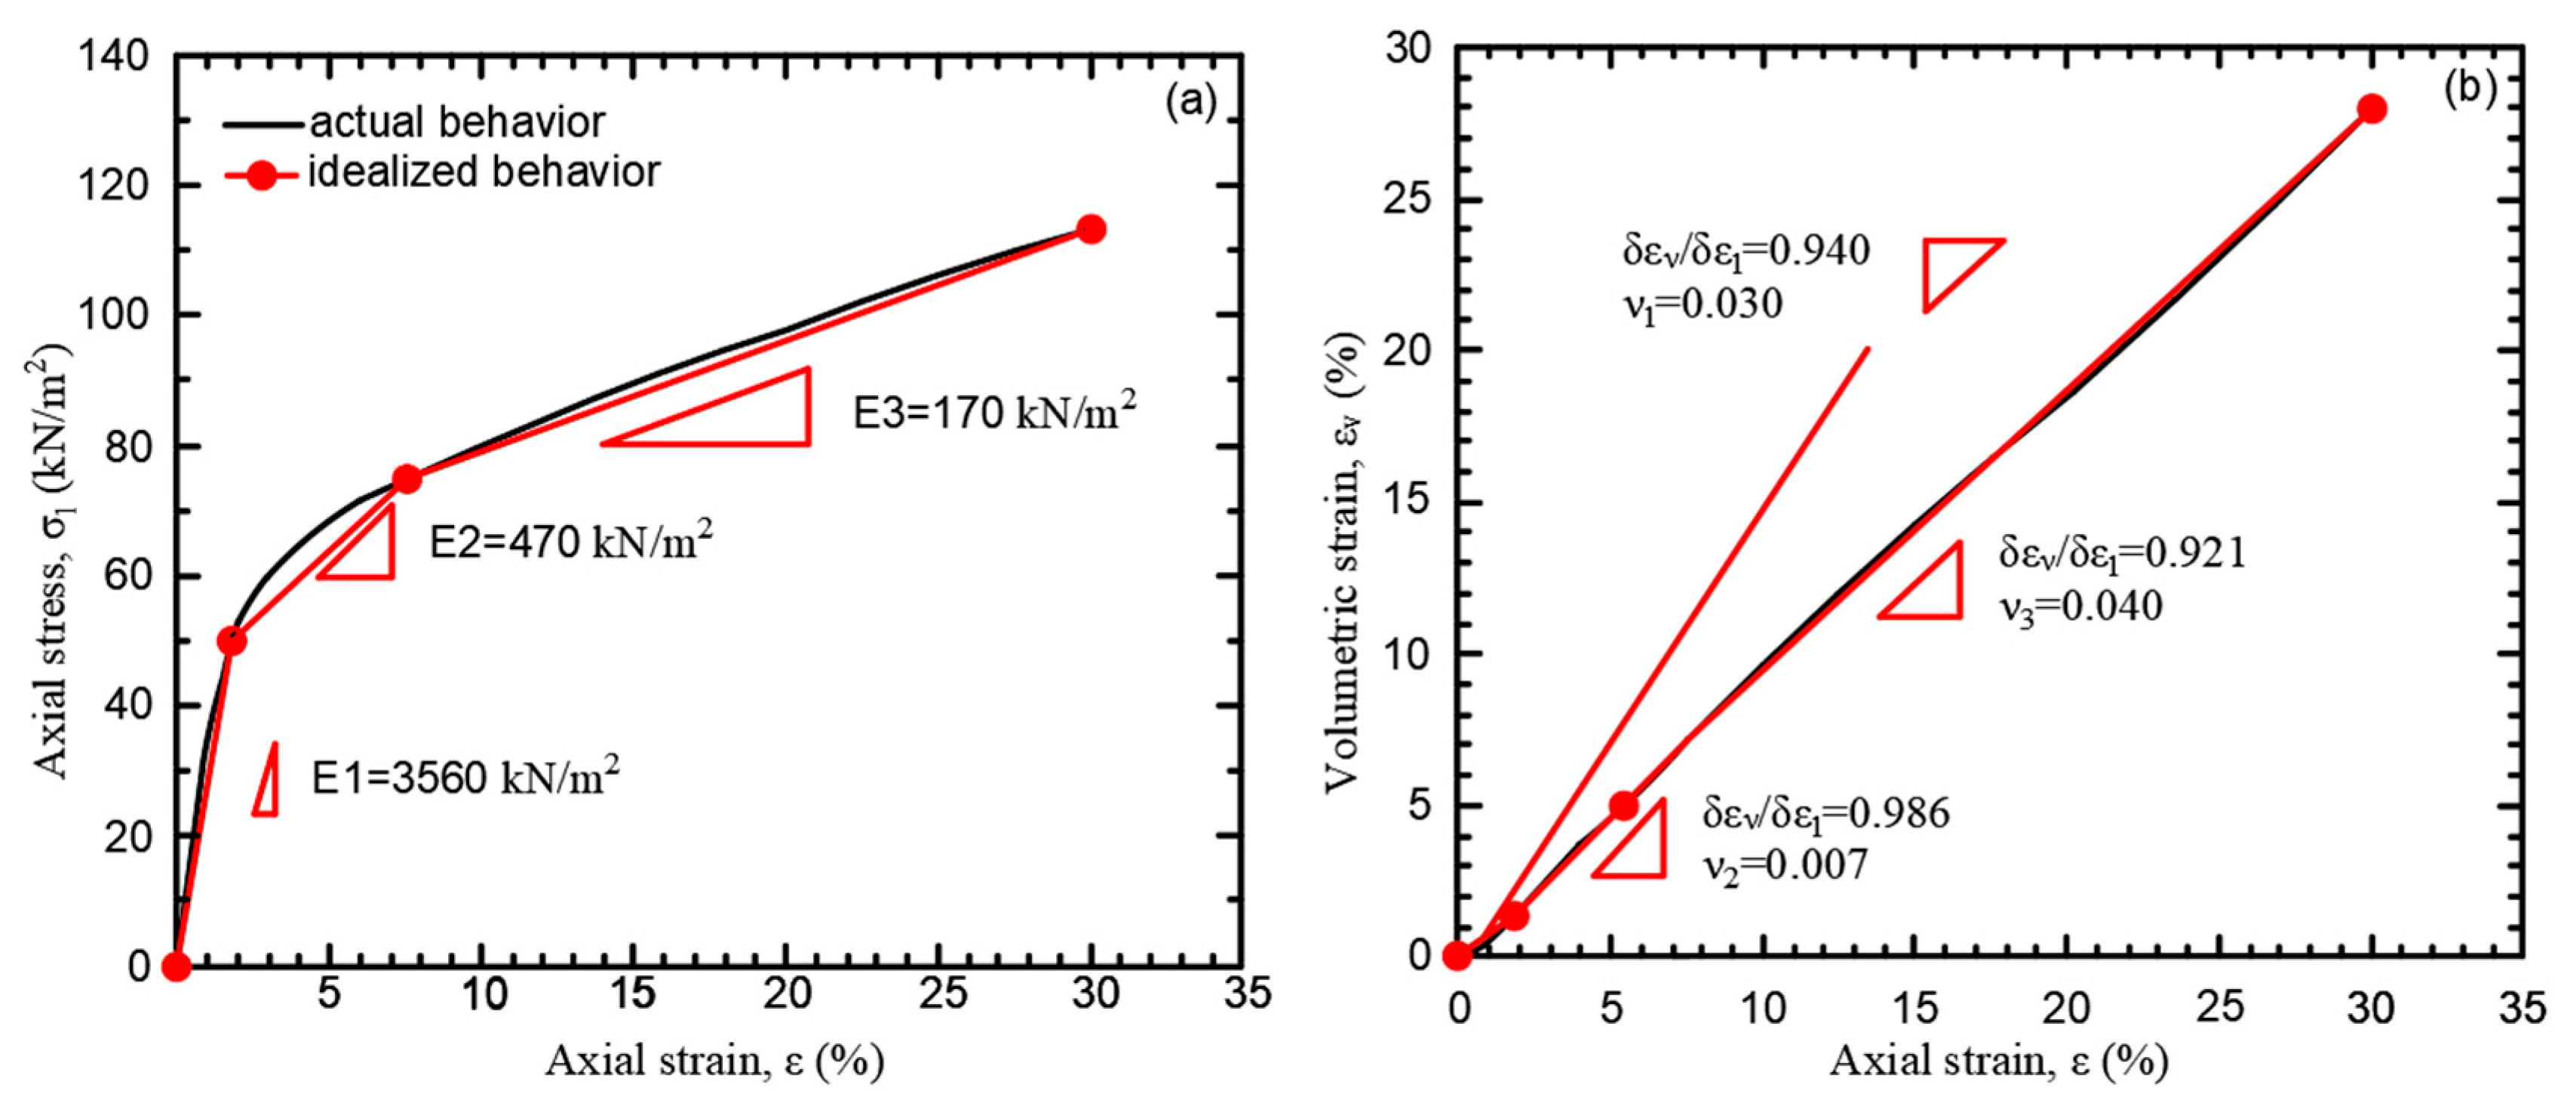
A series of finite element analyses were carried out using [64] software to investigate the effects of using EPS Geofoam as a compressible material for the ITI and ETI models for the thermoplastic pipe that was exposed to high fill stresses. Consequently, in the model shown in Figure 3, the fill height was increased from 12.2 m to 30 m. Before analyses were conducted, the material was added to the numerical model in the geometries shown in Figure 5. The fill construction was carried out in 30 stages in the study by adding fill layers of 1 m. The reference is taken to be a pipe without EPS and is shown in (Figure 5a), the ITI model is represented as a pipe with EPS on top (Figure 5b), and the ETI model (Figure 5c) is a pipe completely wrapped in EPS. The EPS geometry given in the ETI model was determined by considering the study of [10]. D indicates the inside diameter of the pipe.
The effects of backfill type were also investigated by considering crushed stone (Cr. S), sand, and clay around the pipe. Hardening Soil (HS) model material parameters for backfill soils are presented in Table 6. First of all, analyses were conducted for crushed stone, sand, and clay backfill (Reference) around the pipe; then, the analyses were repeated using EPS with a density of 15 kg/m3 (EPS15) using the ITI model and ETI model, respectively. In the analyses, the stresses and vertical and horizontal deflections at the crown of the pipe, in the spring line, and invert were all evaluated.

3.6. EPS Geofoam

This study used EPS Geofoam with a density of 15 kg/m3 (EPS15). Axial strain–axial stress and axial strain–volumetric strain relationships for EPS15 were determined by performing a uniaxial compression test [52]. The uniaxial monotonic compressive behavior of EPS15 was idealized by three linear segments (Figure 6a). The first segment was the secant line between the origin and 1% axial strain: the slope of the initial tangent modulus [83]. The second segment was the secant line between 2 and 6% axial strains: the slope of the transitional tangent modulus. The third segment was the secant line between 6 and 30% axial strains: the slope of the plastic tangent modulus [55]. The abscissa of the intersection point of the first and the second segments was determined to be 1.45% axial strain for EPS15. For the curve given in Figure 6a, the slopes of the linear segments (i.e., moduli) were determined to be E1 = 3560 kPa, E2 = 470 kPa, and E3 = 170 kPa for EPS15. The Poisson’s ratios for the three linear segments were determined using the axial strain–volumetric strain relationships given in Figure 6b. The Poisson’s ratios were determined to be v1 = 0.189, v2 = 0.007, and v3 = 0.040 for EPS15, respectively.

4. Numerical Analyses Result and Discussion

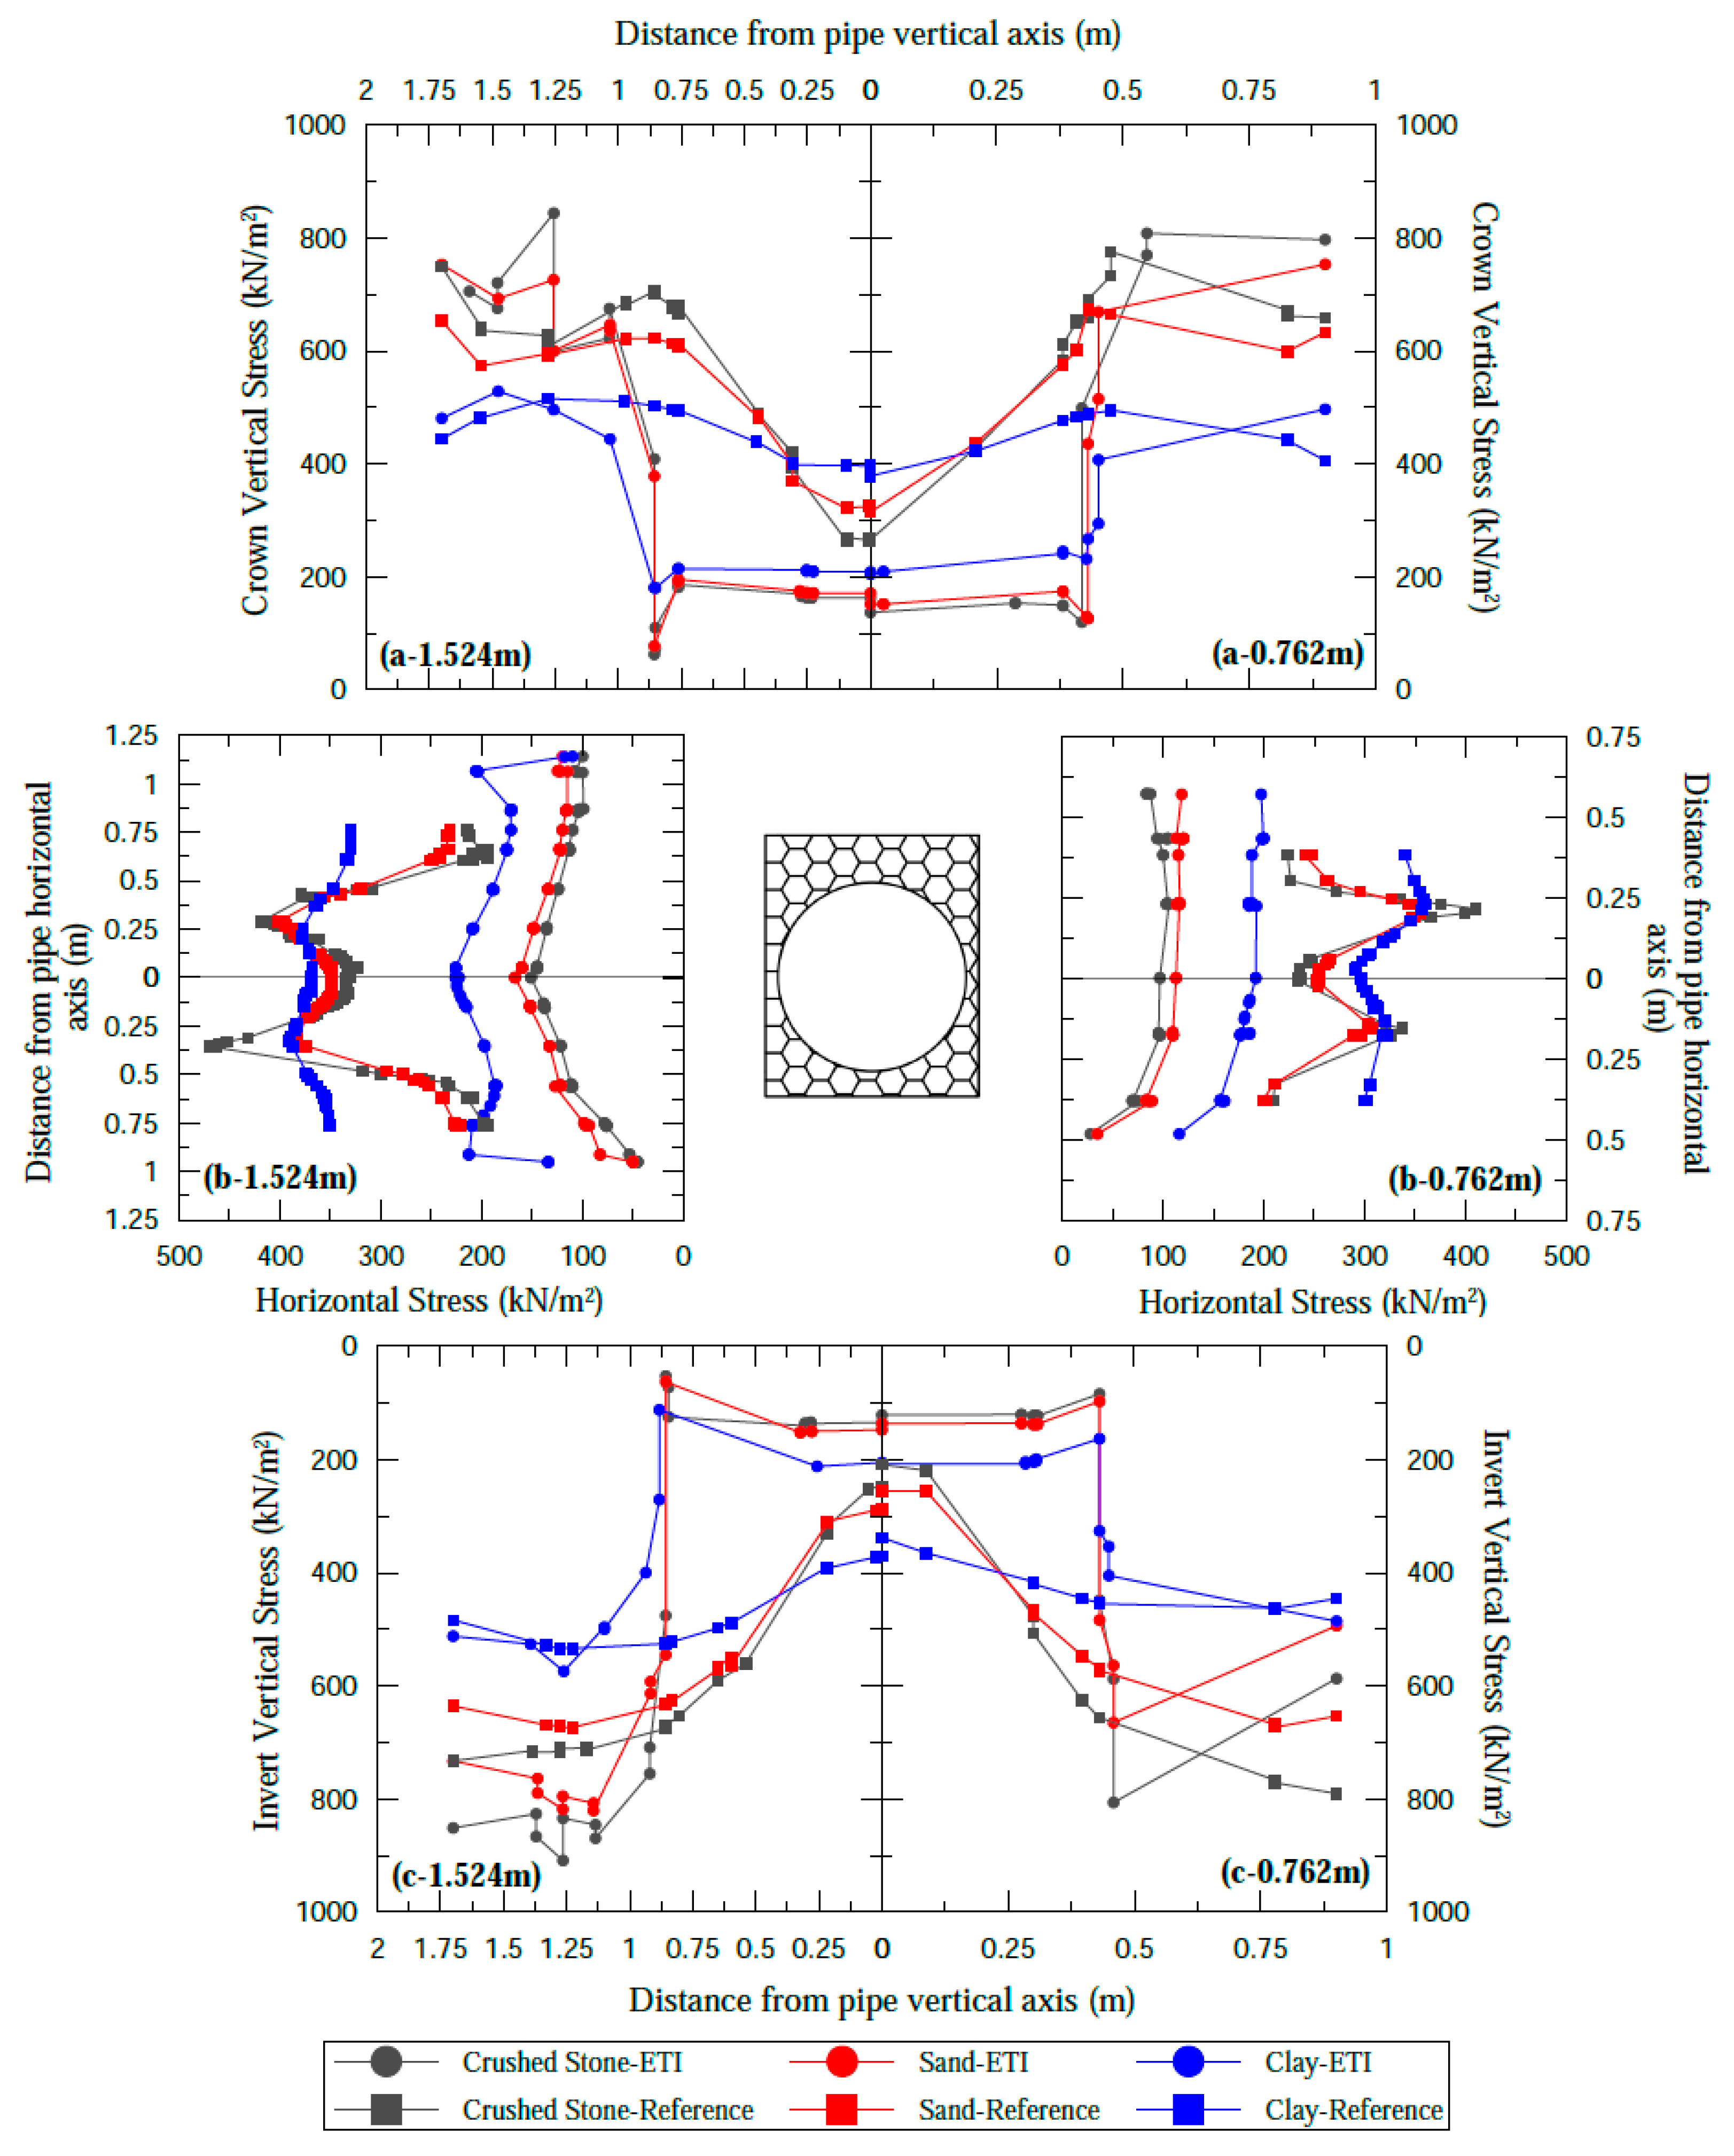
4.1. Pipe Diameter Effect

To examine the effect of pipe diameter on stresses, HDPE pipes of 1.524 m in diameter —specified as F type—and 0.762 m in diameter—specified as C type–were considered and are shown in Table 1 and Table 3. Stresses around the pipe are shown for the ITI model in Figure 7 and for the ETI model in Figure 8. In Figure 7 and Figure 8, the left and right sides show the values for the pipe with a diameter of 1.524 m and 0.762 m, respectively. Table 7 shows the calculated stresses in the pipe crown, invert, and spring line under a 30 m fill.
According to the analyses (in Table 7, Figure 7 and Figure 8), the effect of diameter is examined by considering HDPE as the pipe material. The calculated stresses in the 1.524 m diameter pipe were generally higher than the 0.762 m diameter pipe. In the ITI and ETI models, uniform vertical stress occurred in the pipe crown across the width of the EPS, but the stresses in the spring line and invert were larger in the ITI model than in the ETI model. Thus, the importance of the geometry of the compressible region around the pipe was revealed. In the ITI model, a compressible zone was only created on top of the pipe, which caused greater stresses on the pipe spring line and the invert in comparison to the ETI model.
It was determined that the ETI model reduced the stresses acting on the pipe and caused a more uniform stress distribution around it. When comparing the stresses acting on the 1.524 m and 0.762 m diameter pipe, the larger diameter pipe was approximately 20%, 15%, and 35% higher at the crown, invert, and spring lines, respectively. A similar study conducted by [58] that considered HDPE pipes with 0.2, 0.3, and 0.40 m small diameters stated that there was a 10% increase in vertical and horizontal stresses as the diameter increased. The type of backfill soil around the pipe also affected the stresses. As can be seen from Figure 7 and Figure 8, high stresses occurred in clay, sand, and crushed stone backfills, respectively. Uniform stress distributions in thermoplastic pipes have been obtained in experimental and numerical analyses examining the soil–EPS–pipe interaction [1,10,11,17,18,26].

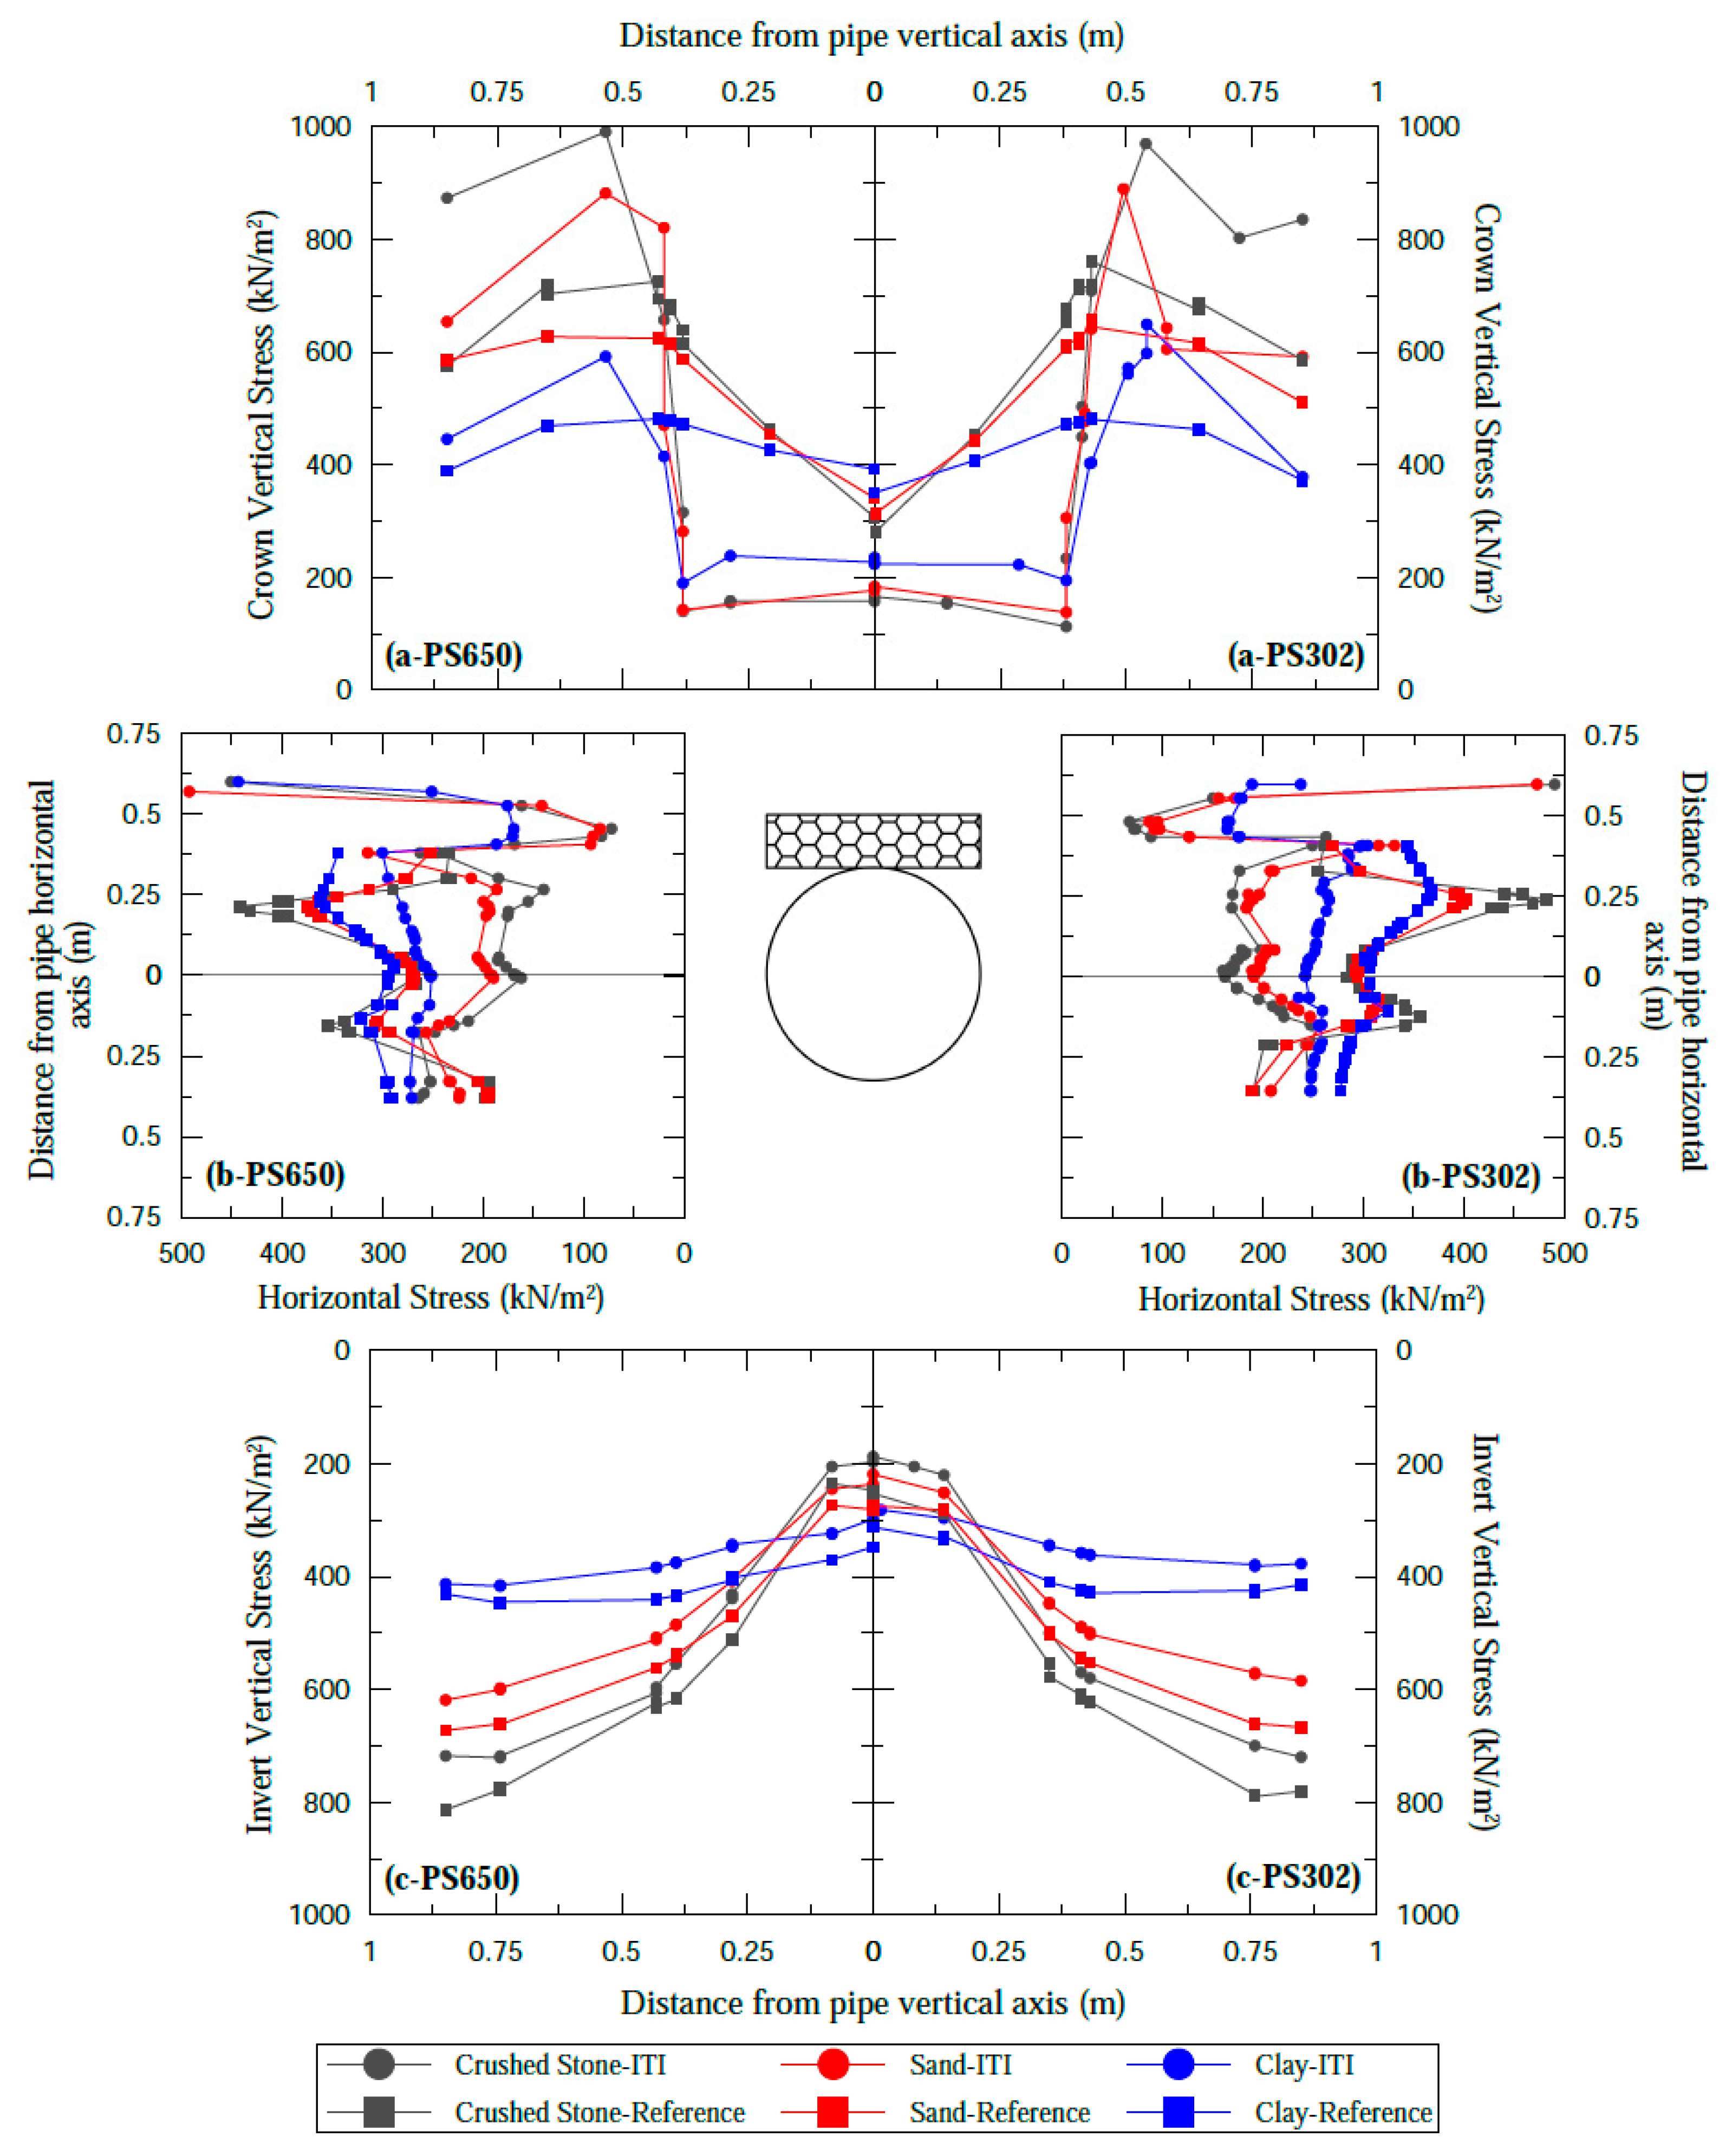
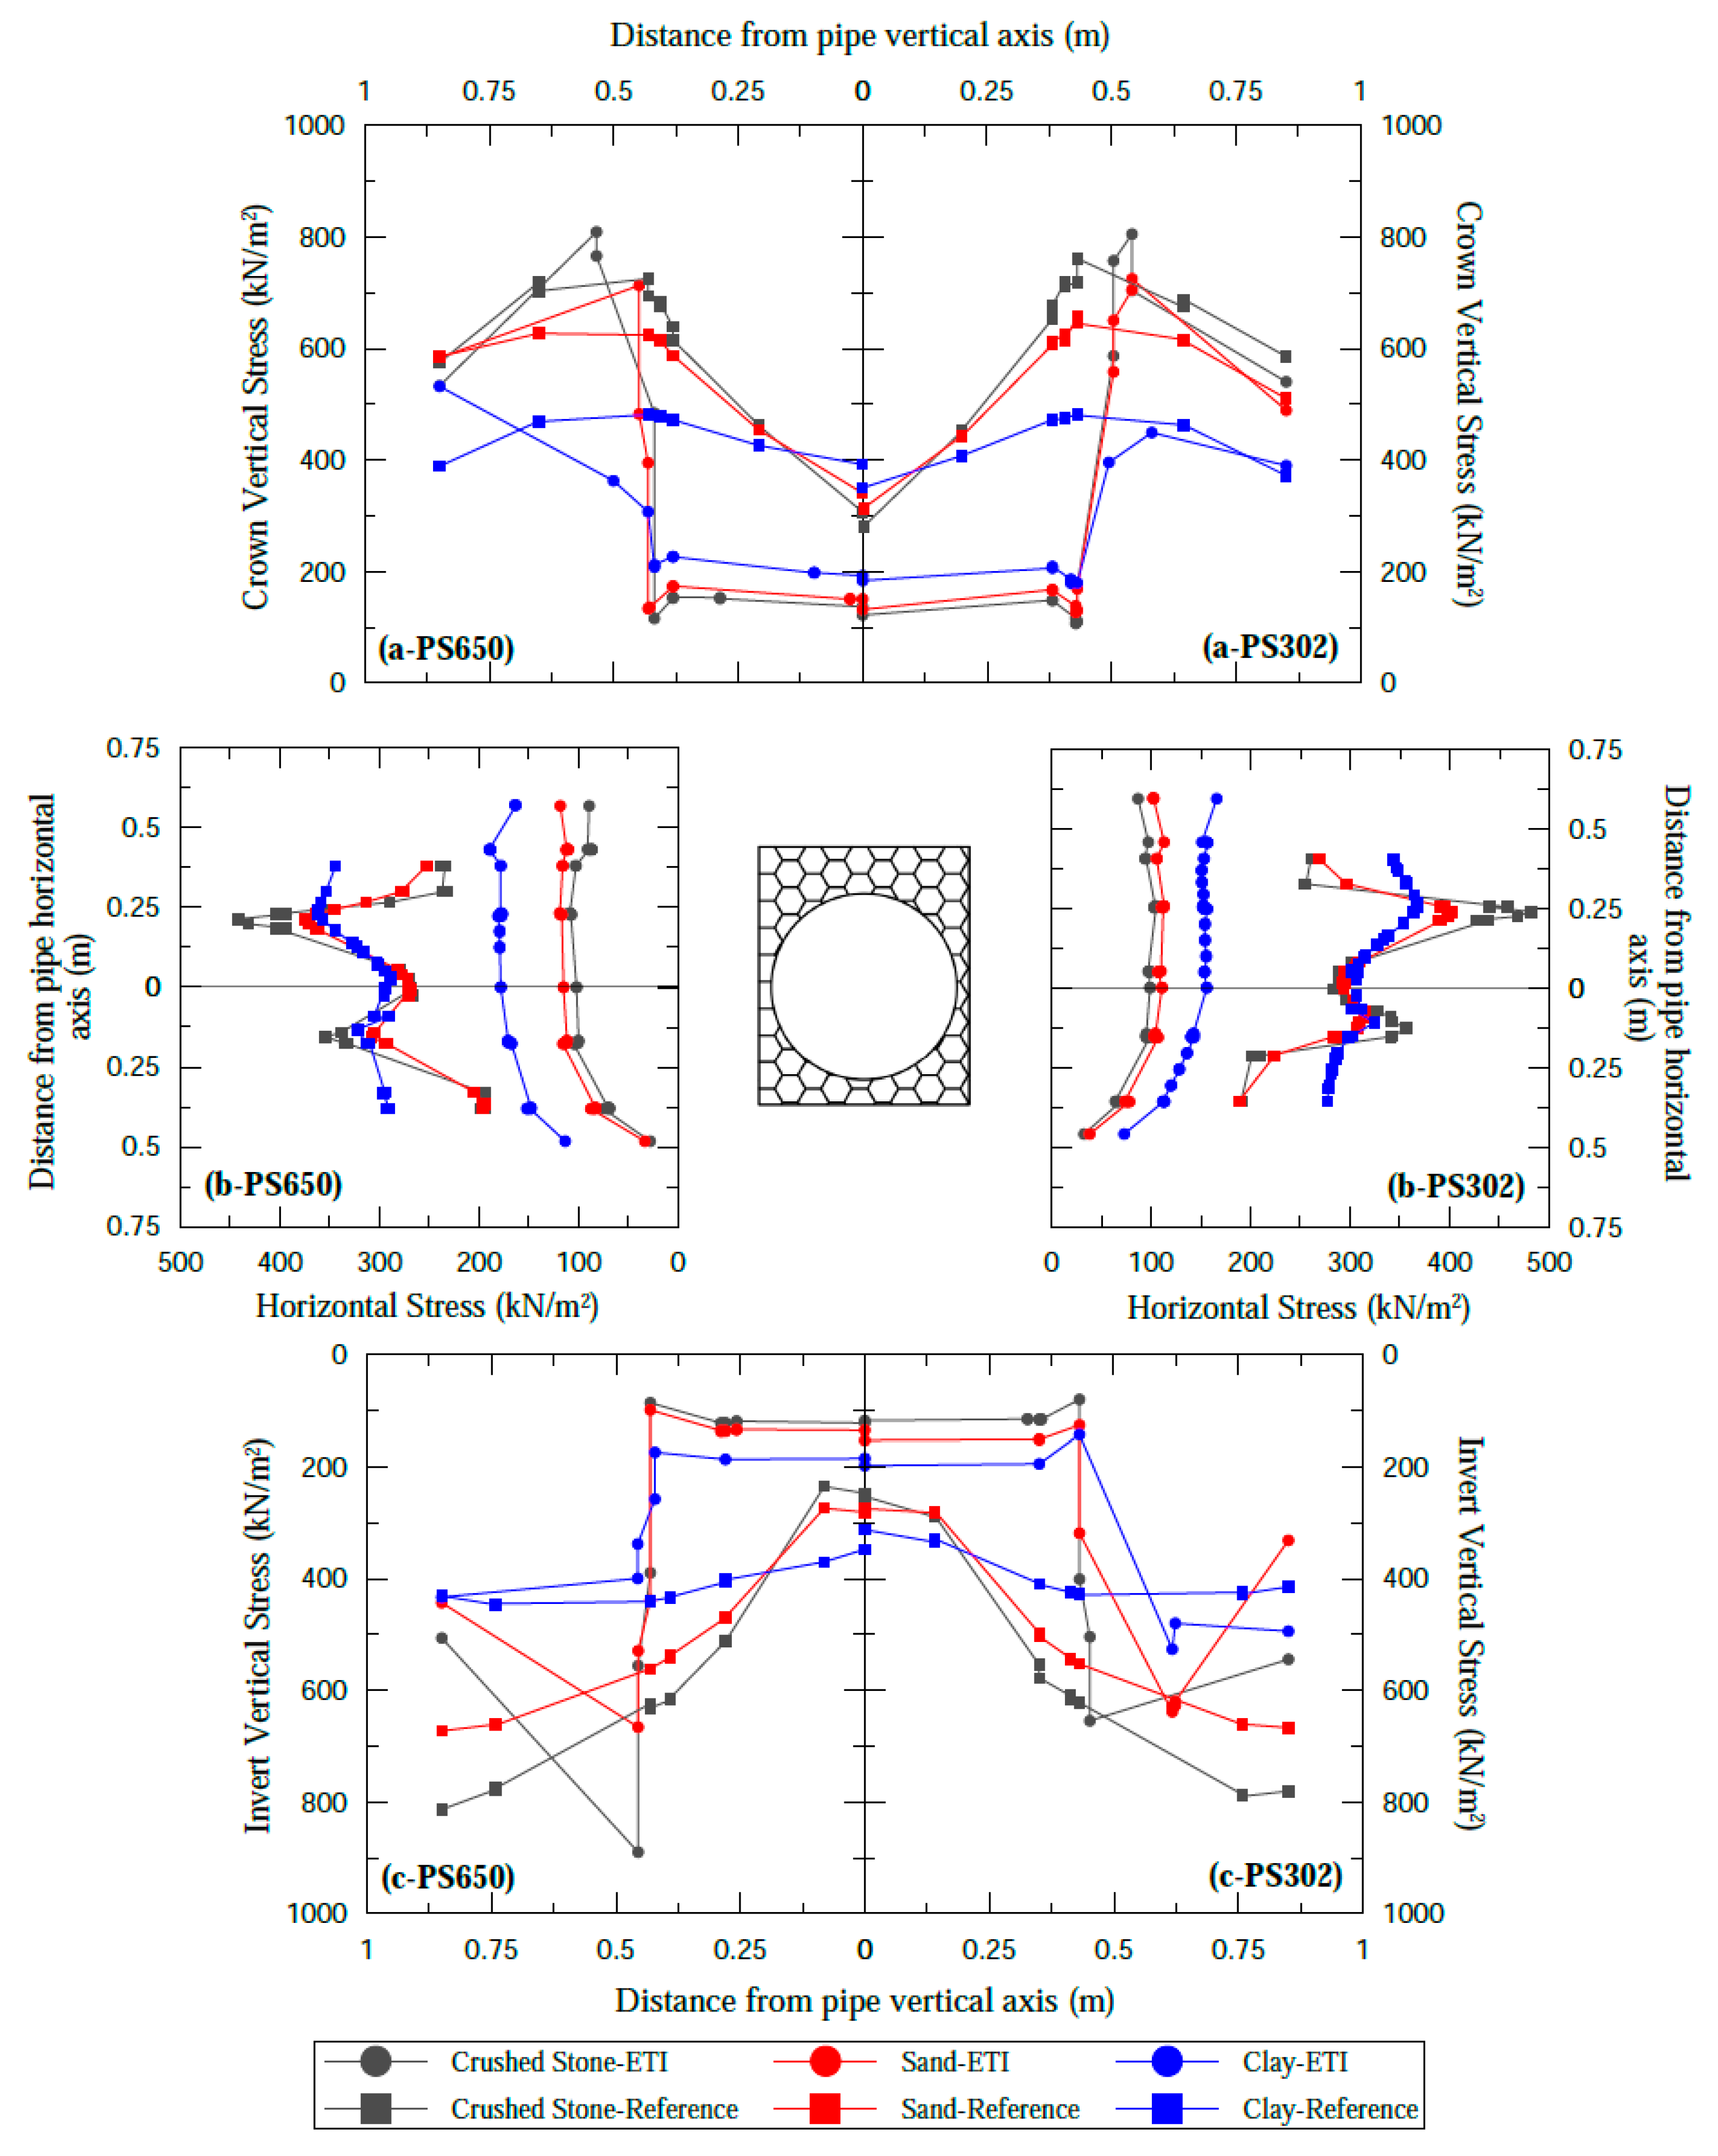
4.2. Pipe Stiffness Effect

The stiffness of the thermoplastic pipe is vital for the pipe to maintain its shape under the stresses caused by the embankment construction and for the performance of the pipe under stress. To examine the effect of the pipe stiffness on stresses, PVC pipes with stiffness values of 650 kN/m/m (type B pipe) and 302 kN/m/m (type A pipe) were used and are shown in Table 3.
The Type B pipe is called PS-650, and the type A pipe is called PS-302. One is roughly double the rigidity of the other. Figure 9 and Figure 10 show the changes in stresses around the pipe in the ITI and ETI model, respectively. The left side of the graphics shows PS-650, and the right side shows PS-302. Table 8 shows the calculated stress values on the pipe crown, invert, and spring line for the 30 m embankment.
In the analyses examining the pipe stiffness effect, the stresses acting on the crown and spring line in the reference pipe were 8 to 10% and 4 to 8% higher than in PS-650 and PS-302, respectively. Stresses determined at the pipe invert were very close to each other. With the EPS Geofoam, the stresses acting on the pipe decreased regardless of pipe stiffness. The stresses calculated in pipes with twice the stiffness between them were very close (Figure 9 and Figure 10 and Table 8). Similarly, ref. [54] stated that the stresses obtained using EPS Geofoam in HDPE pipes where one was eight times the stiffness of the other were at similar levels. It shows that a low-stiffness pipe can be used safely with EPS Geofoam. The type of backfill around the pipe also affects the stresses. As can be seen from Figure 9 and Figure 10, high stresses occurred in clay, sand, and crushed stone backfills, respectively. Uniform stress distributions in thermoplastic pipes have been obtained in experimental and numerical analyses examining the soil-EPS-pipe interaction [1,10,11,17,18,26].

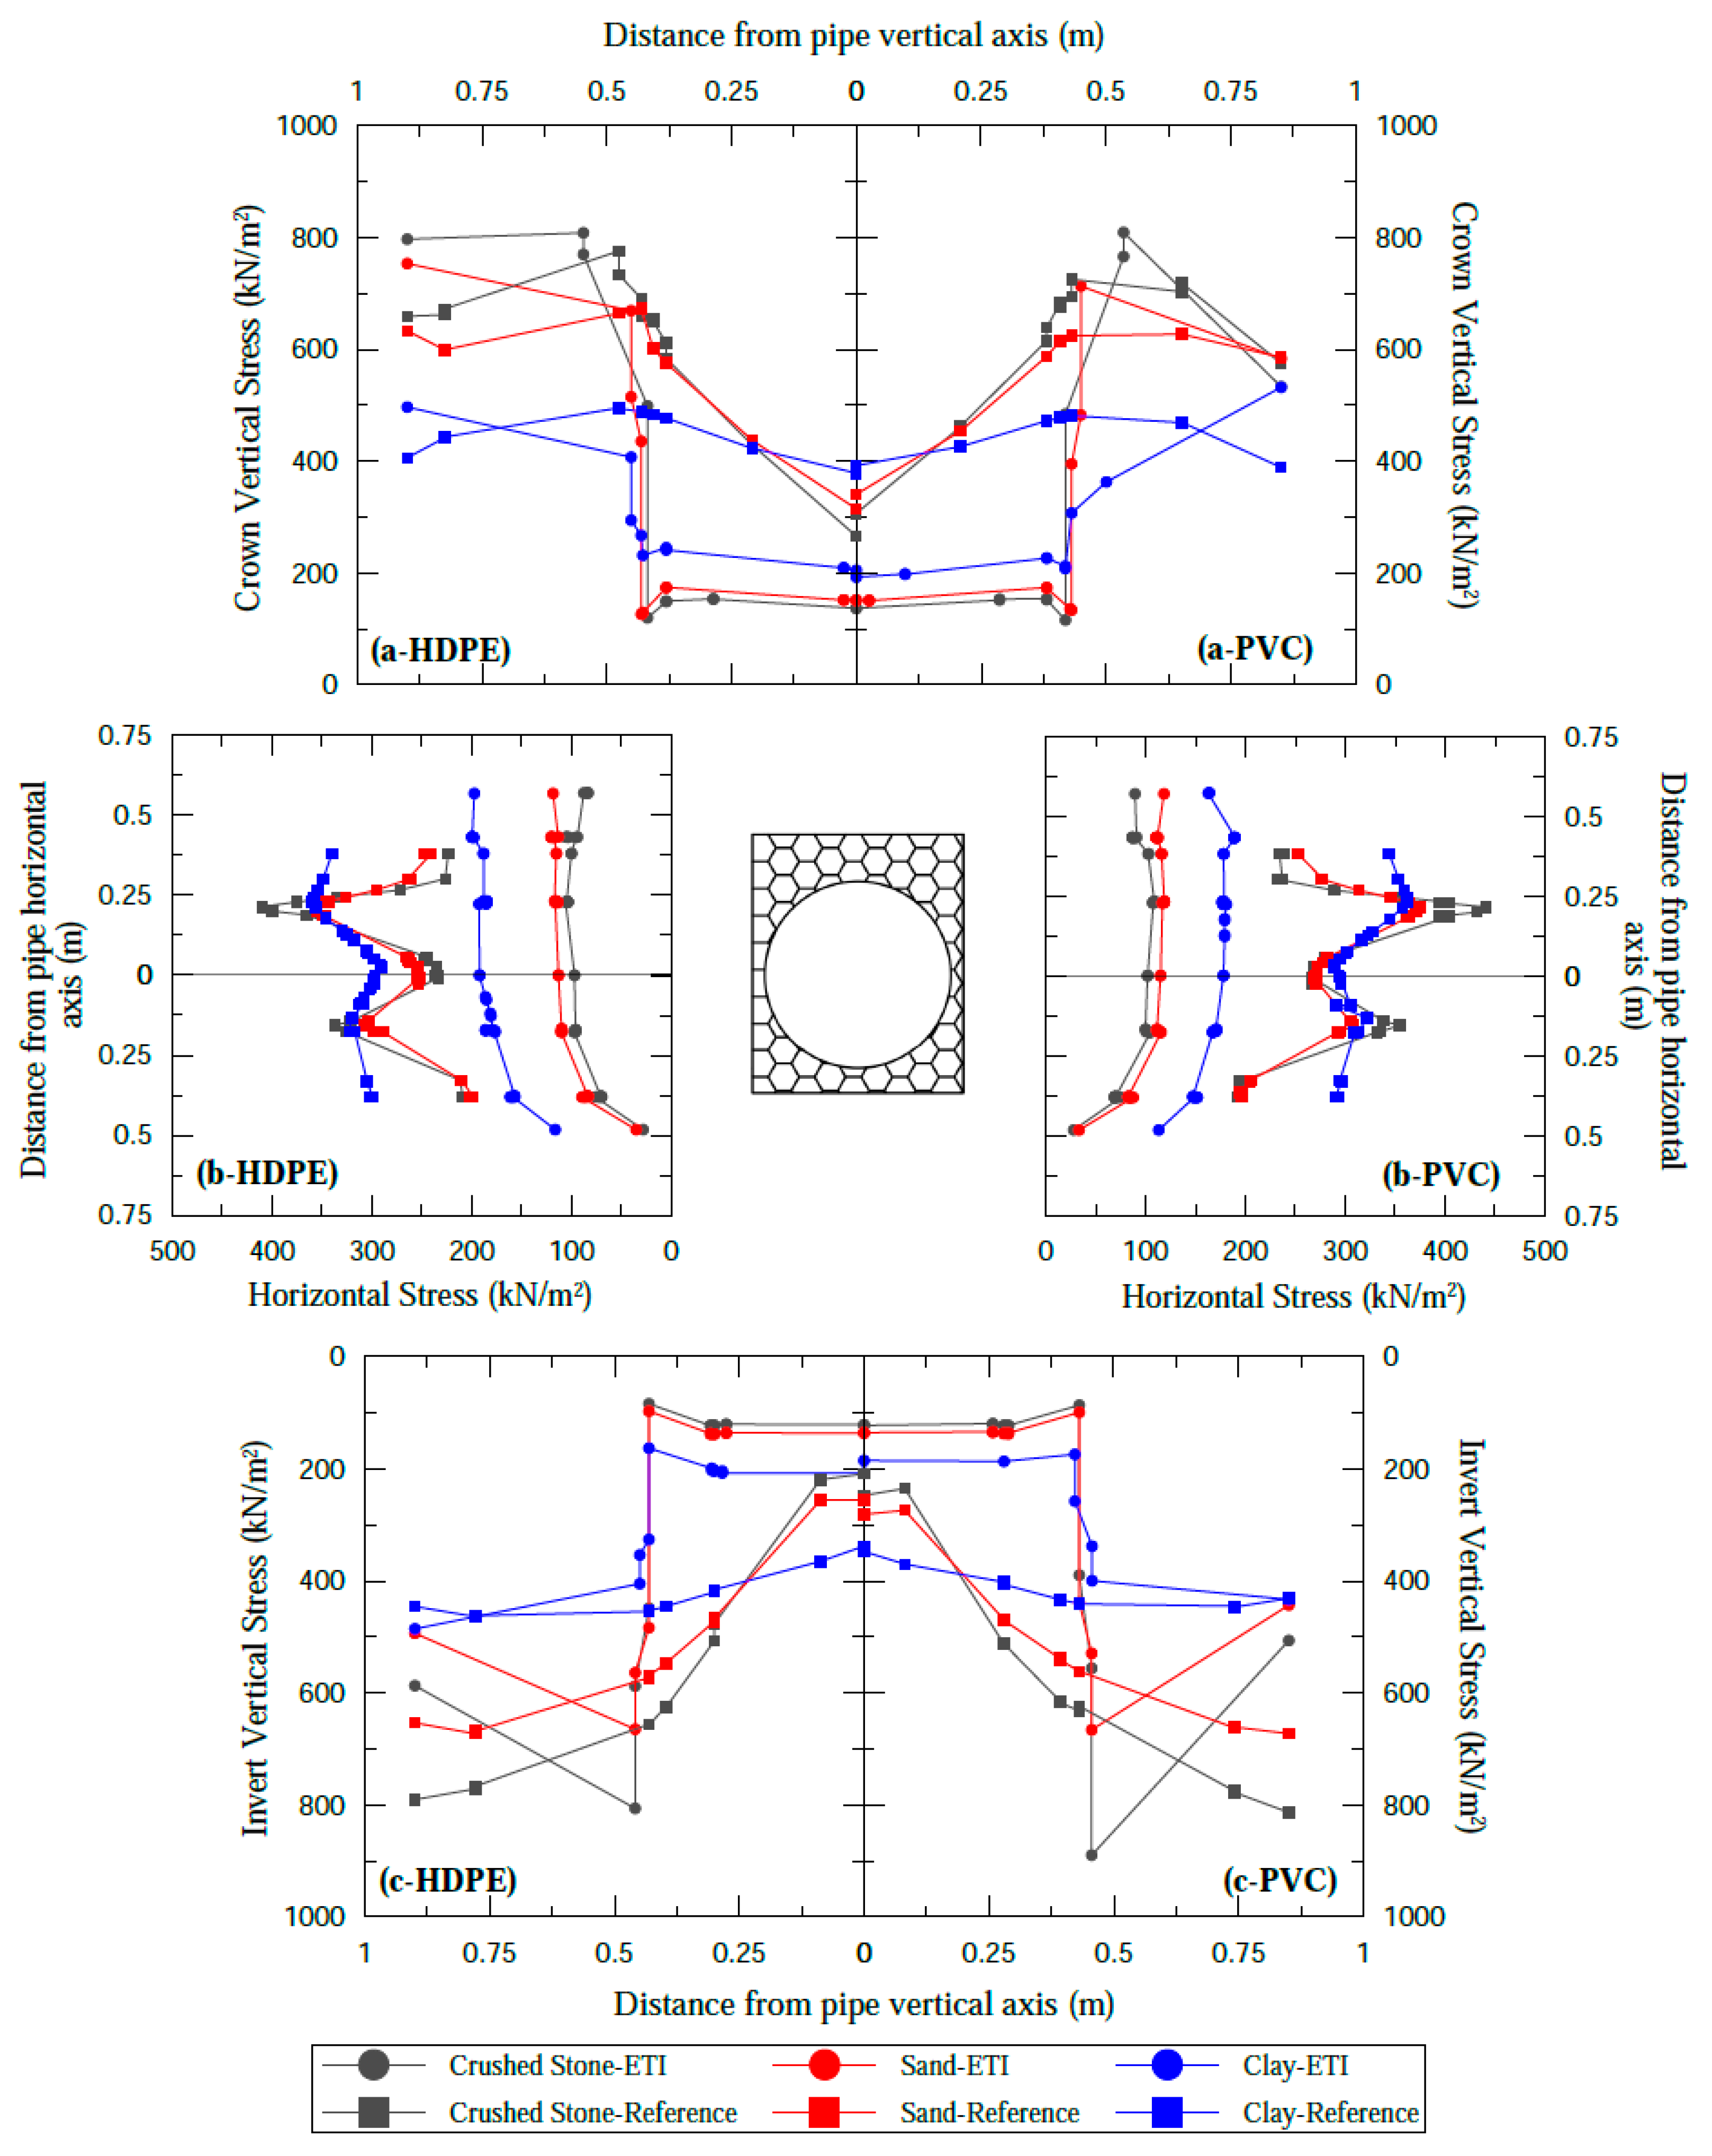
4.3. Pipe Material (HDPE–PVC) Effects

To examine the effects of HDPE and PVC material on stresses for 0.762 m diameter thermoplastic pipes, the analyses conducted on the C-type HDPE pipe and the B-type PVC pipe shown in Table 3 were compared. The stresses around the pipe are shown for the ITI model in Figure 11 and for the ETI model in Figure 12. The left side of the graphic shows the HDPE pipe, and the right side shows the PVC pipe. Table 9 presents the calculated stresses on the pipe crown, invert, and spring line for a 30 m embankment.
It can be seen from Figure 11 and Figure 12 that the stresses acting on the PVC pipe at the crown, spring line, and invert of the pipe are higher in the reference than in the HDPE pipe. Similar results were obtained in the study of [84], in which HDPE and PVC pipes were examined. When the stresses presented in Table 9 were considered, it was determined that there was a difference of 15 to 18% at the pipe crown, 7 to 10% at the pipe spring line, and about 3% at the invert level of the pipe in the ITI and ETI models, respectively. This is because the stiffness of the HDPE pipe is lower than the PVC pipe. The HDPE pipe deflects more, causing further development of positive arching. As a result, less stress affects the HDPE pipe.
In the ITI and ETI models, it was seen that the stresses acting on the crown of the HDPE and PVC pipe were very close to each other, depending on the backfill type (Table 9). The stresses affecting the different parts of the pipe are approximately similar. In the ITI and ETI models, the most significant difference between the stresses acting on both pipes was around 10%. Thus, if EPS is used with a pipe with lower rigidity, it shows the expected performance of a rigid pipe. Especially in the ETI model, approximately uniform stress distribution around the pipe (crown, spring line, and invert) was obtained using EPS.
Numerical analyses were conducted for the thermoplastic pipe buried using EPS in the ITI and ETI models by considering the diameter, stiffness, and material type (HDPE and PVC). In the analysis, the effects of the backfill material (crushed stone, sand, and clay) on the stresses around the pipe were determined (Figure 7, Figure 8, Figure 9, Figure 10, Figure 11 and Figure 12). As can be seen, the lowest stress affecting the pipes due to diameter, stiffness, and thermoplastic material type (HDPE and PVC) effects were calculated for crushed stone, sand, and clay backfills, respectively. As expected, the highest stress values occurred in the clay backfill. It has been stated in many studies investigating the effects of backfill material stiffness that this changes the pipe behavior [1,10,26,36,49]. It is known that loads acting on thermoplastic pipes are a function of soil–structure interaction and depend on the relative stiffness of the soil. Under soil load, vertical deflection occurs in the pipe. Thus, passive stress support develops on the pipe sides, and the circular deformation tendency of the pipe leads to positive arching on the pipe, which decreases the soil load on the pipe. Therefore, as the modulus of elasticity of the backfill material increased, the pipe deflected more in the vertical direction and expanded less in the lateral direction. As a result, smaller horizontal stresses occur, and arching factors decrease as backfill stiffness increases.
Using EPS Geofoam in the ETI model around the pipe, there was a decrease in the stresses relative to the reference depending on the type of backfill material. For crushed stone, sand, and clay backfills, this reduction was approximately 65%, 60%, and 50%, respectively.
When the variation of the vertical stresses in Figure 7, Figure 8, Figure 9, Figure 10, Figure 11 and Figure 12 is examined, it is seen that there is a decrease in the vertical stress along with the EPS but a rapid increase in the vertical stress occurring from the endpoint of the EPS. This is because with the positive arcing caused by the compression of the EPS on the pipe, the stresses are transferred to the adjacent soil prism, and the stresses are concentrated in this region. In the absence of EPS (in the reference and ITI model), a non-uniform stress distribution occurs acting on the pipe spring line. However, approximately uniform stress distribution around the pipe was obtained when the pipe spring line was covered with EPS (ETI model).

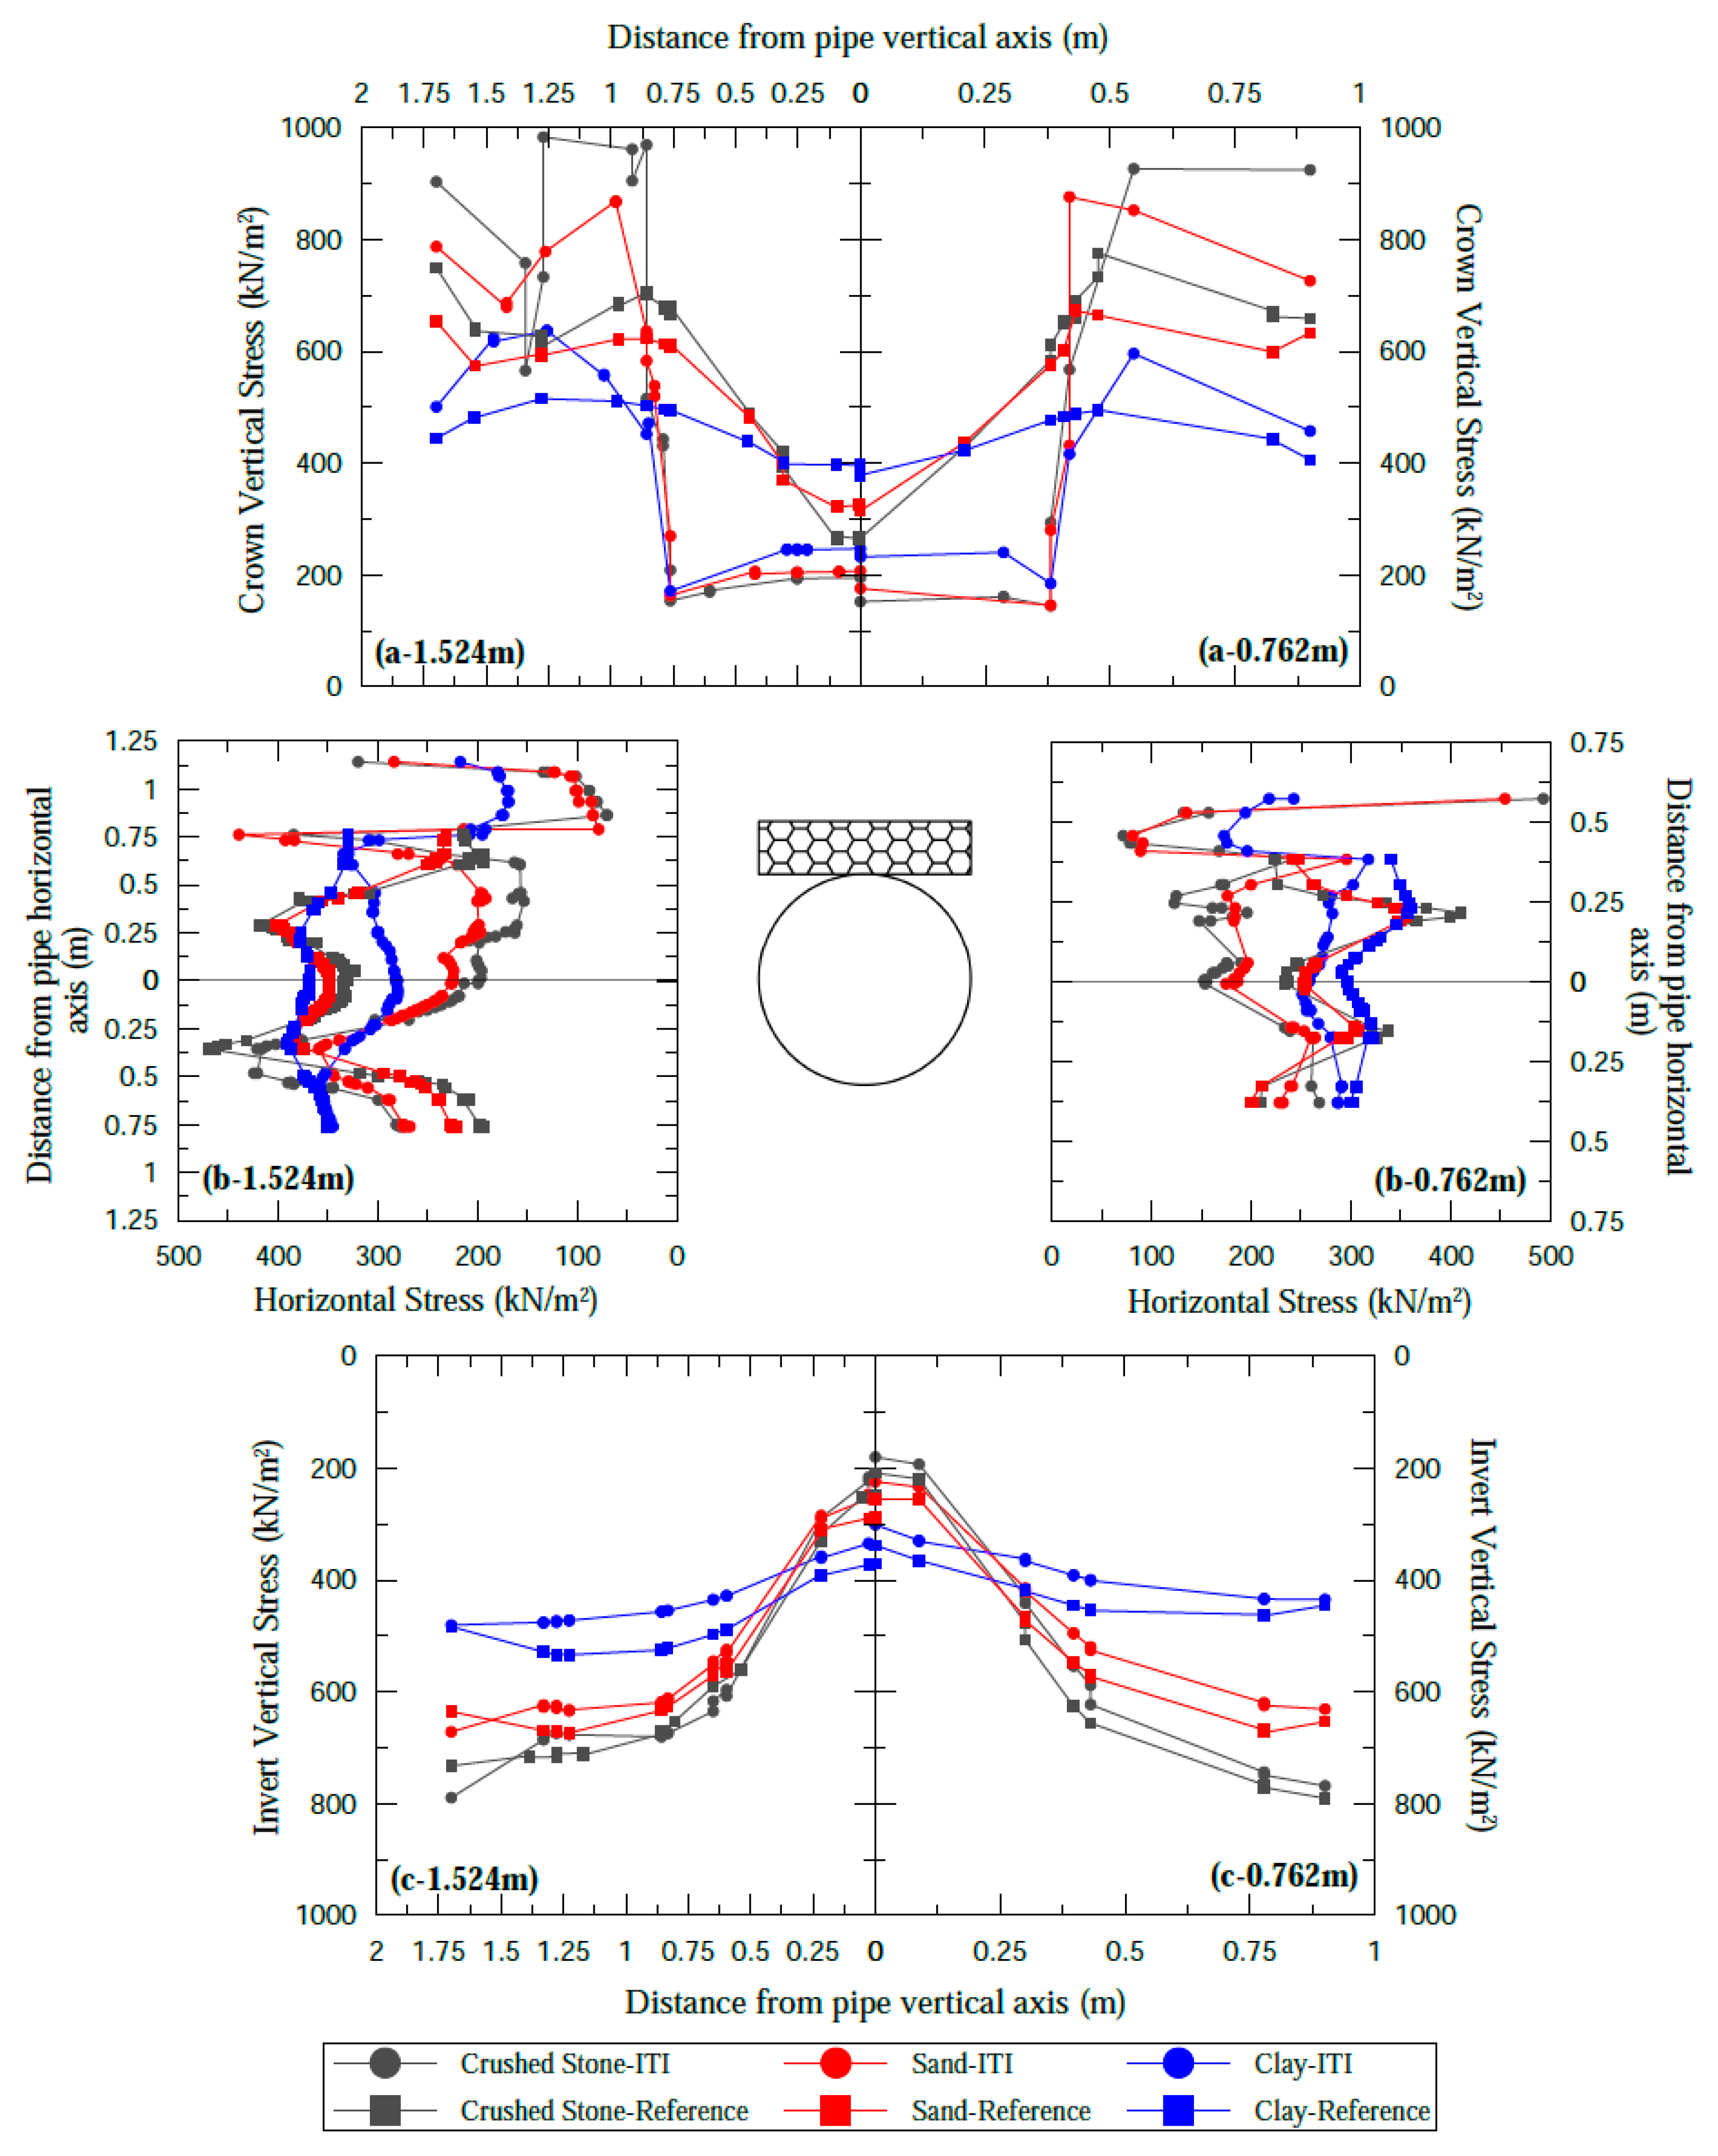
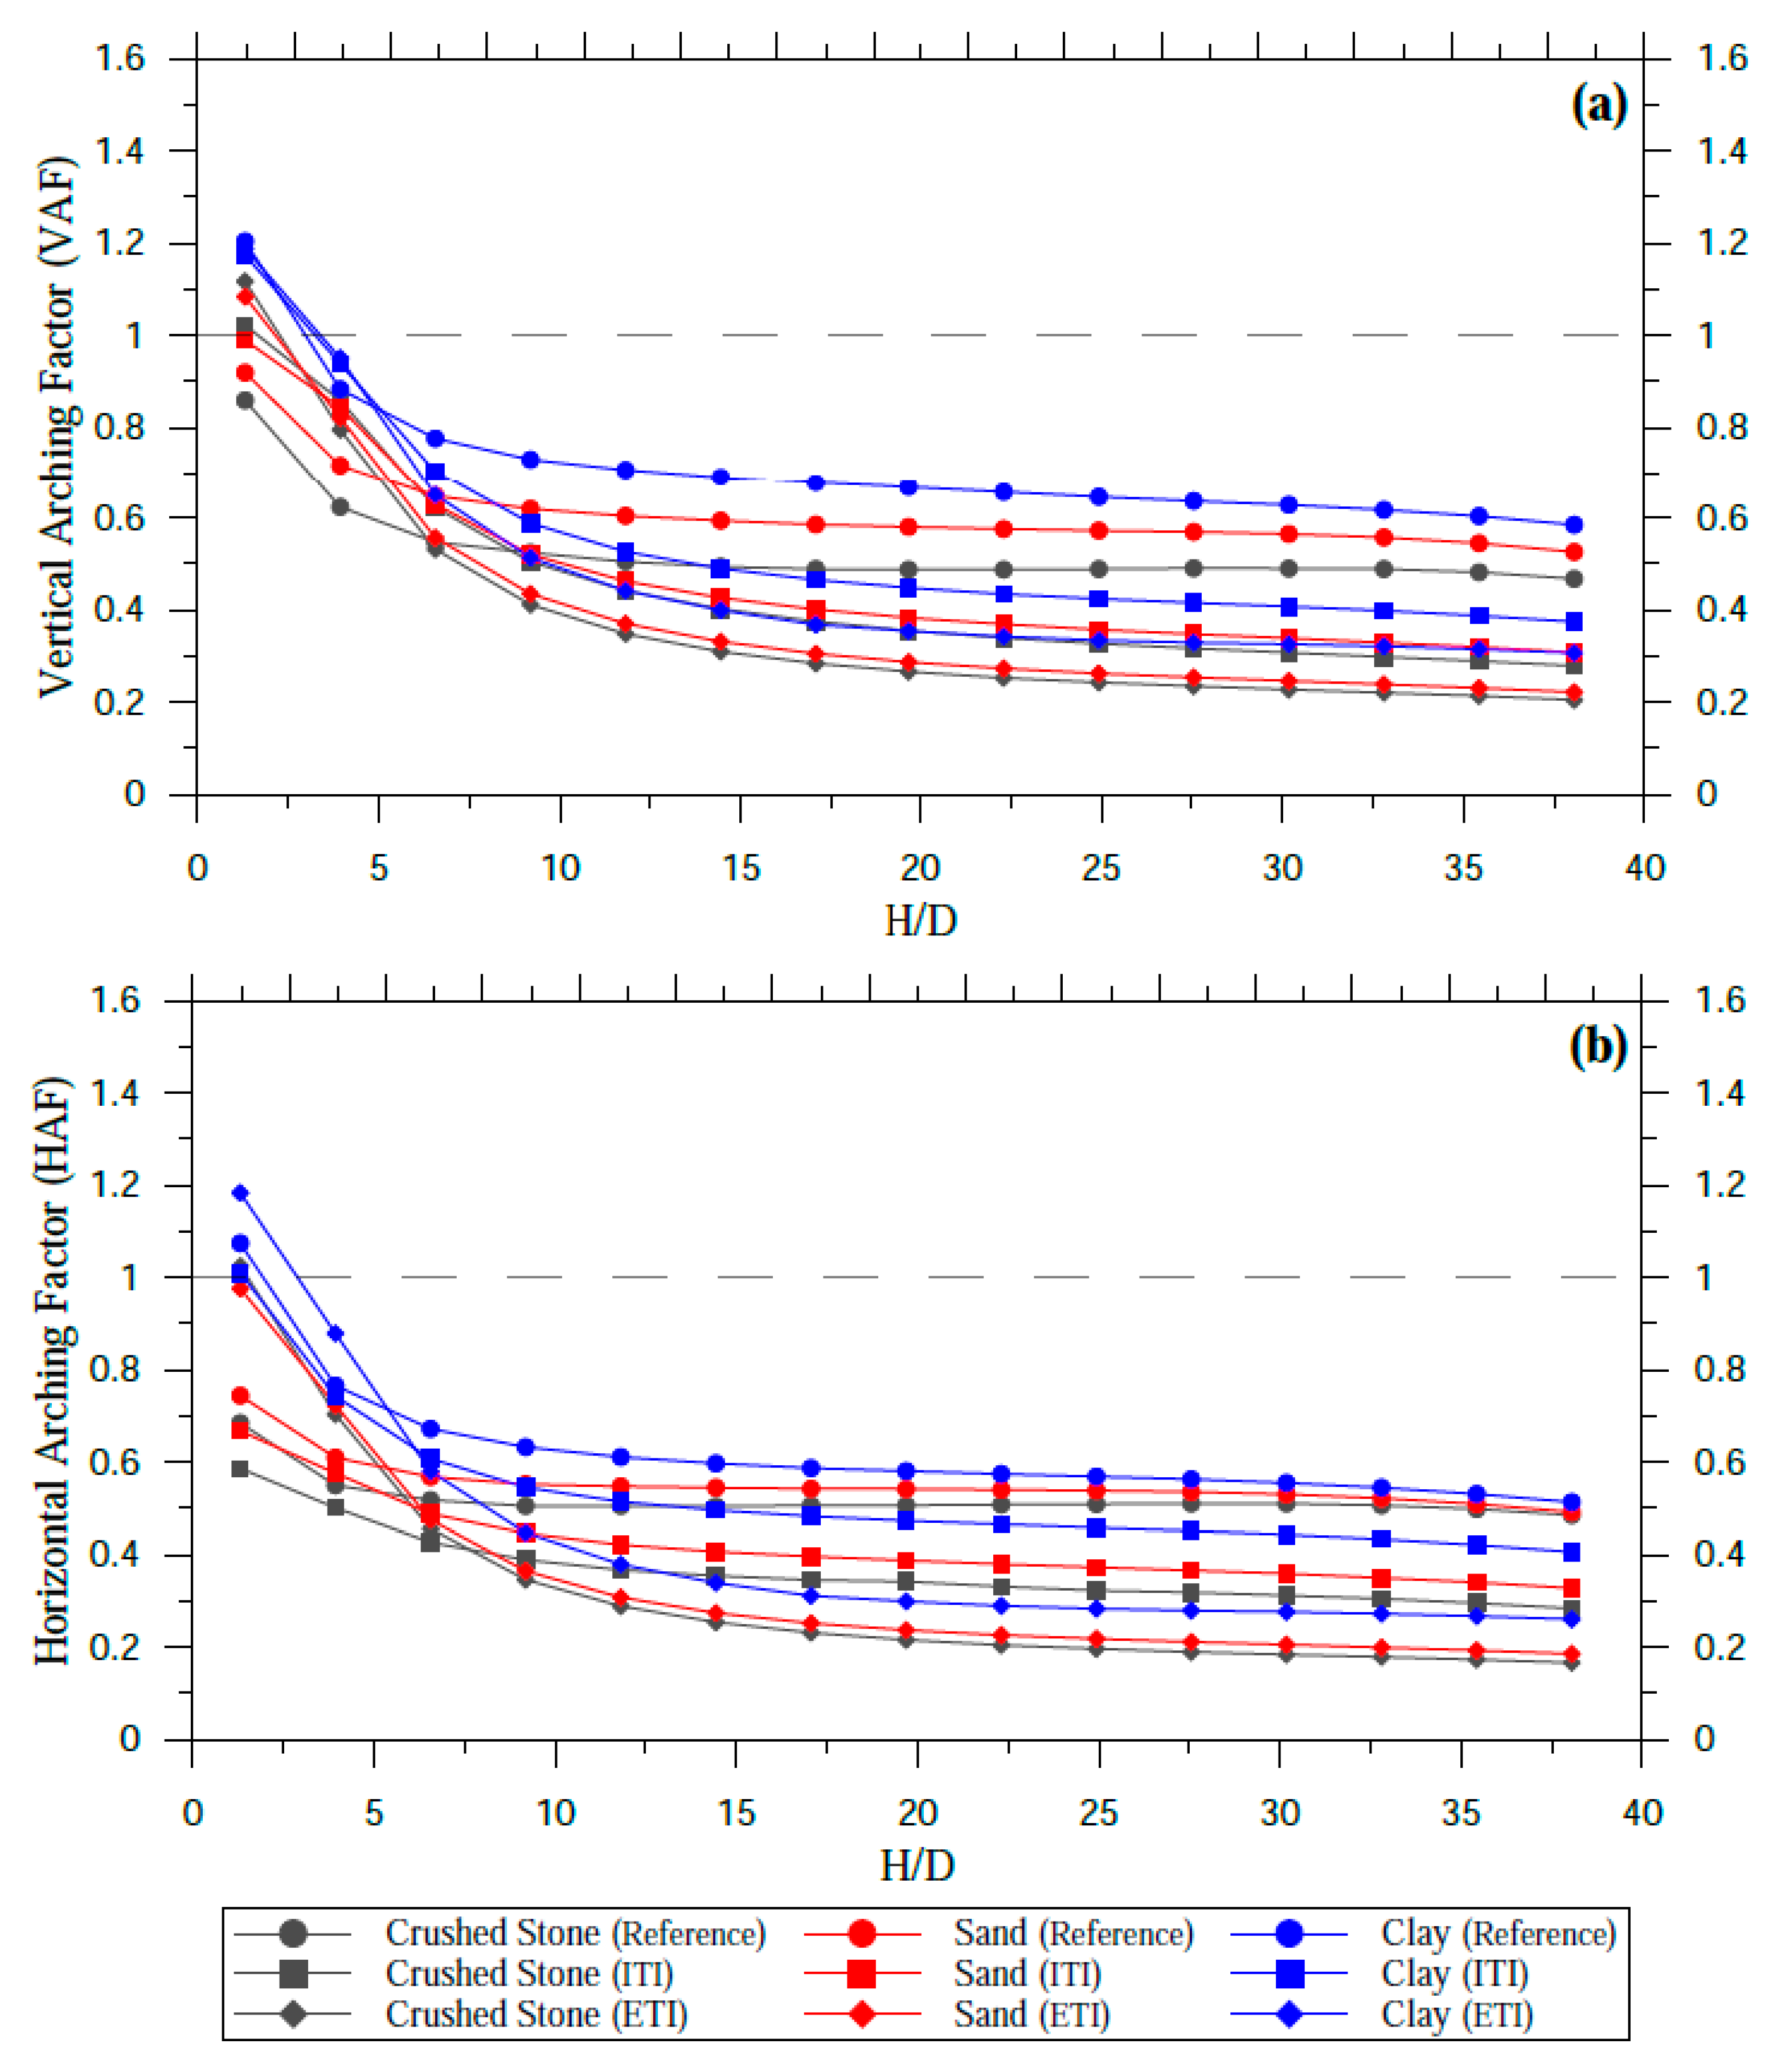
4.4. Horizontal and Vertical Arching

Horizontal and vertical arching factors are generally used to calculate soil stresses on buried pipes. These factors determine the stresses acting on the pipe due to the pipe–soil interaction. While the arching factors used for rigid pipes are the ratio of the total earth pressure to the prism load, they are calculated with different parameters in thermoplastic pipes. The reason for this is that deformations occurring in thermoplastic pipes significantly affect the stresses in the soil. The equations proposed by [85] and presented in Equations (2) and (3) were used in calculating these factors. Therefore, it was essential to determine the arching factors to predict the stresses in the soil. In these equations, the arching factors of a buried pipe under load are calculated by considering the ring stiffness. Elastic solutions were made by [71] to perform these calculations, and equations were developed.
Through the numerical analysis made within the scope of this article, horizontal and vertical stresses occurring around the pipe are known. Thus, the values for the vertical arching factor (VAF) and horizontal arching factor (HAF) were determined as the ratio of backfill load to prism load. The equations used in these calculations are given below:
VAF   = W e P L = 2 N s p P L  
HAF   = W h P L = N c + N i P L  
The expressions in the equations above are as follows:
We = total vertical load, Wh = total horizontal load, PL = Prism load, Nsp = soil stress on the pipe in the horizontal axis, Nc = total soil stress on the pipe crown, and Ni = total soil stress at the bottom of the pipe.
Figure 13 and Figure 14 show VAF and HAF ratios depending on embankment height (H/D ratio) for 0.762 m PVC and 1.524 m diameter HDPE pipes, respectively. While VAF and HAF were high in the reference—the situation where EPS was not used—arching values decreased in the ITI and ETI model using EPS. The highest VAF and HAF value in clay backfill was calculated in both models and compared to the others.
In Figure 13, for the models using EPS with 0.762 m diameter PVC pipe, VAF values were very close to crushed stone and sand backfills. In the ITI and ETI models, VAF decreased to 0.3 and 0.2, respectively, and to 0.4 and 0.34 in clay backfill. HAF decreased to 0.3 and 0.25 in the ITI and ETI model for crushed stone and sand backfills and to 0.36 and 0.30 in clay backfill, respectively. In Figure 14, the VAF values for crushed stone and sand backfills were very close to each other in the 1.524 m diameter HDPE pipe. In the ITI and ETI models, VAF decreased to 0.3 and 0.25, respectively, and to 0.4 and 0.34 for clay backfill. HAF decreased to 0.3 and 0.25 in the ITI and ETI models for crushed stone and sand backfills and to 0.45 and 0.36 in clay backfills, respectively. As the H/D ratio increased, the VAF and HAF values decreased, so as the embankment height increased, the vertical and horizontal stresses acting on the pipe decreased. VAF and HAF curves are similar regardless of backfill type and start from high values decreasing with the increase in the H/D ratio and becoming relatively horizontal. The largest pipe diameter considered in the numerical analysis was 1.524 m. The VAF and HAF values for large-diameter pipes are higher than for small-diameter pipes. According to the analysis results, the highest and lowest VAF and HAF values were obtained for clay and crushed stone backfill, respectively. With the increase in the H/D ratio in the ETI model, VAF and HAF values are the lowest for all three backfill types.

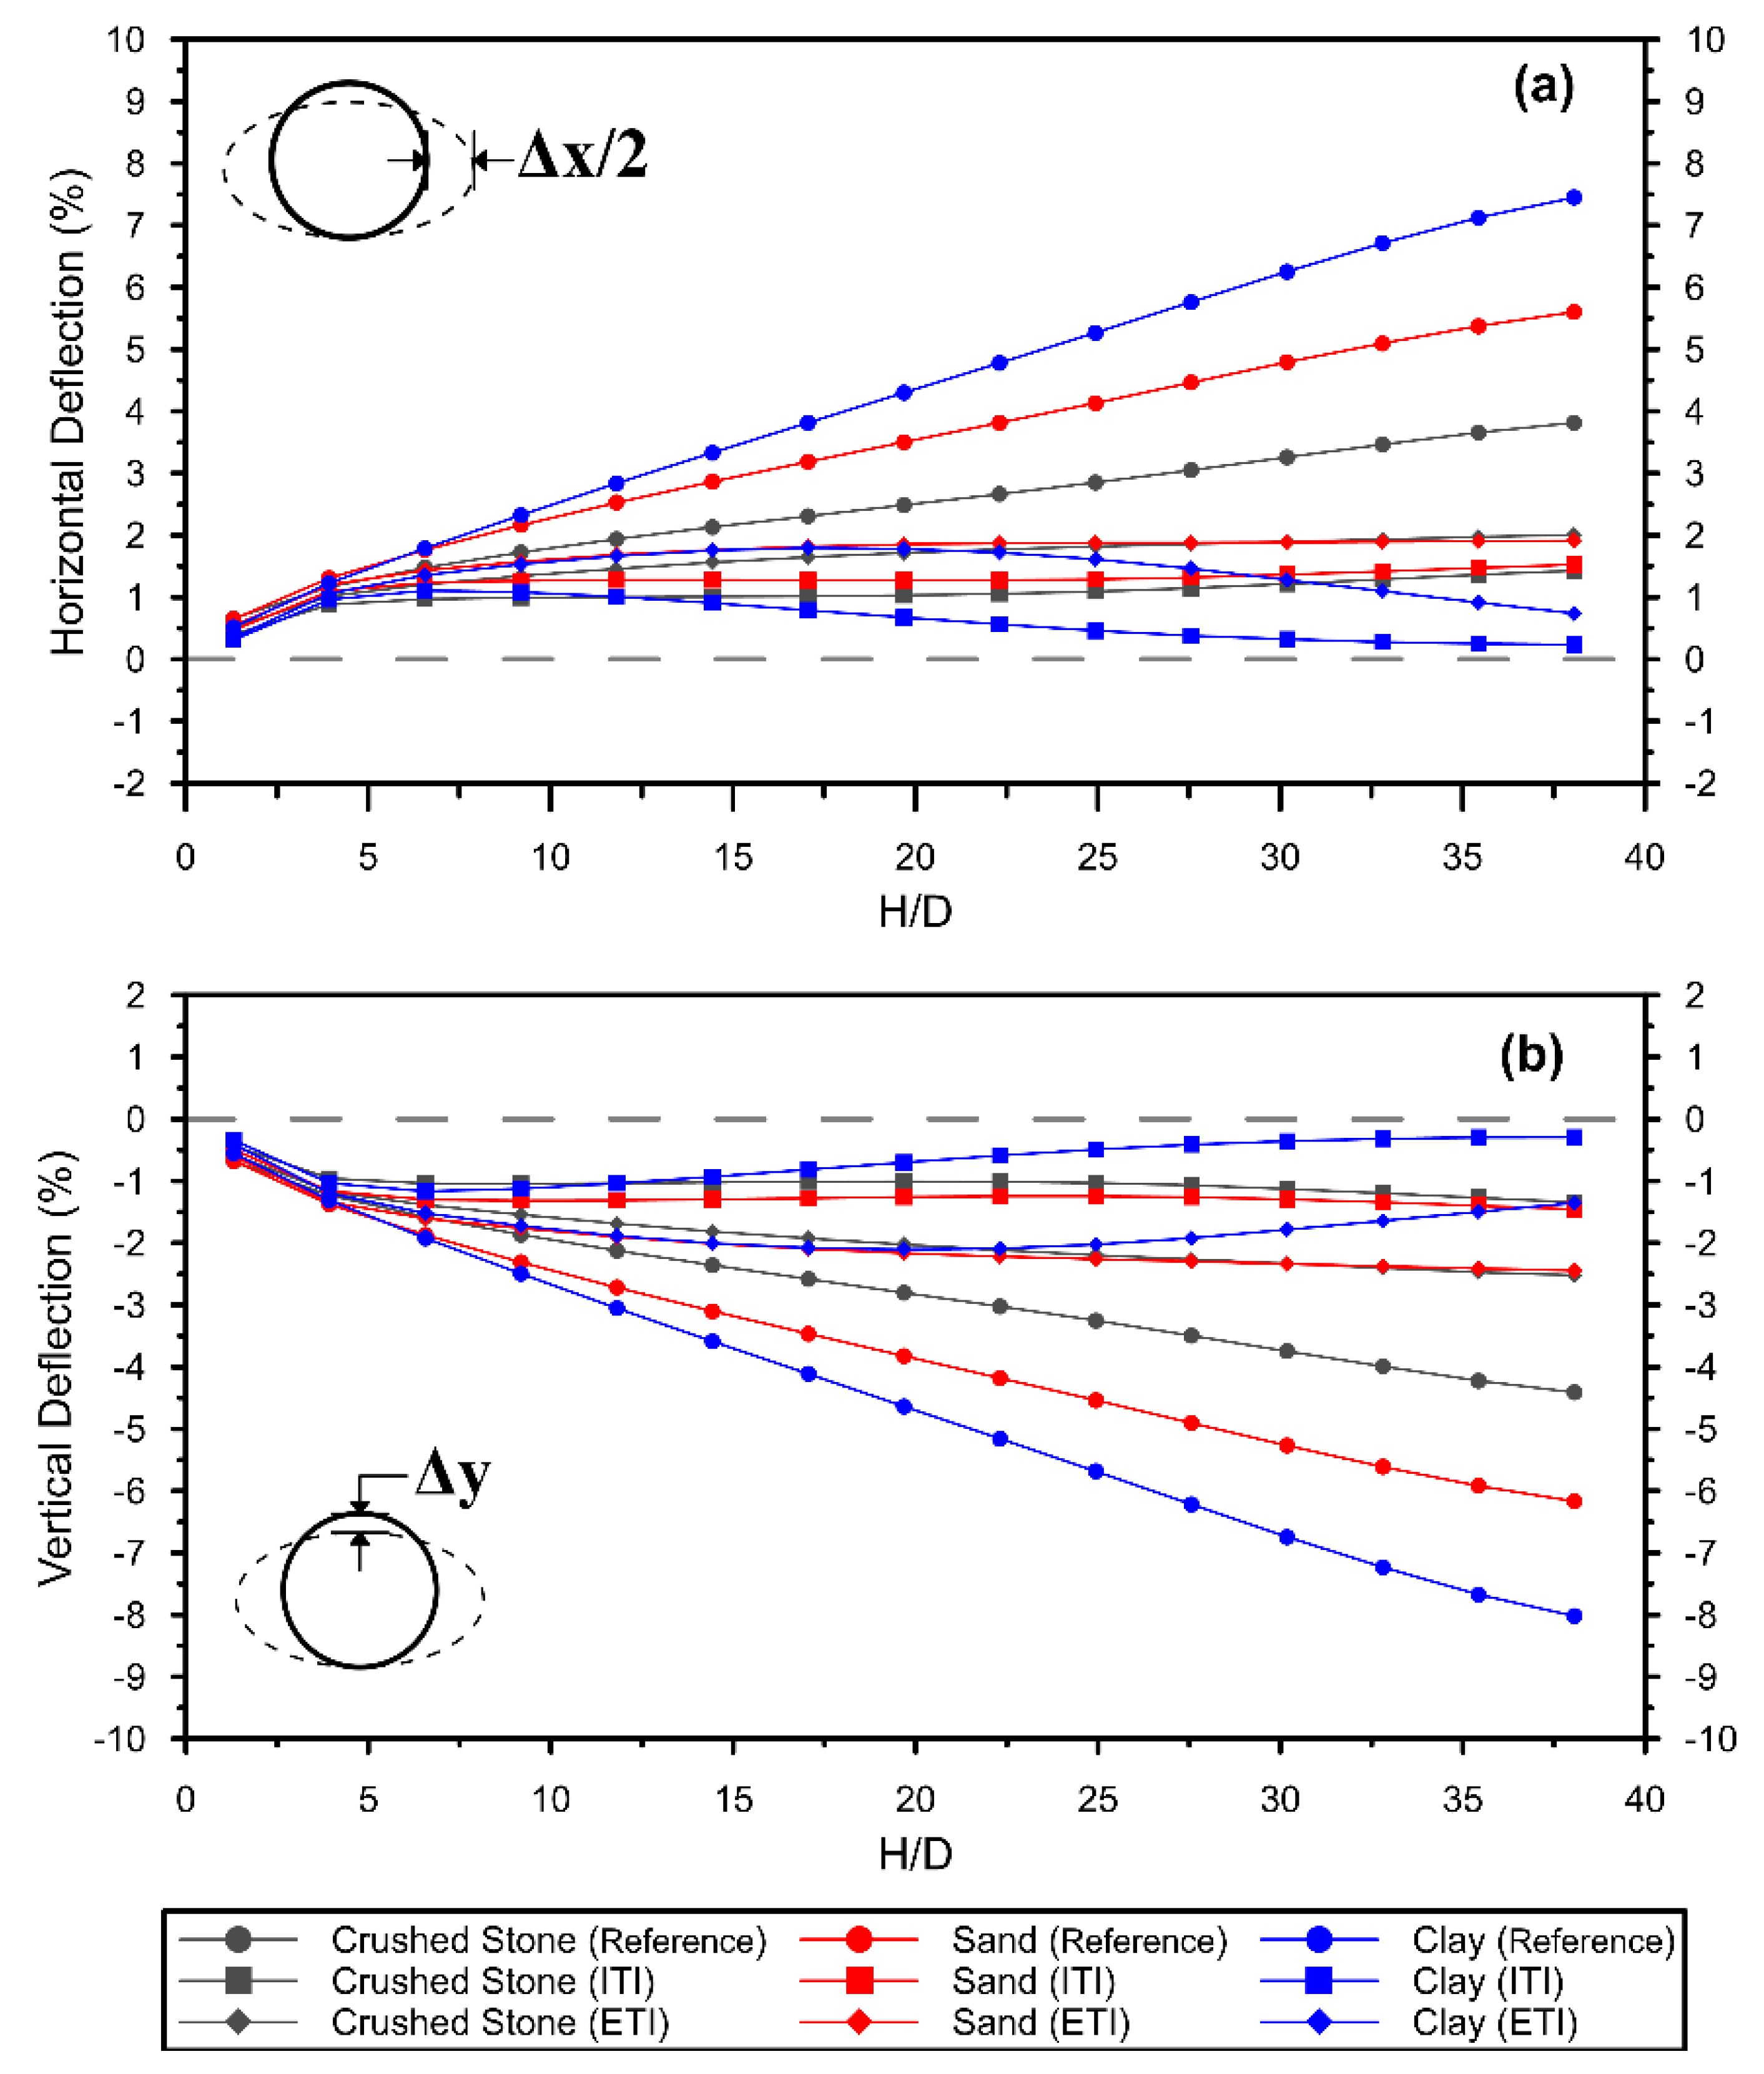
4.5. Vertical and Horizontal Deflections

In Figure 15 and Figure 16, vertical and horizontal deflections are presented for 0.762 m diameter PVC and 1.524 m diameter HDPE pipes, respectively. In the reference, the highest deflection was obtained with clay, sand, and crushed stone backfill, respectively. In Figure 15, the lowest deflections were obtained with the 0.762 m diameter PVC pipe in the ITI model compared to the reference. Horizontal deflection decreased from 3.9 to 1.4%, from 5.7 to 1.5%, and from 7.5 to 0.2%, respectively, for crushed stone, sand, and clay backfills. The vertical deflections decreased from −4.5 to −1.4%, from −6.2 to −1.5%, and from −8.1 to −0.3%. The deflections obtained in the ETI model were greater than in the ITI model. In Figure 16, the lowest deflections were obtained with the 1.524 m diameter HDPE pipe with the ITI model compared to the reference. Horizontal deflections decreased from 2.62 to 0.70%, from 4.40 to 0.92%, and from 6.85 to 1.00%, respectively, for crushed stone, sand, and clay backfills. The vertical deflection values decreased from −4.77 to −1.7%, from −6.7 to −1.88%, and from −9.32 to −0.25%. The deflections obtained in the ETI model were greater than in the ITI model.
As shown in Figure 15 and Figure 16, vertical and horizontal deflections due to the increase in embankment height are considerably higher in the reference than in the ITI and ETI models. When the thermoplastic pipe is buried according to the ETI model, active soil wedges at the sides of the pipe are induced, leading to a significant reduction in horizontal stresses that act on the pipe spring line. Contrary to the stresses, horizontal and vertical deflections in clay backfill are smaller than in crushed stone and sand backfill. This is because the EPS Geofoam material on the sidewall of the pipe is more compressed in the clay than in the sand and crushed stone (the greater horizontal stress has been transferred onto the clay backfill). As a result of this interaction, the pipe showed peaking behavior. Reduction in horizontal stress in the pipe spring line is controlled by compression of the EPS zone that covers the side of the pipe.
Various institutions and standards or codes have presented recommendations for the deflection limit of thermoplastic pipes. The German Code recommends the limiting value for pipe deflection to be 6% [86], AASHTO to be 6.15% [87], and both CCPA and PPI recommend it to be 7.5% [88,89]. It is seen that the deflections in the ITI and ETI models, corresponding to the reference model stress for a 30-m-high embankment, were much smaller than the allowable design limits (Figure 15 and Figure 16).
Fang et al. [17] conducted field experiments to examine the effect of the degree of compaction of the backfill material on the mechanical behavior of HDPE pipes. As a result of the experiments, they stated that the backfill density in the haunch region of the pipe has the most significant effect on the deflections of the pipe. In HDPE pipes in a well-compacted fill, the most critical area of the outer pipe wall is the spring line. In loose soil placement around the pipe, deformations are concentrated in the crown or invert regions. They emphasized that the pipe’s response to loose backfill is related to the size of the loose-backfill region and the region’s location and that the area of the loose-backfill region is more critical than the size.
According to experimental and numerical analyses conducted to examine the mechanical behavior of HDPE pipes under different loading conditions by [18], pipe properties (diameter, stiffness, etc.) affected the response of the pipe to the backfill material. It has been stated that with the increase in the burial depth of the pipe, the pipe deflections increased, and the decrease in the rigidity of the soil around the pipe caused large deflections in it. In addition, it was emphasized that the deflections that occur in a particular region of the pipe will not be limited only to that region but will also affect other parts of the pipe. Creating a uniform stress distribution around large-diameter thermoplastic pipes buried with ETI under high fill stresses will also contribute to maintaining the overall stability of the pipe.

4.6. Effect of Using EPS Together with Thermoplastic Pipe

The stress values determined around the reference pipe were less than the 30 m fill stress (30 × 20 = 600 kPa) with a unit volume weight of 20 kN/m3. This shows that some positive arching develops due to the vertical deflection of the thermoplastic pipe under the applied stress. However, when EPS Geofoam is used in the ITI and ETI models, the stresses determined at the pipe crown are smaller than the reference. It can be said that the use of EPS Geofoam material together with the pipe increases positive soil arching regardless of pipe deflection and has a positive effect on pipe behavior.
The uniform placement of the backfill material around the pipe affects the local and general stability of the pipe. While using mechanical tools to place and compact the backfill, care was taken not to damage the pipes. The backfilling process was controlled to prevent excessive and asymmetrical deformation. Non-uniform stresses around the pipe can cause non-uniform deformation, local bending, and damage by exceeding the performance limits. Brachman et al. [1] emphasized that pipe deflection and strain vary according to the type of backfill material and the compaction equipment’s efficiency, especially the uniform placement of the backfill around the pipe. Buried pipe with EPS Geofoam in the ETI model will not require very controlled backfill placement, and more uniform stress distribution will be created around the pipe than in the ITI model.
According to Ma et al. [31], the flexible pipe at the low embankment thickness will deform elastically and form the soil arching itself without the necessity of any soft inclusions. However, under high embankment fills, the use of EPS at the top of thermoplastic pipes can help with load reduction and safe design.
In Santos et al. [43], it is stated that the ITI method provides a better reduction in stress and deflection around the corrugated steel pipe crown, while the ETI method provides a better reduction in soil stress around the pipe spring line.

5. Conclusions

In this study, induced trench installation (ITI) and embedded trench installation (ETI) models for large-diameter thermoplastic pipes subjected to high fill stresses were investigated by numerical analysis. The study evaluated the effects of crushed stone, sand, and clay backfill on the stresses and pipe deflections by considering the pipe diameter, rigidity, and thermoplastic material type (HDPE and PVC). The responses of such a system (i.e., pipe–EPS–backfill soil system) are controlled not only by pipe–EPS geometry and soil characteristics but also by the stiffness of the EPS material. However, in this study, EPS stiffness was not considered. As a result of the analyses, the following results were obtained:
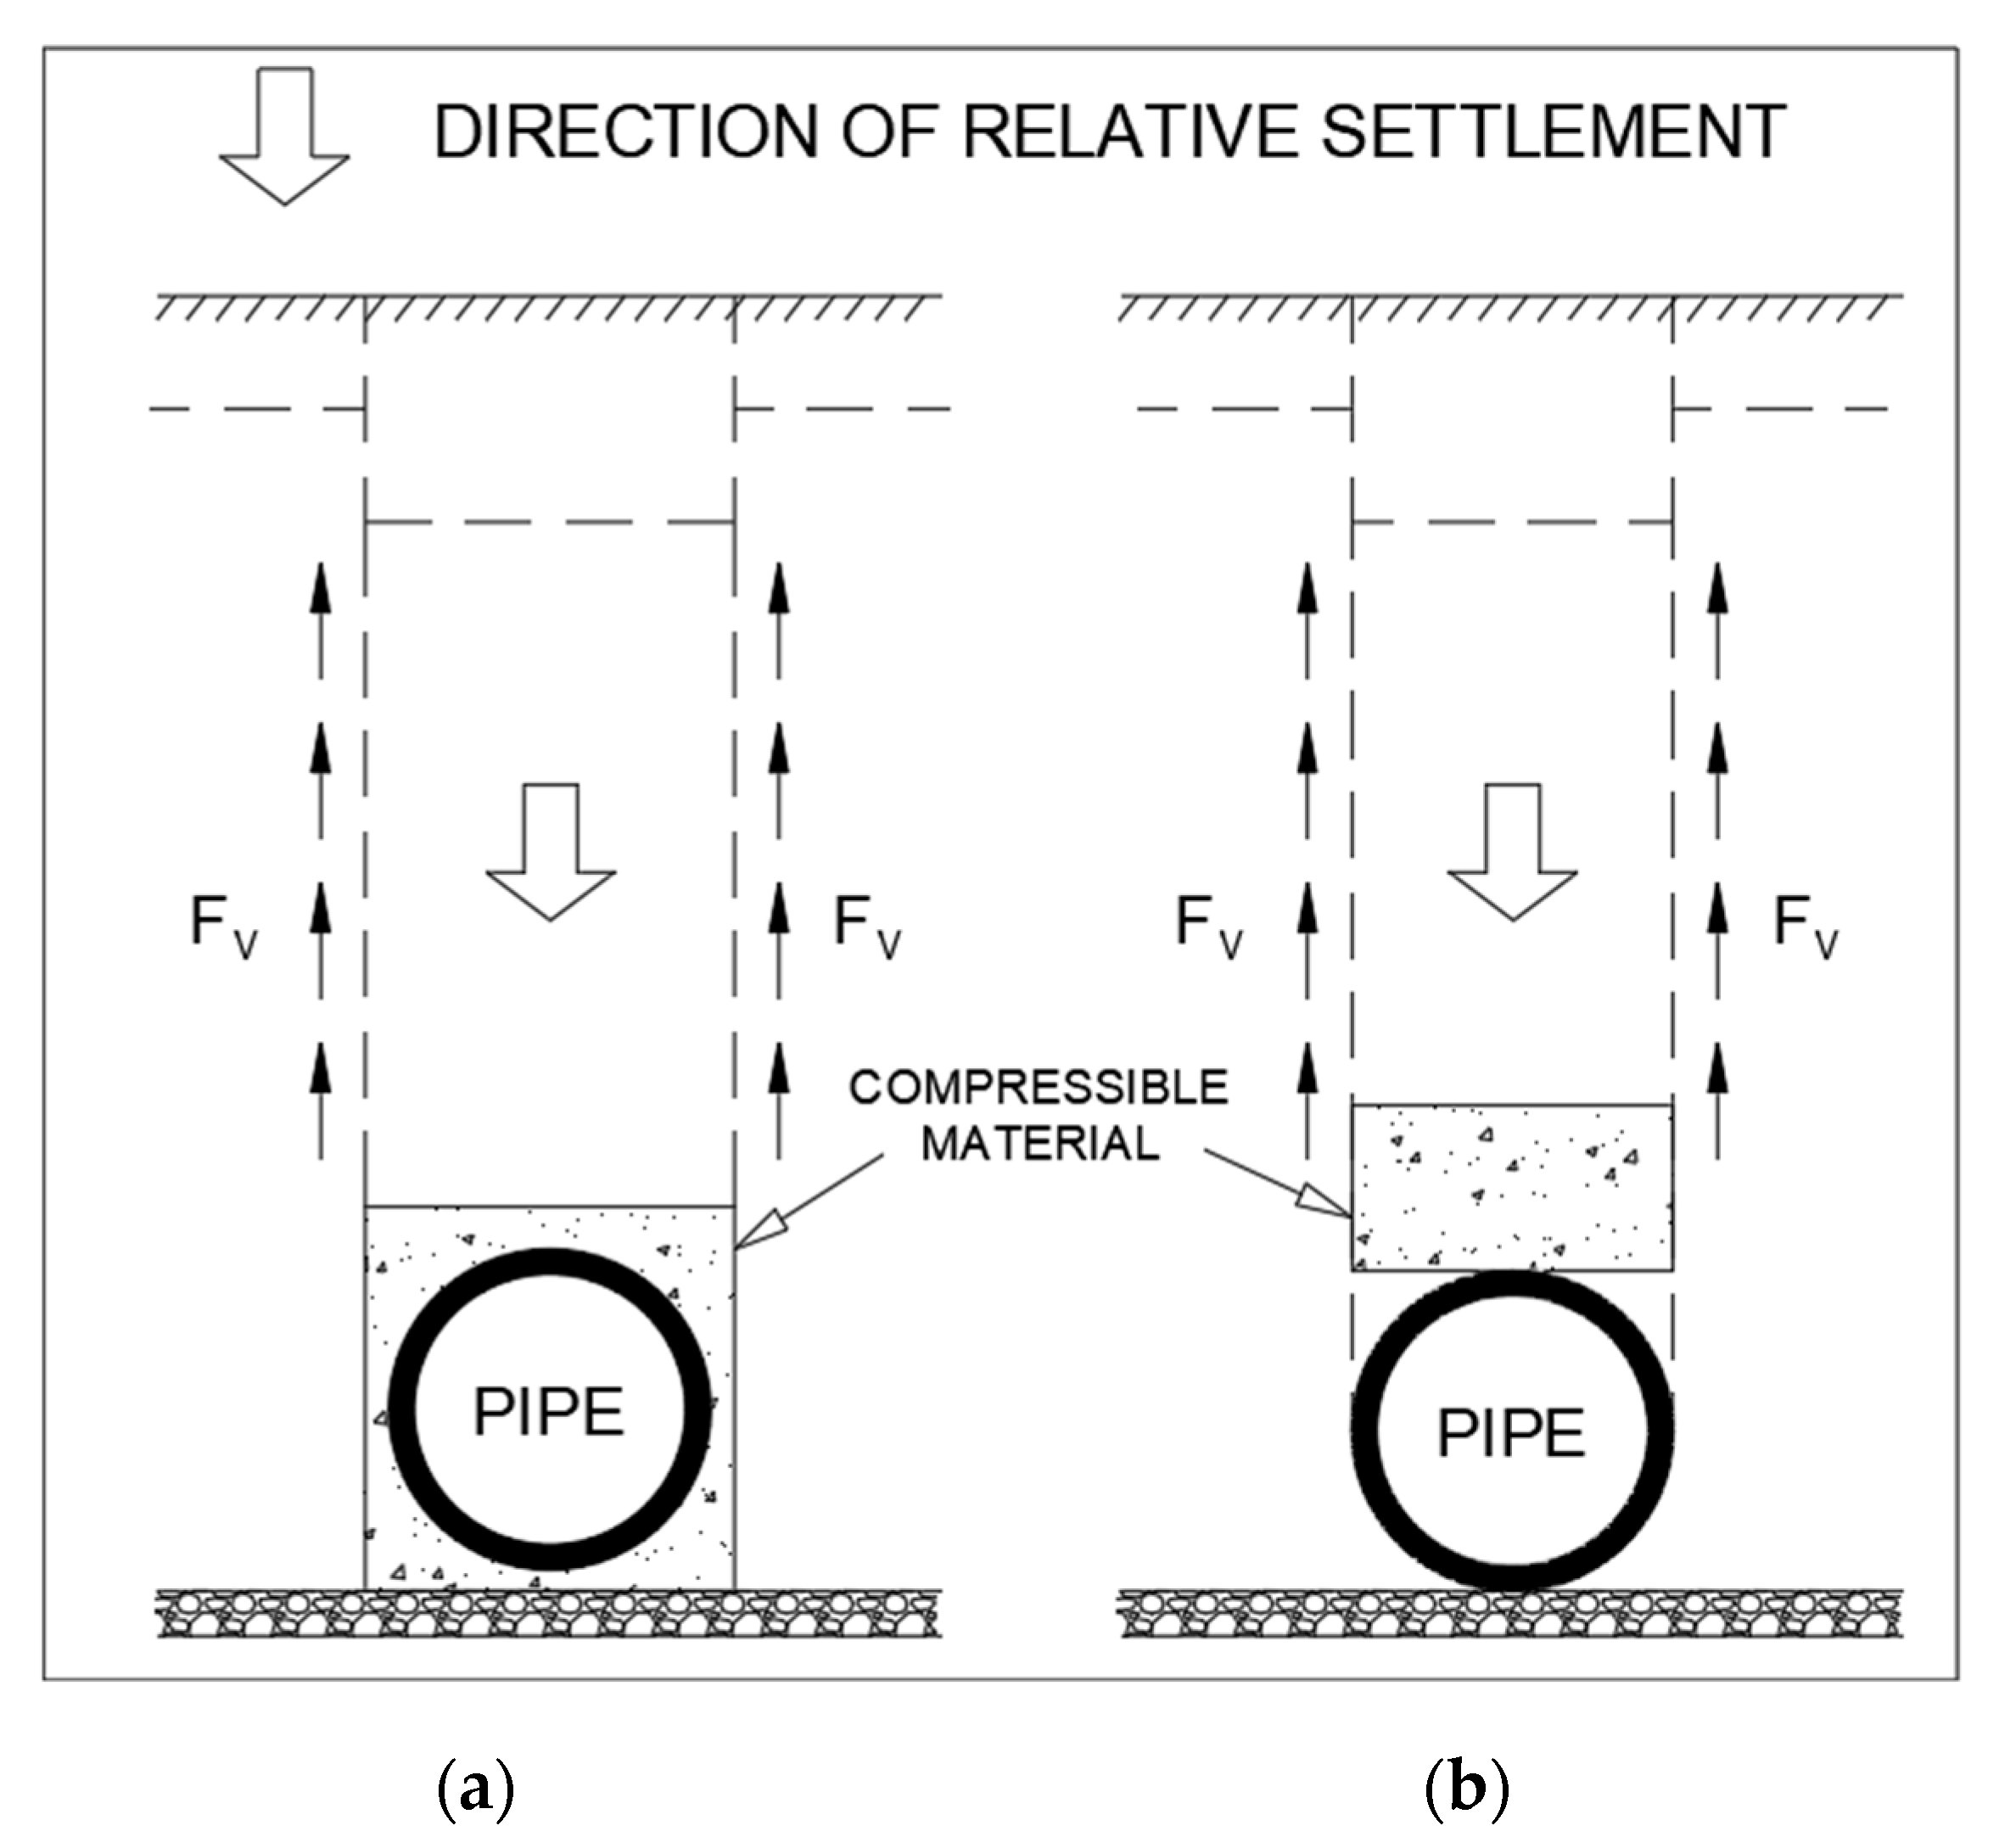
  • In ETI and ITI models in which the EPS material was used with thermoplastic pipe, positive soil arching increased regardless of the vertical pipe deflection. There was a decrease in the stress in the regions where the EPS Geofoam material was placed. Stress was uniformly distributed across the EPS Geofoam in the pipe crown; however, significant increases in stresses occurred from the edge point of the EPS. Creating a compressible zone on the pipe in the ITI model caused greater stress at the pipe spring line and pipe invert than in the ETI model. Thus, the importance of the geometry of the compressible region to be formed around the pipe was highlighted. It was determined that the ETI model reduced the stresses acting on the pipe and caused a more uniform stress distribution around the pipe;
  • The effects of diameter in HDPE pipes were investigated, and it was determined that the increase in pipe diameter increased the stresses acting on the pipe. Similar stress increases were determined in the ITI and ETI models. When the HDPE pipe diameter increased by approximately twice in the ETI model, there was an approximately 20%, 15%, and 35% increase in stress calculated at the crown, invert, and spring lines, respectively. The type of backfill soil around the pipe also affected the stresses. High stresses occurred in clay, sand, and crushed stone backfills, respectively;
  • The stiffness effect was examined in the PVC pipe, and higher stresses were observed on the pipes with higher rigidity. In the ITI and ETI models, the stress acting on the pipe decreased regardless of pipe stiffness. The stresses calculated in pipes whose stiffnesses differed by a factor of two were very close. Thus, it was determined that it is appropriate to use the lower rigidity pipe with EPS Geofoam (especially in the ETI model) under the higher fill stresses;
  • HDPE and PVC pipes were taken into account to examine the effects of pipe material on stress in thermoplastic pipes. It was determined that the stresses affecting the PVC pipe were higher than the HDPE pipe. This is because the stiffness of the HDPE pipe is lower than the PVC pipe. The HDPE pipe deflects more, causing further development of positive arching and resulting in less stress affecting the HDPE pipe;
  • The use of EPS in the installation of thermoplastic pipes greatly affected the VAF and HAF values. When the thermoplastic pipe was buried according to the ETI method, active soil wedges at the sides of the pipe were induced, leading to a significant reduction in the horizontal stresses that act on the pipe wall. Reduction in horizontal stress in the pipe spring line was controlled by compression of the EPS zone that covers the side of the pipe;
  • The VAF and HAF values were compared. The highest values were determined in clay, sand, and crushed stone backfills when comparing the reference to the ITI and ETI models, respectively. With the increase in the H/D ratio in the ETI model, VAF and HAF values decreased to almost the same values for all three backfill types. This situation shows that clay backfill can be used instead of the sand and crushed stone material used as traditional backfill with the ETI model;
  • The induced trench methods significantly affected thermoplastic pipe deflections due to the interaction between the thermoplastic pipe, EPS, and the backfill. The results showed that using EPS meant that arching increased regardless of pipe deflection caused by relative soil settlements compressing the EPS with either the ETI or ITI method for thermoplastic pipe and, consequently, lower pipe deflections;
  • In applications subjected to high fill stresses, burying the large-diameter thermoplastic pipes with EPS Geofoam material significantly reduces the stresses affecting the pipe deflections. In this study, reductions in the stresses acting on the pipes were calculated for the ETI model and found to be up to 62% at the pipe crown, 53% at the invert, and 65% at the spring line.
These results were determined based on numerical analyses. Both thermoplastic pipe and EPS are polymer-based materials; they are subject to time-dependent deformations (i.e., creep) under loads. Therefore, the authors strongly recommend that the time-dependent response of such a system be investigated by long-term field tests. In addition, in the design of ITI and ETI thermoplastic pipes containing EPS Geofoam as a compressible inclusion, numerical analyses should also be performed to take into account the time-dependent deformation (i.e., creep) behavior of HDPE, PVC, and EPS.

Author Contributions

Conceptualization, H.K.; Formal analysis, S.B.; Investigation, P.B. All authors have read and agreed to the published version of the manuscript.

Funding

This research received no external funding.

Institutional Review Board Statement

Not applicable.

Informed Consent Statement

Not applicable.

Data Availability Statement

All data used is included in the submitted article.

Conflicts of Interest

The authors declare no conflict of interest.

References

  1. Brachman, R.W.I.; Moore, I.D.; Munro, S.M. Compaction Effects on Strains within Profiled Thermoplastic Pipes. Geosynth. Int. 2008, 15, 72–85. [Google Scholar] [CrossRef]
  2. Rogers, C.D.F. Some Observations on Flexible Pipe Response to Load; Transportation Research Board: Washington, DC, USA, 1988. [Google Scholar]
  3. Moore, I.D. Three-Dimensional Response of Deeply Buried Profiled Polyethylene Pipe; Transportation Research Board: Washington, DC, USA, 1995; pp. 49–58. [Google Scholar]
  4. Zanzinger, H.; Gartung, E. Large-Scale Model Test of Leachate Pipes in Landfills under Heavy Load. In Proceedings of the Advances in Underground Pipeline Engineering II; ASCE: NewYork, NY, USA, 1995; pp. 114–125. [Google Scholar]
  5. Rogers, C.D.F.; Fleming, P.R.; Talby, R. Use of Visual Methods to Investigate Influence of Installation Procedure on Pipe-Soil Interaction. Transp. Res. Rec. 1996, 1541, 76–85. [Google Scholar] [CrossRef]
  6. Brachman, R.W.I.; Moore, I.D.; Rowe, R.K. Interpretation of Buried Pipe Test: Small-Diameter Pipe in Ohio University Facility. Transp. Res. Rec. 1996, 1541, 64–75. [Google Scholar] [CrossRef]
  7. Dhar, A.S.; Moore, I.D. Non-Linear Analysis of Buried HDPE Pipe by the Finite Element Method: Comparison with Laboratory Test. In Proceedings of the ISRM International Symposium; OnePetro: Melbourne, Australia, 2000. [Google Scholar]
  8. Brachman, R.W.; Moore, I.D.; Rowe, R.K. The Performance of a Laboratory Facility for Evaluating the Structural Response of Small-Diameter Buried Pipes. Can. Geotech. J. 2001, 38, 260–275. [Google Scholar] [CrossRef]
  9. Dhar, A.S.; Moore, I.D. Corrugated High-Density Polyethylene Pipe: Laboratory Testing and Two-Dimensional Analysis to Develop Limit States Design. Transp. Res. Rec. 2002, 1814, 157–163. [Google Scholar] [CrossRef]
  10. Kang, J.; Parker, F.; Yoo, C.H. Soil-Structure Interaction and Imperfect Trench Installations for Deeply Buried Corrugated Polyvinyl Chloride Pipes. Transp. Res. Rec. 2007, 2028, 192–202. [Google Scholar] [CrossRef]
  11. Kang, J.S.; Han, T.H.; Kang, Y.J.; Yoo, C.H. Short-Term and Long-Term Behaviors of Buried Corrugated High-Density Polyethylene (HDPE) Pipes. Compos. Part B: Eng. 2009, 40, 404–412. [Google Scholar] [CrossRef]
  12. Munro, S.M.; Moore, I.D.; Brachman, R.W. Laboratory Testing to Examine Deformations and Moments in Fiber-Reinforced Cement Pipe. J. Geotech. Geoenviron. Eng. 2009, 135, 1722–1731. [Google Scholar] [CrossRef]
  13. Bryden, P.; El Naggar, H.; Valsangkar, A. Soil-Structure Interaction of Very Flexible Pipes: Centrifuge and Numerical Investigations. Int. J. Geomech. 2015, 15, 04014091. [Google Scholar] [CrossRef]
  14. Wang, F.; Du, Y.-J.; Zhou, M.; Zhang, Y.-J. Experimental Study of the Effects Produced by a Backfilling Process on Full-Scale Buried Corrugated HDPE Pipes in Fine-Grained Soils. J. Pipeline Syst. Eng. Pract. 2016, 7, 05015001. [Google Scholar] [CrossRef]
  15. Zhou, M.; Du, Y.J.; Wang, F.; Liu, M.D. Performance of Buried HDPE Pipes–Part I: Peaking Deflection during Initial Backfilling Process. Geosynth. Int. 2017, 24, 383–395. [Google Scholar] [CrossRef]
  16. Du, Y.J.; Zhou, M.; Wang, F.; Arulrajah, A.; Horpibulsuk, S. Earth Pressures on the Trenched HDPE Pipes in Fine-Grained Soils during Construction Phase: Full-Scale Field Trial and Finite Element Modeling. Transp. Geotech. 2017, 12, 56–69. [Google Scholar]
  17. Fang, H.; Tan, P.; Li, B.; Yang, K.; Zhang, Y. Influence of Backfill Compaction on Mechanical Characteristics of High-Density Polyethylene Double-Wall Corrugated Pipelines. Math. Probl. Eng. 2019, 1–24. [Google Scholar] [CrossRef]
  18. Fang, H.; Tan, P.; Du, X.; Li, B.; Yang, K.; Zhang, Y. Numerical and Experimental Investigation of the Effect of Traffic Load on the Mechanical Characteristics of HDPE Double-Wall Corrugated Pipe. Appl. Sci. 2020, 10, 627. [Google Scholar] [CrossRef] [Green Version]
  19. Dave, M.; Solanki, C. Numerical Analysis of Flexible Pipes Buried in Cohesionless Soil. In Proceedings of the Indian Geotechnical Conference 2019: IGC-2019; Springer: Berlin/Heidelberg, Germany, 2021; Volume V, pp. 479–489. [Google Scholar]
  20. Shan, Y.; Shi, G.; Hu, Q.; Zhang, Y.; Wang, F. Numerical Investigation of the Short-Term Mechanical Response of Buried Profiled Thermoplastic Pipes with Different Diameters to External Loads. Math. Probl. Eng. 2021, 2021, 1–18. [Google Scholar] [CrossRef]
  21. McAffee, R.P.; Valsangkar, A.J. Performance of an Induced Trench Installation. Transp. Res. Rec. 2005, 1936, 230–237. [Google Scholar] [CrossRef]
  22. McAffee, R.P.; Valsangkar, A.J. Field Performance, Centrifuge Testing, and Numerical Modelling of an Induced Trench Installation. Can. Geotech. J. 2008, 45, 85–101. [Google Scholar] [CrossRef]
  23. Parker, B.A.; McAffee, R.P.; Valsangkar, A.J. Field Performance and Analysis of 3-m-Diameter Induced Trench Culvert under a 19.4-m Soil Cover. Transp. Res. Rec. 2008, 2045, 68–76. [Google Scholar] [CrossRef]
  24. McGuigan, B.L.; Valsangkar, A.J. Centrifuge Testing and Numerical Analysis of Box Culverts Installed in Induced Trenches. Can. Geotech. J. 2010, 47, 147–163. [Google Scholar] [CrossRef]
  25. McGuigan, B.L.; Valsangkar, A.J. Earth Pressures on Twin Positive Projecting and Induced Trench Box Culverts under High Embankments. Can. Geotech. J. 2011, 48, 173–185. [Google Scholar] [CrossRef]
  26. Vaslestad, J.; Sayd, M.S.; Johansen, T.H.; Louise Wiman, N. Load Reduction and Arching on Buried Rigid Culverts Using EPS Geofoam. In Design Method and Instrumented Field Tests; Norwegian Public Roads Administration: Lillestrøm, Norway, 2011; Volume 1, pp. 10–36. [Google Scholar]
  27. Kim, H.; Choi, B.; Kim, J. Reduction of Earth Pressure on Buried Pipes by EPS Geofoam Inclusions. Geotech. Test. J. 2010, 33, 304–313. [Google Scholar]
  28. Sun, L.; Hopkins, T.; Beckham, T. Stress Reduction by Ultra-Lightweight Geofoam for High Fill Culvert. In Proceedings of the 13th Great Lakes Geotechnical and Geoenvironmental Conference, Milwaukee, WI, USA, 13 May 2005; American Society of Civil Engineers: Reston, VA, USA; pp. 146–154. [Google Scholar]
  29. Sun, L.; Hopkins, T.C.; Beckham, T.L. Long-Term Monitoring of Culvert Load Reduction Using an Imperfect Ditch Backfilled with Geofoam. Transp. Res. Rec. 2011, 2212, 56–64. [Google Scholar] [CrossRef]
  30. Meguid, M.A.; Hussein, M.O.G. A Numerical Procedure for the Assessment of Contact Pressures on Buried Structures Overlain by EPS Geofoam Inclusion. Int. J. Geosynth. Ground Eng. 2017, 3, 1–14. [Google Scholar] [CrossRef]
  31. Ma, Q.; Ku, Z.; Xiao, H. Model Tests of Earth Pressure on Buried Rigid Pipes and Flexible Pipes underneath Expanded Polystyrene (EPS). Adv. Civ. Eng. 2019, 9156129. [Google Scholar] [CrossRef] [Green Version]
  32. Al-Naddaf, M.; Han, J.; Xu, C.; Rahmaninezhad, S.M. Effect of Geofoam on Vertical Stress Distribution on Buried Structures Subjected to Static and Cyclic Footing Loads. J. Pipeline Syst. Eng. Pract. 2019, 10, 04018027. [Google Scholar] [CrossRef]
  33. Kim, K.; Yoo, C.H. Design Loading on Deeply Buried Box Culverts. J. Geotech. Geoenviron. Eng. 2005, 131, 20–27. [Google Scholar] [CrossRef]
  34. Sun, L.; Hopkins, T.C.; Beckham, T.L. Reduction of Stresses on Buried Rigid Highway Structures Using the Imperfect Ditch Method and Expanded Polysterene (Geofoam); The University of Kentucky: Lexington, KY, USA, 2009; p. 49. [Google Scholar]
  35. Kang, J.; Parker, F.; Yoo, C.H. Soil–Structure Interaction for Deeply Buried Corrugated Steel Pipes Part II: Imperfect Trench Installation. Eng. Struct. 2008, 30, 588–594. [Google Scholar] [CrossRef]
  36. Kang, J.; Parker, F.; Yoo, C.H. Soil-Structure Interaction and Imperfect Trench Installations for Deeply Buried Concrete Pipes. J. Geotech. Geoenviron. Eng. 2007, 133, 277–285. [Google Scholar] [CrossRef]
  37. Kang, J. Finite Element Analysis for Deeply Buried Concrete Pipes in Proposed Imperfect Trench Installations with Expanded Polystyrene (EPS) Foams. Eng. Struct. 2019, 189, 286–295. [Google Scholar] [CrossRef]
  38. Kang, J.; Im, H.; Park, J.S. The Effect of Load Reduction on Underground Concrete Arch Structures in Embedded Trench Installations. Tunn. Undergr. Space Technol. 2020, 98, 103240. [Google Scholar] [CrossRef]
  39. Witthoeft, A.F.; Kim, H. Numerical Investigation of Earth Pressure Reduction on Buried Pipes Using EPS Geofoam Compressible Inclusions. Geosynth. Int. 2016, 23, 287–300. [Google Scholar] [CrossRef]
  40. Meguid, M.A.; Ahmed, M.R.; Hussein, M.G.; Omeman, Z. Earth Pressure Distribution on a Rigid Box Covered with U-Shaped Geofoam Wrap. Int. J. Geosynth. Ground Eng. 2017, 3, 1–14. [Google Scholar] [CrossRef]
  41. Meguid, M.A.; Hussein, M.G.; Ahmed, M.R.; Omeman, Z.; Whalen, J. Investigation of Soil-Geosynthetic-Structure Interaction Associated with Induced Trench Installation. Geotext. Geomembr. 2017, 45, 320–330. [Google Scholar] [CrossRef]
  42. Vaslestad, J.; Sayd, M.S. Load Reduction on Buried Rigid Culverts, Instrumented Case Histories and Numerical Modeling. In Proceedings of the 5th International Conference on Geofoam Blocks in Construction Applications: Proceedings of EPS 2018; Springer: Berlin/Heidelberg, Germany, 2019; pp. 115–128. [Google Scholar]
  43. Santos, R.R.V.; Kang, J.; Park, J.S. Effects of Embedded Trench Installations Using Expanded Polystyrene Geofoam Applied to Buried Corrugated Steel Arch Structures. Tunn. Undergr. Space Technol. 2020, 98, 103323. [Google Scholar] [CrossRef]
  44. Moradi, G.; Hassankhani, E.; Halabian, A.M. I nvestigation of Applied Esrth Load on Buried Box Culverts Iin Trenches Using Induced Trench Method under Embankment Pressure. Sharif J. Civ. Eng. 2020, 35, 53–65. [Google Scholar]
  45. Al-Naddaf, M.; Rasheed, S.E.; Rahmaninezhad, S.M.; Han, J. Effects of Geofoam Geometry and Location on Vertical Stresses on Buried Culverts during Construction and under Surface Loading. In Proceedings of the Geosynthetics Conference 2021, Online, 22–25 February 2021; pp. 549–560. [Google Scholar]
  46. Yang, X.; Zhang, Y. Load Reduction Method and Experimental Study for Culverts with Thick Backfills on Roadways in Mountainous Regions. Tumu Gongcheng Xuebao 2005, 38, 116–121. [Google Scholar]
  47. Zhang, W.; Liu, B.; Xie, Y. Field Test and Numerical Simulation Study on the Load Reducing Effect of EPS on the Highly Filled Culvert. J. Highw. Transp. Res. Dev. 2006, 23, 54–57. [Google Scholar]
  48. Vaslestad, J.; Johansen, T.H.; Holm, W. Load Reduction on Rigid Culverts beneath High Fills: Long-Term Behavior; Transportation Research Board: Washington, DC, USA, 1993; pp. 58–68. [Google Scholar]
  49. Kang, J. Soil-Structure Interaction and Imperfect Trench Installations as Applied to Deeply Buried Conduits. Ph.D. Thesis, Auburn University, Auburn, Alabama, 2007. [Google Scholar]
  50. Marston, A. The Theory of External Loads on Closed Conduits in the Light of the Latest Experiments: Bulletin 96; Iowa Engineering Experiment Station: Ames, IA, USA, 1930; pp. 138–170. [Google Scholar]
  51. Terzaghi, K. Theoretical Soil Mechanics; Wiley: New York, NY, USA, 1943. [Google Scholar]
  52. Akınay, E. Investigating the Effect of Using Compressible Bedding Material on the Behavior of Buried Flexible Pipes. Ph.D. Thesis, Yildiz Technical University, Science and Technology Institute, İstanbul, Turkey, 2017. [Google Scholar]
  53. Söylemez, B. Laboratory Experiments on Improvement of Buried Flexible Pipes by Using Geofoam. Master’s Thesis, Middle East Technical University, Ankara, Turkey, 2017. [Google Scholar]
  54. Akyelken, F.A.; Kılıç, H. Investigation of Effects of EPS Material Use on Buried Flexible Pipe Behavior by Numerical Analysis; İTÜ Süleyman Demirel Kültür Merkezi: İstanbul, Turkey, 2019; Volume 1, pp. 1–10. [Google Scholar]
  55. Kılıç, H.; Akınay, E. Effects of Using EPS Geofoam as Compressible Inclusion on HDPE Pipe Behavior. J. Pipeline Syst. Eng. Pract. 2019, 10, 04019006. [Google Scholar] [CrossRef]
  56. Furkan Akyelken Investigation of Effects of Expanded Polystyrene Material Use on Buried Flexible Pipe Behavior by Numerical Analysis. Ph.D. Thesis, Yildiz Technical University, İstanbul, Turkey, 2020.
  57. Kefci, Y. Determination of the Optimum Geofoam Geometry for Shallowly Buried Flexible Pipe by Finite Element Analyses. Master’s Thesis, Middle East Technical University, Ankara, Türkiye, 2020. [Google Scholar]
  58. Akyelken, F.A.; Kılıç, H. Experimental and Numerical Analyses of Buried HDPE Pipe with Using EPS Geofoam. KSCE J. Civ. Eng. 2022, 26, 3968–3977. [Google Scholar] [CrossRef]
  59. Akinay, E.; Kiliç, H. Effects of Induced Trench Configuration and EPS Geofoam Density on the HDPE Pipe Behavior. Geosynth. Int. 2023, 1–50. [Google Scholar] [CrossRef]
  60. Azizian, M.; Tafreshi, S.M.; Darabi, N.J. Experimental Evaluation of an Expanded Polystyrene (EPS) Block-Geogrid System to Protect Buried Pipes. Soil Dyn. Earthq. Eng. 2020, 129, 105965. [Google Scholar] [CrossRef]
  61. Moghaddas Tafreshi, S.M.; Darabi, N.J.; Dawson, A.R.; Azizian, M. Combining EPS Geofoam with Geocell to Reduce Buried Pipe Loads and Trench Surface Rutting. Geotext. Geomembr. 2020, 48, 400–418. [Google Scholar] [CrossRef]
  62. Moghaddas Tafreshi, S.N.; Joz Darabi, N.; Dawson, A.R.; Azizian, M. An Experimental Evaluation of Geocell and EPS Geofoam as Means of Protecting Pipes at the Bottom of Repeatedly Loaded Trenches. Int. J. Geomech. 2020, 20, 04020023. [Google Scholar] [CrossRef]
  63. Sargand, S.; Masada, T.; Hazen, G.B. Field Verification of Structural Performance of Thermoplastic Pipe under Deep Backfill Conditions; Ohio Dept. of Transportation and Federal Highway Administration: Cincinnati, OH, USA, 2002; p. 14339. [Google Scholar]
  64. Plaxis 2D Manual Connect Edition V21; Bently Systems, Incorporated: Delft, The Netherlands, 2020.
  65. Akinay, E.; Akınay, E.; KILIÇ, H. Use of Emperical Approaches and Numerical Analyses in Design of Buried Flexible Pipes. Sci. Res. Essays 2010, 5, 3972–3986. [Google Scholar]
  66. Sargand, S.M.; Masada, T.; White, K.E.; Altarawneh, B. Profile-Wall High-Density Polyethylene Pipes 1050 mm in Diameter under Deep Soil Cover: Comparisons of Field Performance Data and Analytical Predictions. Transp. Res. Rec. 2002, 1814, 186–196. [Google Scholar] [CrossRef]
  67. Sargand, S.M.; Masada, T.; Gruver, D. Thermoplastic Pipe Deep-Burial Project in Ohio: Initial Findings. In New Pipeline Technologies, Security, and Safety; American Society of Civil Engineers: Reston, VA, USA, 2003; Volume 2, pp. 1288–1301. [Google Scholar]
  68. Sargand, S.M.; Masada, T.; Tarawneh, B.; Yanni, H. Use of Soil Stiffness Gauge in Thermoplastic Pipe Installation. J. Transp. Eng. 2004, 130, 768–776. [Google Scholar] [CrossRef]
  69. Sargand, S.M.; Masada, T.; Tarawneh, B.; Gruver, D. Field Performance and Analysis of Large-Diameter High-Density Polyethylene Pipe under Deep Soil Fill. J. Geotech. Geoenviron. Eng. 2005, 131, 39–51. [Google Scholar] [CrossRef]
  70. Sargand, S.; Masada, T.; Tarawneh, B.; Gruver, D. Deeply Buried Thermoplastic Pipe Field Performance over Five Years. J. Geotech. Geoenviron. Eng. 2008, 134, 1181–1191. [Google Scholar] [CrossRef]
  71. Sargand, S.M.; Masada, T. Soil Arching over Deeply Buried Thermoplastic Pipe. Transp. Res. Rec. 2003, 1849, 109–123. [Google Scholar] [CrossRef]
  72. Masada, T.; Sargand, S.M. Peaking Deflections of Flexible Pipe during Initial Backfilling Process. J. Transp. Eng. 2007, 133, 105–111. [Google Scholar] [CrossRef]
  73. Masada, T.; Sargand, S. Thermoplastic Pipe Deep Burial Study in Ohio: Further Analysis of Field Performance Data. J. Pipeline Syst. Eng. Pract. 2011, 2, 132–138. [Google Scholar] [CrossRef]
  74. Sargand, S.M.; Masada, T. Modulus of Soil Reaction Values Measured in Ohio Thermoplastic Pipe Deep Burial Project. J. Pipeline Syst. Eng. Pract. 2015, 6, 04014007. [Google Scholar] [CrossRef]
  75. O’rourke, T.D.; Druschel, S.J.; Netravali, A.N. Shear Strength Characteristics of Sand-Polymer Interfaces. J. Geotech. Eng. 1990, 116, 451–469. [Google Scholar] [CrossRef]
  76. Sheeley, M.; Negussey, D. An Investigation of Geofoam Interface Strength Behavior. In Soft Ground Technology; American Society of Civil Engineers: Reston, VA, USA, 2001; pp. 292–303. [Google Scholar]
  77. Xenaki, V.C.; Athanasopoulos, G.A. Experimental Investigation of the Interaction Mechanism at the EPS Geofoam-Sand Interface by Direct Shear Testing. Geosynth. Int. 2001, 8, 471–499. [Google Scholar] [CrossRef] [Green Version]
  78. Bozkurt, S. Reduction of Stresses Acting on Buried Flexible Pipe by Using Compressible Material. Ph.D. Thesis, Namik Kemal University, Science and Technology Institute, Tekirdağ, Turkey, 2021. [Google Scholar]
  79. Talesnick, M. Measuring Soil Pressure within a Soil Mass. Can. Geotech. J. 2013, 50, 716–722. [Google Scholar] [CrossRef]
  80. Weiler, W.A., Jr.; Kulhawy, F.H. Factors Affecting Stress Cell Measurements in Soil. J. Geotech. Eng. Div. 1982, 108, 1529–1548. [Google Scholar] [CrossRef]
  81. Abbott, P.A. Arching for Vertically Buried Prismatic Structures. J. Soil Mech. Found. Div. 1967, 93, 233–255. [Google Scholar] [CrossRef]
  82. Monfore, G.E. An Analysis of the Stress Distributions in and near Stress Gages Embedded in Elastic Solids; US Bureau of Reclamation: Washington, DC, USA, 1950. [Google Scholar]
  83. Stark, T.D.; Arellano, D.; Horvath, J.S.; Leshchinsky, D. Geofoam Applications in the Design and Construction of Highway Embankments. NCHRP Web Doc. 2004, 65, 24–31. [Google Scholar]
  84. Kou, Y.; Shukla, S.K. Analytical Investigation of Load over Pipe Covered with Geosynthetic-Reinforced Sandy Soil. Int. J. Geosynth. Ground Eng. 2019, 5, 5. [Google Scholar] [CrossRef]
  85. McGrath, T.J. Proposed Design Method for Calculating Loads and Hoop Compression Stresses for Buried Pipe. Draft Proposal Prepared for Polyethylene Pipe Task Group of the AASHTO Flexible Culvert Liaison Committee. 1996.
  86. ATV-DVWK-A 127E Static Calculation of Drains and Sewers; German Association for Water, Wastewater and Waste: Hennef, Germany, 2000.
  87. AASHTO M294-06 Standard Specification for Corrugated Polyethylene Pipe, 300- to 1500-Mm Diameter; American Association of State Highway and Transportation Officials: Washington, DC, USA, 2017.
  88. CPPA (Corrugated Polyethylene Pipe Association). Recommended Installation Practices For Corrugated Polyethylene Pipe and Fittings; CPPA: Washington, DC, USA, 2006; pp. 25–26. [Google Scholar]
  89. Plastic Pipe Institute (PPI). Design of PE Piping Systems. In Handbook of PE Pipe; Plastic Pipe Institute (PPI): Irving, TX, USA, 2008; Volume 6. [Google Scholar]
Figure 1. (a) Embedded trench installation (ETI). (b) Induced trench installation (ITI) Santos et al. [43].
Applsci 13 03040 g001
Figure 2. The embankment construction plan and the positions of the pipes in the embankment.
Applsci 13 03040 g002
Figure 3. Numerical model and finite element mesh of B-B’ cross-section. (a) General view of section. (b) A magnified view of the trench geometries (Pipe 17, 14, 11, 8, 5, and 2 from left to right).
Applsci 13 03040 g003
Figure 4. Field test and numerical analyses. (a) Vertical stress on the pipe crown and horizontal stress on the pipe spring line in Pipe 4. (b) Horizontal and vertical deflection in Pipe 4. (c)Vertical stress on the pipe crown and horizontal stress on the pipe spring line in Pipe 14. (d) Horizontal and vertical deflection in Pipe 14.
Applsci 13 03040 g004aApplsci 13 03040 g004b
Figure 5. Models in the numerical analyses. (a) Reference. (b) ITI model. (c) ETI model.
Applsci 13 03040 g005
Figure 6. (a) Axial stress–axial strain. (b) Volumetric strain–axial strain graphs for EPS15 geofoam material.
Applsci 13 03040 g006
Figure 7. In the ITI model, stresses in the change of pipe diameter for the 30 m embankment.
Applsci 13 03040 g007
Figure 8. In the ETI model, stresses in the change of pipe diameter for the 30 m embankment.
Applsci 13 03040 g008
Figure 9. In the ITI model, stresses in PS-650 and PS-302 pipes for 30 m embankment.
Applsci 13 03040 g009
Figure 10. In the ETI model, stresses in PS-650 and PS-302 pipes for 30 m embankment.
Applsci 13 03040 g010
Figure 11. In the ITI model, stresses on the HDPE and PVC pipes for the 30 m embankment.
Applsci 13 03040 g011
Figure 12. In the ETI model, stresses on the HDPE and PVC pipes for the 30 m embankment.
Applsci 13 03040 g012
Figure 13. Arching factors for 0.762 m diameter PVC pipe. (a) Vertical arching factor (VAF). (b) Horizontal arching factor (HAF).
Applsci 13 03040 g013
Figure 14. Arching factors for 1.524 m diameter HDPE pipe. (a) Vertical arching factor (VAF). (b) Horizontal arching factor (HAF).
Applsci 13 03040 g014
Figure 15. The 0.762 m diameter PVC pipe deflections. (a) Horizontal. (b) Vertical.
Applsci 13 03040 g015
Figure 16. The 1.524 m diameter HDPE pipe deflections. (a) Horizontal. (b) Vertical.
Applsci 13 03040 g016
Table 1. Field test pipe properties and installation conditions.
Pipe
No
Pipe
Material
Pipe
Diameter
(mm)
Wall Type (1)Ring
Stiffness (2)
(kPa)
BackfillH
(m)
Bedding Thickness
(mm)
TypeRC
(%)
2PVC762A45.15Cr. S.9612.2150
4PVC762B97.45Sand866.1150
5PVC762B97.45Cr. S.9612.2150
8HDPE762C73.31Sand9612.2150
14HDPE1067E61.69Sand9612.280–230
17HDPE1524F34.42Cr. S.9612.280–230
(1) [63] for details. (2) Initial values. Cr. S.—Crushed Stone. RC—Relative compaction.
Table 2. Hardening Soil (HS) Model parameters for the soils.
Soilsγn
(kN/m3)
E 50 (MPa) E 50 r e f (MPa) E u r r e f (MPa) c (kPa)φ
(°)
Ψ
(°)
Cr. S. (96% RC)22.19–23.819089.2267.6694515
Sand (86% RC)17.70–18.39.79.528.50377
Sand (96% RC)19.35–19.953635.5106.504515
Bedding Cr. S.18-3296.0204010
Bedding Sand16-6.318.90333
Native Soil Clay20.4-2060.034.5240
Embankment Fill Clay20.4-5.2115.634.5150
Table 3. Parameters of pipe types.
Pipe Profile TypesABCEF
Pipe diameter (m)0.7620.7620.7621.0671.524
Pipe Rigidity (kN/m/m)302650490413230
Normal Stiffness, EA(kN/m)32,62035,550833511,96018,190
Flexural Stiffness, EI (kNm2/m)2.4905.3904.0509.36015.220
Equivalent Thickness, d (m)0.0300.0430.0760.0970.100
Poisson’s Ratio, ν0.3000.3000.4500.4500.450
Table 4. Parameters of interface strength and corresponding interface reduction factors.
ParameterLocal Soil-BackfillPipe-BackfillPipe-EPSEPS-Backfill
φinter (°)2420 (1)14 (2)>30 (3)
Rinter (-)1.000.671.001.00
φinter angle of interface strength; Rinter interface strength reduction factor (1) [75], (2) [76], (3) [77].
Table 5. Loads acting on the pipe sidewall (Loads are in kN units).
Layer 1Layer 2Layer 3Layer 4Layer 5Layer 6
Pipe 41.00.91.41.0--
Pipe141.51.51.51.51.51.5
Table 6. HS model parameters for backfill soils.
Backfill ParametersCr. SSandClay
Natural unit volume weight, γn (kN/m3)2217.720.4
Reference   mean   sec ant   module ,   E 50 r e f (MPa)189.55.2
Reference   unloading - reloading   module ,   E u r r e f (MPa)5428.515.6
Cohesion, c (kN/m2)--34.5
Shear strength angle, φ (°)403715
Dilatancy angle, ψ (°)57-
Exponential power for the stress–level dependency of stiffness, m (-)0.50.50.8
Table 7. Stresses (in kPa) under the HDPE pipe diameter effect for 30 m embankment.
1.524 m (F) (HDPE)0.762 m (C) (HDPE)
CrownSpring LineInvertCrownSpring LineInvert
ReferenceCr. S267331248267235209
Sand326348287316254256
Clay397366370379297338
ITI modelCr. S195197216156154178
Sand207224246176185224
Clay248280334237257301
ETI modelCr. S16315113413897121
Sand171167147153113136
Clay209222205206193207
Table 8. Stresses (in kPa) under the PVC pipe stiffness effect for 30 m embankment.
PS-650 (B) (PVC)PS-302 (A) (PVC)
CrownSpring LineInvertCrownSpring LineInvert
ReferenceCr. S307269247280290252
Sand341271281314294275
Clay392294348350306312
ITI modelCr. S158168197167169187
Sand178192236184196218
Clay235252298225243282
ETI modelCr. R138103122123100118
Sand152116135133111153
Clay194179185184156198
Table 9. Stress on HDPE and PVC pipes with 0.762 m diameter for the 30 m embankment (in kPa).
HDPE (C Type)PVC (B Type)
CrownSpring LineInvertCrownSpring LineInvert
ReferenceCr. R267235209307269247
Sand316254256341271281
Clay379297338392294348
ITI modelCr. R156154178158168197
Sand176185224178192236
Clay237257301235252298
ETI modelCr. R13897121138103122
Sand153113136152116135
Clay206193207194179185
Disclaimer/Publisher’s Note: The statements, opinions and data contained in all publications are solely those of the individual author(s) and contributor(s) and not of MDPI and/or the editor(s). MDPI and/or the editor(s) disclaim responsibility for any injury to people or property resulting from any ideas, methods, instructions or products referred to in the content.

