Article

Buckling Behavior of Loosely Fitted Formed-In-Place Pipe Liner in Circular Host Pipe under External Pressure

1
Faculty of Engineering, China University of Geosciences—Wuhan, Wuhan 430074, China
2
Wuhan Metro Bridge and Tunnel Management Co., Ltd., Wuhan 430077, China
3
School of Sustainable Engineering and the Built Environment, Arizona State University, Tempe, AZ 85259, USA
*
Author to whom correspondence should be addressed.
Appl. Sci. 2023, 13(2), 679; https://doi.org/10.3390/app13020679
Submission received: 7 November 2022 / Revised: 29 December 2022 / Accepted: 31 December 2022 / Published: 4 January 2023
(This article belongs to the Special Issue Advances in Underground Pipeline Technology)

Abstract

:
The formed-in-place pipe (FIPP) is a trenchless technology used for pipeline rehabilitation. It is a folded PVC pipe that expands through thermoforming to fit tightly inside the host pipe. However, the deficiencies during the construction of FIPP liners such as insufficient inflation, pipe misalignment and initial deformation will lead to elliptical deformation of the FIPP liner, which affects the load-bearing performance of the liner and makes it susceptible to buckling failure. In this paper, the buckling behavior of loosely fitted FIPP liners under uniform external pressure was investigated by the external pressure resistance test and finite element model. The pre- and post-buckling equilibrium paths verified the finite element model. The results indicated that the value of the dimension ratio will significantly reduce the critical buckling pressure. With the increasing value of liner major axis ratio to host pipe, the reduction effect on the critical buckling pressure caused by the increase in the ovality will diminish. Different values of liner major axis ratio to host pipe and ovality changed the range of the detached portion, which affected the critical buckling pressure. The parametric studies modified the design model from ASTM F1216, which was established to predict the critical buckling pressure of a loosely fitted FIPP liner and reduced the average difference rate from 23.43% to 5.52%.
Keywords:
FIPP; buckling; ovality; FEM

1. Introduction

In recent years, as the demand for energy transportation has increased, the construction of pipeline systems has increased to keep cities functioning properly. The pipeline system contains multiple types of pipe [1,2,3,4] and water supply pipelines and drainage pipelines are the key to satisfying the daily water requirements of residents [5] and avoiding pollution of the city environment [6], which are easily deformed, cracked or suffer from erosion under the effect of soil and groundwater. The pipe defects will eventually cause the bearing capacity reduction of the pipe and the leakage of pipe contents. Hence, the working conditions of the water supply and drainage pipelines need to be assessed and the defect pipelines need to be repaired.
Under the constraints of traffic conditions and the urban utility density in China, it is difficult to replace or repair defective pipes by excavation [7]. Trenchless rehabilitation technologies are gradually replacing traditional excavation repair technologies as the main technology for urban pipeline rehabilitation due to the ability to repair the pipe with minor excavation faces. Formed-in-place pipe (FIPP) technology repairs pipelines by installing a thermoplastic polyvinyl chloride (PVC) pipe into host pipe, which expands to fit tightly with host pipe by thermoforming [8]. The FIPP liner has high tensile and bending strength and is suitable for water supply pipelines and drainage pipelines of different types of sections, diameters and materials [9]. However, the FIPP liners will fail under high water pressure, especially in coastal cities, so it is necessary to study the buckling behavior of FIPP liners.
Scholars have had certain research results for this thin-walled cylindrical structure stability problem. Timoshenko et al. [10] first proposed the free ring buckling theory and derived a model for calculating the critical buckling pressure of an unconstrained circular thin-walled pipe under uniform external pressure. Based on that, Glock [11] proposed a model for calculating the critical buckling pressure of the liner constrained by a rigid host pipe. Aggarwal and Cooper [12] conducted an experimental study to consider the variation law of the support coefficient, they proposed to take the value of the enhancement factor as 7 to compensate for the deviation between the experimental results and the theory, and the enhancement factor was adopted by ASTM F1216 [13]. The liners might have initial defects during installation, Lo and Zhang [14] established an analytical model to predict the critical buckling pressure of the liner with an initial annular gap. EI-Sway [15] established an approximate solution for enhancement factors for loosely fitted liners. Zhao [16] studied the buckling behavior of reinforced steel liners under negative pressure loading and proposed a design model to predict the critical buckling pressure of the liners. However, annular gaps might occur when the liner is installed or deformed after prolonged exposure to water pressure, which will affect the bearing capacity of the liner. El-Sway [17] analyzed the effect of annular gaps on critical buckling pressure by combining neural networks and found that the effect of critical buckling pressure caused by an annular gap would decrease when the wall thickness increased. Dong [18] proposed a model for calculating the critical buckling pressure of the liner in the presence of multiple partial gaps. Wang [19] found that the annular gap affects the buckling behavior of the liner. Li [20] investigated the stability of the liner under uniform external pressure after grouting the annular space gap and found that the change in the contact conditions between the liner and the original pipe affected the pressure equilibrium path. El-Sawy [21] concluded that an increase in the partial buckling range of the liner leads to a decrease in the critical buckling pressure. Treitz et al. [22] designed a PVC pipe test system to study the effect of buoyancy on the buckling behavior of PVC liners by applying hydrostatic pressure to simulate grouting pressure. Results showed that the presence of buoyancy reduced the critical flexural strength of the liner.
In the existing studies, only the initial gap formed by the partial detachment of the liner from the host pipe is considered, ignoring the effect of the annular gap on the buckling behavior of the elliptical liner under loosely fitted conditions and the change of the contact conditions between the liner and host pipe under the action of water pressure, resulting in a specification deviation of the critical buckling pressure calculated by the prediction model in ASTM F1216, which reduces the reliability of the liner designs. This study designed an experimental system to investigate the buckling behavior of the loosely fitted FIPP liner under external pressure. The deformation mode of the buckling lobes can be directly captured by the camera and the critical buckling pressure could be measured by pressure transducer when the liner had a buckling failure. The geometric parameters of the liner were indicated as the dimension ratio and ratio of liner major axis to host pipe radius and ovality, and the 2D finite element models were set to analyze the effect of different geometric parameters of the liners. This study aimed at obtaining the different buckling behaviors of the FIPP liner by changing different geometric parameters and analyzing the sensitivity of different parameters on critical buckling pressure. The results of the study were used to improve the accuracy of the critical buckling pressure prediction model in ASTM F1216 for the design of the FIPP liner by modifying the enhancement factor.

2. Materials and Methods

2.1. Test Design

The experimental system is shown in Figure 1, the geometry dimension of the FIPP liner and the host pipe are shown in Table 1. During the installation of the host pipe, the outlet valve of the steel pipe was set at the bottom, and the inlet valves were set at the top of the host pipe. Considering the gravity of the water body itself and the buoyancy effect on the liner pipe, the pressure sensor interface is arranged at the spring line of the steel pipe and the displacement and deformation of the middle section of the FIPP liner are monitored using strain gauges and a PIV system.
Firstly, the FIPP liner was installed into the host pipe after grinding the ports and the axis of the liner was kept coincident with the host pipe. Considering the gravity of the liner and the buoyancy, the pressure transducer interface was set at the spring line of the steel pipe and strain gauges and PIV monitored the displacement and deformation of the middle section of the FIPP liner. The latex membrane was used to seal the port so that a closed cavity was formed between the liner and the host pipe. Secondly, water was slowly injected into the closed chamber through the test pressure pump until the air in the annular space gap was completely discharged and the test was started by maintaining a continuous pressurization rate of 12 kPa/min. The hydrostatic pressure acts directly on the outer wall of the liner, causing the liner tube to buckle and deform and when the liner buckles and deforms to the limit, the pressurization is stopped for 90 s and then unloaded and the test is completed.

2.2. Finite Element Model Set-Up

To quantify the buckling equilibrium paths of the thin-walled structures, the stress distribution and deformation extent of the structure must be calculated. Jiao [23] used the Differential Quadrature Method (DQM) to determine the pre-buckling in-plane stress distribution of thin rectangular FG-CNTRC plate. Kabir and Aghdam [24] developed an accurate Bézier-based multi-step method and implemented it to find the nonlinear vibration and post-buckling configurations of Euler–Bernoulli composite beams reinforced with graphene nano-platelets (GnP). Both DQM and the Bézier method divide the structure into a single element to calculate the stress and deformation during the buckling prosses, but those require extensive calculations computation to improve the precision of the calculation and the calculation results must be processed to be visualized. Thus, using the finite element analysis will be a good solution to quantify the buckling equilibrium paths of the FIPP liners.
ABAQUS is used for finite element simulation to study the effects of the dimension ratio (DR), ratio of liner major axis to host pipe radius (a/R) and ovality (q) on the buckling behavior. The longitudinal deformation and the boundary effect caused by the end ports of the liner are neglected and this paper only considers the buckling cross-section of the liner. Using 2D instead of 3D analysis effectively reduces simulation time while maintaining calculation accuracy. The model uses an eight-node reduced-integration plane strain element (CPE8R) and the liner elements are divided into three layers totaling 1200 elements. A total of 200 elements for steel host pipe are shown in Figure 2. Twenty-three groups of finite element model are shown in Table 2, Group A is set for the validation test, Group B to Group E are distinguished by the value of a/R to analyze the buckling behavior under the different values of a/R.
The host pipe material adopts the elastic constitutive model, the mechanical parameters of FIPP liner and steel are shown in Table 3. The outer surface of the steel pipe is fully restrained from displacement and rotation in all directions. The uniform external pressure is applied to the outer surface of the liner. The property of the contact surface between the liner and host pipe is defined as “surface to surface” in ABAQUS and allows the liner and host pipe to separate from each other when the normal pressure is zero or negative. The friction coefficient is 0.4 for the tangential contact, considering the friction between the liner and the pipe [9]. The displacement of the steel pipe is not considered during the liner buckling process and the boundary condition of the outer surface of the steel pipe is set to limit its displacement in the x and y axes, as shown in Figure 3a. A static general analysis step is used to apply the displacement of the liner along the y-axis and control the displacement of the liner on the x-axis and the rotation along the z-axis to zero, which simulates the process of the liner floating and contacting with the inner wall of the steel pipe under the action of buoyancy. The details about the boundary and load distribution are shown in Appendix A. The Riks step in ABAQUS is used to track the pre-buckling and post-buckling of the liner, which needs to assume the existence of the initial defect which will cause the buckling of the liner. In this model, a concentrated force is applied to the bottom surface of the liner to simulate the initial defect occurring at the bottom part of the pipe under the action of buoyancy, while the hydrostatic pressure acts on the outer surface of the liner, as shown in Figure 3b. The non-linear geometry (NIgeom) switch needs to be turned on in the ABAQUS simulation step settings to simulate the large deflection deformation during the buckling process of the liner.

2.3. Prediction Method of Critical Buckling Pressure

According to the designs of the semi-structural rehabilitation to flexible liner in ASTM 1216, the critical buckling pressure is calculated by Equation (1), while the enhancement factor value is 7 and the safety factor is 2.
Pcr = 2KELC/[(1 − μ2)(DR − 1)3N]
From Equation (1), it can be found that the influence of the annular gap is not considered when calculating the critical buckling pressure. The enhancement factor K is designed for reducing the deviates of the critical buckling pressure value between the theoretical condition and working condition. The enhancement factor value recommended by ASTM 1216 is unable to guarantee the accuracy of the critical buckling pressure value when the annular gap occurs. Therefore, the value of enhancement factor K will be quantified by analyzing the difference in the critical buckling pressure of finite element models which set the different geometric parameters according to Table 1.

3. Results and Discussion

3.1. Finite Element Model Validation

The FIPP liner material in the finite element model adopts the elastic–plastic constitutive model tested according to ISO 178. The relationship between the true strain and stress in the plastic phase of the FIPP material is shown in Figure 4, which will be used to define the plastic constitutive model of the finite element model. The elastic limit of the FIPP material is 41.8 MPa. However, bending failure in the specimen did not occur during the test and the ultimate bending strength was considered 62.62 MPa in the configuration of the finite element model.
The comparison of the pressure–displacement curve of the FIPP liner is shown in Figure 5. According to the curve, the buckling behavior of the liner can be divided into three stages. At first (stage AB), the deformation displacement versus the pressure is linear during the increase of hydrostatic pressure. At this stage, the liner did not form a buckling lobe. Then (stage BC), as the pressure increases, the deformed part of liner formed a bulge, which can be called the buckling lobe. When the pressure value approaches the critical buckling pressure, the deformation increases and rate of the buckling lobe is significantly increased, while the pressure increase rate remains unchanged. The buckling lobe continues deformation with no enhancement of the ability to withstand the external pressure, but the liner still has the bearing capacity until the pressure reaches the critical buckling pressure which will cause the buckling failure at the buckling lobe. The liner has a buckling failure at the end (stage CD). During stage AB, the test result and simulation result both indicate that the linear relationship between pressure and displacement is ended when the displacement reaches 12.53 mm, but the pressure of the test is 19.4% greater than simulation. At stage BC, the liner material may have had errors in the manufacturing process and the constraints of the flange on the liner in the test limited the displacement of the liner at both ends of the liner, producing end effects affecting the buckling cross-section in the test. When the displacement of the buckling lobe was equal, the pressure of the test result was greater than the numerical result during the buckling process. Hence, the liner stiffness in the test was significantly greater than the simulation. At point C, the liner reached the critical buckling pressure of 38.08 kPa when the displacement of the buckling lobe was 52.77 mm in the test and the liner reached the critical buckling pressure of 35.94 kPa when the displacement of the buckling lobe reached 76.39 mm in the numerical results. The critical buckling pressure in the test was 5.6% greater than the simulation and the displacement of buckling lobe in the simulation was 30.9% greater than in the test. In stage CD, when the displacement of the buckling lobe increased to 74.4 mm in the test, the buckling lobe began to move axially to the port along the liner and the liner eventually failed (Figure 6), while the buckling lobe continued to deform in the numerical results. This paper mainly studied the influence of changing geometric parameters on critical buckling pressure. Although the pressure of the simulation result was lower than the test result during the buckling process, the accuracy of the critical buckling pressure was still reliable.
The deformation of the liner at points A, B, C and D was selected according to Figure 5 to compare the test with the numerical results as shown in Figure 6. As shown in Figure 6a, the liner appears to float up under hydrostatic pressure, and the outer surface of the liner tube contacts the inner surface of the host pipe, while the liner undergoes slight rotation and the inner surface of liner had tensile deformation at monitoring point No. 2 and monitoring point No. 8. Compressive deformation occurred at monitoring points No. 5 and No. 11. The finite element model ignored the possible rotation of the liner under the condition of uniform external pressure. The numerical results show that the tensile deformation occurs at the invert of the inner surface of the liner. As shown in Figure 6b, the displacement of the liner was slightly elevated along the radial direction at monitoring point No. 2. With the continuous increase in hydrostatic pressure, the displacement of the liner at monitoring point No. 2 along the radial direction gradually increased. When the displacement of the buckling lobe reached point C, as shown in Figure 4, the deformation of the liner in the test and numerical result was shown in Figure 6c. After the pressure value reached the critical buckling pressure, the buckling lobe had deformation in the opposite direction at monitoring point No. 2 and began to move to the port along the axial direction. Finally, the liner failed, while the buckling lobe continued to deform after the pressure value reached the critical buckling pressure, as shown in Figure 6d. The reason for this difference was that the 2D finite element model ignored the deformation in the axial direction and only considered the deformation of the cross-section of the liner.

3.2. Sensitive Analysis of Parameters

3.2.1. Effect of Dimension Ratio

The pressure versus displacement curves when the value of DR is changed are shown in Figure 7. With the dimension ratio increase, the liner’s critical buckling pressure decreases and the displacement increases. Comparing the buckling equilibrium paths in Figure 7a,b, it can be found that the pressure increase rate of the liner is significantly greater than the other groups when DR = 100, and the pressure reaches 15 kPa when the displacement of the buckling lobe reaches 70 mm in Group C-1, while the pressure reaches 4.76 kPa in Group C-2. The pressure does not increase significantly while the displacement of the buckling lobe increases in the pre-buckling equilibrium path when DR = 150, 200, 250 and 300. The critical buckling pressure of Group D-1 compared to Group C-1 decreased by 2.31 kPa, while the displacement increased 15.25 mm. Under the same conditions, decreasing the value of a/R will decrease the critical buckling pressure and increase the deformation of the buckling lobe.
The comparison of the critical buckling pressure between the numerical result and calculation results when the value of DR is changed under different values of a/R are shown in Figure 8. The critical buckling pressure calculated by Equation (1) reduces by 7.5 kPa when DR changed from 100 to 150, while the critical buckling pressure of the simulation result reduced by 10.25 kPa and 10.15 kPa when the a/R = 0.99 and a/R = 0.98. The increase in annular gaps causes an increase in the amount of reduction in critical buckling pressure. The critical buckling pressure in Group C-2 decreases by 68.18% compared to Group C-1 and Group D-2 decreases by 79.74% compared to Group D-1. The reduction of the value of a/R enhances the decrease caused by the changing value of DR on the critical buckling pressure. When DR = 100, the critical buckling pressure of Group D-1 decreased by 15.36% compared to Group C-1; when DR = 200, the critical buckling pressure of Group D-3 decreased by 42.95% compared to Group C-3 and the effect caused by changing the value of a/R on critical buckling pressure reduced as the value of DR increased.

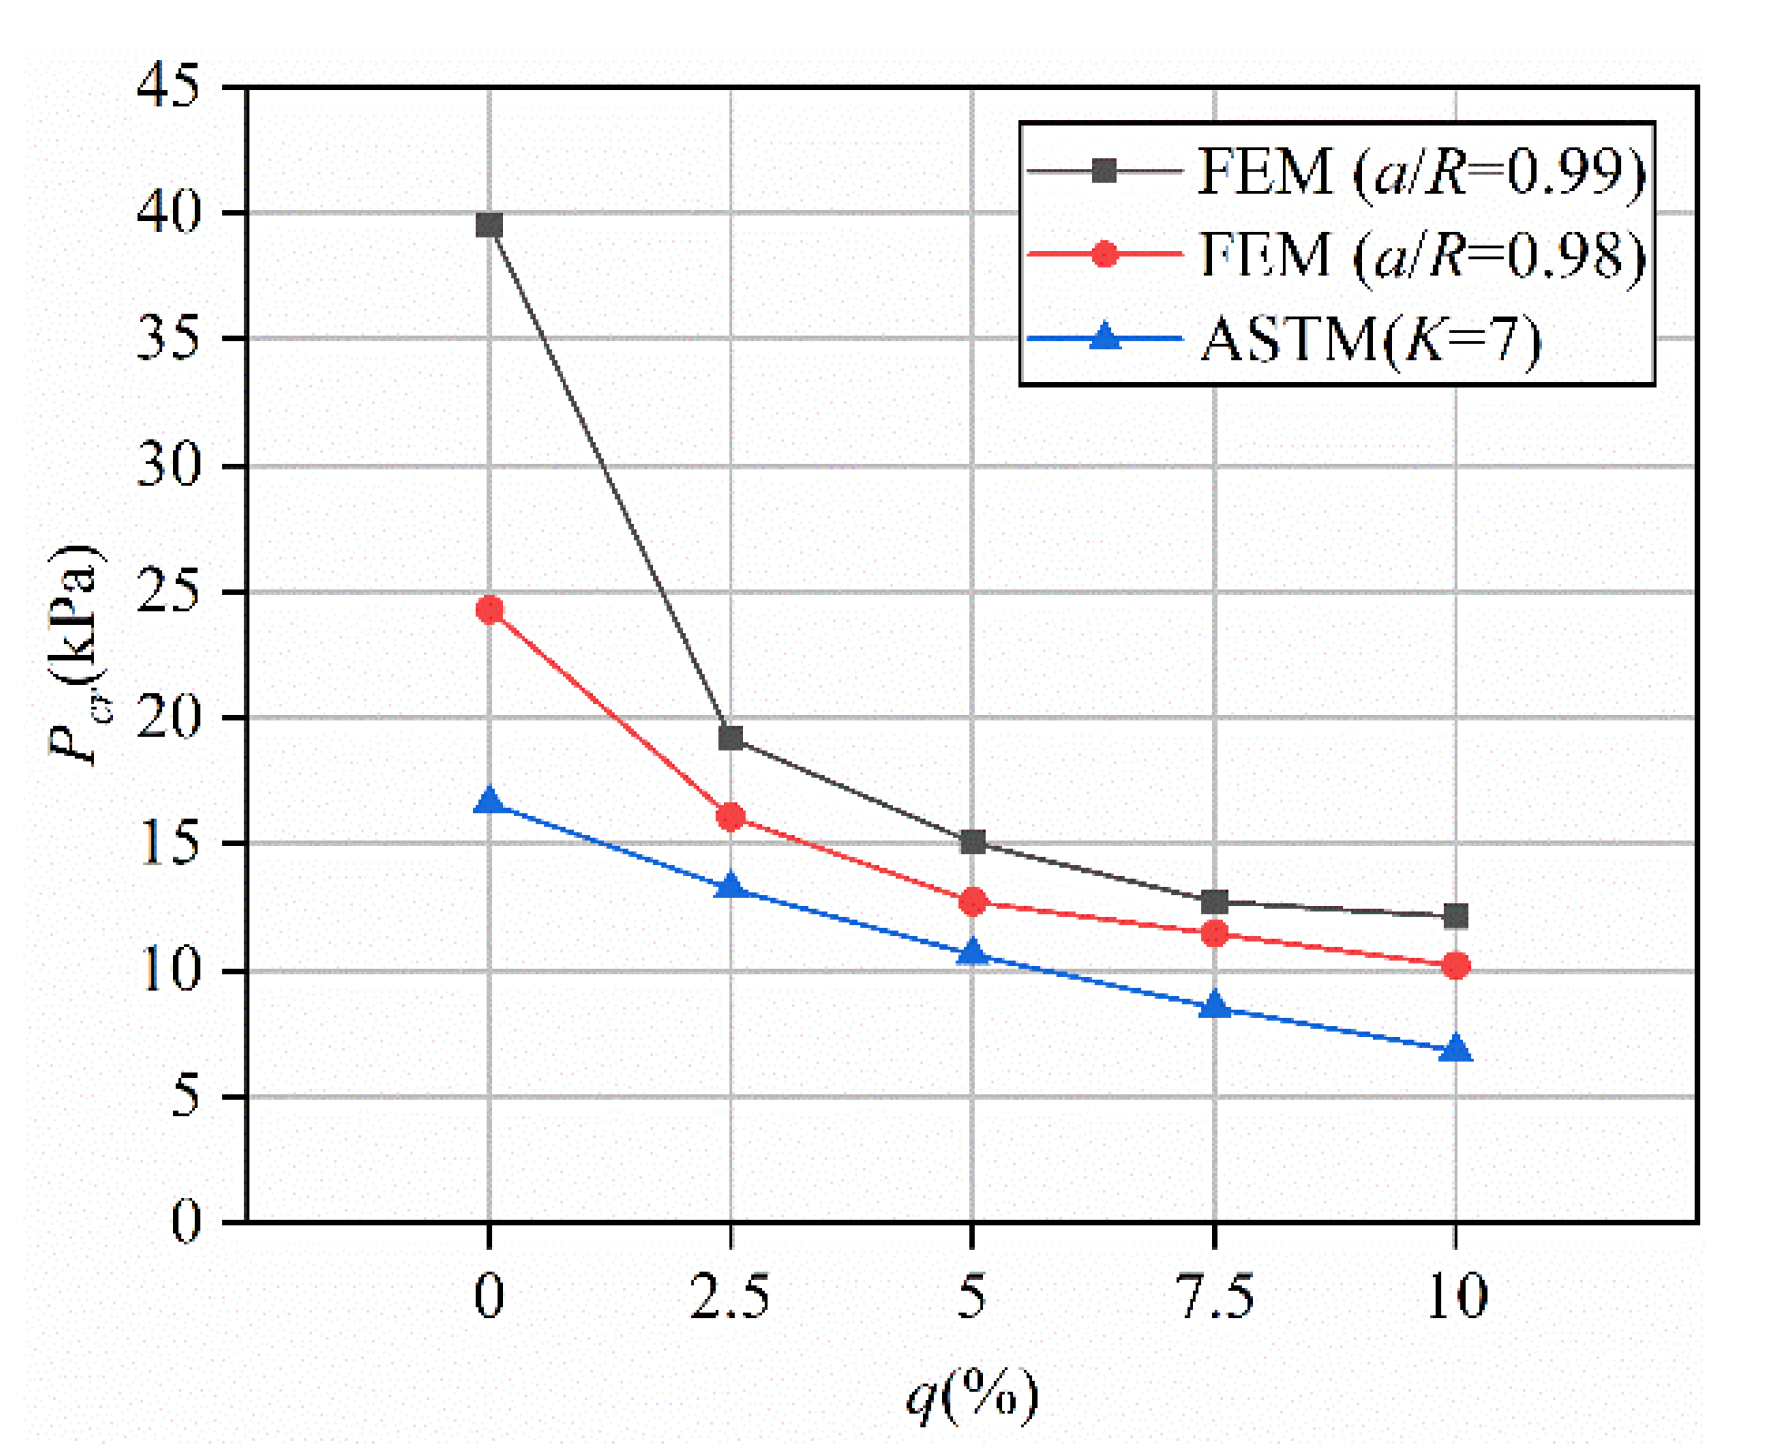
3.2.2. Effect of Ovality

The pressure versus displacement curves when the value of q is changed are shown in Figure 9. Similar to the effect caused by changing the value of DR on the buckling behavior, as the value of q increases, the critical buckling pressure of the liner decreases and the displacement of buckling lobe increases. Unlike the effect caused by the changing value of DR, the curves of Group C-6 in Figure 9a and Group D-6 in Figure 9b have distinct peaks compared to the other curves and the increasing rate of pressure in the pre-buckling equilibrium path and the decreasing rate of pressure in the post-buckling equilibrium path are significantly greater than the other groups. As the value of q increases, the curve peak is gradually less obvious and the effect of changing the liner cross-sectional shape from circular to elliptical on the buckling equilibrium path is greater than the effect of continuing to increase the value of q for elliptical cross-sections. The decreasing of the value of a/R has the greatest effect on the case where the liner cross-section is circular (q = 0); the critical buckling pressure decreases and the displacement of the buckling lobe increases, the increasing rate of pressure in the pre-buckling equilibrium path and the decreasing rate of pressure in the post- buckling equilibrium path decrease, but there are still obvious peaks in the curves.
The comparison of the critical buckling pressure between the numerical result and calculation results when the value of q is changed under a different value of a/R are shown in Figure 10. The critical buckling pressure of the simulation results are significantly greater than the calculation results. The greatest discrepancies are 22.92 kPa and 7.68 kPa, which occur at q = 0 when the a/R = 0.99 and a/R = 0.98. The reduction of the value of a/R diminishes the reduction effect caused by the changed value of q on the critical buckling pressure; the decreased rate of critical buckling pressure gradually decreases as the value of q is increasing. The critical buckling pressure of Group C-7 decreased 51.45% compared to Group C-6, while Group D-7 decreased 33.72% compared to Group D-6; the decreasing of the value of a/R will cause the reduction in the decreasing rate of critical buckling pressure under the same increment of the value of q.

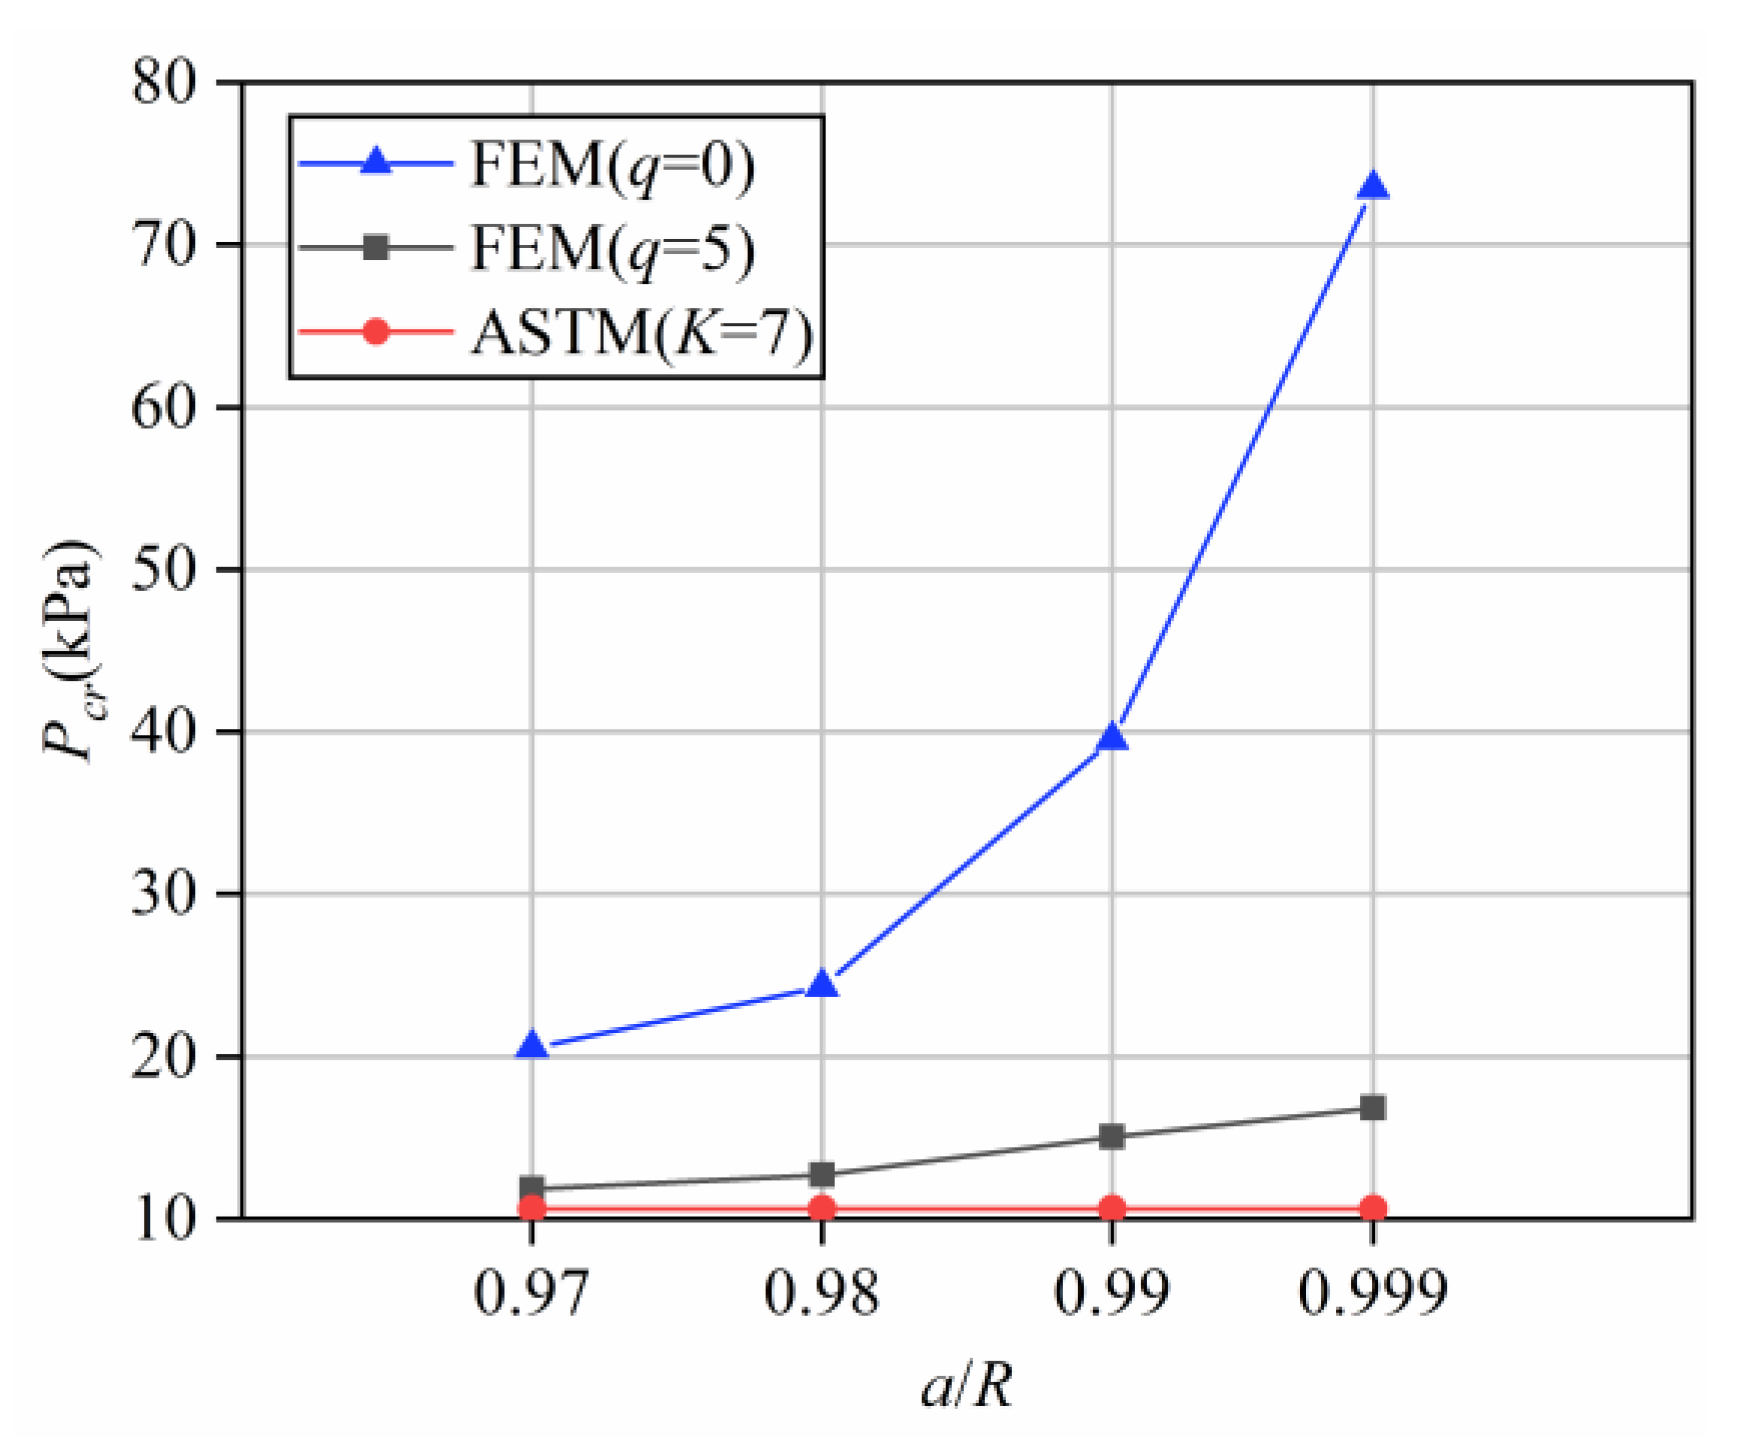
3.2.3. Effect of the Ratio of Liner Major Axis to Host Pipe Radius

The pressure versus displacement curves when the value of a/R is changed are shown in Figure 11. As the value of a/R increases, the critical buckling pressure of the liner decreases and the displacement of the buckling lobe increases. Comparing the curves in Figure 11a,b, it can be found that the critical buckling pressure of the circular liner (q = 0) is significantly higher than the elliptical liner (q = 2.5). The critical buckling pressure in Group C-6 decreased by 46.21% compared to Group B-2 and the displacement of the buckling lobe increased by 100.52%, while the critical buckling pressure in Group C-1 decreased by 10.64% compared to Group B-1 and the displacement of the buckling lobe increased by 21.77%. Apparently, the increase rate and decrease rate caused by the decrease of a/R during the buckling equilibrium path is greater when the liner cross-section is circular (q = 0) than when the liner cross-section is elliptical (q = 5). The deformation of the buckling lobe when Group B-2 and Group C-6 reach the critical buckling pressure is shown in Figure 12 and the stress in the tensile part of the liner does not change significantly but the range of the detached portion increases when the value of a/R decreases, which leads to the decrease in critical buckling pressure and increase in the displacement of the buckling lobe.
The comparison of the critical buckling pressure between numerical results and calculation results when the value of a/R is changed under different values of q is shown in Figure 13; the effect of the ratio of liner major axis to host pipe radius (a/R) in Equation (1) is ignored. However, the critical buckling pressure of the simulation results reduce by 33.95 kPa and 1.79 kPa under q = 0 and q = 5 when a/R changed from 0.999 to 0.99. The critical buckling pressure of the simulation results reduce by 3.77 kPa and 0.89 kPa under q = 0 and q = 5 when a/R changed from 0.99 to 0.98. The simulation results show that the critical buckling pressure of the liner decreases as the value of a/R is decreasing, while the reduction amount of the critical buckling pressure of the liner decreases due to the value of q increasing.

3.3. Quantification of Enhancement Factor

The parameters in Table 1 are brought into Equation (1) to find that the critical buckling pressure value deviates significantly. The sensitivity of different parameters to the critical buckling pressure of the liner was analyzed in Section 3.2. Figure 8, Figure 10 and Figure 13 show the deviates of critical buckling pressure values between the calculation results and simulation results, which indicate that the enhancement factor K is significantly relevant with the values of DR, a/R and q. DR, a/R and q are used as variables and a polynomial fit is performed based on the numerical results to obtain a prediction model for enhancement factor K as in Equation (2). For simplification of Equation (2), a/R is replaced by Δ, as shown in Equation (3).
KΔ = 37.94DR1/2Δ3/2 − 170.9Δ1/2q1/2 − 0.000069DR2 + 11561Δ2 + 0.0964q2 + 0.1068q − 36.522DR1/2 − 44831Δ1/2 + 162.57q1/2 + 33287
Δ = a/R
The comparison between the results calculated by Equation (1) and the result calculated after using the enhancement factor KΔ is shown in Figure 14 and after revising the enhancement factor K, the calculation results are more accurate and fit better with the numerical results and the average difference rate between predicted results and numerical results was reduced from 23.43% to 5.52%.

4. Conclusions

In this paper, the buckling behavior of a loosely fitted FIPP liner under external pressure was investigated experimentally; the sensitivity of the critical buckling pressure of the loosely fitted FIPP liner to different parameters was investigated by 2D finite element model and a prediction method of the critical buckling pressure was proposed. Based on the results, the following conclusions can be obtained.
(1) A loosely fitted FIPP liner will float under the action of buoyancy. While rotation may occur, the buckling lobe of the initial elliptical liner is likely to appear in the direction of the short axis of the liner cross-section when the pressure reaches the critical buckling pressure, the buckling lobe will move in the axial direction, the buckling part has not had plastic deformation and the liner will rebound after the movement of the buckling lobe.
(2) Through test and simulation, results indicate that the value of critical buckling pressure calculated by the equation from ASTM 1216 is significantly lower than the results under working conditions. The difference in the critical buckling pressure between the calculated result and actual result will increase when the installation condition of the liner is closed to the tightly fitted status.
(3) The decrease in the value of a/R causes a change in the contact conditions between the liner and the host pipe under the loosely fitted condition, the increase in the gap between the liner and the host pipe will lead to the movement of the contact point between the liner and the original pipe and the range of the buckling portion increases under external pressure conditions, resulting in a reduction in the critical buckling pressure.
(4) The effects of changes in the dimensional parameters of the liner on the critical buckling pressure are not independent of each other. With the determined value of DR, a decrease in the value of a/R will diminish the effect of DR and q on the critical buckling pressure, while an increase in the value of q will diminish the effect of a/R on the critical buckling pressure with the determined value of DR. Considering the interaction between the dimensional parameters, a polynomial fit is used to propose the equation for the enhancement factor KΔ and the average difference rate was reduced from 23.43% to 5.52%.
The present study only considers 2D plane conditions; any possible deformation in the axial direction is ignored, while the possible rotation of the liner under the water pressure is also ignored and the results are idealized. Future research can focus on the buckling behavior of the FIPP liner which is suspended in the host pipe under water pressure and not in contact with the inner surface of the host pipe.

Author Contributions

Conceptualization, Z.Z., X.Y. and S.T.A.; methodology, Z.Z. and Y.Z.; software, Z.Z. and Y.Z.; validation, X.Y. and W.X.; formal analysis, Z.Z.; investigation, X.Y. and S.T.A.; resources, X.Y. and S.T.A.; data curation, W.X. and Z.Z.; writing—original draft preparation, Z.Z.; writing—review and editing, S.T.A., Y.Z. and X.Y.; visualization, Z.Z.; supervision, X.Y.; project administration, X.Y.; funding acquisition, X.Y. All authors have read and agreed to the published version of the manuscript.

Funding

This research was funded by the National Natural Science Foundation of China under grant (No. 42002284) and Zhejiang Provincial Natural Science Foundation of China under grant (No. LGG20E080005).

Institutional Review Board Statement

Not applicable.

Informed Consent Statement

Not applicable.

Data Availability Statement

Data are contained within the article.

Conflicts of Interest

The authors declare no conflict of interest.

Appendix A

The followings are the interaction properties and loads settings request by Riks step:
** INTERACTION PROPERTIES
**
*Surface Interaction, name = IntProp-1
1,
*Friction, slip tolerance = 0.005
0.6,
*Surface Behavior, pressure-overclosure = HARD
**
** LOADS
**
** Name: Buckling Type: Pressure
*Dsload
_PickedSurf13, P, 0.1
** Name: Deflec Type: Concentrated force
*Cload
_PickedSet23, 2, 0.5

References

  1. Amaechi, C.V.; Chesterton, C.; Butler, H.O.; Wang, F.; Ye, J. Review on the Design and Mechanics of Bonded Marine Hoses for Catenary Anchor Leg Mooring (CALM) Buoys. Ocean Eng. 2021, 242, 110062. [Google Scholar] [CrossRef]
  2. de Alegría, I.M.; Martín, J.L.; Kortabarria, I.; Andreu, J.; Ereño, P.I. Transmission Alternatives for Offshore Electrical Power. Renew. Sustain. Energy Rev. 2009, 13, 1027–1038. [Google Scholar] [CrossRef]
  3. Zhang, X.; Qi, Y.; Wang, Y.; Wu, J.; Lin, L.; Peng, H.; Qi, H.; Yu, X.; Zhang, Y. Effect of the Tap Water Supply System on China’s Economy and Energy Consumption, and Its Emissions’ Impact. Renew. Sustain. Energy Rev. 2016, 64, 660–671. [Google Scholar] [CrossRef]
  4. Rashid, S.S.; Liu, Y.-Q. Assessing Environmental Impacts of Large Centralized Wastewater Treatment Plants with Combined or Separate Sewer Systems in Dry/Wet Seasons by Using LCA. Env. Sci Pollut Res 2020, 27, 15674–15690. [Google Scholar] [CrossRef] [PubMed] [Green Version]
  5. Barbier, E.B.; Chaudhry, A.M. Urban Growth and Water. Water Resour. Econ. 2014, 6, 1–17. [Google Scholar] [CrossRef]
  6. Iurchenko, V.; Lebedeva, E.; Brigada, E. Environmental Safety of the Sewage Disposal by the Sewerage Pipelines. Procedia Eng. 2016, 134, 181–186. [Google Scholar] [CrossRef]
  7. Ma, B.; Najafi, M. Development and Applications of Trenchless Technology in China. Tunn. Undergr. Space Technol. 2008, 23, 476–480. [Google Scholar] [CrossRef]
  8. Najafi, M.; Gokhale, S.; Calderón, D.R.; Ma, B. Trenchless Technology: Pipeline and Utility Design, Construction, and Renewal, 2nd ed.; McGraw-Hill Education: New York, NY, USA, 2021; ISBN 978-1-260-45873-2. [Google Scholar]
  9. He, C.; Yan, X.; Ma, B.; Zhao, W.; Zhao, Y. Experimental and Numerical Simulation of Formed-in-Place Pipe Liner for Repairing Water Mains with Void. Tunn. Undergr. Space Technol. 2022, 130, 104752. [Google Scholar] [CrossRef]
  10. Timoshenko, S.; Gere, J.; Prager, W. Theory of Elastic Stability. J. Appl. Mech. 1962, 29, 220. [Google Scholar] [CrossRef]
  11. Glock, D. Post-Critical Behavior of a Rigidly Encased Circular Pipe Subject to External Water Pressure and Temperature Rise. Der Stahlbau 1977, 46, 212–217. [Google Scholar]
  12. Aggarwal, S.; Cooper, M. External Pressure Testing of Insituform Lining. Coventry Polytech. Coventry UK Intern. Rep. 1984. [Google Scholar]
  13. ASTM F1216–09; Standard Practice for Rehabilitation of Existing Pipelines and Conduits by the Inversion and Curing of a Resin–Impregnated Tube. ASTM International: West Conshohocken, PA, USA, 2009.
  14. Lo, K.H.; Zhang, J.Q. Collapse Resistance Modeling of Encased Pipes. ASTM Spec. Tech. Publ. 1994, 1222, 97. [Google Scholar]
  15. El-Sawy, K.; Moore, I.D. Stability of Loosely Fitted Liners Used to Rehabilitate Rigid Pipes. J. Struct. Eng. 1998, 124, 1350–1357. [Google Scholar] [CrossRef]
  16. Zhao, Y.; Ma, B.; Ariaratnam, S.T.; Yan, X.; Xiang, W.; Zhu, Z.; Li, Z.; Moghbel Esfahani, M. Buckling Behaviour of Internal Stiffened Thin-Walled Stainless Steel Liners under External Constraints. Tunn. Undergr. Space Technol. 2022, 129, 104685. [Google Scholar] [CrossRef]
  17. El-Sawy, K.M.; Elshafei, A.L. Neural Network for the Estimation of the Inelastic Buckling Pressure of Loosely Fitted Liners Used for Rigid Pipe Rehabilitation. Thin-Walled Struct. 2003, 41, 785–800. [Google Scholar] [CrossRef]
  18. Dong, S.; Zhou, W.; Zhang, H.; Ma, B. An Updated Structure for a Stainless Steel Liner and the Estimation of Its Buckling Strength. Tunn. Undergr. Space Technol. 2018, 72, 9–16. [Google Scholar] [CrossRef]
  19. Wang, J.H.; Koizumi, A. Experimental Investigation of Buckling Collapse of Encased Liners Subjected to External Water Pressure. Eng. Struct. 2017, 151, 44–56. [Google Scholar] [CrossRef]
  20. Li, Z.; Tang, F.; Chen, Y.; Zou, X. Stability of the Pipe-Liner System with a Grouting Void Surrounded by the Saturated Soil. Eng. Struct. 2019, 196, 109284. [Google Scholar] [CrossRef]
  21. El-Sawy, K.M. Inelastic Stability of Liners of Cylindrical Conduits with Local Imperfection under External Pressure. Tunn. Undergr. Space Technol. 2013, 33, 98–110. [Google Scholar] [CrossRef]
  22. Treitz, J.; Lan, H.; Moore, I.D.; Hoult, N.A. Testing and Analysis of PVC Liners under Simulated Grouting Pressure. Eng. Struct. 2022, 250, 113496. [Google Scholar] [CrossRef]
  23. Jiao, P.; Chen, Z.; Ma, H.; Zhang, D.; Ge, P. Buckling Analysis of Thin Rectangular FG-CNTRC Plate Subjected to Arbitrarily Distributed Partial Edge Compression Loads Based on Differential Quadrature Method. Thin-Walled Struct. 2019, 145, 106417. [Google Scholar] [CrossRef]
  24. Kabir, H.; Aghdam, M.M. A Robust Bézier Based Solution for Nonlinear Vibration and Post-Buckling of Random Checkerboard Graphene Nano-Platelets Reinforced Composite Beams. Compos. Struct. 2019, 212, 184–198. [Google Scholar] [CrossRef]
Figure 1. Experimental system design and geometric dimensions of equipment.
Applsci 13 00679 g001
Figure 2. The element mesh of FIPP and steel pipe model.
Applsci 13 00679 g002
Figure 3. The condition of (a) boundary and (b) load distribution.
Applsci 13 00679 g003
Figure 4. True stress versus true strain curve of FIPP material.
Applsci 13 00679 g004
Figure 5. Comparing the pressure–displacement curves of test and simulation divided into floating stage (AB), buckling stage (BC) and failure stage (CD).
Applsci 13 00679 g005
Figure 6. Comparing the deformation status of buckling liners at (a) point A; (b) point B; (c) point C; (d) point D marked in Figure 5.
Applsci 13 00679 g006aApplsci 13 00679 g006b
Figure 7. The pressure–displacement curves of FIPP liner with different DR under (a) a/R = 0.99; (b) a/R = 0.98.
Applsci 13 00679 g007
Figure 8. Comparing the influence of increasing DR for critical buckling pressure under different a/R.
Applsci 13 00679 g008
Figure 9. The pressure–displacement curves of FIPP liner with different q under (a) a/R = 0.99; (b) a/R = 0.98.
Applsci 13 00679 g009
Figure 10. Comparing the influence of increasing q for critical buckling pressure under different a/R.
Applsci 13 00679 g010
Figure 11. The pressure–displacement curves of FIPP liner with different a/R under (a) q = 0; (b) q = 5.
Applsci 13 00679 g011
Figure 12. The stress distribution of (a) Sample B-2; (b) Sample C-6 under the critical buckling pressure.
Applsci 13 00679 g012
Figure 13. Comparing the influence of increasing a/R for critical buckling pressure under different q.
Applsci 13 00679 g013
Figure 14. Comparing the critical buckling pressure between the simulation result and result calculated by the prediction model.
Applsci 13 00679 g014
Table 1. Geometrical dimensions of FIPP liner and host pipe.
Length/mmInternal Radius/mmWall Thickness/mm
Major AxisMinor Axis
FIPP2000309.85287.157.95
The host pipe200031810
Table 2. Geometric parameters of the numerical model.
No.a/RqDR
A0.9743.875
B-10.9995100
B-20.9990100
C-10.995100
C-20.995150
C-30.995200
C-40.995250
C-50.995300
C-60.990100
C-70.992.5100
C-80.997.5100
C-90.9910100
D-10.985100
D-20.985150
D-30.985200
D-40.985250
D-50.985300
D-60.980100
D-70.982.5100
D-80.987.5100
D-90.9810100
E-10.975100
E-20.970100
Table 3. Mechanical properties of FIPP liner and host pipe.
MaterialsModulus of Elasticity (MPa)Poisson’s RatioBending Strength
Steel pipe190,0000.3/
FIPP2089.90.362
Disclaimer/Publisher’s Note: The statements, opinions and data contained in all publications are solely those of the individual author(s) and contributor(s) and not of MDPI and/or the editor(s). MDPI and/or the editor(s) disclaim responsibility for any injury to people or property resulting from any ideas, methods, instructions or products referred to in the content.

