
Comparative Assessment of Variable Loads and Seismic Actions on Bridges: A Case Study in Italy Using a Multimodal Approach

Abstract
:1. Introduction
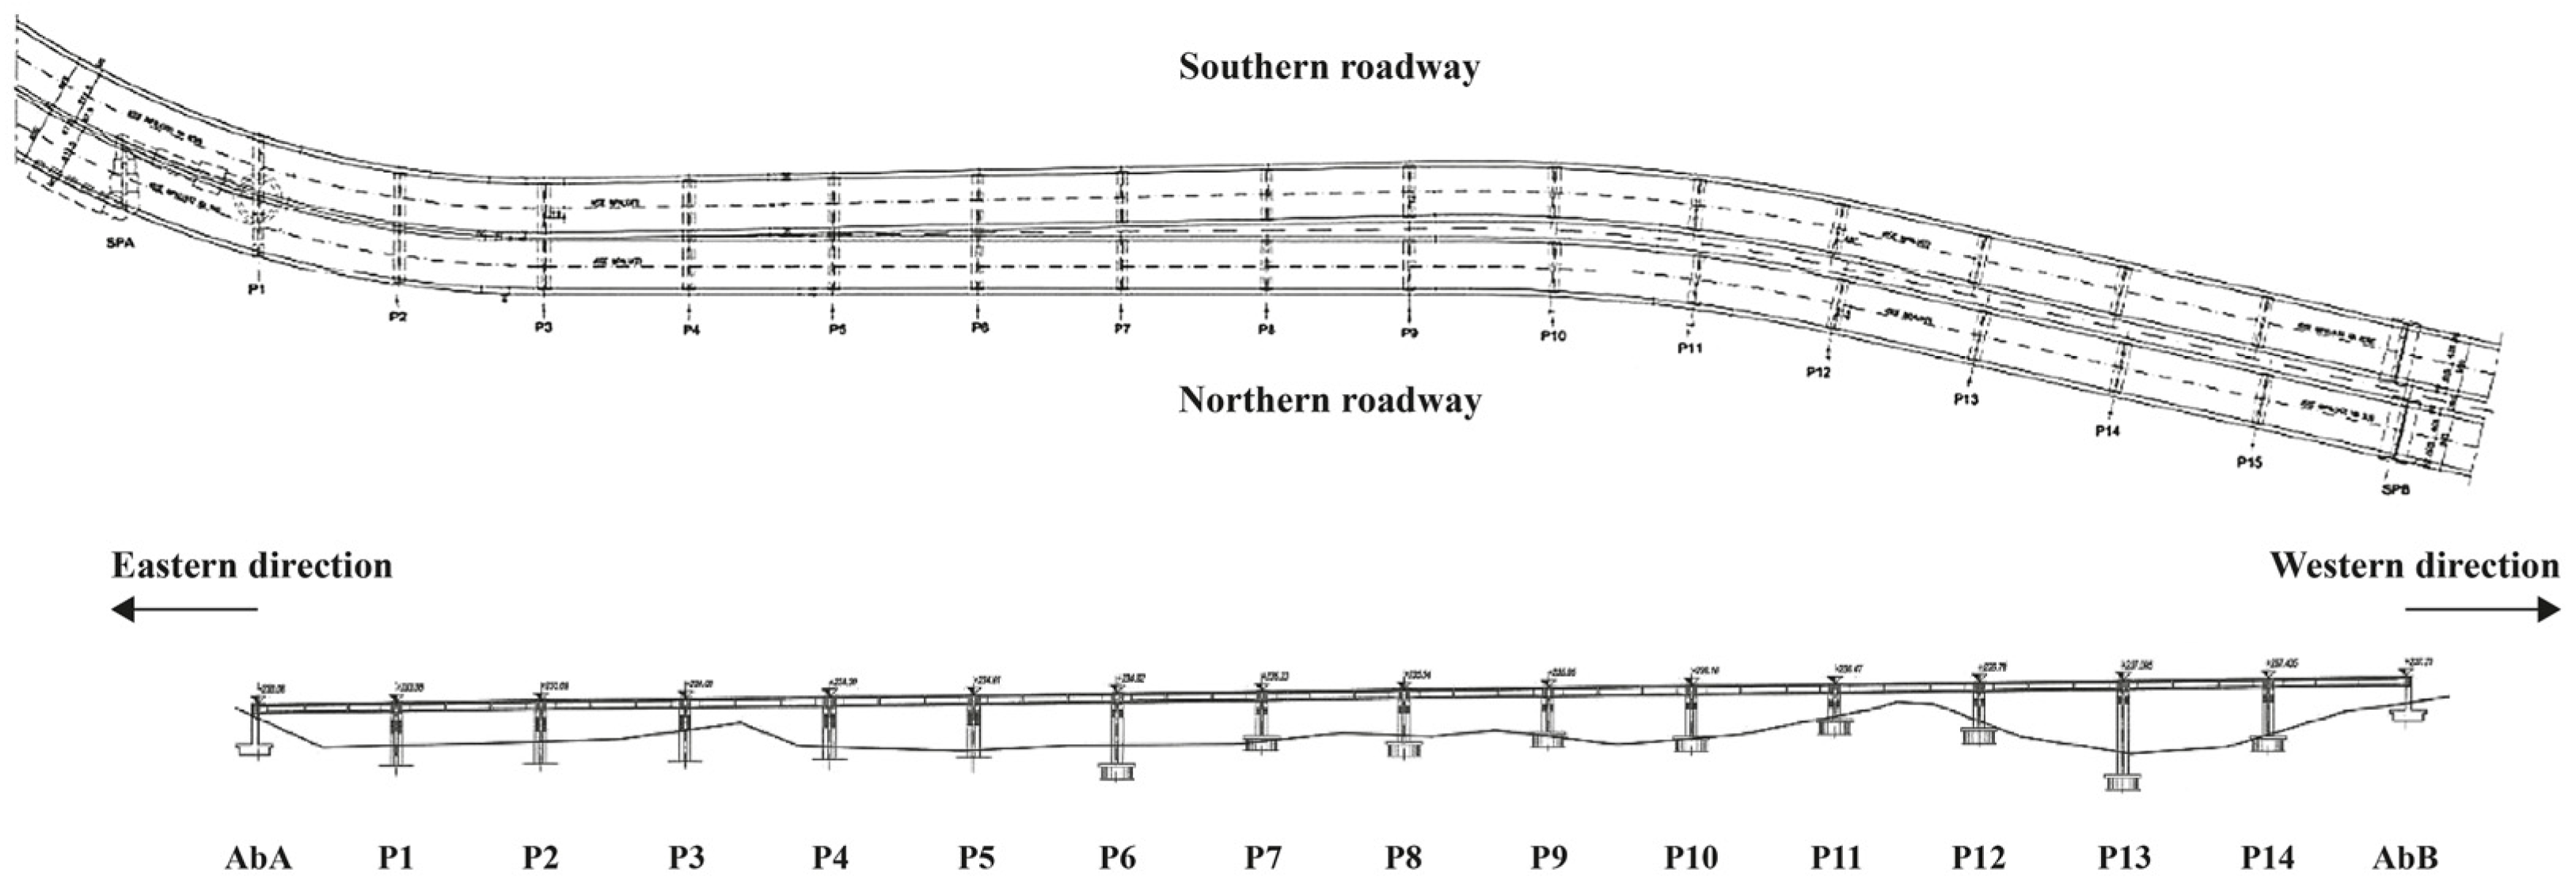
2. Case Study Description
3. Seismic Input, Load Scenarios and Analyses
3.1. Nonlinear-Static Analysis (NLSA—Multimodal Pushover Analysis or MMPO)
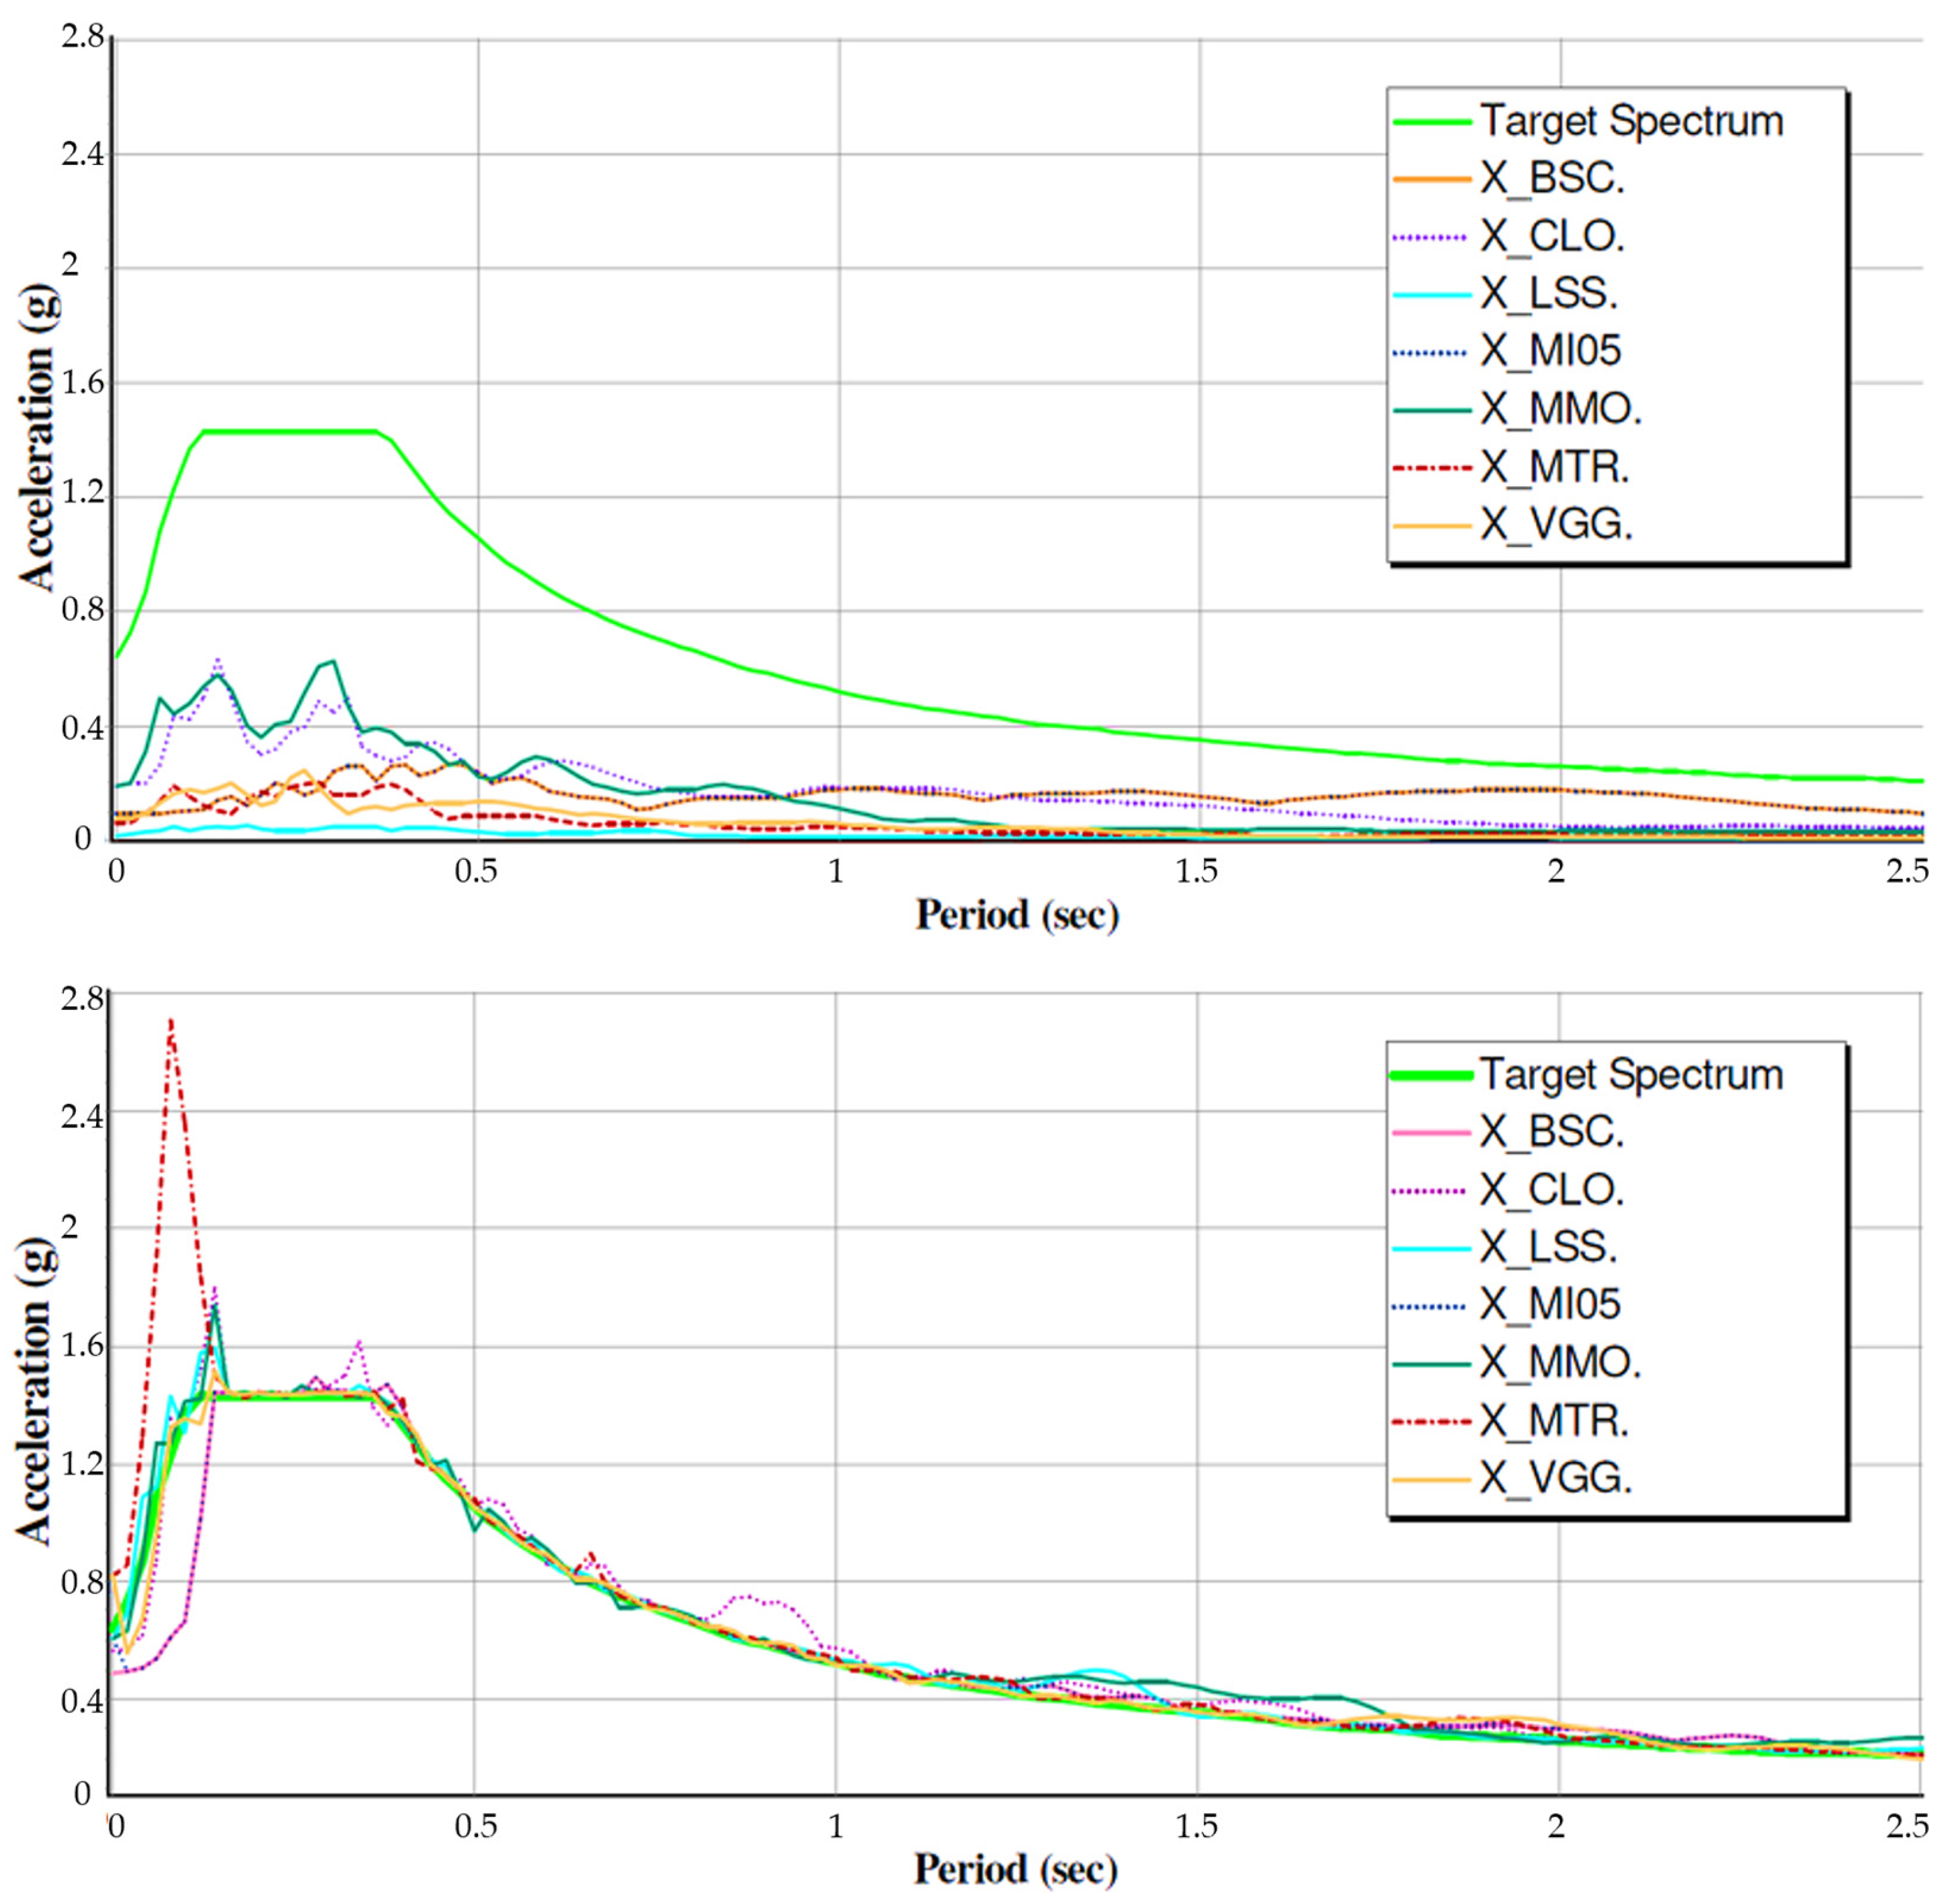
- calculation of the response spectra of the input selected accelerograms (seven in total);
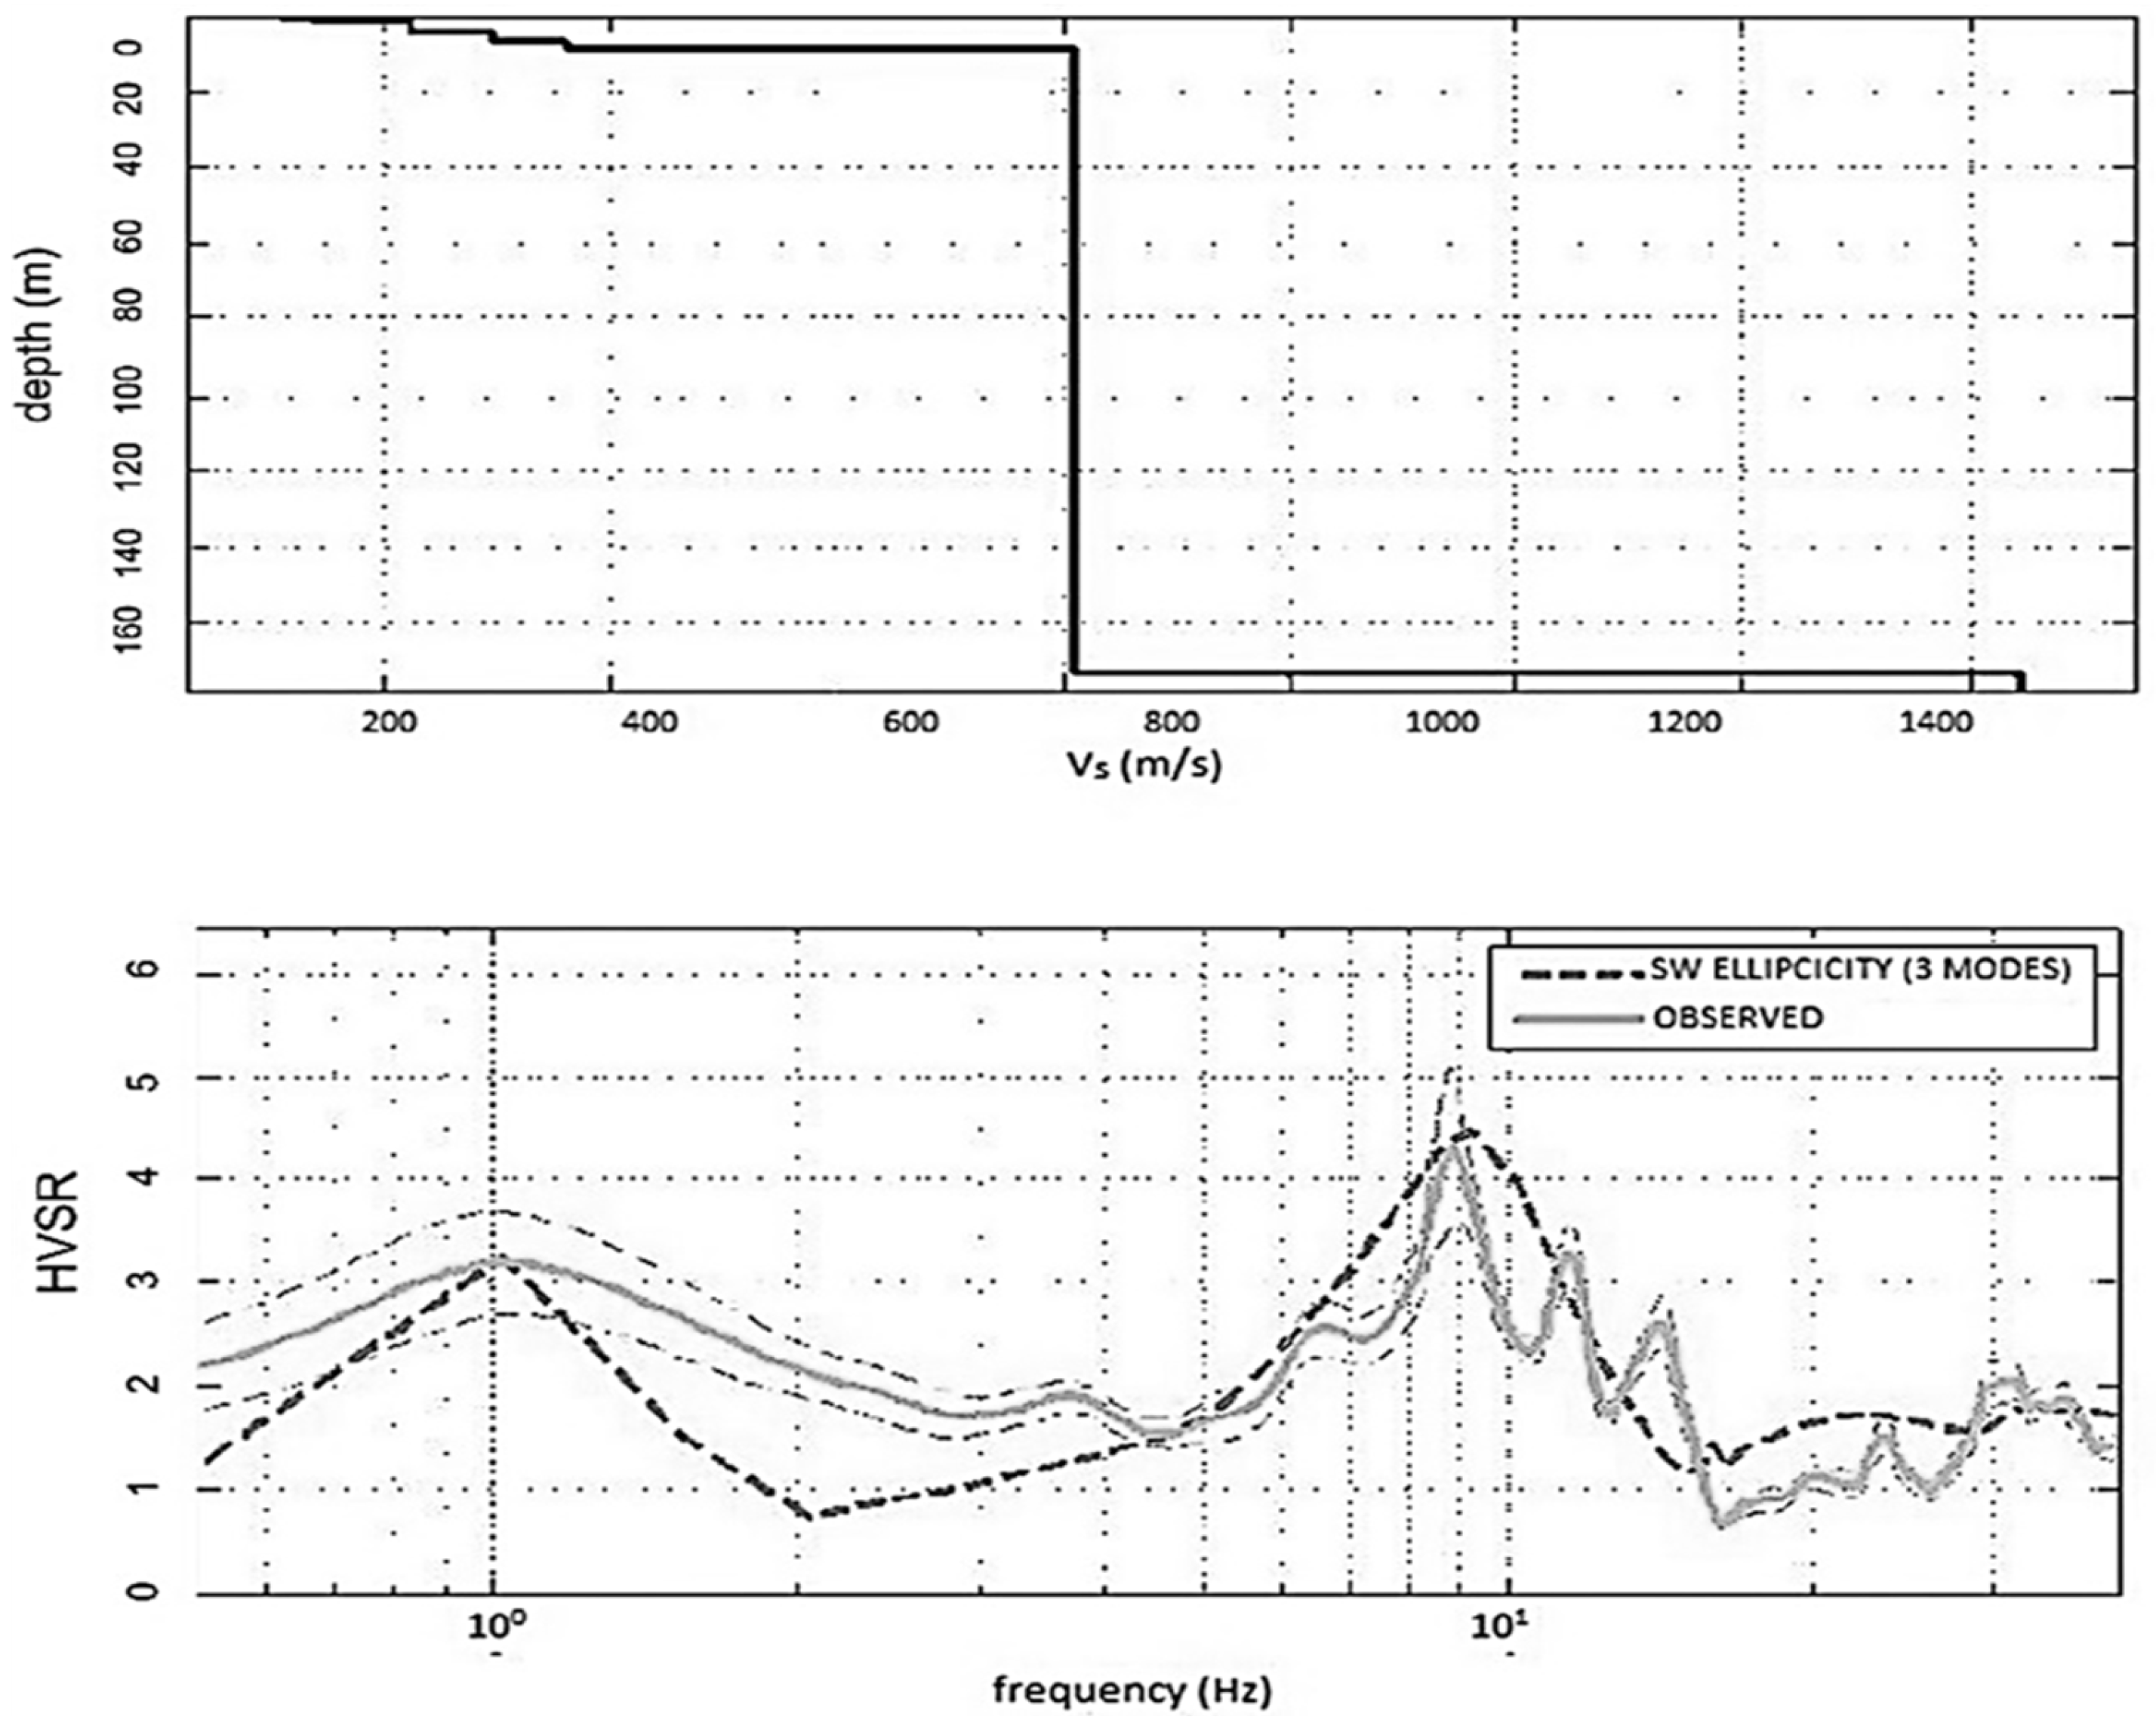
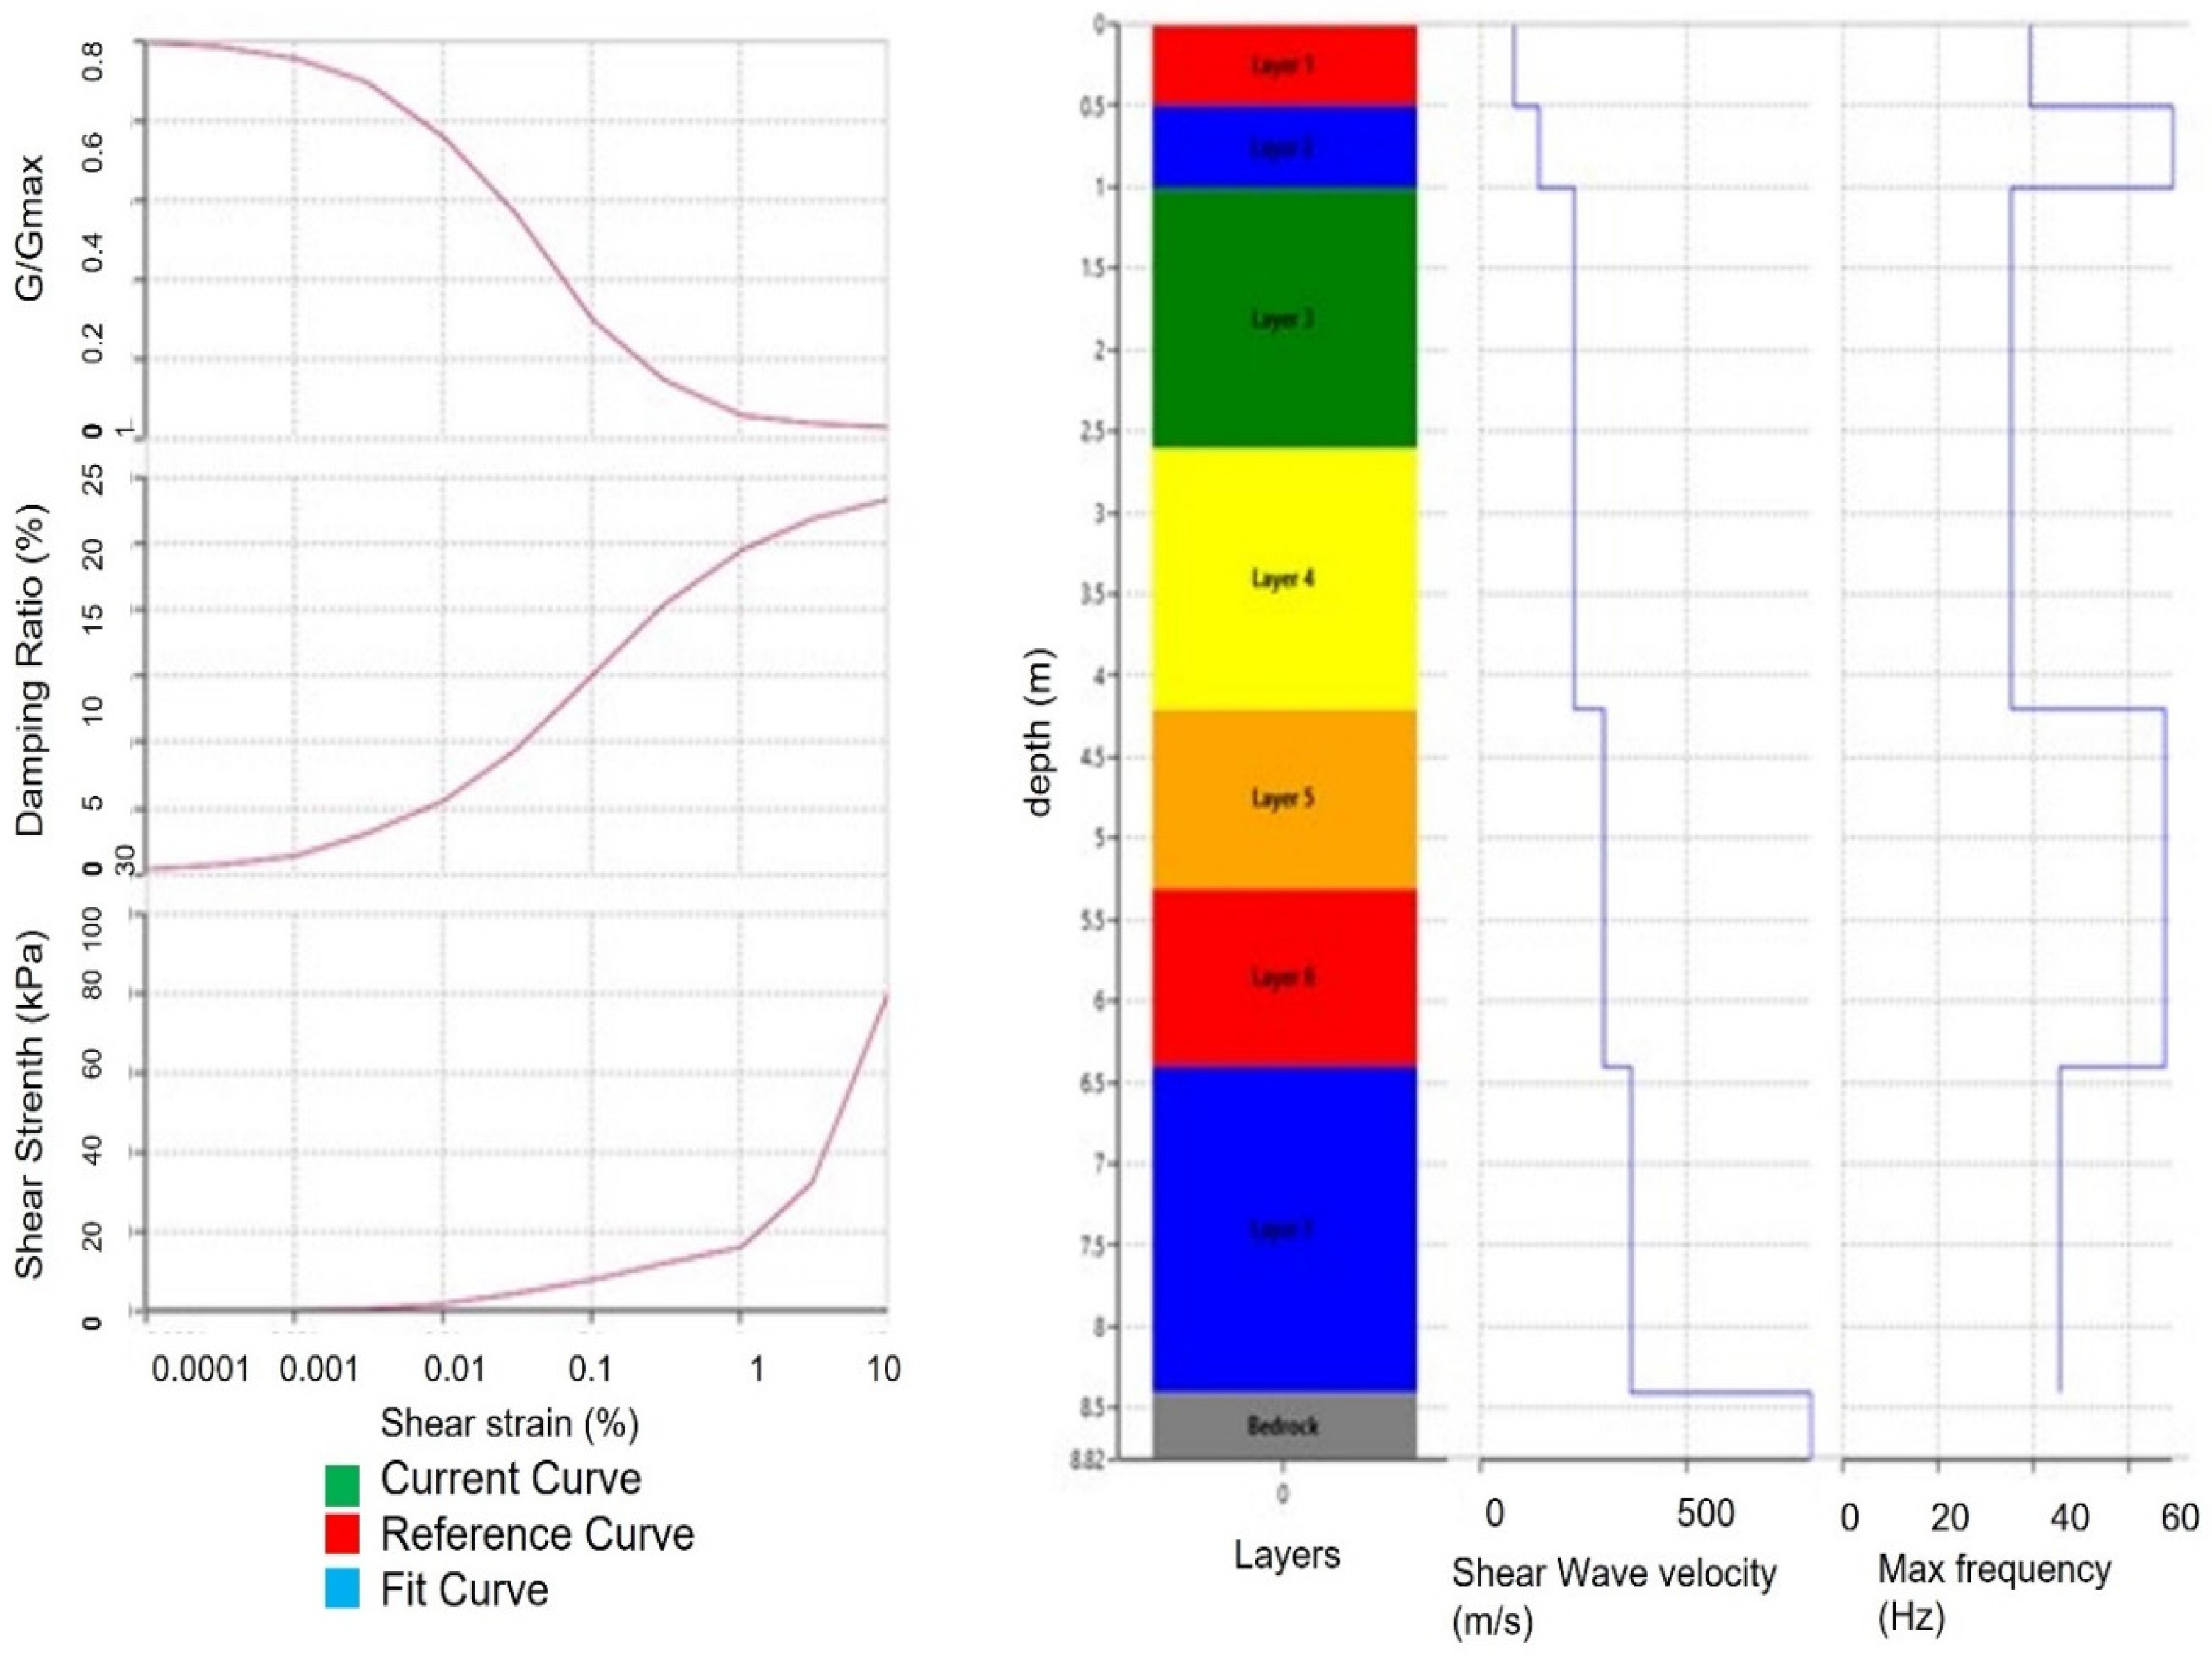
- application of the local seismic response analysis (soil layer response) through the modelling carried out (Figure 4);
- calculation of the response spectra of the output accelerograms related to the surface soil layer response;
- calculation of the spectral amplification factors for discrete points (as the period T varies) relative to the same accelerogram, ;
- calculation of the mean of the amplification factors (for each single period T) relative to the seven accelerograms;
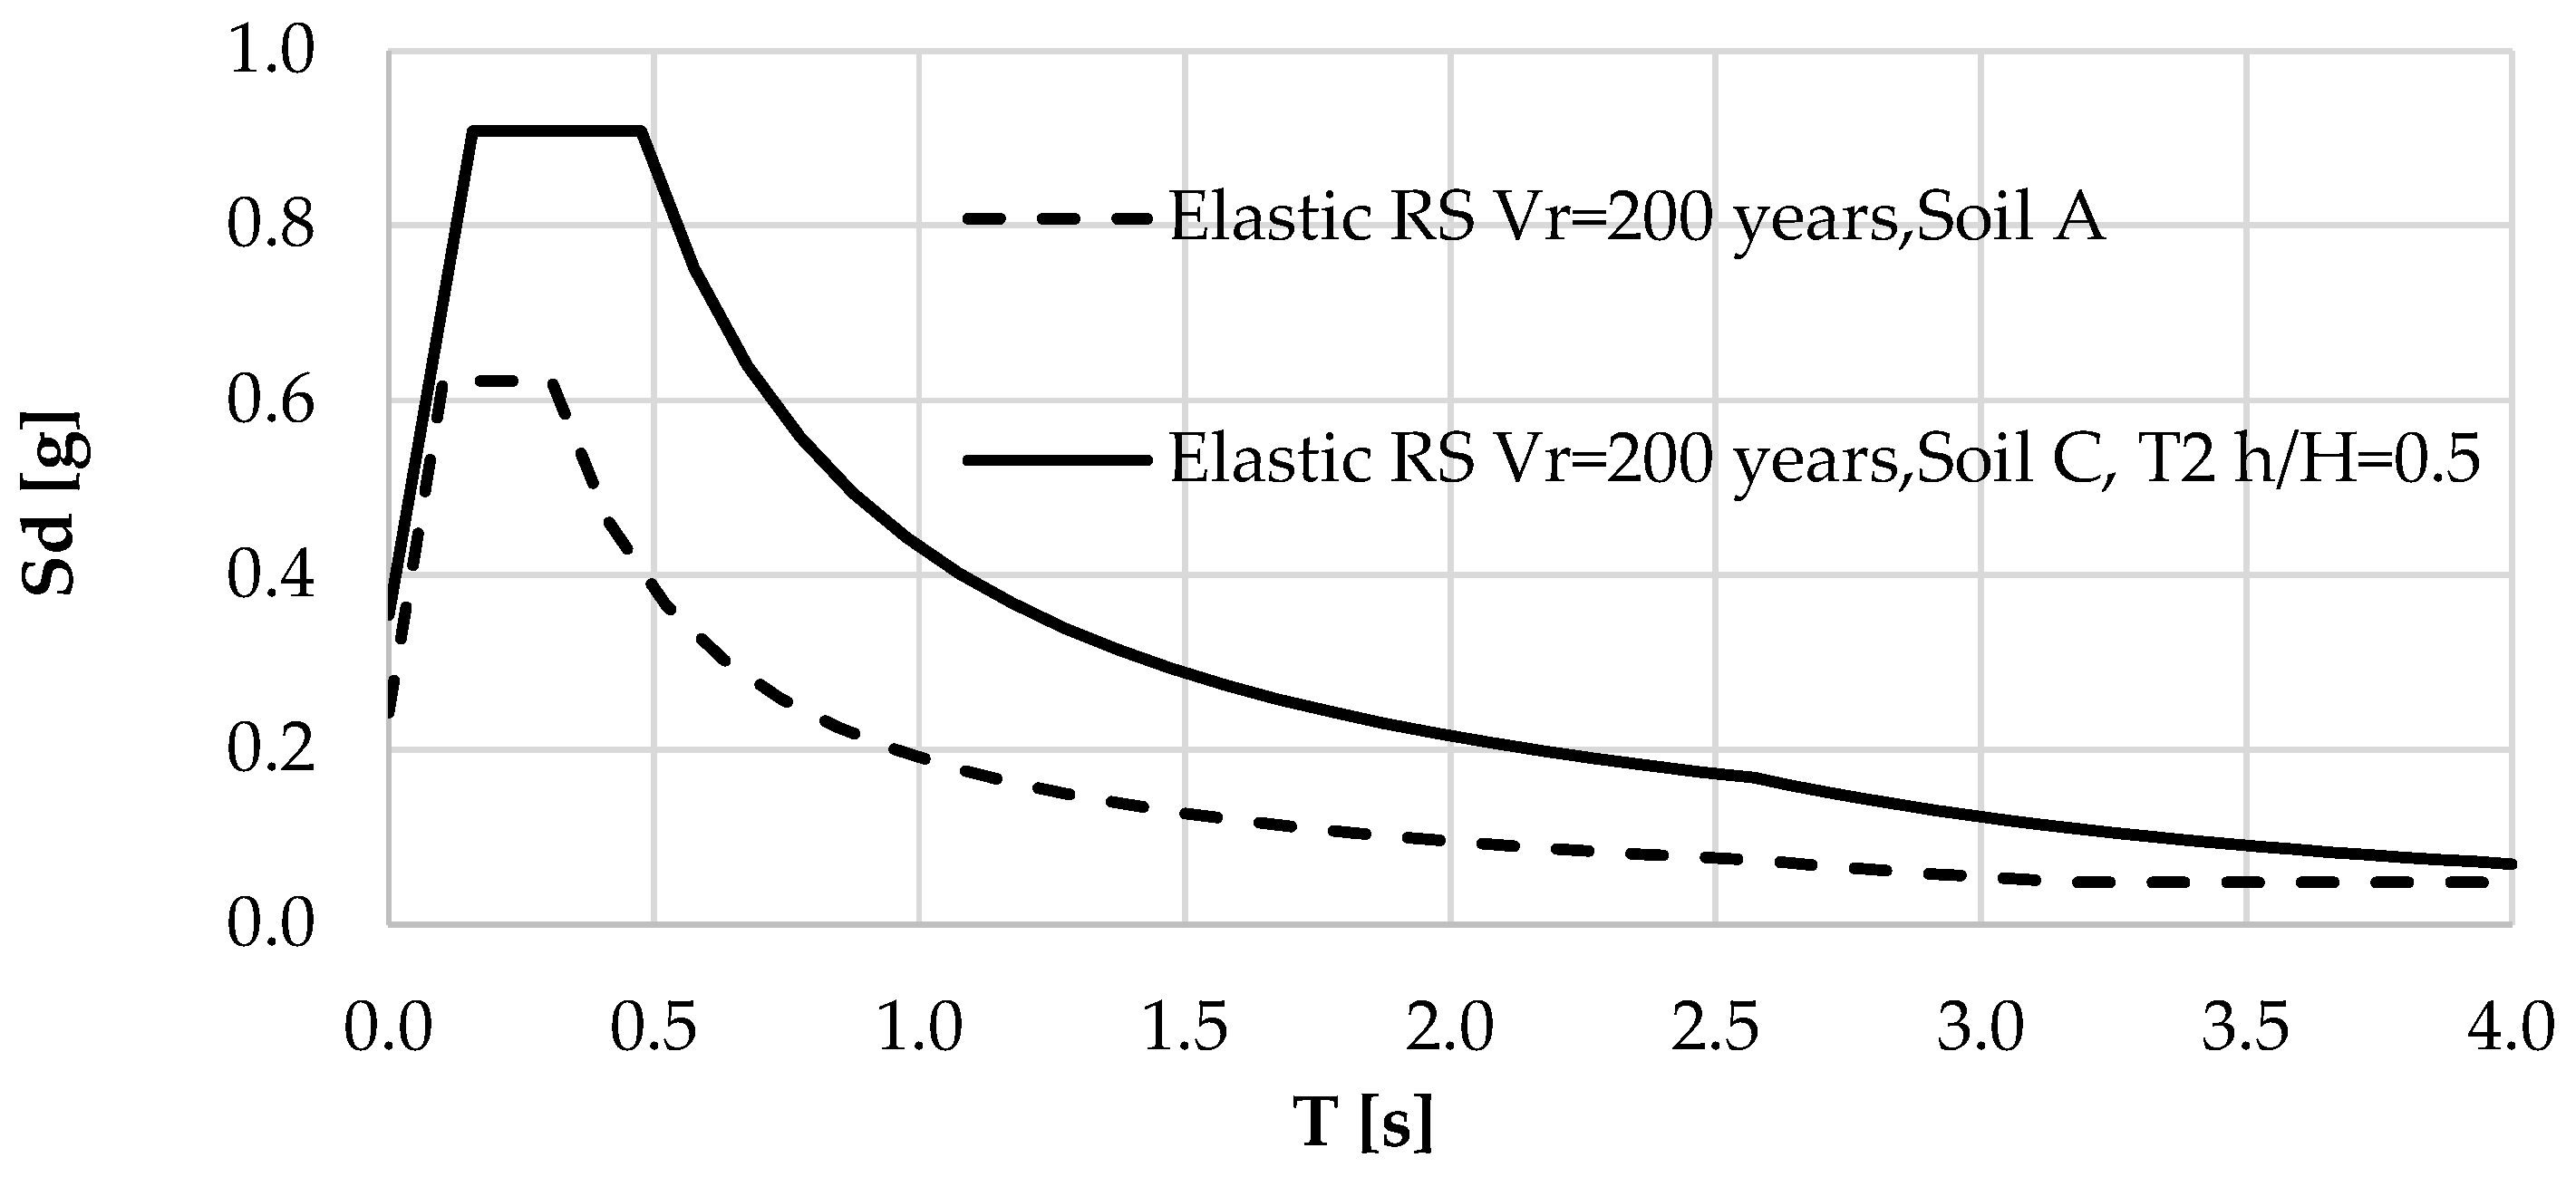
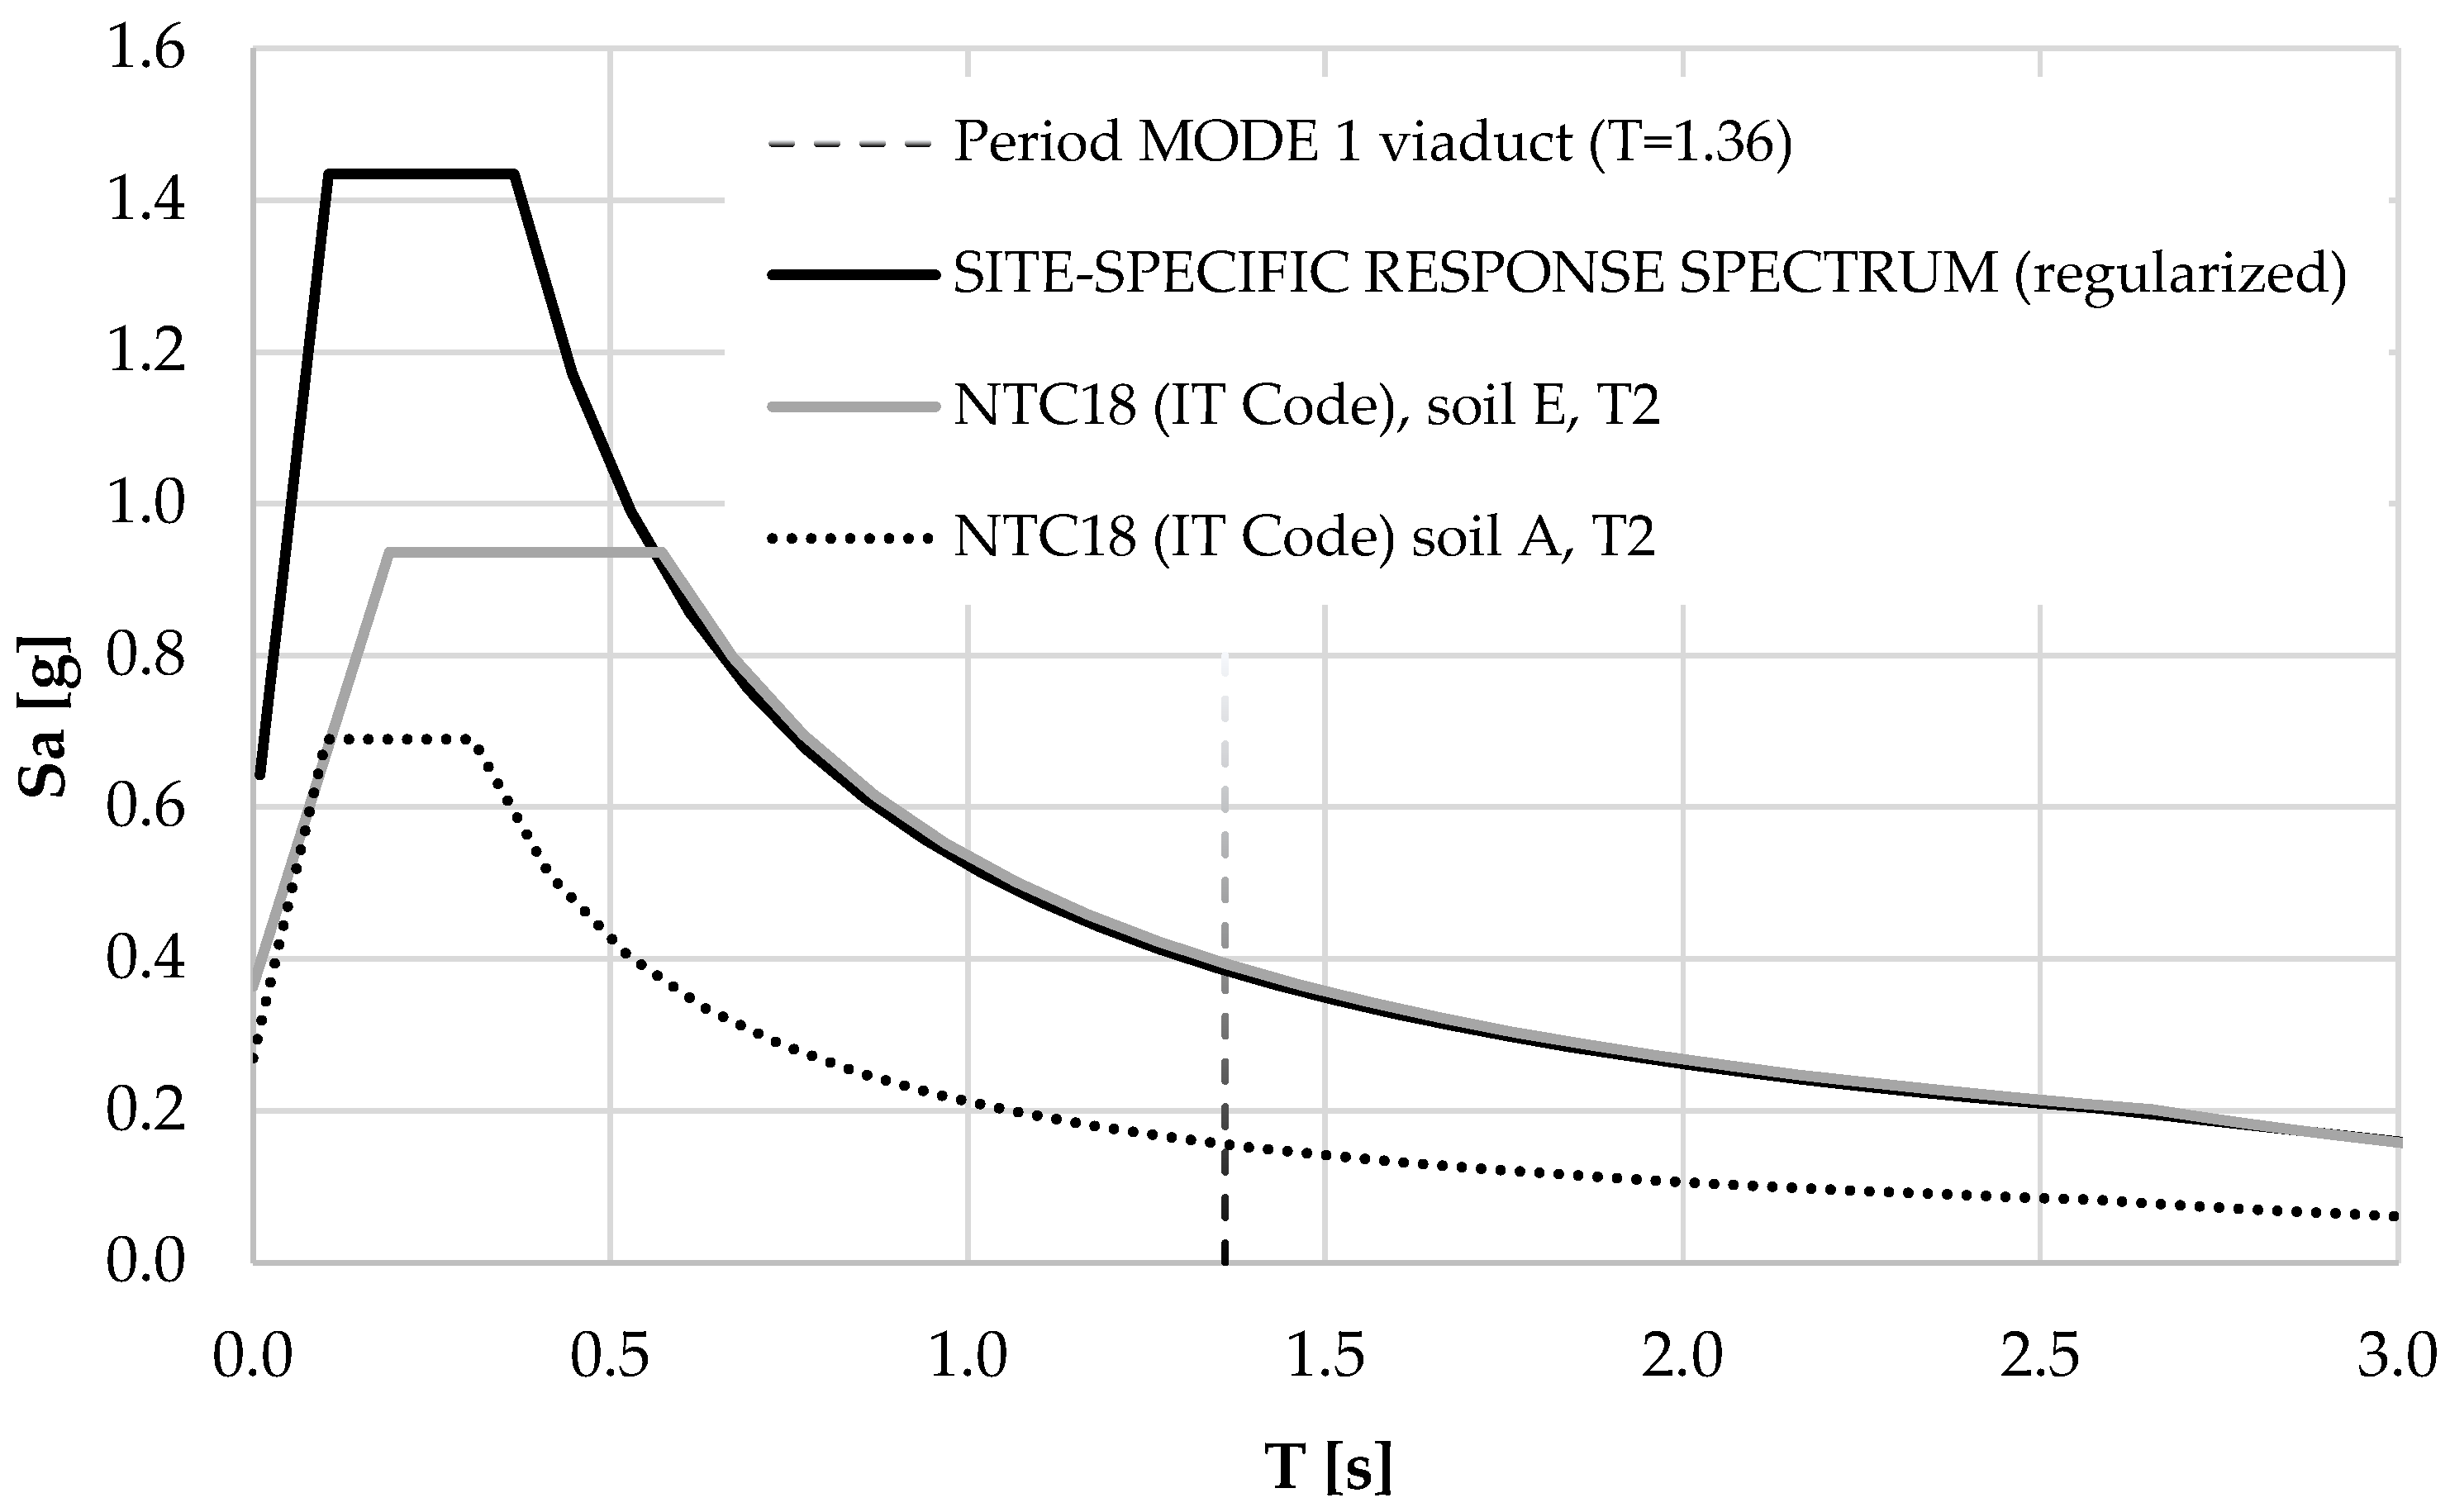
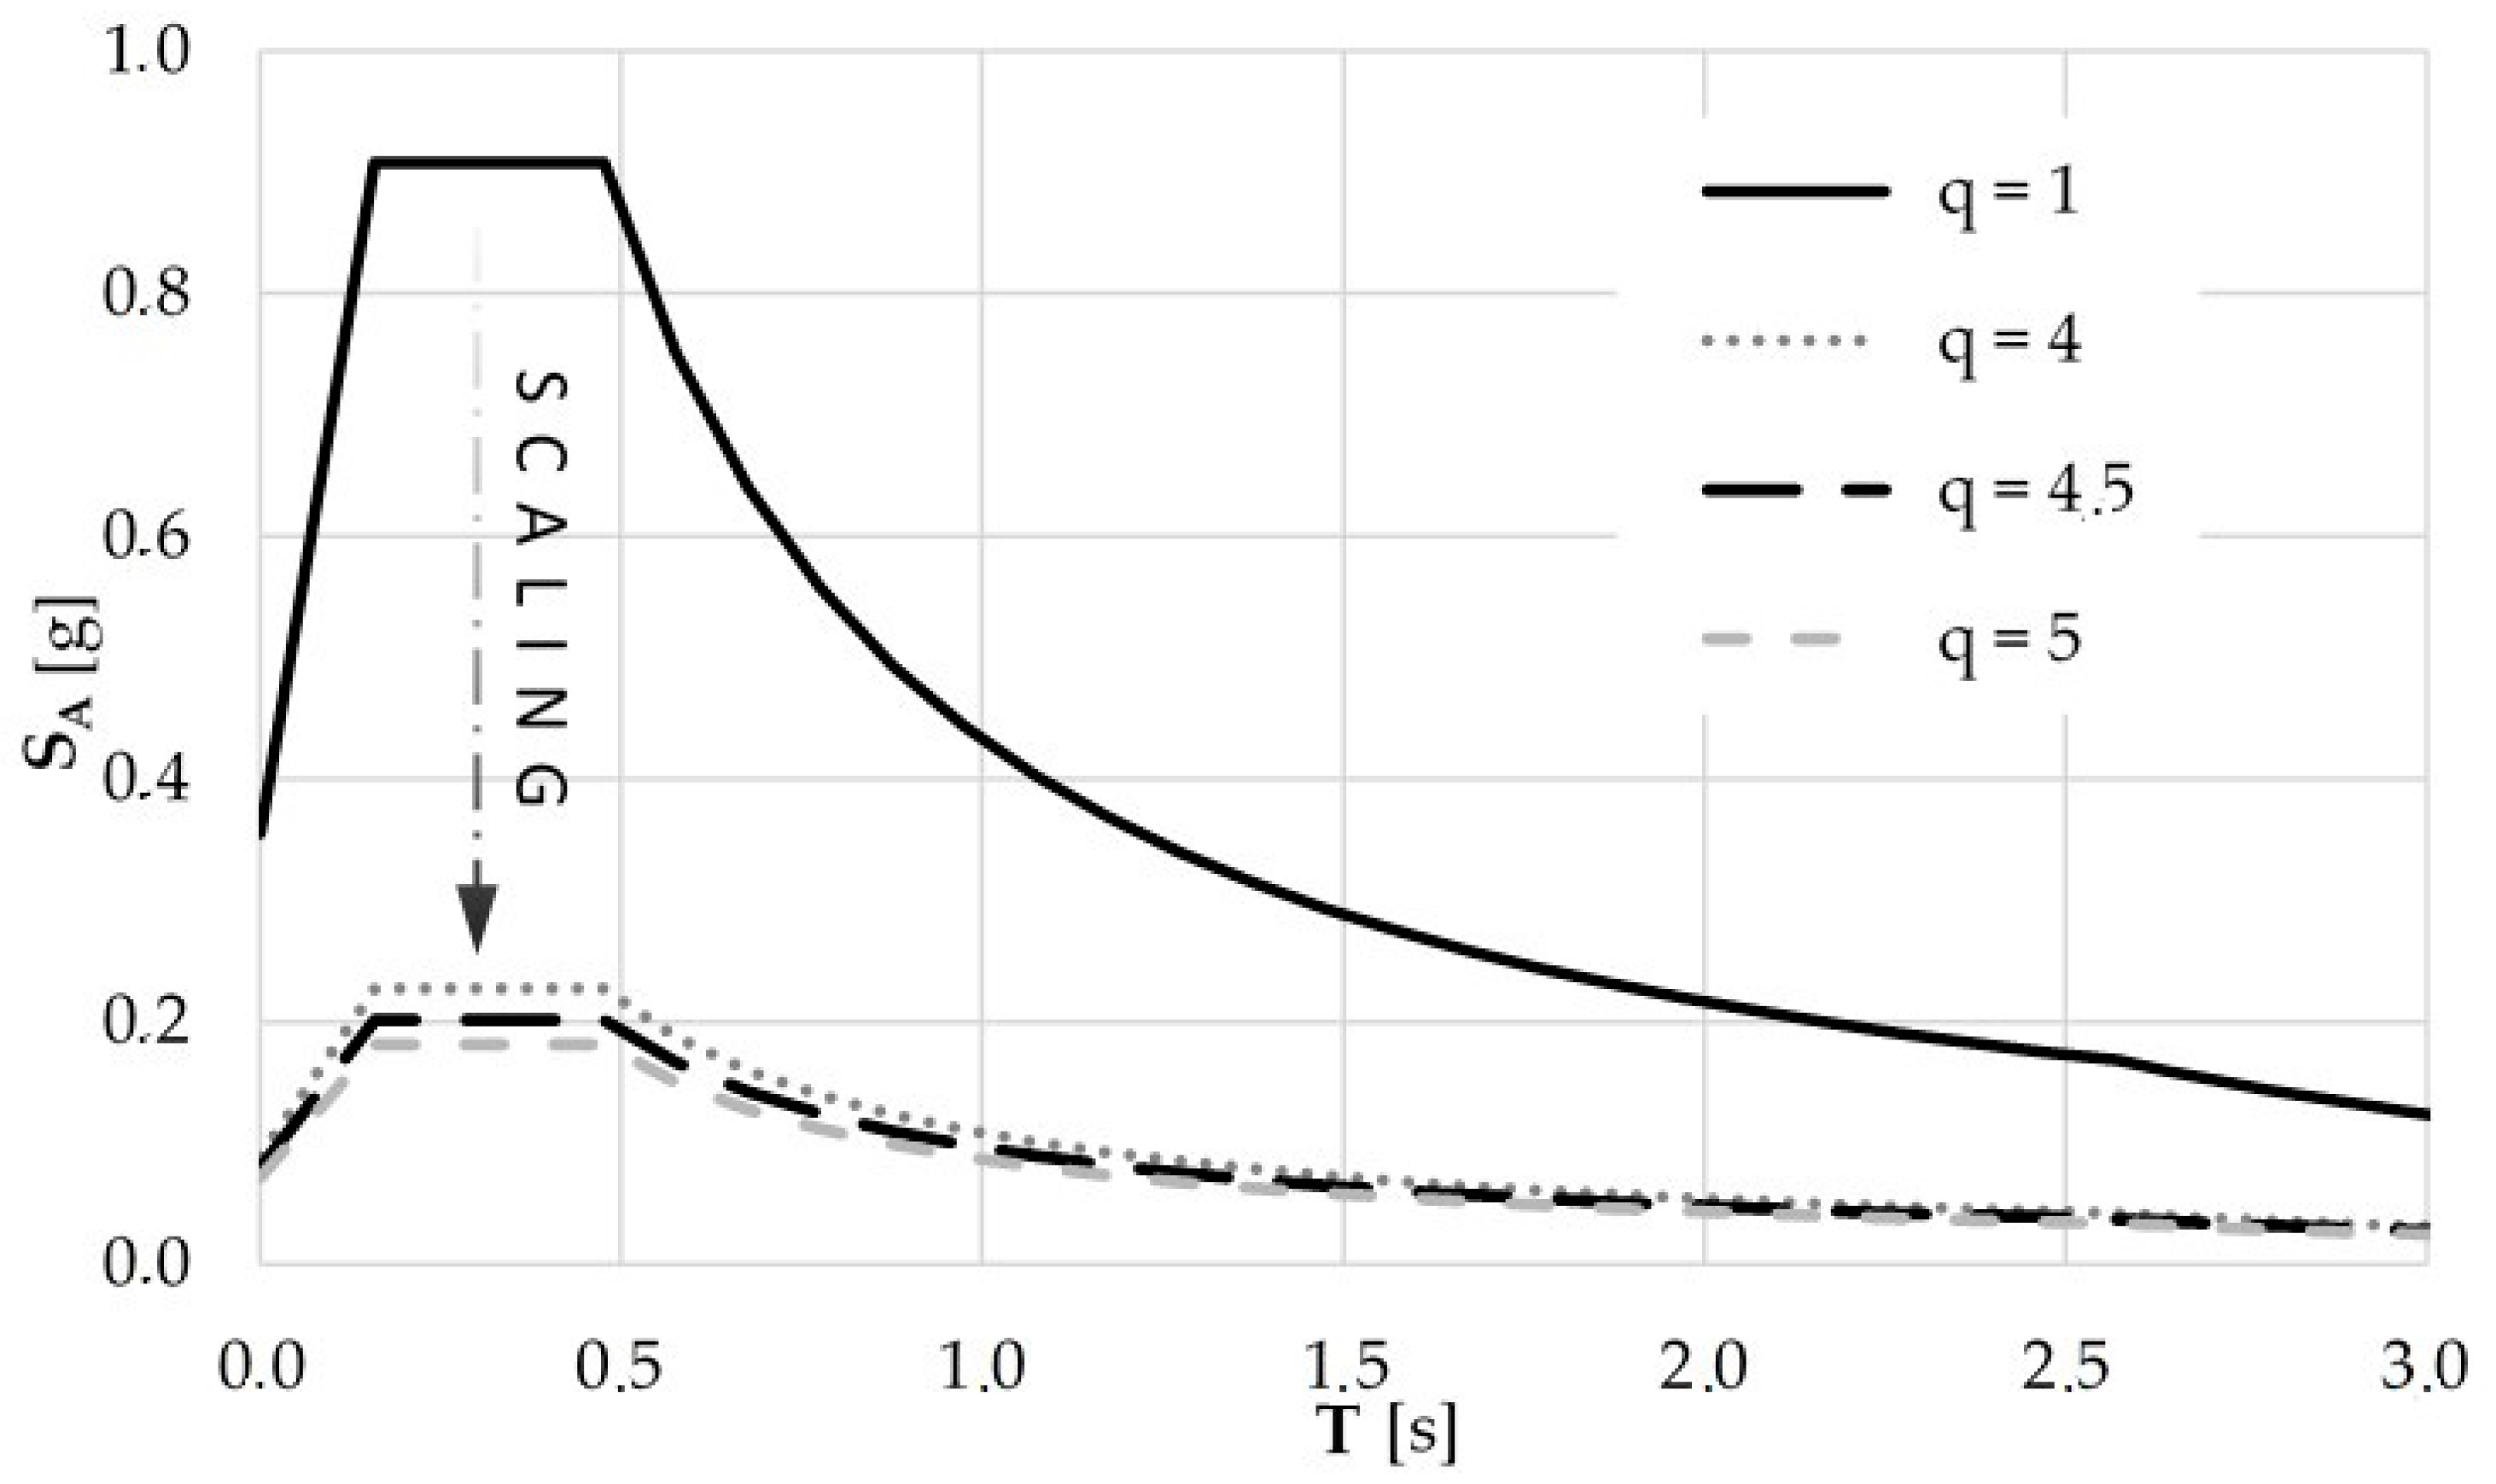
- calculation of the code response spectrum on rock (cat. A, according to [41]) magnified with respect to the amplification factors of the single value of T (for discrete periods) calculated above in step 5;
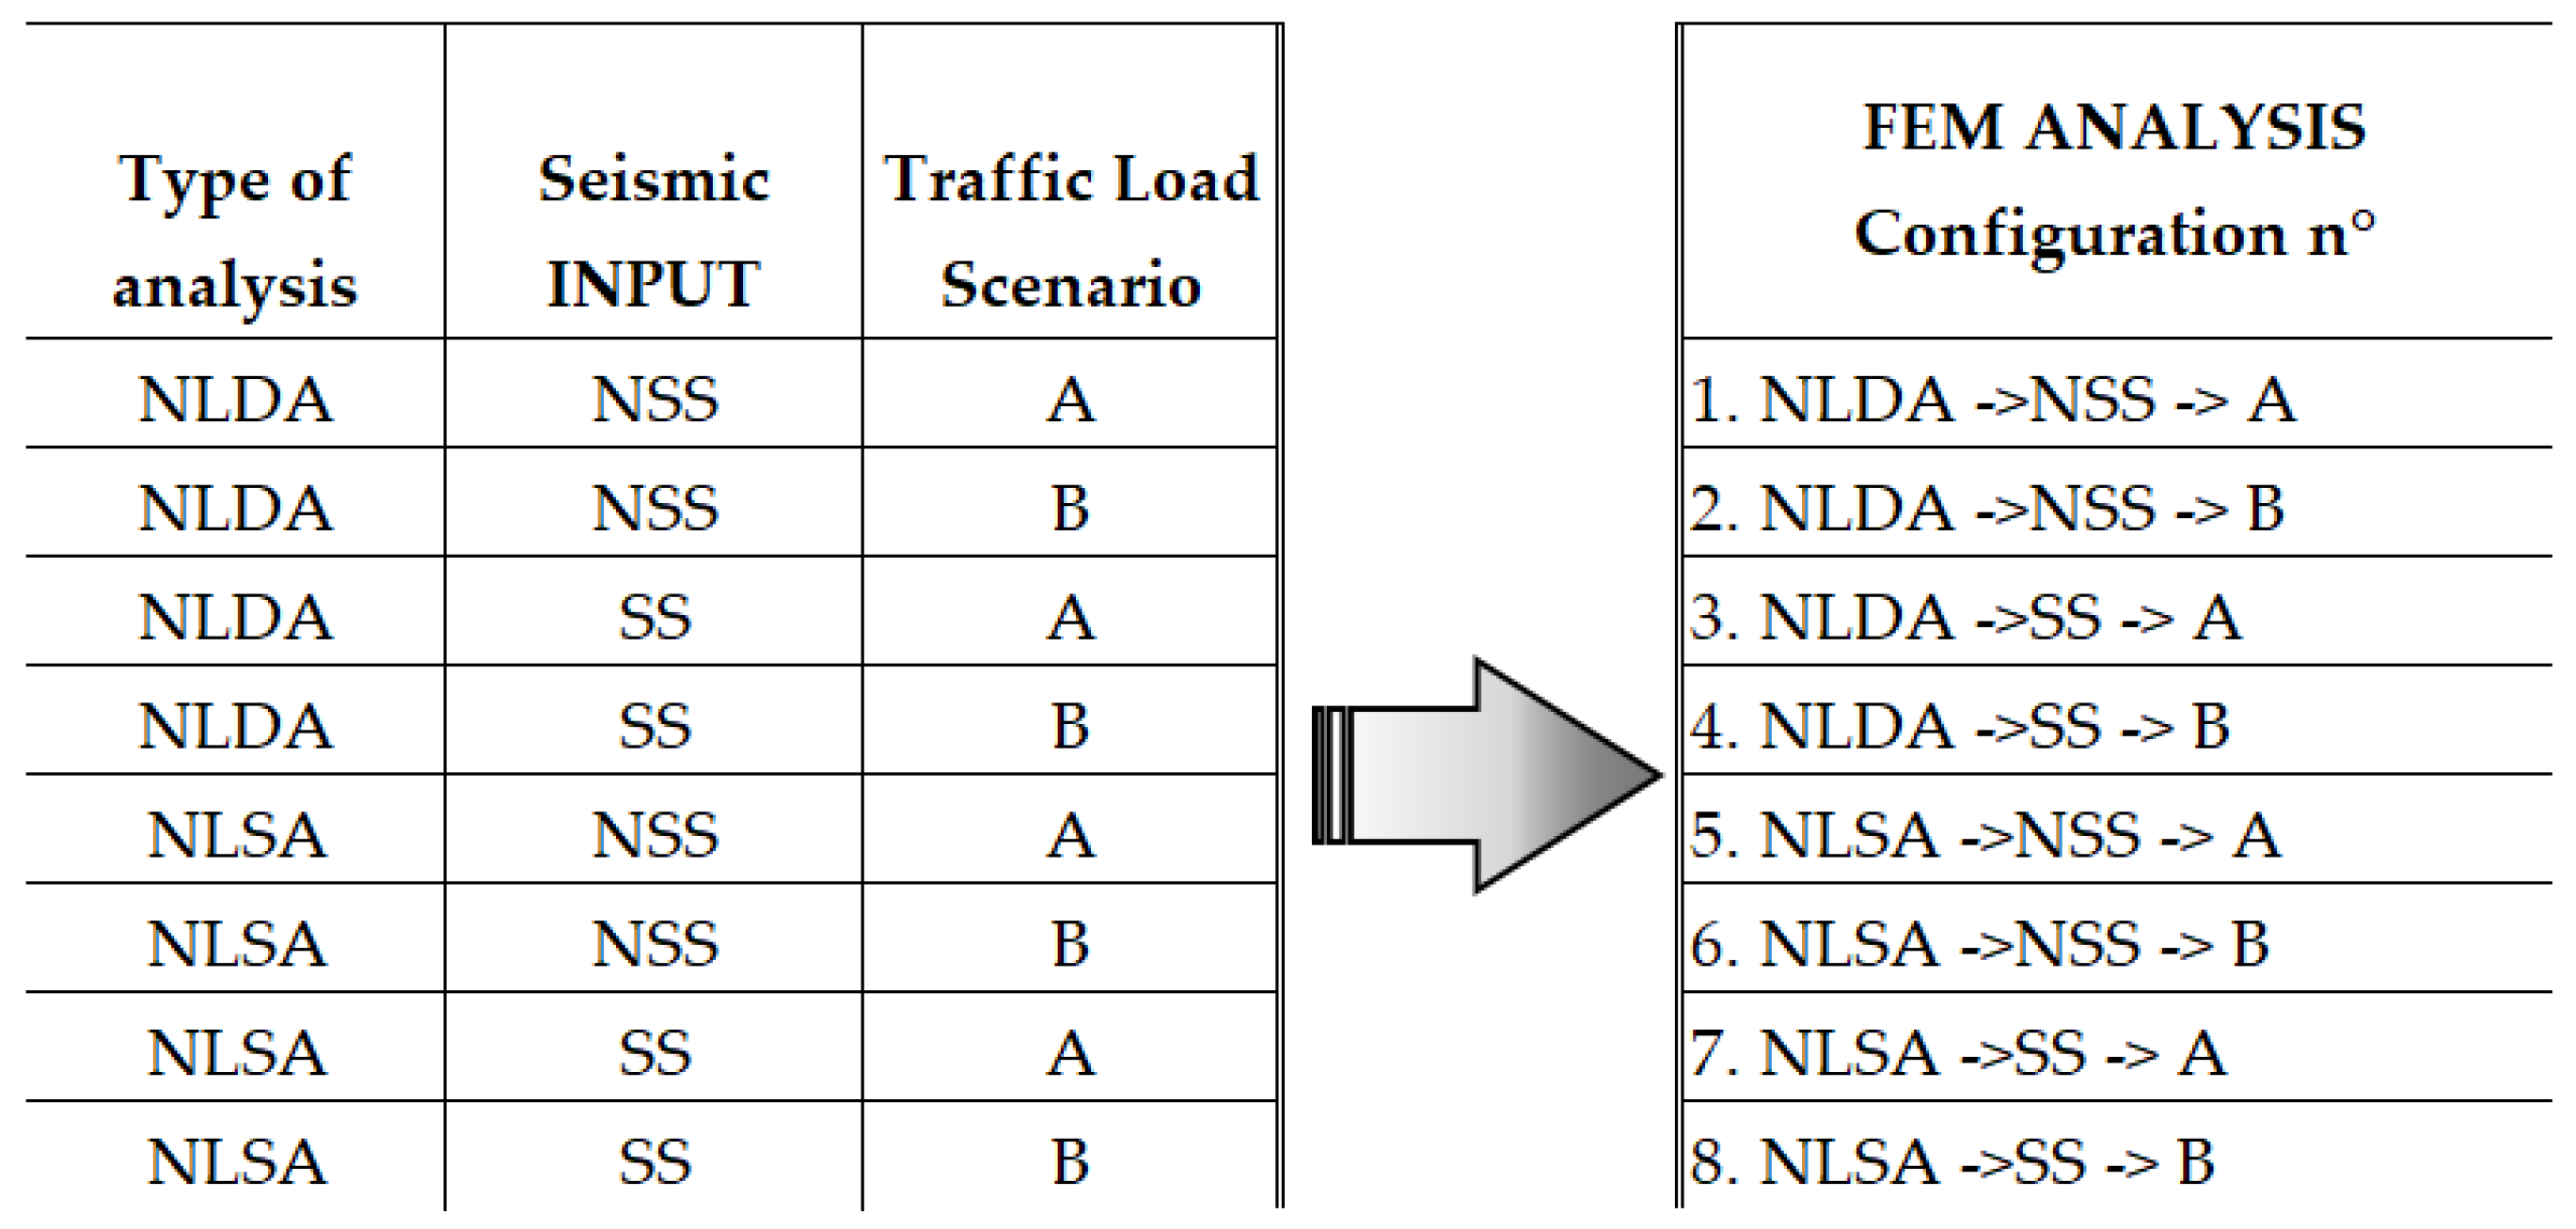
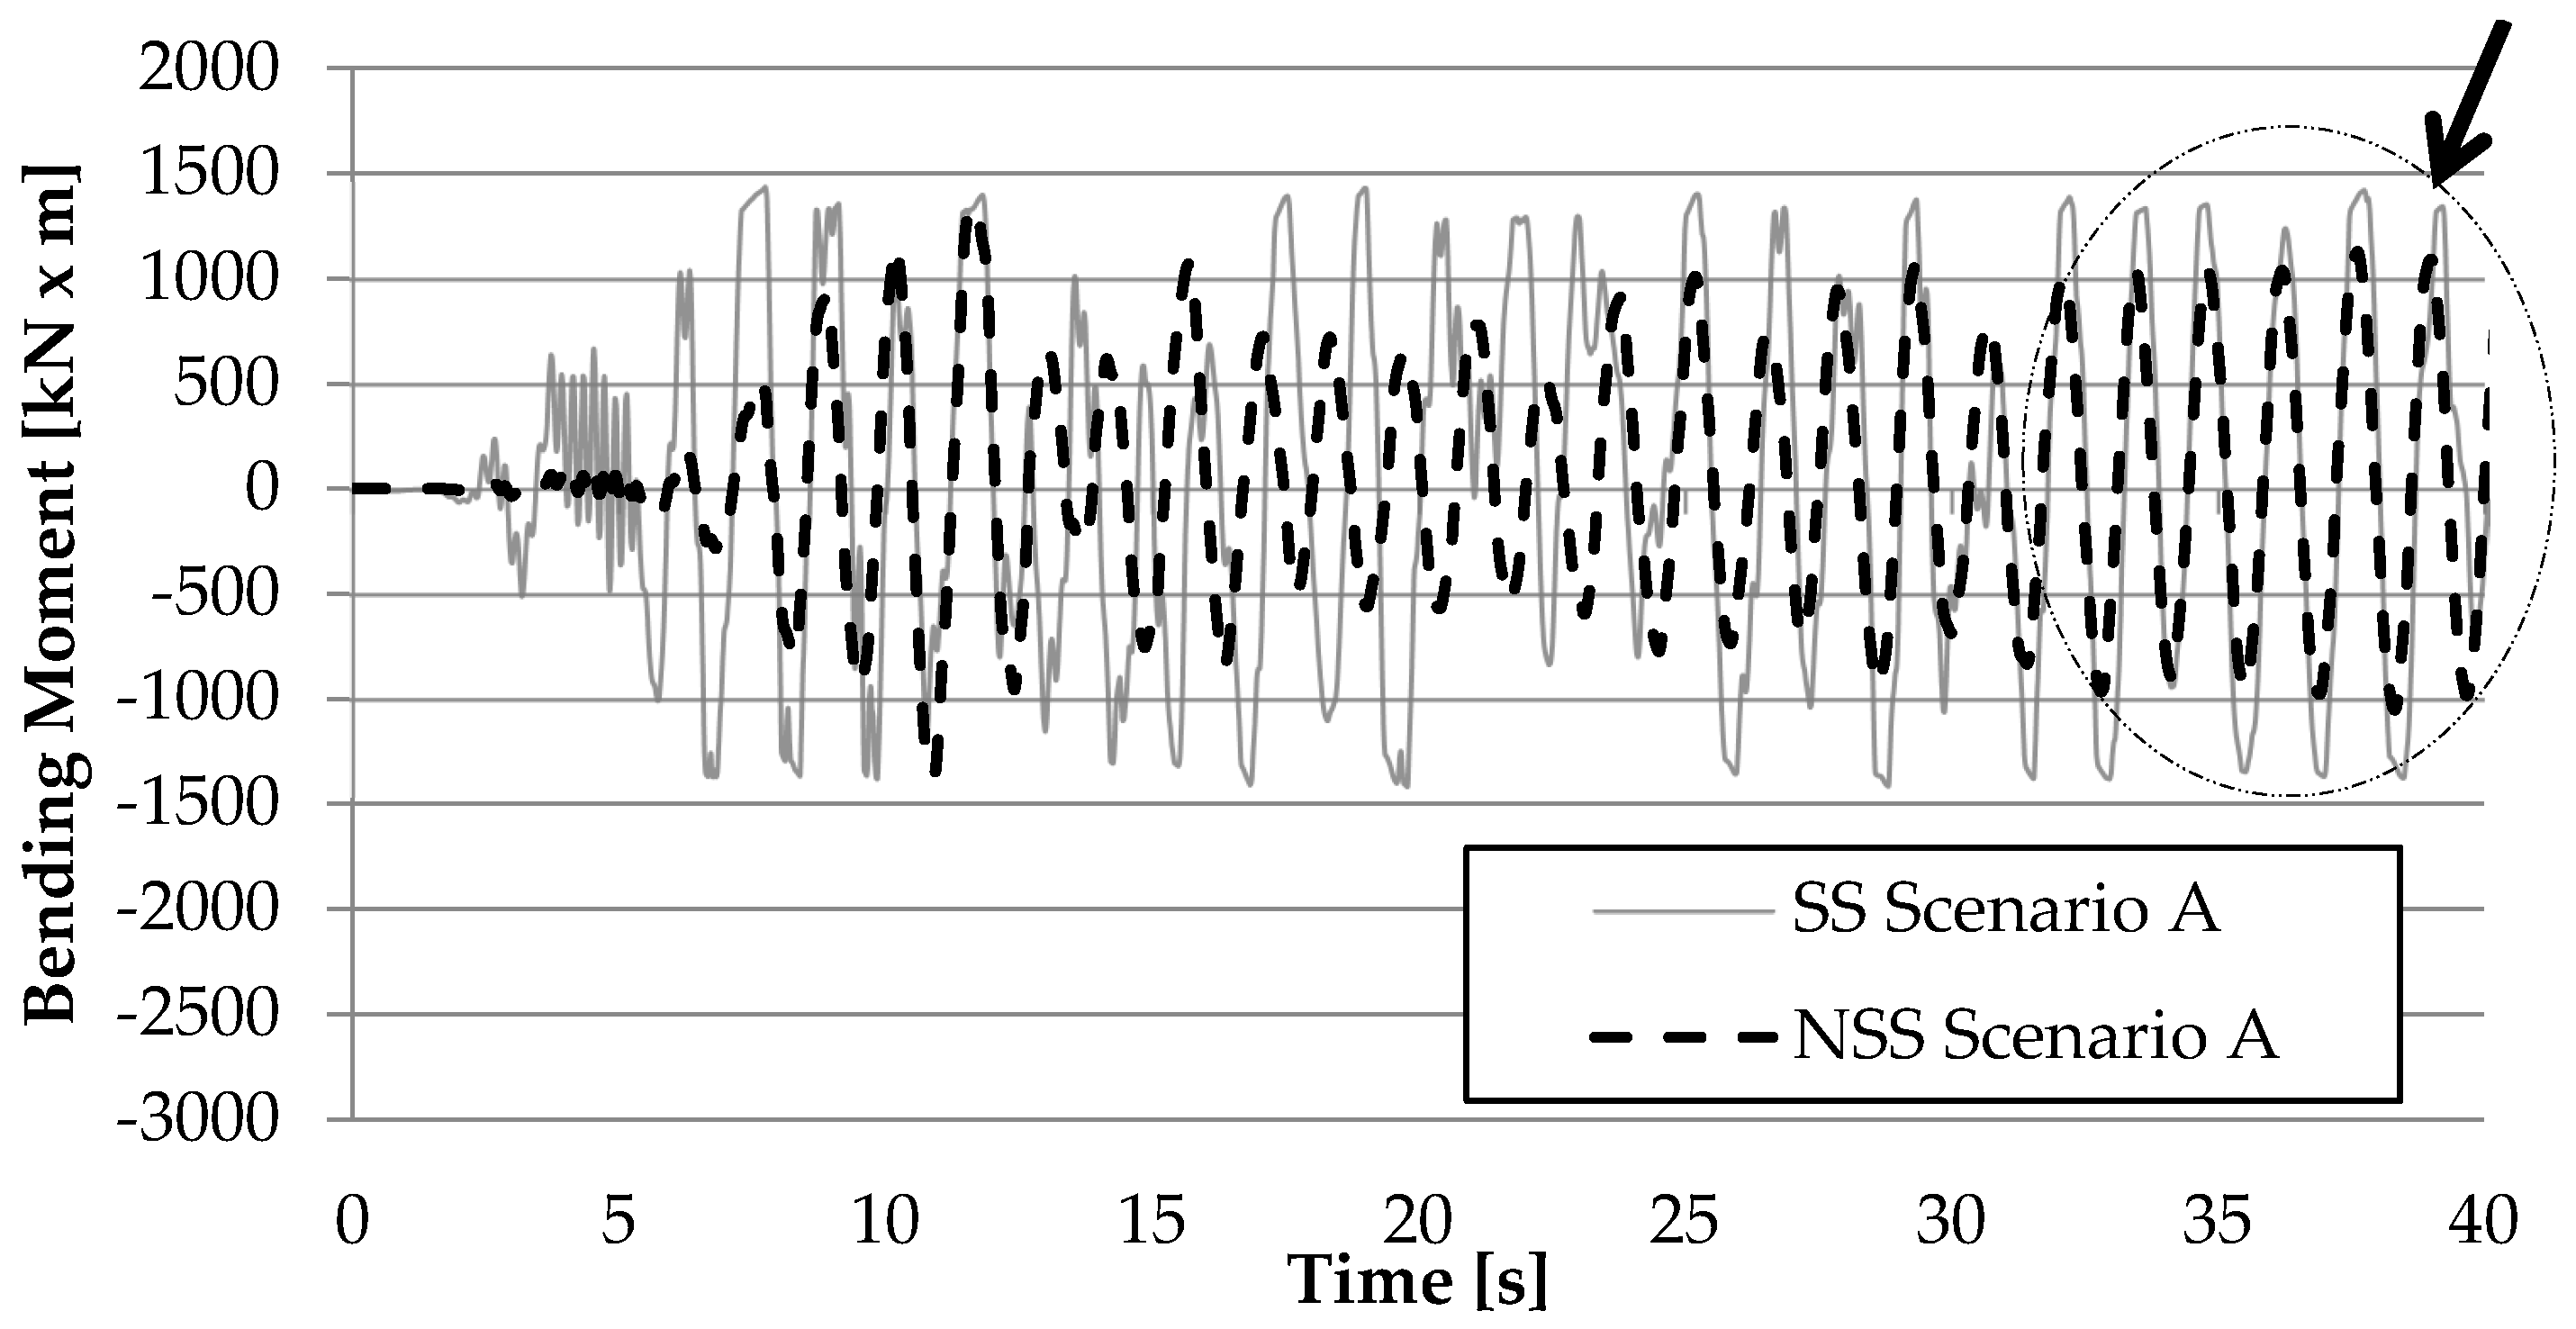
3.2. Nonlinear-Dynamic Analysis (NLDA)—Time History Analysis
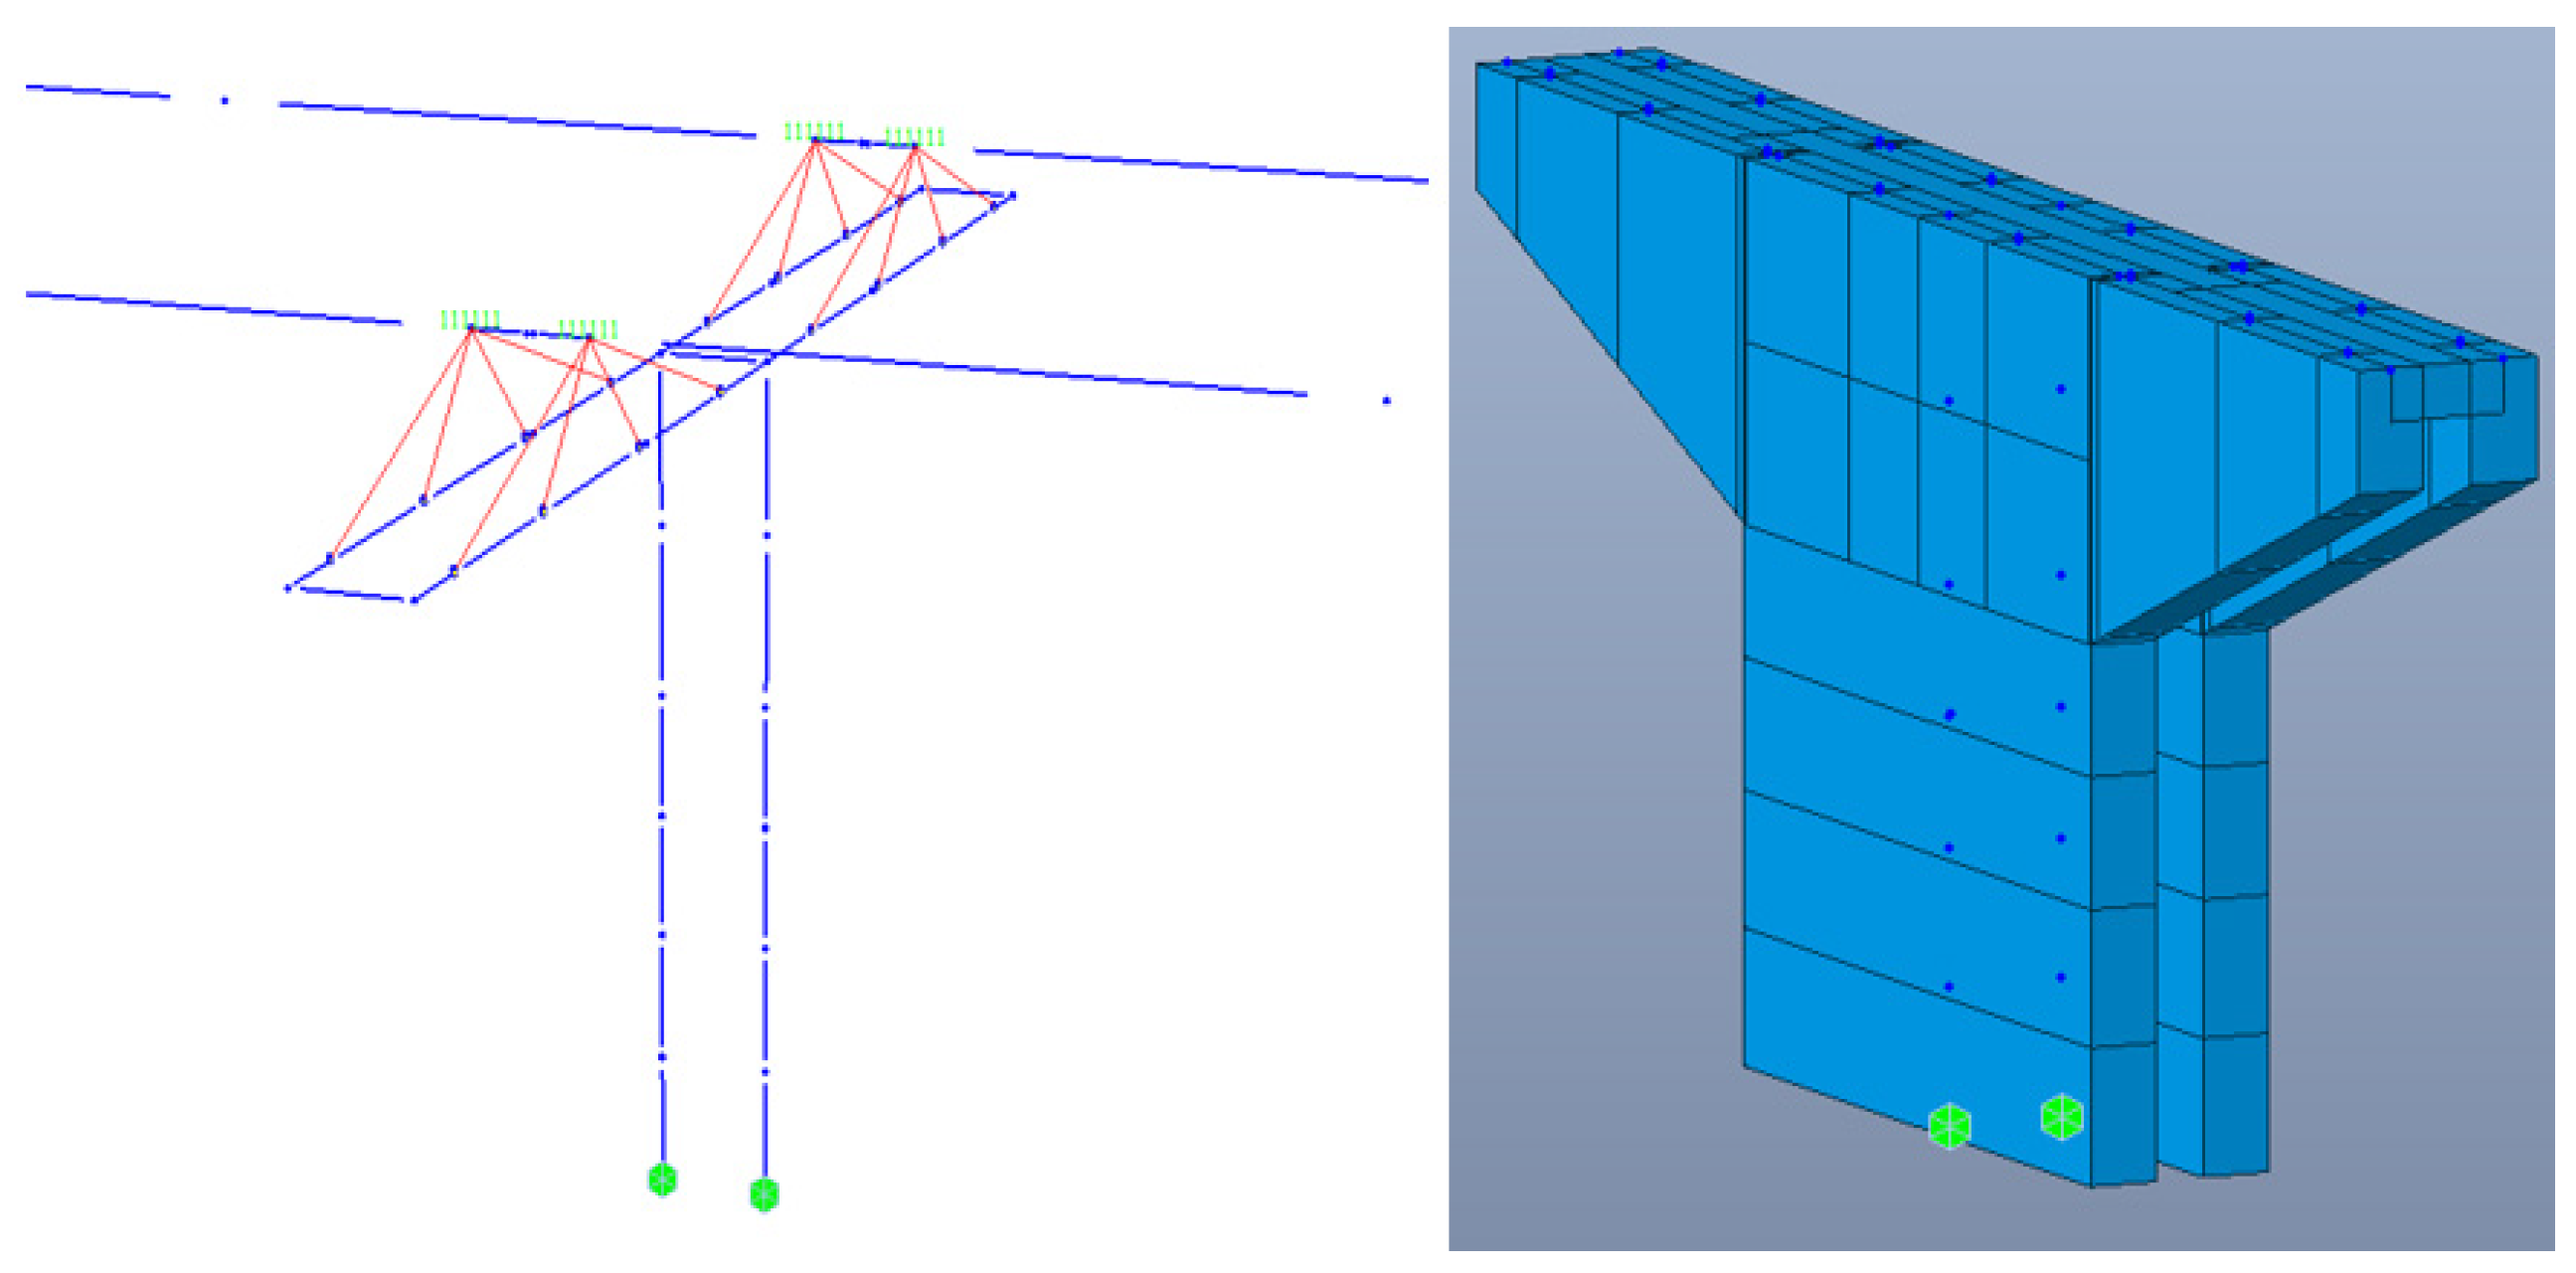
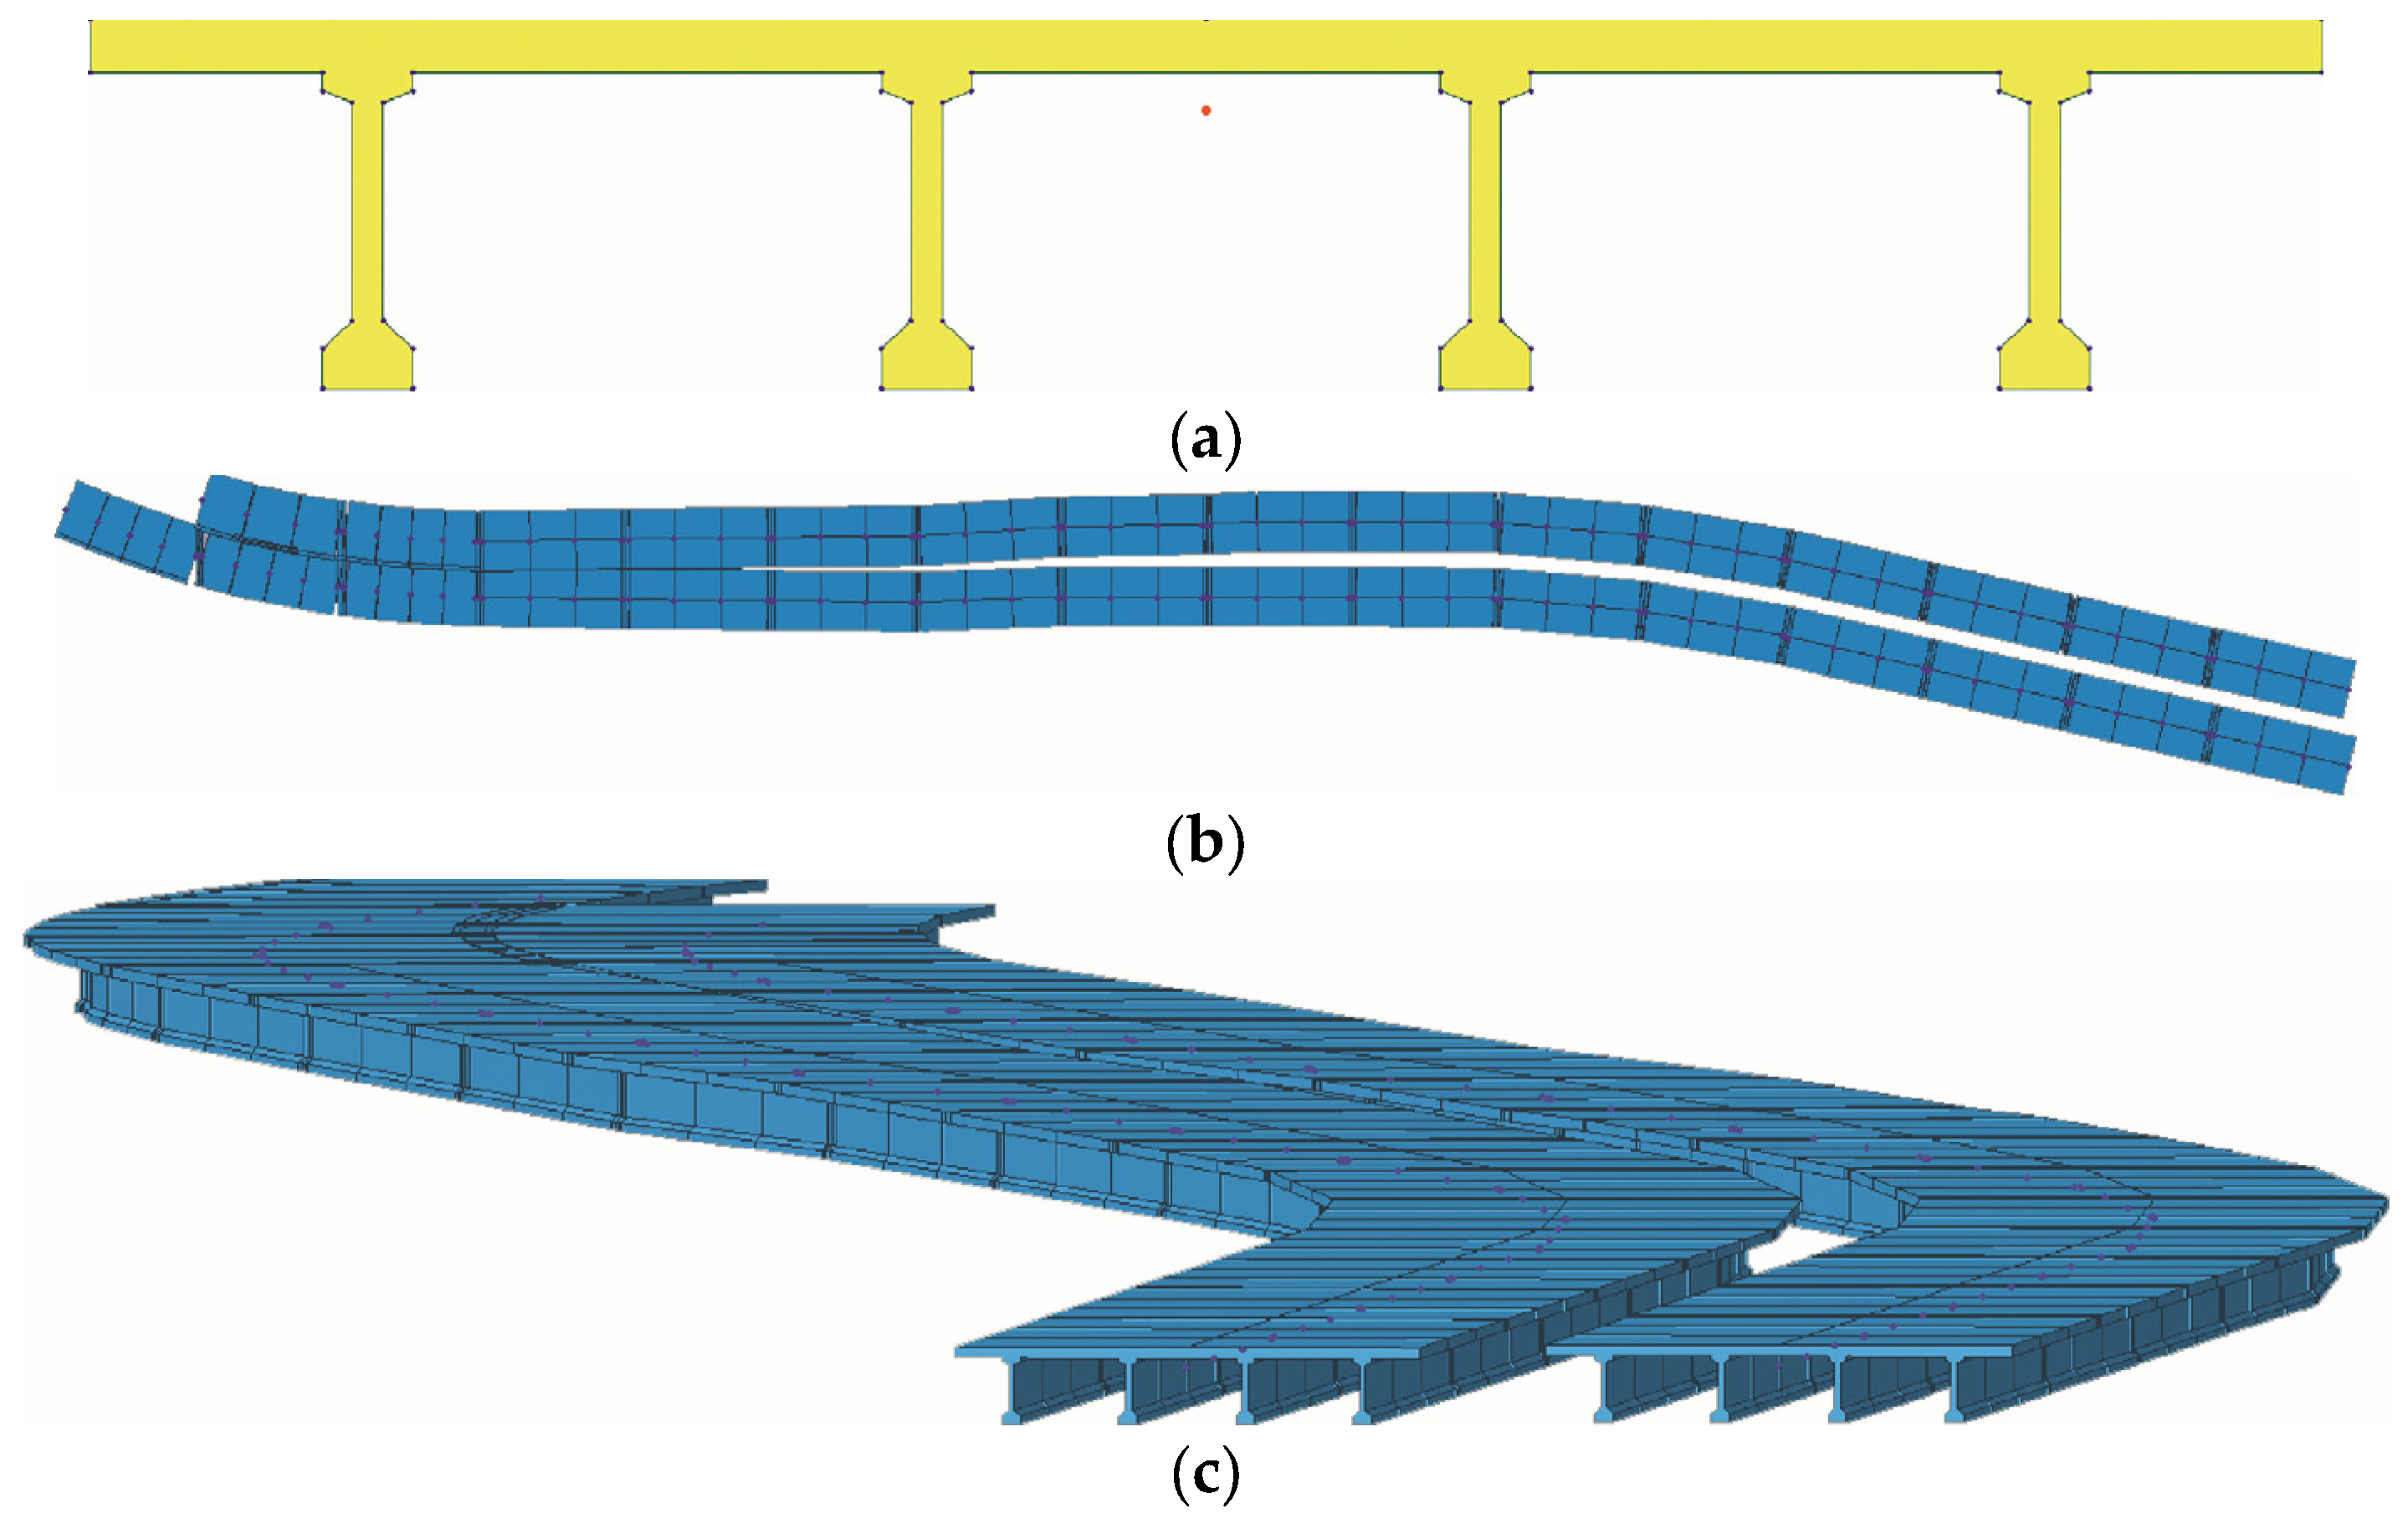
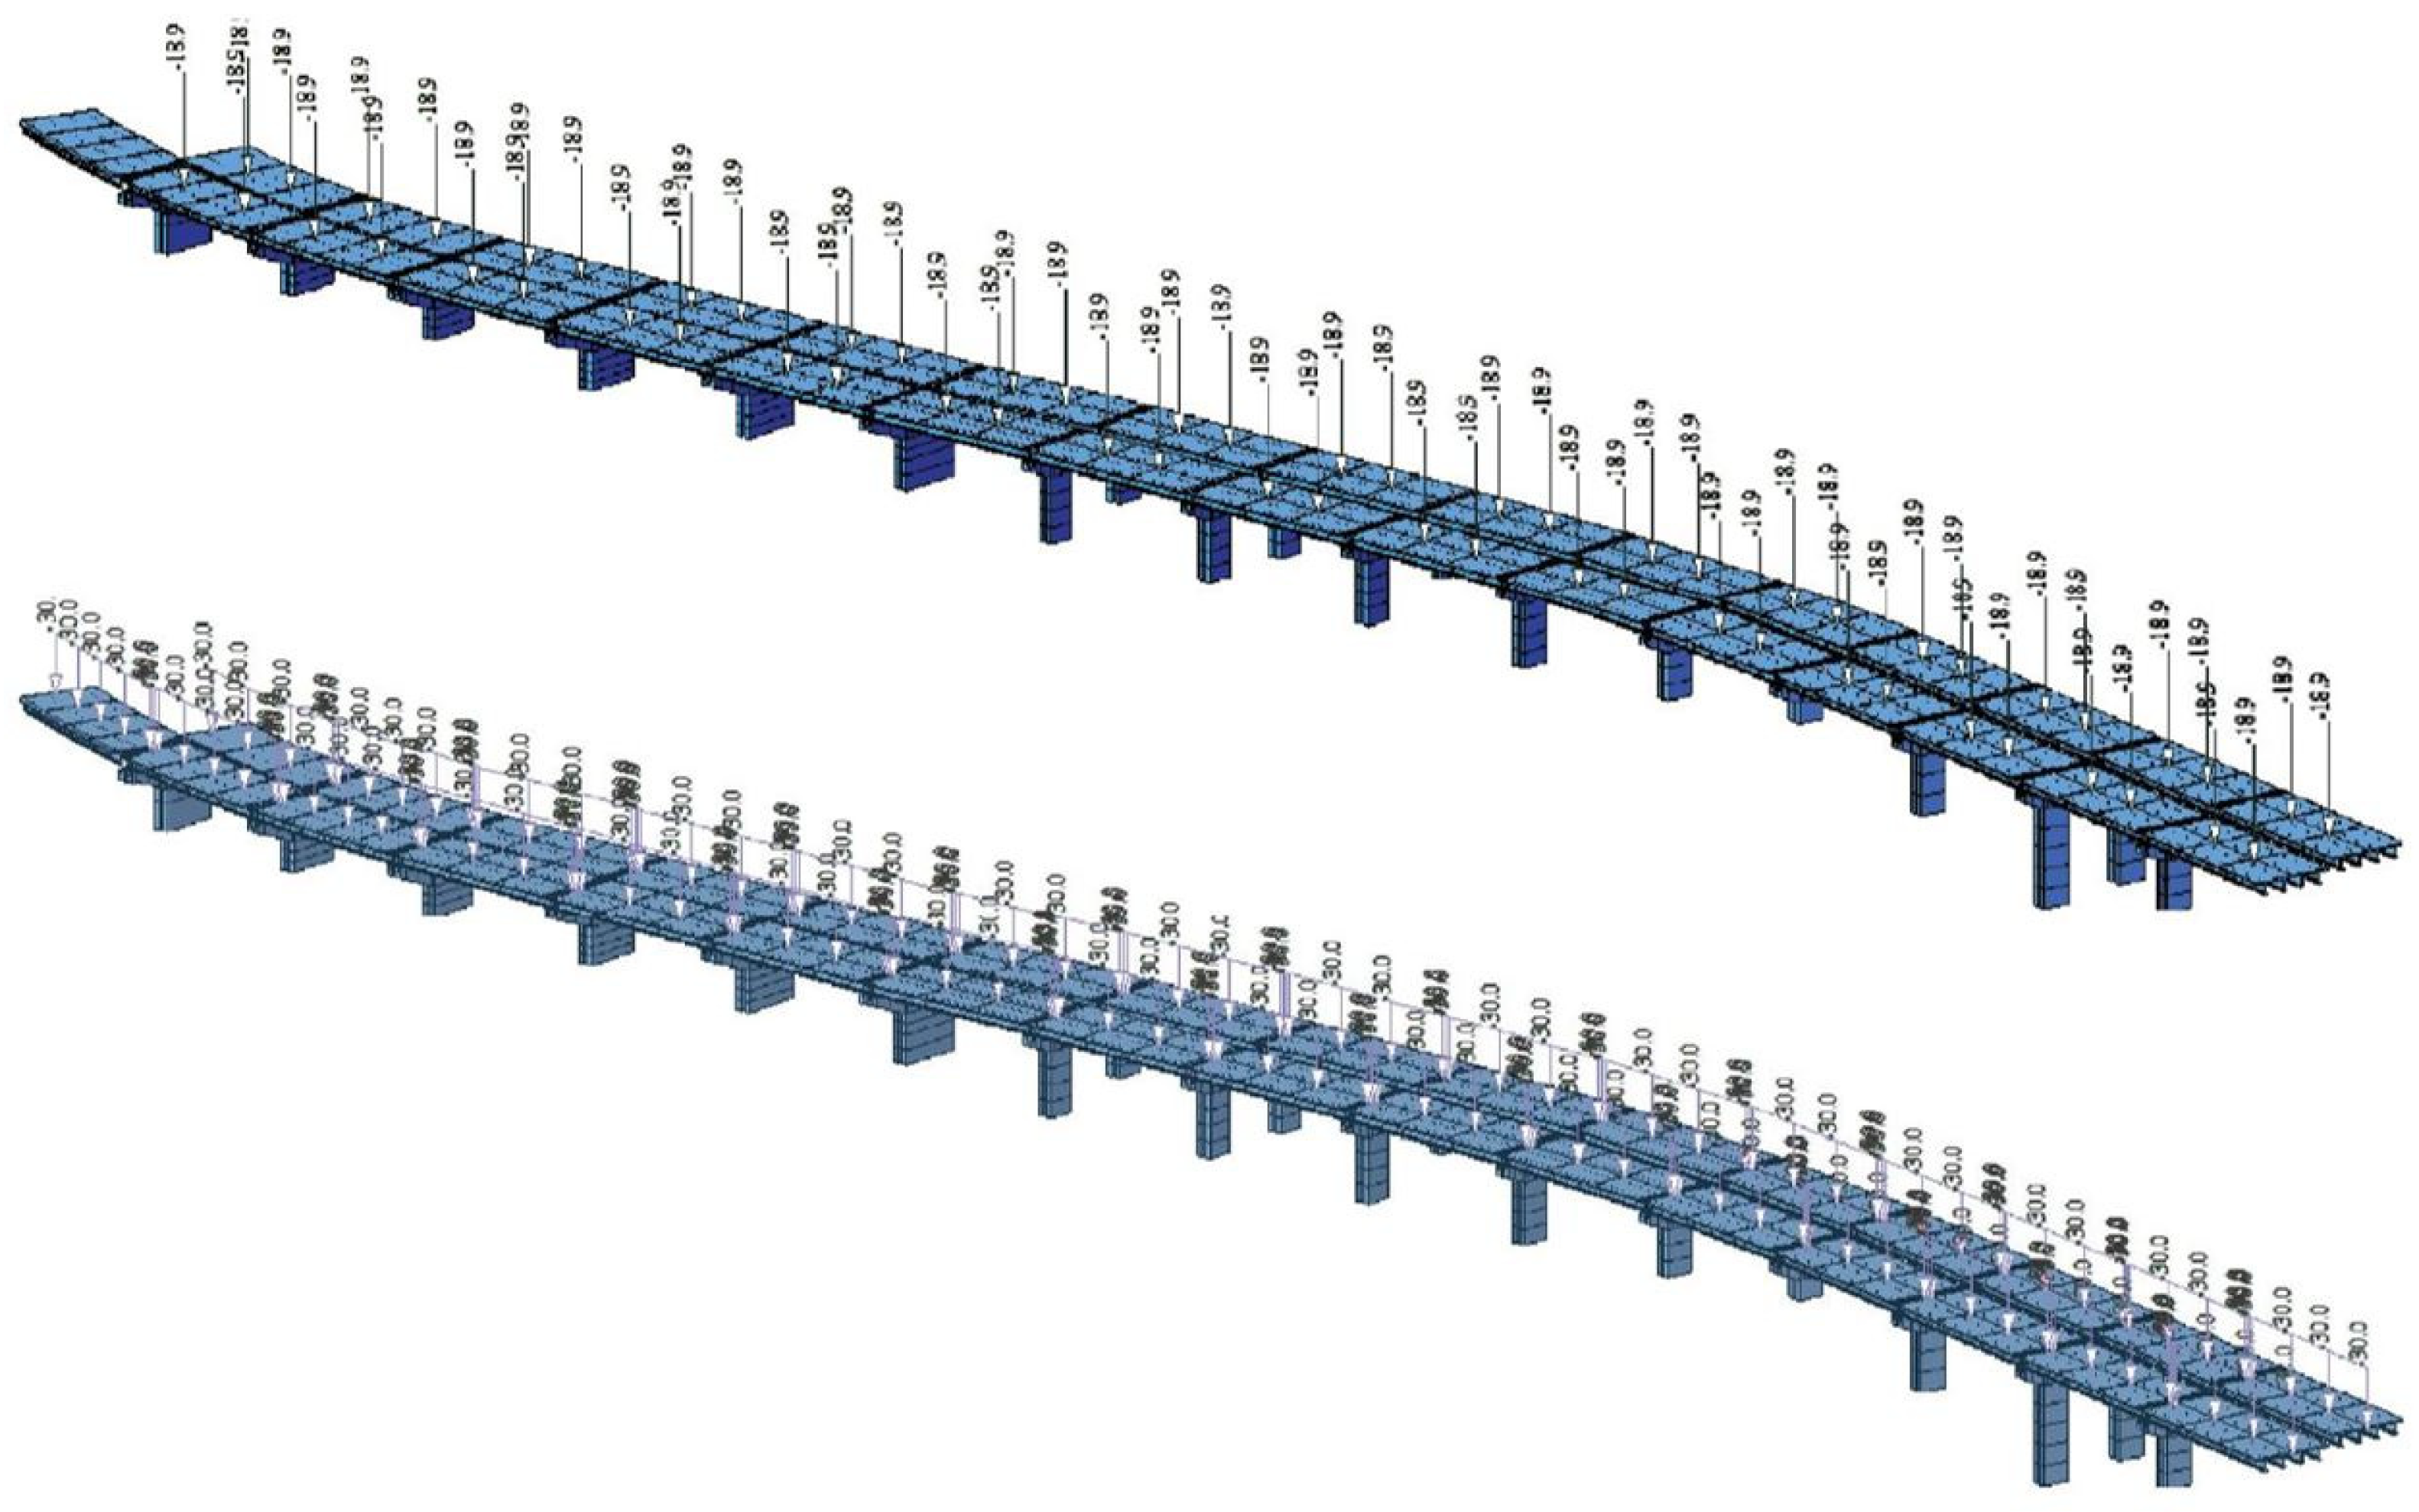
4. Numerical Model of Structural Components and Details
- the increase in seismic loads due to the presence of traffic (scenario A and scenario B);
- the presence of appreciable local seismic phenomena (config. n. 1 NSS and config. n. 2 SS)
- calculation of the moment–curvature of the single pile subjected to the design axial load;
- definition of an idealized bilinear constitutive element link;
- evaluation of the “coordinates” (M-χ) of the yield and failure points of the section;
- conversion of curvatures into rotations through the integration along the length of the plastic hinge with the equations commonly available in the literature [62]
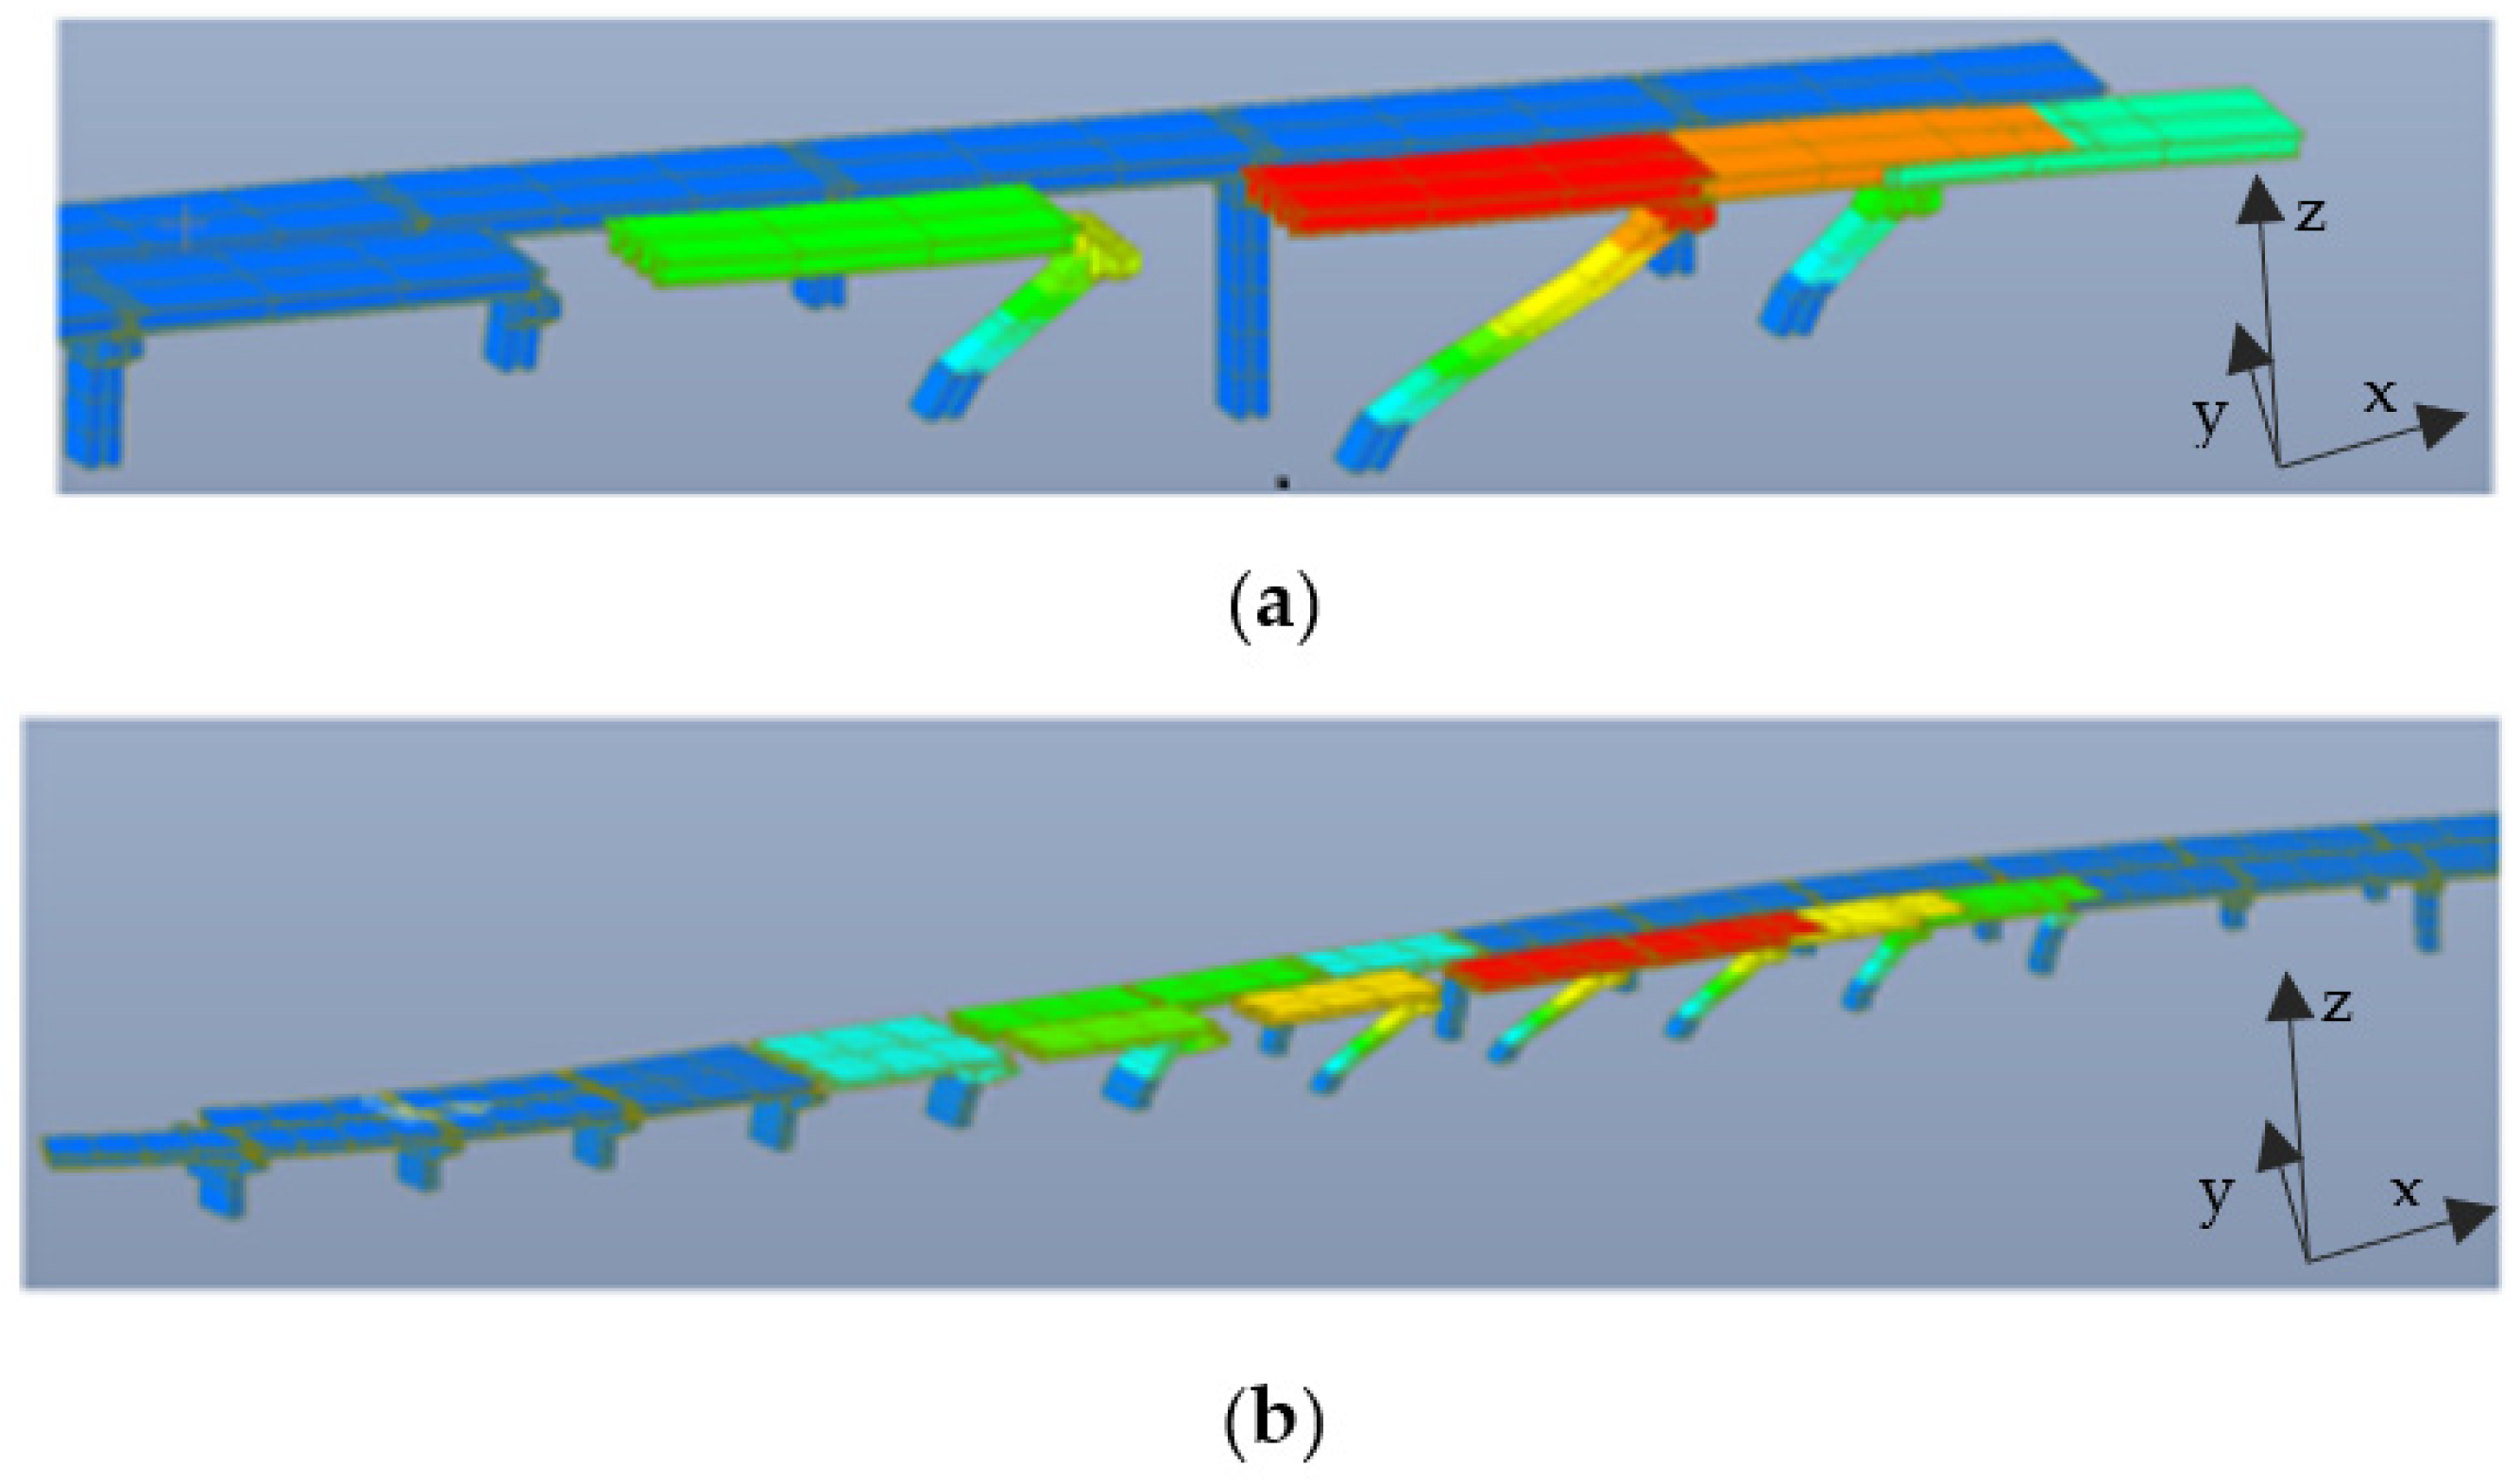
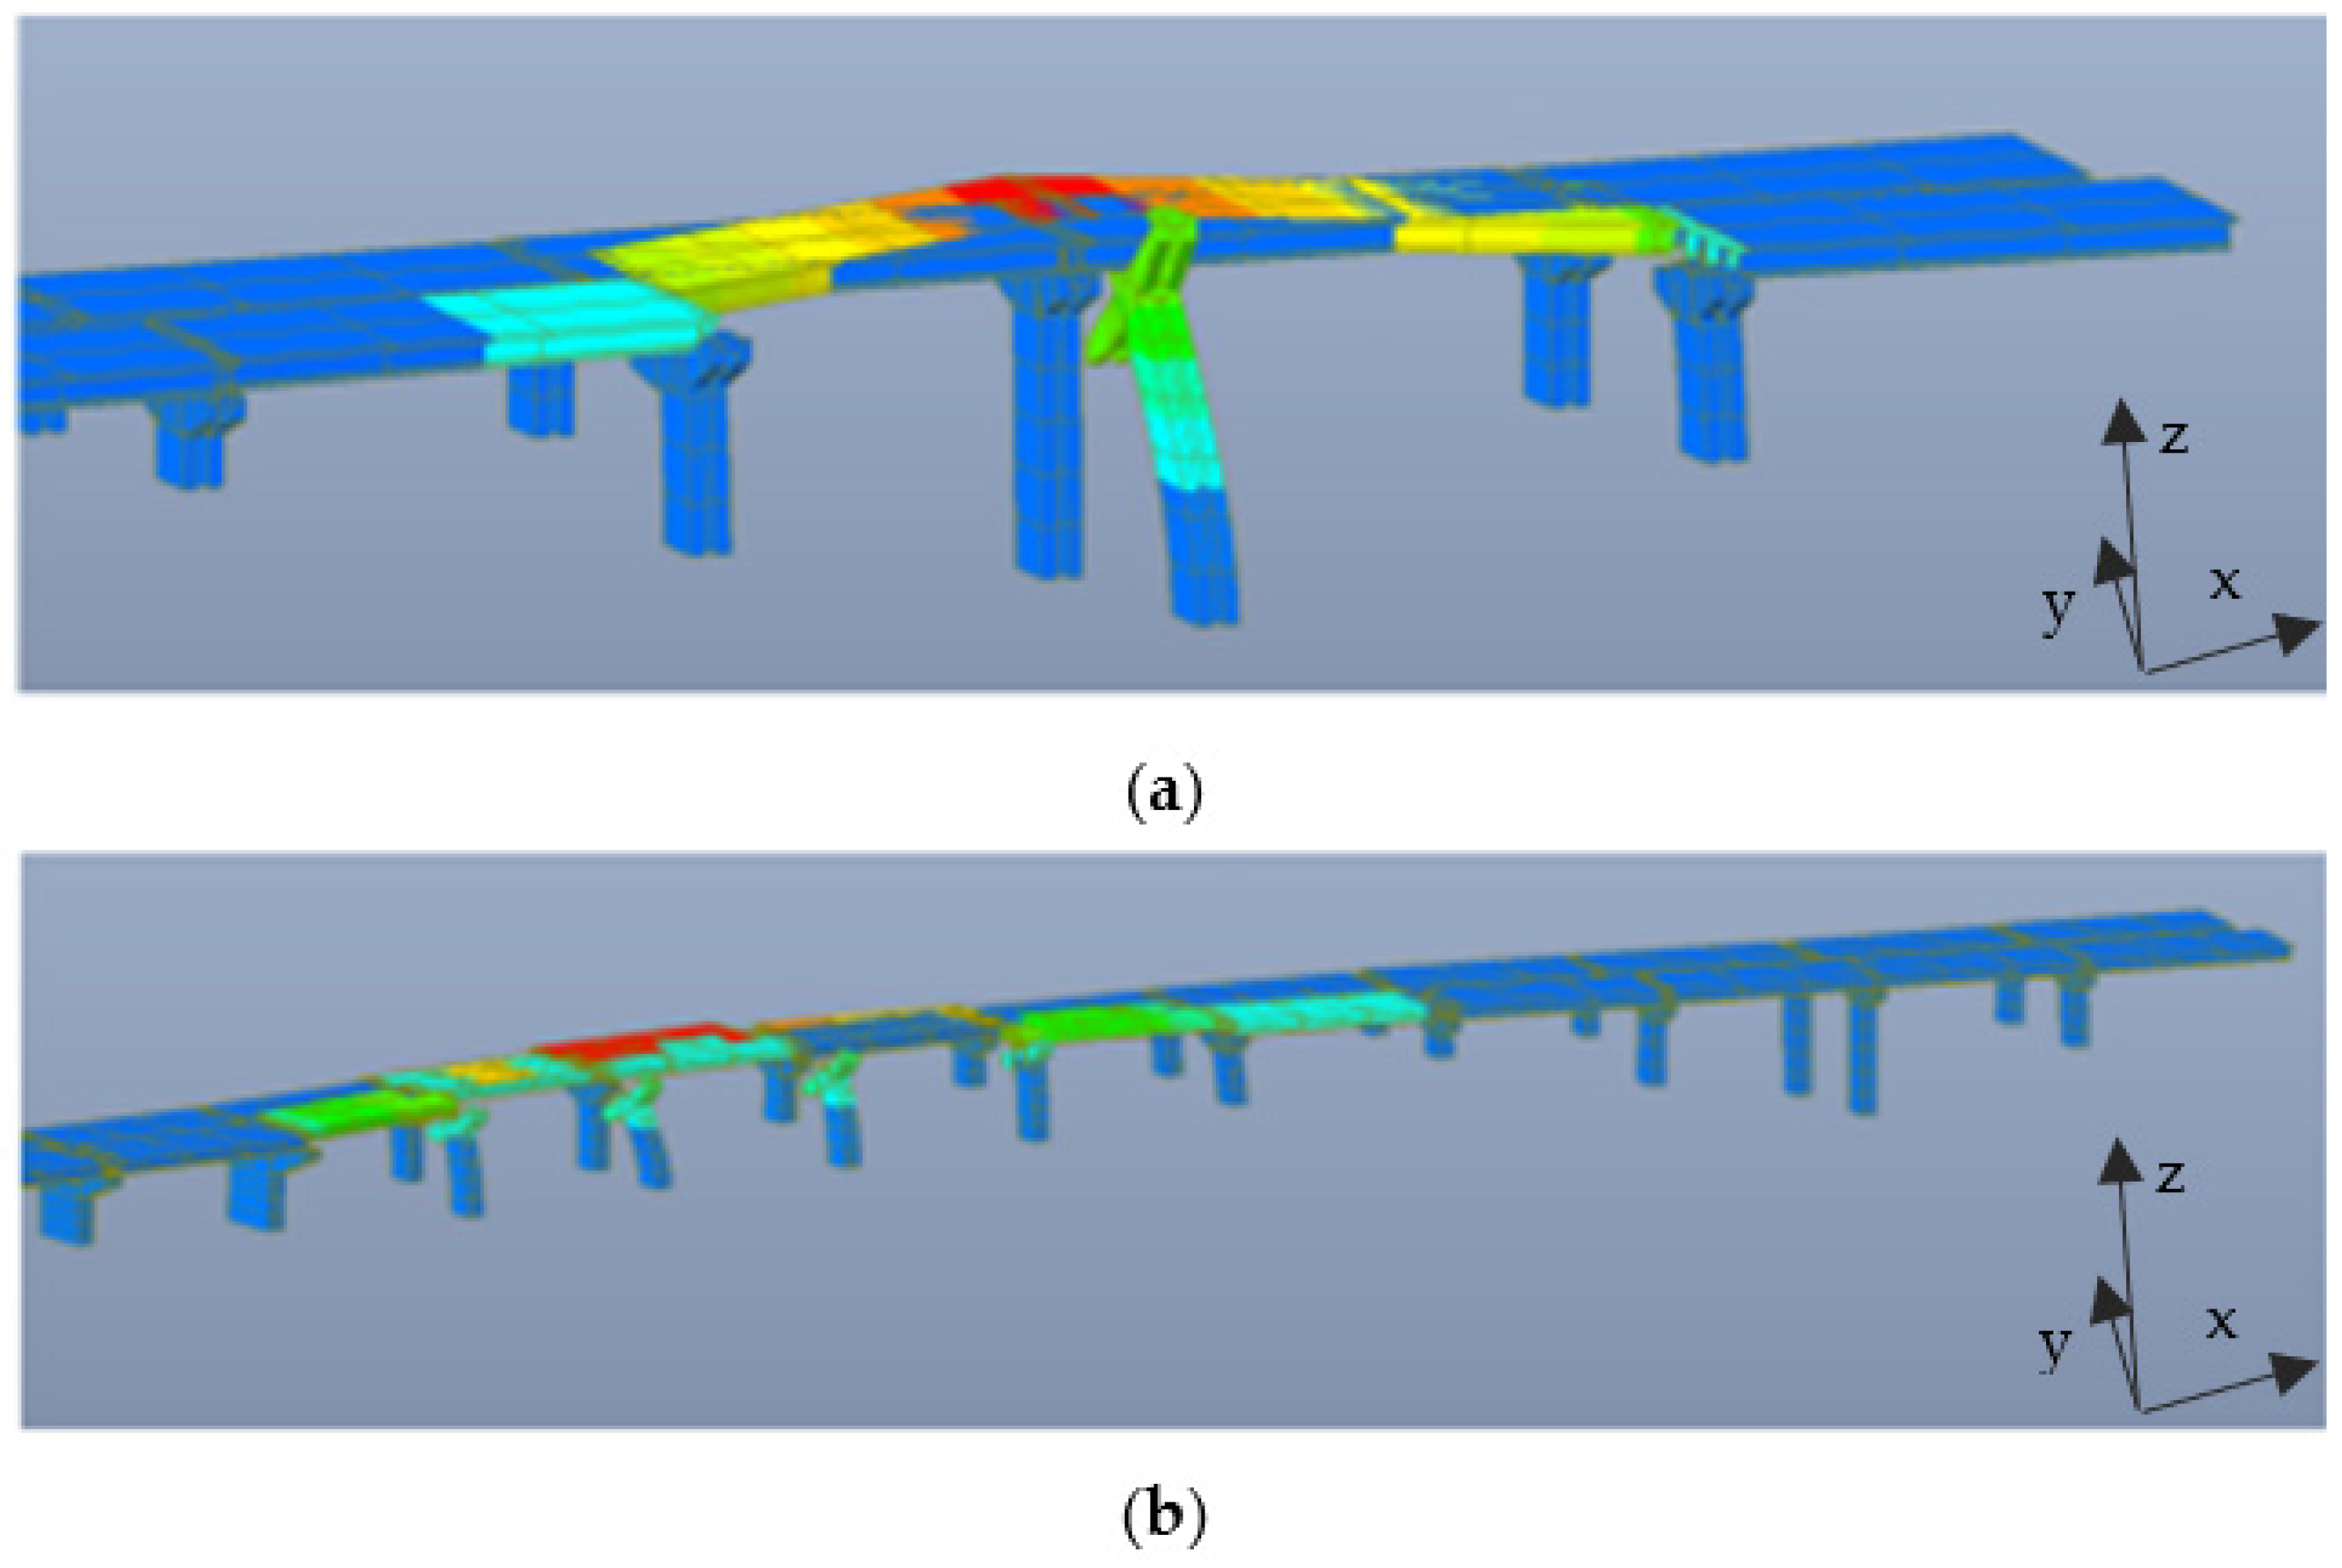
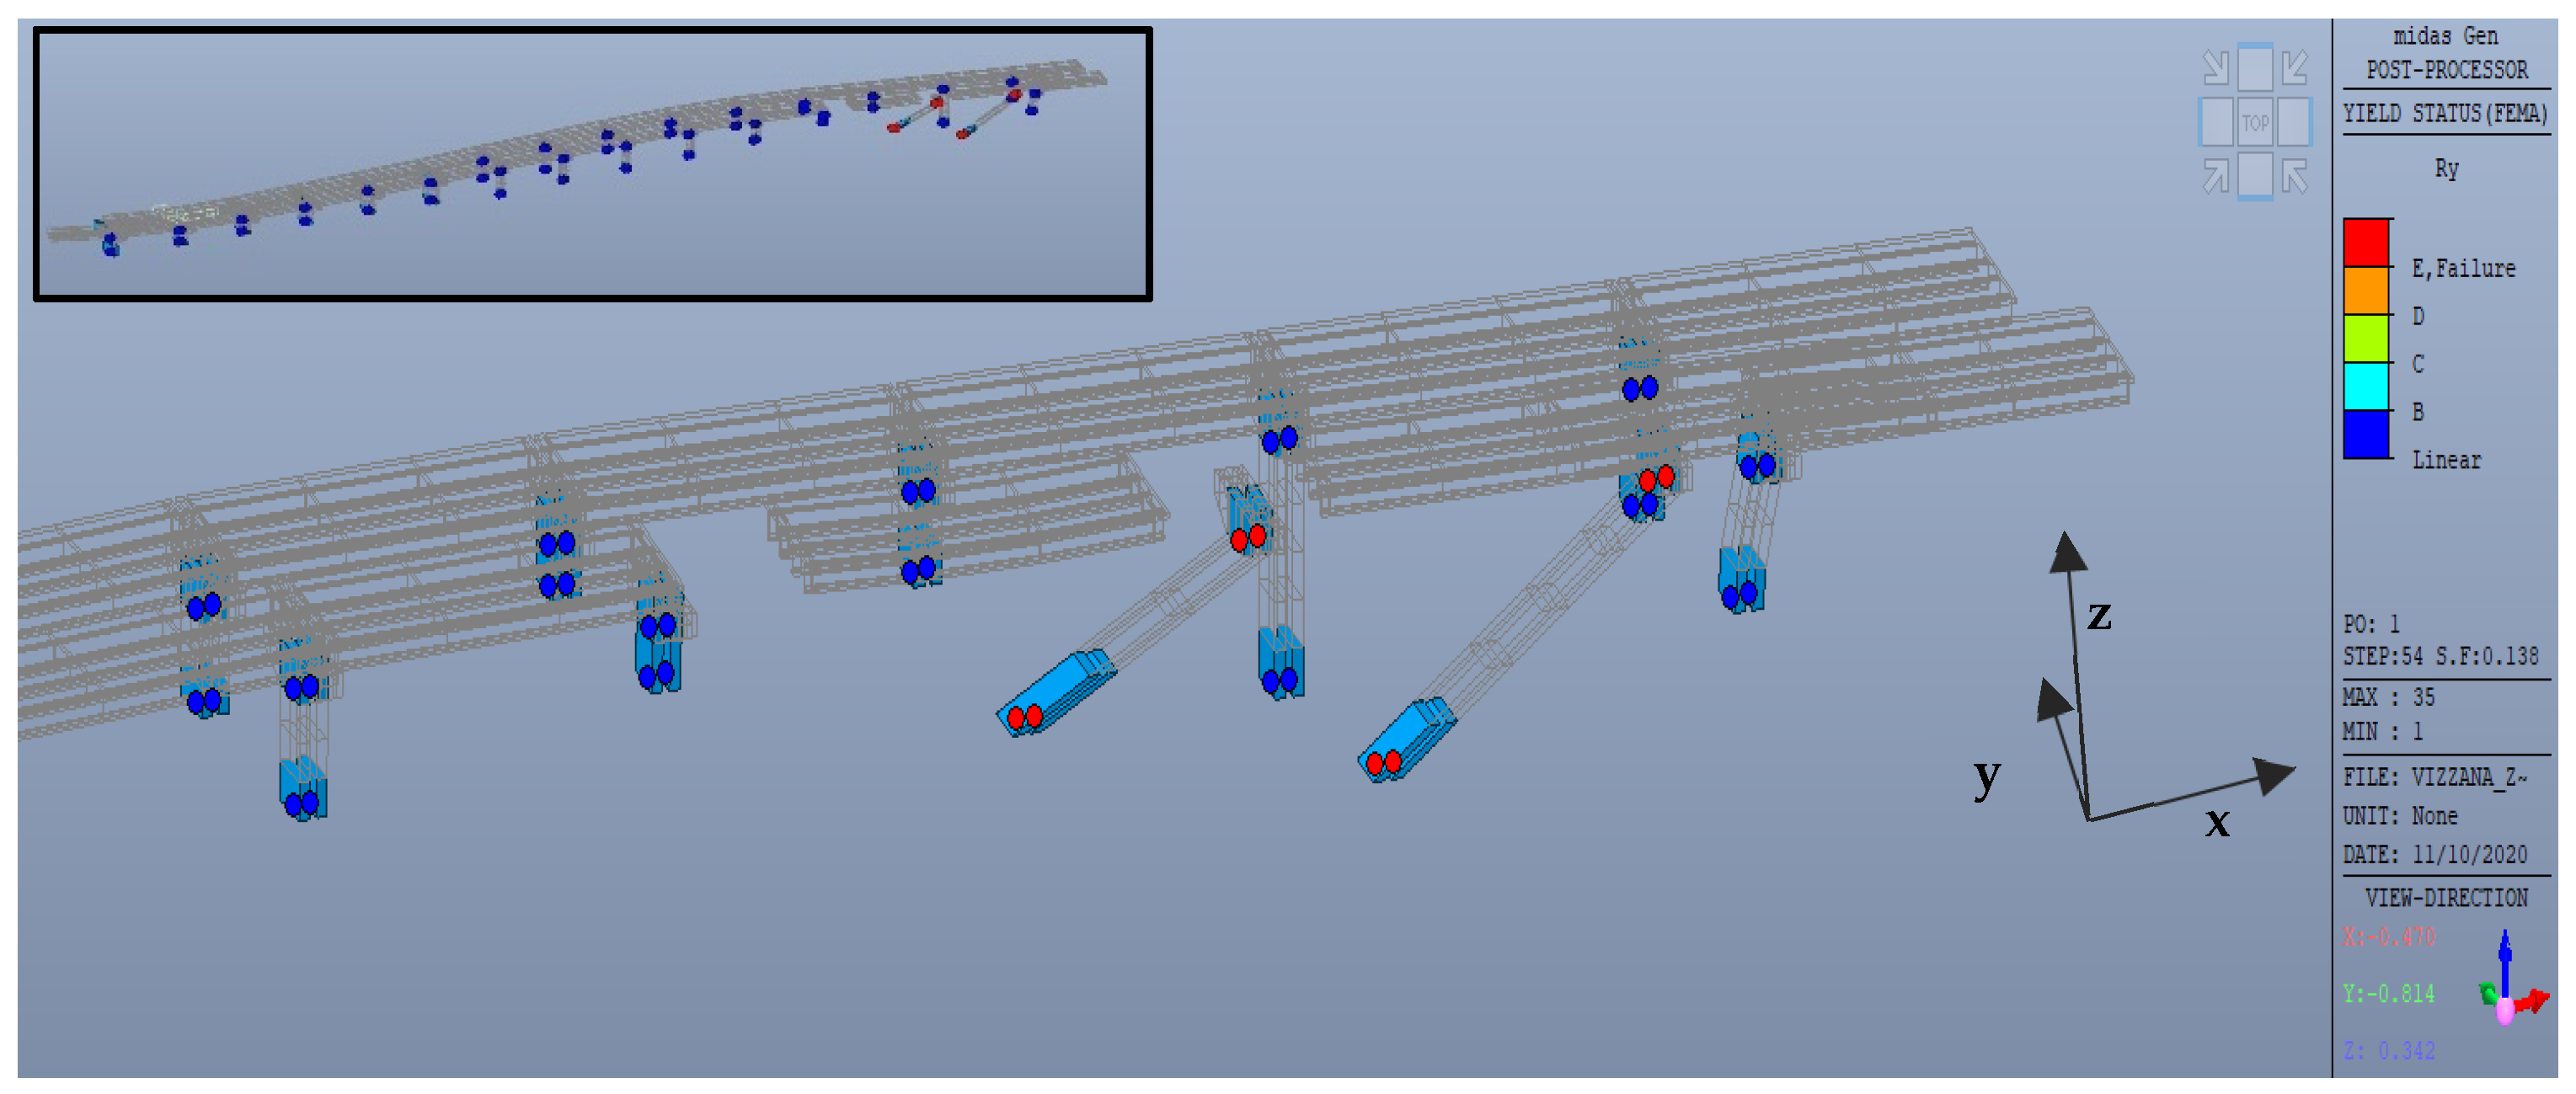
5. Multi-Modal Pushover Analysis (MMPO)
6. Time-History Analysis
7. Conclusions
7.1. Multi-Modal Pushover Analysis
7.2. Nonlinear Time-History Analysis
7.3. Local Seismicity Effects
7.4. Traffic Load Effects
7.5. Further Elements to Be Investigated
Author Contributions
Funding
Institutional Review Board Statement
Informed Consent Statement
Data Availability Statement
Conflicts of Interest
References
- Kawashima, K.; Takahashi, Y.; Ge, H.; Wu, Z.; Zhang, J. Reconnaissance report on damage of bridges in 2008 Wenchuan, China, earthquake. J. Earthq. Eng. 2009, 13, 965–996. [Google Scholar] [CrossRef]
- Pang, Y.; Cai, L.; Zhong, J. Seismic performance evaluation of fiber-reinforced concrete bridges under near-fault and far-field ground motions. Structures 2020, 28, 1366–1383. [Google Scholar] [CrossRef]
- Xiang, N.; Goto, Y.; Alam, M.S.; Li, J. Effect of bonding or unbonding on seismic behavior of bridge elastomeric bearings: Lessons learned from past earthquakes in China and Japan and inspirations for future design. Adv. Bridge Eng. 2021, 2, 14. [Google Scholar] [CrossRef]
- Salkhordeh, M.; Govahi, E.; Mirtaheri, M. Seismic fragility evaluation of various mitigation strategies proposed for bridge piers. Structures 2021, 33, 1892–1905. [Google Scholar] [CrossRef]
- Wardhana, K.; Hadipriono, F.C. Analysis of recent bridge failures in the United States. J. Perform. Constr. Facil. 2003, 17, 144–150. [Google Scholar] [CrossRef] [Green Version]
- Afsar Dizaj, E.; Salami, M.; Kashani, M. Seismic vulnerability analysis of irregular multi-span concrete bridges with different corrosion damage scenarios. Soil Dyn. Earthq. Eng. 2023, 165, 107678. [Google Scholar] [CrossRef]
- Zucca, M.; Crespi, P.; Stochino, F.; Puppio, M.L.; Coni, M. Maintenance interventions period of existing RC motorway viaducts located in moderate/high seismicity zones. Structures 2023, 47, 976–990. [Google Scholar] [CrossRef]
- Crisci, G.; Ceroni, F.; Lignola, G.P.; Prota, A. Critical issues in existing RC deck stiffened arch bridges under seismic actions. Eng. Struct. 2022, 272, 114980. [Google Scholar] [CrossRef]
- Simanjuntak, V.C.; Imran, I.; Moestopo, M.; Setio, H.D. The Evolution of Seismic Design Provisions in Indonesia’s National Bridge Code. J. Eng. Technol. Sci. 2022, 54, 220614. [Google Scholar] [CrossRef]
- Wallace, J.W.; Eberhard, M.O.; Hwang, S.J.; Moehle, J.P.; Post, T.; Roblee, C.; Stewart, J.P.; Yashinsky, M. Highway bridges. Earthq. Spectra 2001, 17, 131–152. [Google Scholar] [CrossRef]
- Yen, W.-H. Lessons learned about bridges from earthquake in Taiwan. Fed. Highw. Adm. 2002, 65, 20–23. [Google Scholar]
- Imbsen, R.A.; Roblee, C.J.; Yashinsky, M.; Berilgen, M.M.; Toprak, S. Impact on highway structures. Earthq. Spectra 2000, 16, 411–435. [Google Scholar] [CrossRef]
- Ghasemi, H.; Cooper, J.D.; Imbsen, R.; Piskin, H.; Inal, F.; Tiras, A. The November 1999 Duzce earthquake: Post-earthquake investigation of the structures. In TEM. Publication No. FHWARD-00–146; Federal Highway Administration: Washington, DC, USA, 2000. Available online: https://rosap.ntl.bts.gov/view/dot/41585 (accessed on 9 February 2023).
- De Domenico, D.; Messina, D.; Recupero, A. Seismic vulnerability assessment of reinforced concrete bridge piers with corroded bars. Strct. Conc. 2023. [Google Scholar] [CrossRef]
- Hafsa, F. A comparative study of RC bridge for evaluation of seismic performance and retrofit technology. Innov. Infrastruct. Solut. 2021, 6, 44–50. [Google Scholar]
- Malomo, D.; Scattarreggia, N.; Orgnoni, A.; Pinho, R.; Moratti, M.; Calvi, G.M. Numerical Study on the Collapse of the Morandi Bridge. J. Perform. Constr. Facil. 2020, 34, 04020044. [Google Scholar] [CrossRef]
- Calvi, G.M.; Moratti, M.; O’Reilly, G.; Scattarreggia, N.; Monteiro, R.; Malomo, D.; Calvi, P.M.; Pinho, R. Once upon a Time in Italy: The Tale of the Morandi Bridge. Struct. Eng. Int. 2019, 29, 198–217. [Google Scholar] [CrossRef]
- Scattarreggia, N.; Salomone, R.; Moratti, M.; Malomo, D.; Pinho, R.; Calvi, G.M. Collapse analysis of the multi-span reinforced concrete arch bridge of Caprigliola, Italy. Eng. Struct. 2022, 25115, 113375. [Google Scholar] [CrossRef]
- Ghazal, H.; Mwafy, A. Seismic fragility assessment of an existing multi-span RC bridge equipped with risk mitigation systems. Buildings 2022, 12, 982. [Google Scholar] [CrossRef]
- Markou, G. A new method of seismic retrofitting cost analysis and effectiveness for reinforced concrete structures. Eng. Struct. 2021, 2461, 113083. [Google Scholar] [CrossRef]
- Zanini, M.A.; Toska, K.; Faleschini, F.; Pellegrino, C. Seismic reliability of reinforced concrete bridges subject to environmental deterioration and strengthened with FRCM composites. Soil Dyn. Earthq. Eng. 2020, 136, 106224. [Google Scholar] [CrossRef]
- Reggia, A.; Morbi, A.; Plizzari, G. Experimental study of a reinforced concrete bridge pier strengthened with HPFRC jacketing. Eng. Struct. 2020, 2101, 110355. [Google Scholar] [CrossRef]
- De Domenico, D.; Sciutteri, S.; D’Arrigo, A.; Ricciardi, G. Seismic Retrofitting of Prestressed Concrete Bridges through Friction Pendulum Isolation Bearings. Lect. Notes Civ. Eng. 2022, 200, 604–612. [Google Scholar]
- Di Sarno, L.; Paolacci, F. Experimental seismic assessment of the effectiveness of isolation techniques for the seismic protection of existing RC bridges. Lect. Notes Civ. Eng. 2017, 2, 89–114. [Google Scholar]
- Nestovito, G.; Occhiuzzi, A. Implementation of smart-passive dampers combined with double concave friction pendulum devices to retrofit an existing highway viaduct exploiting the seismic early warning information. Eng. Struct. 2016, 120, 58–741. [Google Scholar] [CrossRef]
- Cakebread, T. The role of finite element analysis in bridge assessment and design. In Proceedings of the 5th International Conference on Bridge Maintenance, Safety and Management, Philadelphia, PA, USA, 11–15 July 2010. [Google Scholar]
- Duan, Y.F.; Xu, Y.L.; Fei, Q.G.; Wong, K.Y.; Chan, K.W.Y.; Nl, Y.Q.; Ng, C.L. Advanced finite element model of TSING MA bridge for structural health monitoring. Int. J. Struct. Stab. 2011, 11, 313–344. [Google Scholar] [CrossRef]
- Nguyen, V.T.; Achintya, J.H.; Hu, H.J. Fragility-based seismic performance assessment of modular underground arch bridges. Structures 2022, 39, 1218–1230. [Google Scholar]
- Thapa, S.; Shrestha, Y.; Gautam, D. Seismic fragility analysis of RC bridges in high seismic regions under horizontal and simultaneous horizontal and vertical excitations. Structures 2022, 37, 284–294. [Google Scholar] [CrossRef]
- Bandini, P.A.C.; Padgett, J.E.; Paultre, P.; Siqueira, G.H. Seismic fragility of bridges: An approach coupling multiple-stripe analysis and Gaussian mixture for multicomponent structures. Earthq. Spectra 2022, 38, 254–282. [Google Scholar] [CrossRef]
- Franchini, A.; Sebastian, W.; D’Ayala, D. Surrogate-based fragility analysis and probabilistic optimisation of cable-stayed bridges subject to seismic loads. Eng. Struct. 2022, 256, 113949. [Google Scholar] [CrossRef]
- Kildashti, K.; Makki Alamdari, M.; Kim, C.W.; Gao, W.; Samalia, B. Drive-by-bridge inspection for damage identification in a cable-stayed bridge: Numerical investigations. Eng. Struct. 2020, 223, 110891. [Google Scholar] [CrossRef]
- Sebastian, W.M.; Johnson, M. Interpretation of sensor data from in situ tests on a transversely bonded fibre-reinforced polymer road bridge. Struct. Health Monit. 2019, 18, 1074–1091. [Google Scholar] [CrossRef]
- Mengge, W.; Hao, Z.; Hongzhe, D.; Luming, S. A deep learning-aided seismic fragility analysis method for bridges. Structures 2022, 40, 1056–1064. [Google Scholar]
- Minnucci, L.; Scozzese, F.; Carbonari, S.; Gara, F.; Dall’Asta, A. Innovative Fragility-Based Method for Failure Mechanisms and Damage Extension Analysis of Bridges. Infrastructures 2022, 7, 122. [Google Scholar] [CrossRef]
- Collier, C.J.; Elnashai, A.S. A procedure for combining vertical and horizontal seismic action effects. J. Earthq Eng. 2001, 5, 521–539. [Google Scholar] [CrossRef]
- Zhong, J.; Zhu, Y.; Han, Q. Impact of vertical ground motion on the statistical analysis of seismic demand for frictional isolated bridge in near-fault regions. Eng. Struct. 2023, 278, 115512. [Google Scholar] [CrossRef]
- Karatzetzou, A.; Stefanidis, S.; Stefanidou, S.; Tsinidis, G.; Pitilakis, D. Unified hazard models for risk assessment of transportation networks in a multi-hazard environment. Int. J. Disaster Risk Reduct. 2022, 751, 102960. [Google Scholar] [CrossRef]
- Yoon, Y.H.; Ataya, S.; Mahan, M.; Malek, A.; Abrahamson, N.; Zokaie, T.; Ong, R.; Ahmed, A. Total risk model and loss analysis of probabilistic damage control application in seismic design of highway bridges. J. Bridge Eng. 2022, 27, 04022020. [Google Scholar] [CrossRef]
- Caigui, H.; Libo, C.; Leqia, H.; Weidong, Z. Comparative assessment of seismic collapse risk for non-ductile and ductile bridges: A case study in China. Bull Earthq. Eng. 2021, 19, 6641–6667. [Google Scholar]
- NTC 2018–Norme Tecniche per le Costruzioni (NTC) Decreto Ministeriale, 17 January 2018 (In Italian). Ministero delle Infrastrutture e dei Trasporti, Rome, Italy. Available online: https://www.gazzettaufficiale.it (accessed on 12 February 2023).
- Picinotti, P.F. Relazione Illustrativa di Microzonazione Sismica del Comune di Terenzo; Regione Emilia-Romagna: Terenzo, Italy, 2017. (In Italian) [Google Scholar]
- Hashash, Y.M.A.; Musgrove, M.I.; Harmon, J.A.; Ilhan, O.; Xing, G.; Numanoglu, O.; Groholski, D.R.; Phillips, C.A.; Park, D. DEEPSOIL 7, User Manual; Board of Trustees of University of Illinois at Urbana-Champaign: Urbana, IL, USA, 2020. [Google Scholar]
- Seed, H.B.; Idriss, I.M. Soil Moduli and Damping Factors for Dynamic Response Analyses; Technical Report; California University: Berkeley, CA, USA; Earthquake Engineering Research Center: San Francisco, CA, USA, 1970. [Google Scholar]
- Newmark, N.M.; Hall, W.J. Earthquake Spectra and Design; Engineering Monographs, EERI: Oakland, CA, USA, 1982. [Google Scholar]
- Romeo, R. Le azioni sismiche e le categorie di sottosuolo. G. Di Geol. Appl. 2007, 6, 65–80. (In Italian) [Google Scholar]
- Liberatore, D.; Pagliaroli, A. Verifica della sicurezza sismica dei Musei Statali. Applicazione O.P.C.M. 3274/2003 s.m.i. e della Direttiva P.C.M. 12.10.2007. Convenzione Arcus–DG Rep. n. 113/2011 del 30/09/2011. Convenzione DG–Consorzio ReLUIS Rep. n. 21/2011 del 26/10/2011. Responsabile Scientifico: Domenico Liberatore. Referente Tecnico: Luigi Sorrentino (In Italian). Ministero della Cultura, Rome, Italy. Available online: https://www.beniculturali.it (accessed on 10 February 2023).
- Iervolino, I.; Galasso, C.; Cosenza, E. REXEL: Computer aided record selection for code-based seismic structural analysis. Bull. Earthq. Eng. 2010, 8, 339–362. [Google Scholar] [CrossRef]
- Iervolino, I.; Chioccarelli, E.; Convertito, V. Engineering design earthquakes from multimodal hazard disaggregation. Soil Dyn. Earthq. Eng. 2011, 31, 1212–1231. [Google Scholar] [CrossRef]
- Cetraro, F. Approccio Geotecnico Sugli Effetti Della Risposta Sismica Locale; Flaccovio Editore: Palermo, Italia, 2019. (In Italian) [Google Scholar]
- Seismosoft, “SeismoMatch–Verification Report”. Available online: www.seismosoft.com (accessed on 10 January 2023).
- Corritore, D.; Paolacci, F. Performance-based earthquake engineering analysis of short-medium span steel-concrete composite bridges. In Proceedings of the 8th International Conference on Computational Methods in Structural Dynamics and Earthquake Engineering, COMPDYN 2021, Athens, Greece, 28–30 June 2021. Code 174550. [Google Scholar]
- Paolacci, F.; Giannini, R.; Alessandri, S.; Corritore, D. On the cyclic behaviour of new pier-to-deck connections for short-medium span composite I-girder bridges. J. Traffic Transp. Eng. 2018, 5, 439–453. [Google Scholar] [CrossRef]
- Jalayer, F.; Elefante, L.; Iervolino, I.; Manfredi, G. Knowledge-Based Performance Assessment of Existing RC Buildings. J. Earthq. Eng. 2011, 15, 362–389. [Google Scholar] [CrossRef]
- Ahmed, S.; Abarca, A.; Perrone, D.; Monteiro, R. Large-scale seismic assessment of RC buildings through rapid visual screening. Int. J. Disaster. Risk Reduct. 2022, 80, 103219. [Google Scholar] [CrossRef]
- Kent, D.C.; Park, R. Flexural members with confined concrete. J. Struct. Div. 1971, 97, 1969–1990. [Google Scholar] [CrossRef]
- Perrone, D.; Rodriguez, D.; Filiatrault, A.; Brunesi, E.; Beiter, C.; Piccinin, R. A Framework for the Quantification of Non-Structural Seismic Performance Factors. J. Earthq. Eng. 2022, 26, 8468–8494. [Google Scholar] [CrossRef]
- Eurocode 8–Design of Structures for Earthquake Resistance—Part 2: Bridges. European Community, Bruxelles, Belgium. Available online: http://eurocodes.jrc.ec.europa.eu (accessed on 11 February 2023).
- Leger, P.; Wilson, E.L.; Clough, R.W. The Use of Load Dependent Vectors for Dynamic and Earthquake Analyses; Earthquake Engineering Research Center report; University of California, Berkeley: Berkeley, CA, USA, 1986. [Google Scholar]
- Crespi, P.; Franchi, A.; Giordano, N. Multimodal Pushover Analysis for R.C. Bridges. Appl. Mech. Mater. 2015, 725, 888–895. [Google Scholar] [CrossRef]
- Verderame, G.M.; Stella, A.; Cosenza, E. Le Proprietà Meccaniche degli Acciai Impiegati nelle Strutture in Ca Realizzate negli Anni’60. In Proceedings of the X Congresso Nazionale L’ingegneria Sismica in Italia, Potenza-Matera, Italia, 9–13 September 2001. [Google Scholar]
- Priestley, M.J.N.; Calvi, G.M.; Kowalsky, M.J. Displacement-Based Seismic Design of Structures, 2nd ed.; IUSS Press: Pavia, Italy, 2007; ISBN 88-85701-05-2. [Google Scholar]
- Chopra, A.; Goel, R.K. A modal pushover analysis procedure for estimating seismic demands for buildings. Earthq. Eng. Struct. Dyn. 2002, 31, 561–582. [Google Scholar] [CrossRef] [Green Version]
- Alici, F.S.; Sucuoglu, H. Practical Implementation of Generalized Force Vectors for the Multimodal Pushover Analysis of Building Structures. Earthq. Spectra 2014, 31, 1043–1067. [Google Scholar] [CrossRef]


| GEOMETRY | Slab Width [m] | Conventional IT Code Lanes | Length L [m] | L Remaining [m] |
| 8.12 | 2 | 3 | 2.12 | |
| LOADS | Conventional IT Code Lane | Concentrated Loads [kN/m] | Distributed Loads [kN/m2 × m] | |
| 1 | 300 | 27 | ||
| 2 | 200 | 7.5 | ||
| remaining | 0 | 5.3 | ||
| Total loads | 500 | 39.8 | ||
| Input Parameters | ||||||
|---|---|---|---|---|---|---|
| ag | F0 | Tc* | Ss | Cc | St | q |
| 0.243 | 2.560 | 0.307 | 1.327 | 1.550 | 1.100 | 1.000 |
| Output Parameters | ||||||
| S | η | Tb | Tc | Td | ||
| 1.459 | 1.000 | 0.159 | 0.476 | 2.573 | ||
| Depth [m] | Shear Wave Velocity (β) [m/s] | Thickness of Layer (H) [m] | |
|---|---|---|---|
| From | To | ||
| 0 | 0.5 | 78 | 0.5 |
| 0.5 | 1 | 138 | 0.5 |
| 1 | 4.2 | 224 | 3.2 |
| 4.2 | 6.4 | 296 | 2.2 |
| 6.4 | 8.4 | 362 | 2 |
| 8.4 | 173.4 | 810 | 165 |
| 173.4 | infinite | 1645 | infinite |
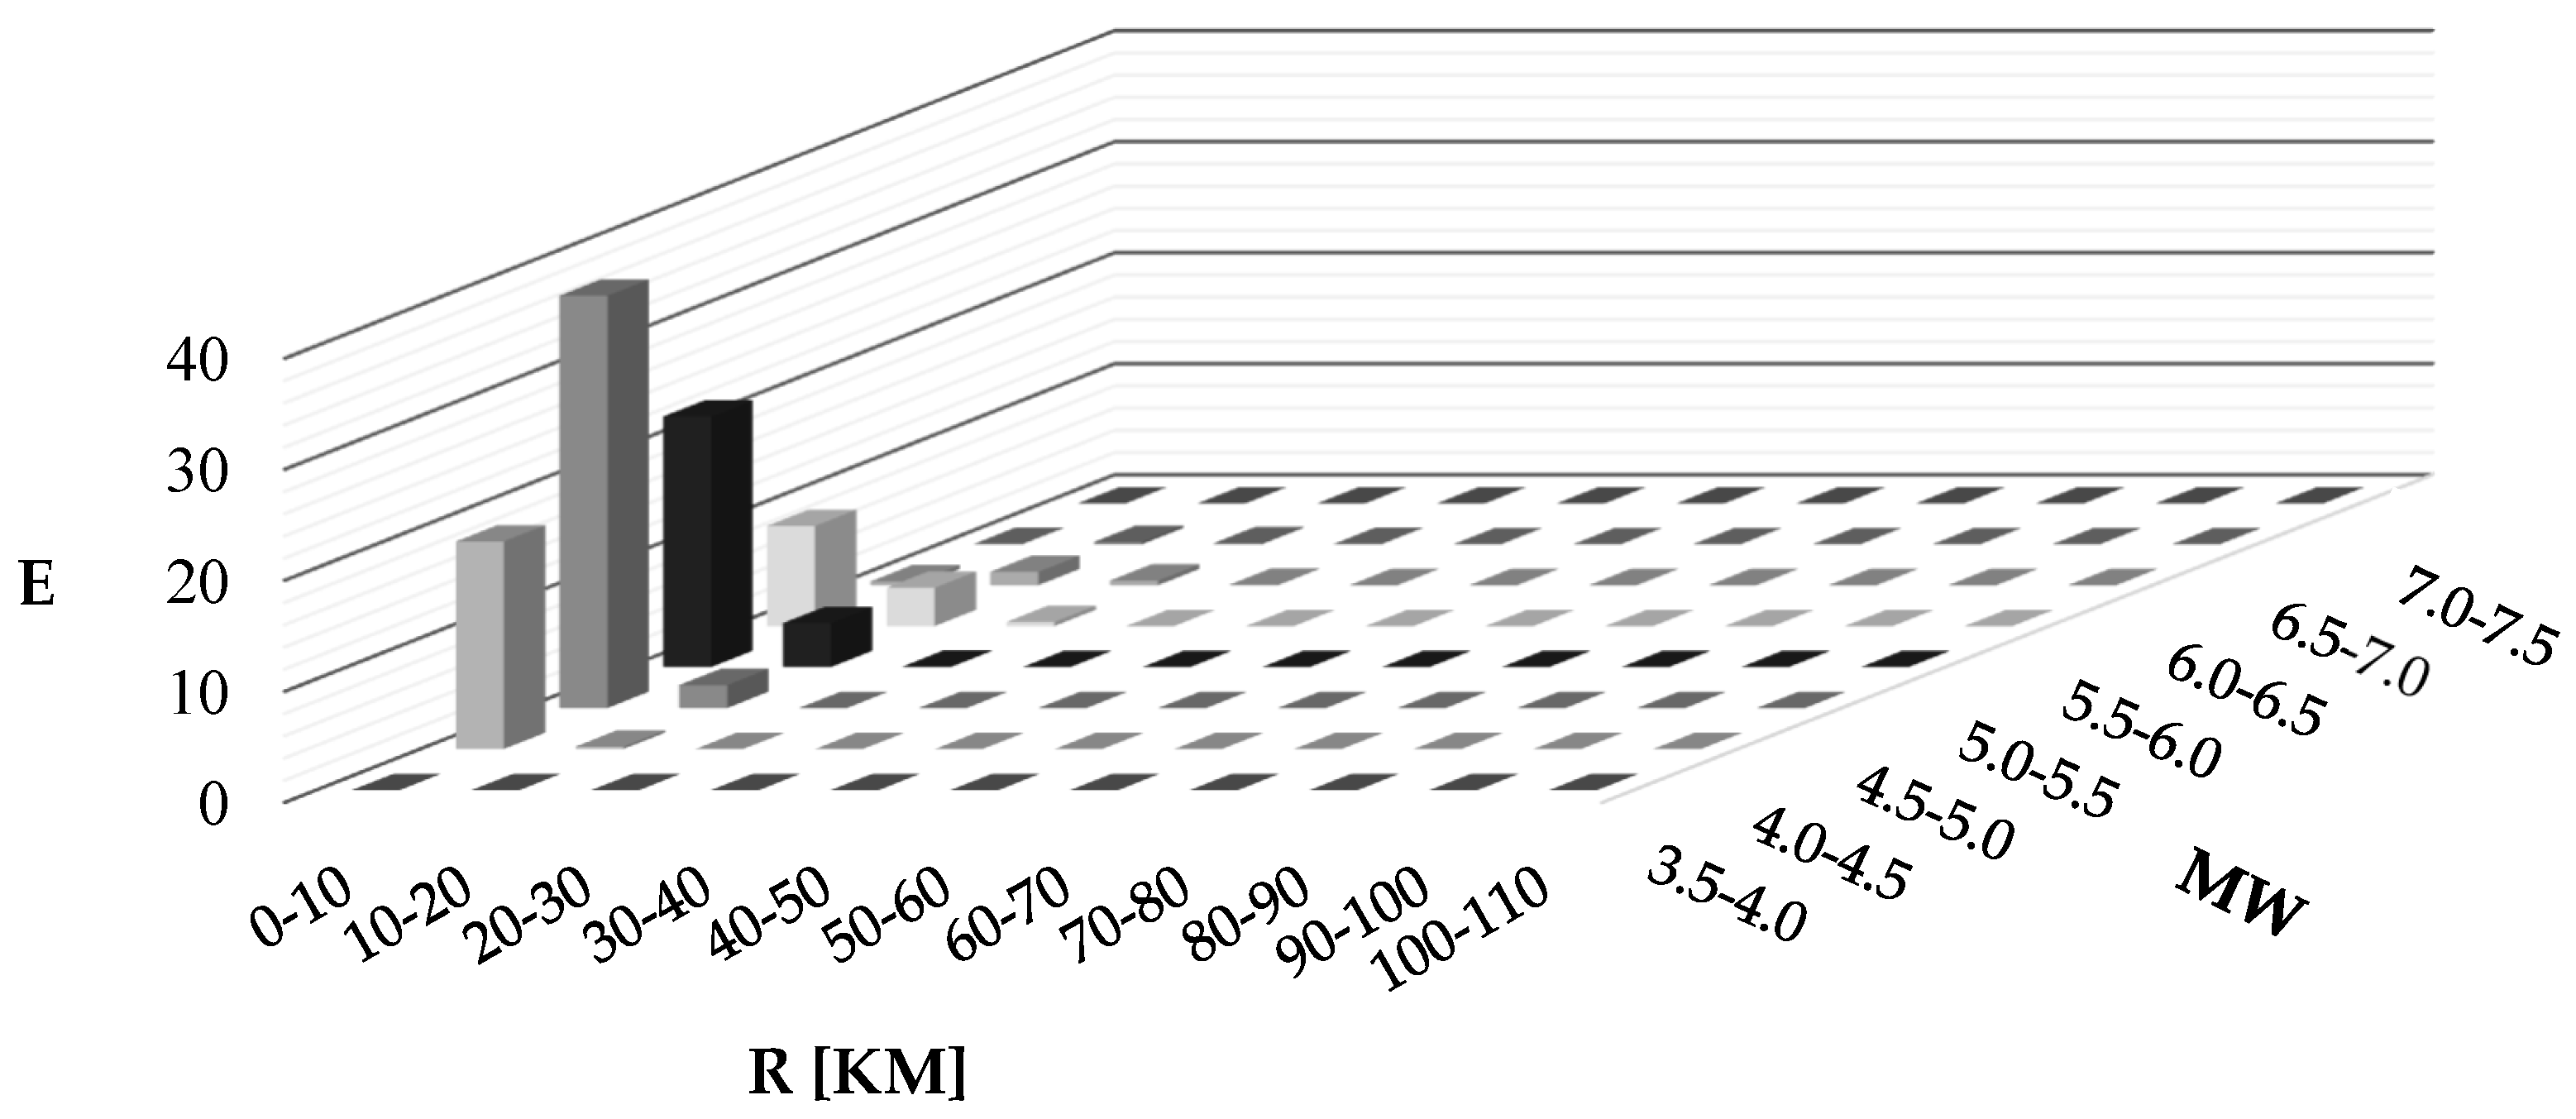
| Signal Source | Station Code | Nation | Event | Mw | Epicentral Location | Epicentral Distance [km] | PGA [g] |
|---|---|---|---|---|---|---|---|
| ESSEA * | MI05 | Italia | 7 April 2009 17:47 | 5.5 | Fossa (AQ) | 3.6 | 0.66 |
| DPC ** | MMO | Italia | 30 October 2016 06:40 | 6.5 | Norcia (PG) | 19.3 | 0.19 |
| DPC ** | BSC | Italia | 23 November 1980 18:34 | 6.9 | Laviano (SA) | 28.3 | 0.09 |
| DPC ** | CLO | Italia | 26 October 2016 19:18 | 5.9 | Visso (MC) | 10.8 | 0.22 |
| DPC ** | LSS | Italia | 24 August 2016 01:36 | 6.0 | Accumoli (RI) | 26.7 | 0.02 |
| DPC ** | MTR | Italia | 6 April 2009 01:32 | 6.1 | L’aquila (AQ) | 23.1 | 0.06 |
| DPC ** | VGG | Italia | 9 September 1998 11:28 | 5.6 | Laino Borgo (CS) | 2.5 | 0.08 |
| Kv (vertical stiffness along X-axes) | 1,533,877 | N/mm |
| Kh (horizontal stiffness, X and Y plane) | 2857 | N/mm |
| Kα,x (bending stiffness about X-X axes) | 19.8 × 10⁹ | Nmm |
| Kα,y (bending stiffness about Y-Y axes) | 35.2 × 10¹⁰ | Nmm |
| Mode N° | MODAL ANALYSIS | RITZ EIGENVALUES | ||||||||
|---|---|---|---|---|---|---|---|---|---|---|
| X-DIR | Y-DIR | T (s) | T (s) | X-DIR | Y-DIR | |||||
| MASS (%) | SUM (%) | MASS (%) | SUM (%) | MASS (%) | SUM (%) | MASS (%) | SUM (%) | |||
| 1 | 9.74 | 9.74 | 0.40 | 0.40 | 1.36 | 1.36 | 9.74 | 9.74 | 0.40 | 0.40 |
| 2 | 25.67 | 3.,41 | 0.00 | 0.40 | 1.32 | 1.32 | 25.67 | 35.41 | 0.00 | 0.40 |
| 3 | 7.81 | 43.22 | 0.34 | 0.73 | 1.23 | 1.23 | 7.81 | 43.22 | 0.34 | 0.73 |
| 4 | 8.41 | 51.63 | 0.00 | 0.74 | 1.19 | 1.19 | 8.41 | 51.63 | 0.00 | 0.74 |
| 5 | 2.38 | 54.01 | 0.01 | 0.74 | 1.10 | 1.10 | 2.38 | 54.01 | 0.01 | 0.74 |
| 6 | 8.57 | 62.58 | 0.01 | 0.75 | 1.07 | 1.07 | 8.57 | 62.58 | 0.01 | 0.75 |
| 7 | 2.87 | 65.45 | 0.01 | 0.76 | 0.98 | 0.98 | 2.87 | 65.45 | 0.01 | 0.76 |
| 8 | 3.00 | 68.45 | 0.04 | 0.80 | 0.92 | 0.92 | 3.06 | 68.50 | 0.04 | 0.80 |
| 9 | 0.56 | 69.01 | 0.00 | 0.80 | 0.91 | 0.90 | 0.63 | 69.13 | 0.00 | 0.80 |
| 10 | 0.22 | 69.23 | 5.53 | 6.33 | 0.89 | 0.89 | 0.24 | 69.37 | 6.05 | 6.85 |
| 11 | 0.10 | 69.33 | 0.00 | 6.34 | 0.89 | 0.89 | 0.16 | 69.53 | 4.56 | 11.41 |
| 12 | 0.20 | 69.52 | 5.03 | 11.36 | 0.89 | 0.86 | 6.78 | 76.31 | 0.05 | 11.45 |
| 13 | 6.58 | 76.10 | 0.06 | 11.42 | 0.86 | 0.81 | 0.00 | 76.31 | 11.50 | 22.96 |
| 14 | 0.06 | 76.16 | 0.06 | 11.49 | 0.85 | 0.80 | 4.06 | 80.37 | 0.01 | 22.97 |
| 15 | 0.05 | 76.21 | 0.02 | 11.51 | 0.83 | 0.78 | 0.08 | 80.46 | 9.17 | 32.14 |
| 16 | 0.06 | 76.27 | 0.06 | 11.56 | 0.83 | 0.76 | 4.17 | 84.62 | 0.12 | 32.26 |
| 17 | 1.03 | 77.29 | 0.13 | 11.69 | 0.81 | 0.74 | 0.05 | 84.68 | 30.35 | 62.61 |
| 18 | 0.14 | 77.43 | 11.63 | 23.33 | 0.81 | 0.72 | 1.75 | 86.43 | 0.55 | 63.16 |
| 19 | 1.64 | 79.07 | 0.15 | 23.48 | 0.80 | 0.71 | 0.09 | 86.52 | 6.07 | 69.22 |
| 20 | 0.86 | 79.93 | 0.01 | 23.49 | 0.79 | 0.54 | 0.01 | 86.52 | 0.12 | 69.34 |
| 21 | 0.16 | 80.09 | 0.83 | 24.31 | 0.79 | 0.48 | 0.00 | 86.53 | 0.06 | 69.41 |
| 22 | 0.02 | 80.11 | 6.52 | 30.83 | 0.79 | 0.43 | 0.12 | 86.64 | 0.00 | 69.41 |
| 23 | 0.73 | 80.84 | 0.27 | 31.10 | 0.78 | 0.35 | 0.52 | 87.16 | 0.02 | 69.43 |
| 24 | 0.62 | 81.46 | 0.01 | 31.12 | 0.77 | 0.34 | 1.39 | 88.55 | 0.00 | 69.43 |
| 25 | 0.03 | 81.49 | 0.30 | 31.42 | 0.77 | 0.28 | 2.48 | 91.04 | 0.03 | 69.46 |
| 26 | 2.15 | 83.64 | 0.05 | 31.47 | 0.76 | 0.24 | 0.10 | 91.14 | 1.15 | 70.61 |
| 27 | 0.24 | 83.88 | 0.01 | 31.48 | 0.76 | 0.19 | 1.90 | 93.04 | 0.11 | 70.71 |
| 28 | 0.01 | 83.89 | 1.13 | 32.62 | 0.75 | 0.15 | 0.05 | 93.09 | 7.10 | 77.81 |
| 29 | 0.02 | 83.92 | 0.28 | 32.90 | 0.74 | 0.08 | 4.10 | 97.19 | 0.08 | 77.89 |
| 30 | 0.02 | 83.94 | 0.09 | 32.99 | 0.74 | 0.07 | 0.08 | 97.26 | 12.20 | 90.09 |
| q | Med | Multimate,d | MRd (0.75 × MUltimate,d) | ULS Safety Check (Mrd > Med) | Med/Mrd (Sectional Safety Factors) |
|---|---|---|---|---|---|
| 5 | 1655 | 2445 | 1834 | OK | 0.90 |
| 4.5 | 1815 | 2445 | 1834 | OK | 0.99 |
| 4 | 1990 | 2445 | 1834 | NOT VERIFIED | 1.08 |
| Scenario A | Scenario B | |
|---|---|---|
| NSS | 0.22 | 1.05 |
| SS | 0.12 | 0.58 |
| NLDA --> NSS | NLDA --> SS | |||||||
|---|---|---|---|---|---|---|---|---|
| X-DIR | Y-DIR | X-DIR | Y-DIR | |||||
| Pile n° | Scenario A | Scenario B | Scenario A | Scenario B | Scenario A | Scenario B | Scenario A | Scenario B |
| 1 | 20.54 | 1.89 | 215.80 | 5.79 | 3.62 | 3.84 | 66.98 | 66.98 |
| 2 | 2.13 | 3.46 | 4.45 | 9.25 | 1.00 | 1.15 | 1.41 | 1.13 |
| 3 | 2.31 | 2.85 | 4.57 | 7.23 | 1.09 | 1.31 | 1.33 | 1.07 |
| 4 | 2.21 | 3.03 | 4.42 | 7.50 | 1.03 | 1.27 | 1.33 | 1.07 |
| 5 | 2.25 | 3.00 | 4.99 | 6.80 | 1.05 | 1.31 | 1.45 | 1.16 |
| 6 | 2.51 | 6.18 | 5.64 | 14.89 | 1.18 | 1.44 | 1.70 | 1.43 |
| 7N | 2.46 | 2.67 | 2.69 | 2.69 | 1.22 | 1.31 | 0.97 | 0.85 |
| 7S | 2.23 | 2.70 | 2.31 | 2.75 | 1.14 | 1.37 | 0.93 | 0.86 |
| 8N | 2.80 | 2.69 | 2.14 | 2.74 | 1.36 | 1.43 | 0.92 | 0.83 |
| 8S | 2.58 | 2.78 | 2.49 | 2.63 | 1.27 | 1.36 | 0.96 | 0.91 |
| 9N | 2.67 | 2.78 | 2.99 | 2.63 | 1.33 | 1.38 | 1.06 | 0.90 |
| 9S | 2.60 | 3.05 | 2.41 | 2.88 | 1.32 | 1.37 | 0.97 | 0.90 |
| 10N | 2.78 | 3.05 | 3.43 | 2.89 | 1.34 | 1.39 | 1.09 | 0.95 |
| 10S | 2.66 | 3.42 | 2.37 | 3.99 | 1.29 | 1.34 | 0.95 | 0.87 |
| 11N | 2.63 | 3.42 | 2.86 | 4.03 | 1.30 | 1.35 | 0.95 | 0.83 |
| 11S | 3.08 | 4.09 | 2.79 | 7.97 | 1.38 | 1.43 | 1.01 | 0.89 |
| 12N | 2.81 | 3.96 | 4.41 | 7.78 | 1.21 | 1.44 | 1.23 | 1.08 |
| 12S | 2.76 | 3.06 | 4.42 | 3.62 | 1.22 | 1.41 | 1.30 | 1.10 |
| 13N | 2.83 | 3.18 | 4.54 | 3.66 | 1.36 | 1.42 | 1.20 | 1.10 |
| 13S | 2.89 | 3.86 | 3.08 | 2.20 | 1.35 | 1.43 | 1.07 | 0.95 |
| 14N | 3.32 | 4.04 | 2.13 | 2.28 | 1.31 | 1.59 | 0.91 | 0.87 |
| 14S | 2.96 | 3.32 | 2.14 | 4.31 | 1.29 | 1.56 | 0.92 | 0.87 |
| 15N | 2.77 | 3.17 | 3.43 | 4.25 | 1.32 | 1.39 | 1.08 | 0.98 |
| 15S | 2.86 | 19.41 | 3.12 | 76.82 | 1.33 | 1.41 | 1.05 | 0.95 |
Disclaimer/Publisher’s Note: The statements, opinions and data contained in all publications are solely those of the individual author(s) and contributor(s) and not of MDPI and/or the editor(s). MDPI and/or the editor(s) disclaim responsibility for any injury to people or property resulting from any ideas, methods, instructions or products referred to in the content. |
© 2023 by the authors. Licensee MDPI, Basel, Switzerland. This article is an open access article distributed under the terms and conditions of the Creative Commons Attribution (CC BY) license (https://creativecommons.org/licenses/by/4.0/).
Share and Cite
Collura, D.; Nascimbene, R. Comparative Assessment of Variable Loads and Seismic Actions on Bridges: A Case Study in Italy Using a Multimodal Approach. Appl. Sci. 2023, 13, 2771. https://doi.org/10.3390/app13052771
Collura D, Nascimbene R. Comparative Assessment of Variable Loads and Seismic Actions on Bridges: A Case Study in Italy Using a Multimodal Approach. Applied Sciences. 2023; 13(5):2771. https://doi.org/10.3390/app13052771
Chicago/Turabian StyleCollura, Daniele, and Roberto Nascimbene. 2023. "Comparative Assessment of Variable Loads and Seismic Actions on Bridges: A Case Study in Italy Using a Multimodal Approach" Applied Sciences 13, no. 5: 2771. https://doi.org/10.3390/app13052771