Article

Enhancing the Fatigue of Mechanical Systems Such as Dispensers Entrenched on Generalized Life-Stress Models and Sample Sizes

1
Manufacturing Technology, Mechanical Technology Faculty, Ethiopian Technical University, Addis Ababa P.O. Box 190310, Ethiopia
2
Department of Mechanical Engineering, School of Engineering and Computer Science, Baylor University, Waco, TX 76798-7356, USA
3
Mechanical Engineering Research Institute of the Russian Academy of Sciences, Department of Strength, Survivability and Safety, 101990 Moscow, Russia
*
Author to whom correspondence should be addressed.
Appl. Sci. 2023, 13(3), 1358; https://doi.org/10.3390/app13031358
Submission received: 15 November 2022 / Revised: 16 January 2023 / Accepted: 18 January 2023 / Published: 19 January 2023
(This article belongs to the Special Issue Advances on Structural Engineering, Volume III)

Abstract

:
To lengthen the life of a mechanical system, parametric accelerated life testing (ALT) is recommended as an established way to help identify structural imperfections and reduce fatigue-related failures. It involves (1) a parametric ALT scheme, (2) fatigue design, (3) ALTs with alterations, and (4) an estimate of whether design(s) achieve the BX lifetime. The application of a quantum-transported time to failure prototype and a sample size expression is also suggested. The improvements in the reliability of a water dispenser made of stainless steel or polypropylene (PP) in a bottom-mount domestic refrigerator was used as a case study. In the first ALT, the hinge and front corner of the dispensing system was cracked. The water dispenser lever was altered by increasing the thickness of its ribs and fillets. In the second ALT, the altered dispensing lever system cracked because there was an insufficient thickness in its front corner for impact loading. The critical design factors for improving reliability were corner fillet rounding and rib thickening in a dispenser lever. As there were no difficulties in the third ALT, the dispenser life was verified to have a B1 life of 10 years.

1. Introduction

To be competitive in the marketplace, even traditional appliances, such as refrigerators, must be improved with new technologies and features to meet the demand of consumers. If a system with these new features is rushed to the market without sufficient testing that mimics consumers’ use of these features, there is the potential for premature failure of the system due to these new features. These premature failures can negatively affect the perception of the quality of the products produced by the manufacturer. To avoid having unexpected design flaws in the field, the new features of a designed system should be assessed in the developing stages of the product before releasing into the field. Developing a new mechanical product requires a methodology that includes reliability quantitative (RQ) specifications [1].
To prevent recalls of a mechanical system from the field that have design defects [2,3,4], the system should be designed to survive the typical operating conditions implemented by consumers who purchase and use the product. The Boeing 737 MAX passenger aircraft from March 2019 to December 2020 was grounded after 346 persons lost their lives in a pair of crashes. The airplanes adopted the CFM International LEAP-1B engines using the optimized 68-inch fan design; these engines consumed 12% less fuel and were 7% lighter than other engines [5,6]. Investigators, including the Ethiopian Civil Aviation Authority, tentatively deduced that the crash was created by the aircraft’s engine design. Potential problematic parts need to be verified by proper reliability testing, such as ALT, which may generate reliability quantitative (RQ) statements [7,8].
Fatigue is often the primary origin of failure in metallic components, accounting for approximately 80–95% of all structural failures [9]. Fatigue exhibits itself in cracks that typically originate from high-stress concentrations, such as grooves, thin surfaces, holes, etc., in mechanical products. Fatigue is the weakening of a material often created by cyclic loading during the customer usage of the mechanical system. Fatigue failures may create disastrous outcomes in a mechanical product such that the system failure might result in injury or death to the persons using the product. A significant consideration is being focused on the low-cycle fatigue of superalloys, particularly in the field of turbine engines made of nickel-based polycrystalline materials [10,11]. Fatigue also has some quantifiable elements, such as the stress ratio, R (=σminmax), or mean stress, which can be interpreted as the relationship of the maximum cyclic stress to the minimum cyclic stress [12]. Employing a stress ratio, which is manifested as an accelerated factor (AF) in parametric ALT, can help pinpoint the structural imperfections (stress raisers) in the mechanical system.
Engineers often identify designs and fix imperfections using Taguchi’s robust method [13,14] and/or design of experiments (DOE) [15]. DOE is a structured way to determine the correlation between elements influencing a process and its production. The objective of DOE is to ensure that the components are designed in the most favorable way for the working (or environmental) circumstances. DOE is performed for some of the factors that affect the system designs. The usefulness of a factor is demonstrated by analysis of variance (ANOVA). Taguchi’s method shows the robustness of system design and its evaluation. It places the optimum design where the ‘‘noise’’ factor does not have an effect. Because the DOE user, including Taguchi’s design method, may not be aware of which factors are important and there is no failure mechanism such as fatigue in the algorithm, these approaches may demand large computations, but they may not provide for optimal design.
Engineers often have used the strength of materials as one input to traditional design [16,17]. A recent study indicated that a critical factor in fracture mechanics [18] could be using fracture toughness as a property of material strength. With the application of quantum mechanics, designers recognize that product failure occurs from microscale or nanoscale voids observed in engineering plastics or metallic alloys. If limited parts and testing times are used [19,20,21,22,23,24], this approach may not reproduce the structural imperfections of parts in a multimodule structure or pinpoint the fatigue that happens to the parts by end-users in the field. To identify the fatigue in a product operated by a machine, a life-stress prototype [25,26] might be combined with a (quantum) mechanics approach to identify an existing imperfection or crack in materials because failure often stochastically occurs in the areas of locally high-stress concentrations.
An alternative approach is to use the finite element method (FEM) [27,28]. Engineers believe that failure can be identified through (1) strict mathematical (Lagrangian or Newtonian) representation; (2) estimating the time response for (dynamic) loading, which produces the stress/strain in a product; (3) utilizing the established method of rainflow counts with von Mises stress [29]; and (4) assessing system usefulness by Palmgren–Miner’s principle [30]. Employing this structured approach may supply some closed formation solutions. However, this approach may not identify fatigue failure in a multimodule system that is caused by matter imperfections such as microvoids, thin surfaces, contacts, etc.
This paper suggests parametric ALT as a general way to generate reliable quantitative (RQ) statements, such as the assigned mission cycles, to pinpoint design imperfections of a new product and provide an approach for changing and improving the design of the product. This established process for identifying the causes of failure mode and improving reliability examines appropriate design responses to address failures in mechanical products such as airplanes, automobiles, appliances, etc. The structured method includes (1) an ALT strategy produced on the BX life, (2) load inspection, (3) parametric ALTs with structural modifications, and (4) an estimation of whether the product design(s) secures the desired BX life. To prove the effectiveness of the parametric ALT, it is required to assess the newly designed product in the market to reach the targeted lifetime. A quantum-transported time to failure prototype and sample size derivation are also proposed. A new water dispenser system in a bottom-mounted refrigerator (BMF) is used to demonstrate the process.

2. Parametric ALT for a System Operated by a Machinery

2.1. Denotation of BX Life

Mechanical systems (automobiles, aircraft, construction machines, and refrigerators) use power to fulfill a desired purpose through an adapting mechanism [31]. Forces are used to provide motion of mechanisms in the product. This motion means that the product will be subjected to repetitive loads. In a component of a multimodule mechanical system, fatigue occurs when there are stress raisers due to sharp edges, thin surfaces, notches, etc., in a part.
For example, a typical domestic refrigerator utilizes the vapor compression refrigeration cycle. In the evaporator, cold air is produced so that the refrigerator can maintain freshness for the foodstuffs in the freezer and refrigerator compartments. Figure 1 shows that a refrigerator includes several self-contained systems (or modules). These include the door and cupboard, boxes and shelves, reciprocating compressor or electric motor, condenser and evaporator, water and ice equipment, control system, and other components. A refrigerator can be made up of as many as 2000 parts. It can be composed of 20 units (or 8~10 modules), with all units possessing approximately 100 components (or parts).
If the target of a product’s lifetime is assumed to be no fewer than a B20 life of 10 years, the life target of all units might be at least a B1 life of 10 years. When a new module, designated as Module #3 in Figure 2, has a structural imperfection and fails prematurely, this module determines the system life for the entire refrigerator.
The BX lifetime, LB, might be defined as a measure of life that X percent of the population could have failed. That is, “BX life Y years” is a more suitable phrase. For instance, if the life of a mechanical system is a B20 life of 10 years, 20% of a collection of items under consideration could have failed for ten years. Conversely, as the inverse of the failure rate, the B60 lifetime, which signifies the mean time to failure (MTTF), should not be employed for the product life because it is too long of a period of time for 60% of the product population to fail. The BX life might designate a more appropriate index for product life.

2.2. Placing a Complete ALT Strategy

Reliability can be expressed as the system’s capability to run under specified situations for an expressed mean length of time [32]. It is typically illustrated with the “bathtub curve”, which is described as the middle curve in Figure 3. The bathtub curve has three sections which can be stated according to the shape parameter on the Weibull plot. That is, in the first section, there is a decreasing rate of failure in the earlier portion of the mechanical product’s lifetime (β < 1). In the second section, there is the constant rate of failure (sometimes a slanted line, β = 1) during the middle life of the product, which follows an exponential distribution. Eventually, there is an increasing rate of failure to the end of the merchandise’s lifetime (β > 1) that pursues a Weibull distribution function. There is no initial value of the shape parameter, β, because there is no testing data or market statics. As an initial guess, β = 2 might be used in the wear-out section before it will be validated by parametric ALT.
The reliability function, R ( t ) , is defined as R ( t ) = 1 F ( t ) ( o r   X ) . The accumulative distribution function (CDF), F ( t ) ( o r   X ) = 1 R ( t ) , is defined by:
F ( t ) = P ( T < t )
The failure rate, λ, on the (slanted) bathtub curve in Figure 3 can be expressed as:
λ ( t ) = f ( t ) / R ( t ) = d F ( t ) / d t R ( t ) = ( 1 R ( t ) ) R ( t ) = R ( t ) R ( t )
where f is the failure density function.
If Equation (2) is integrated with respect to time, the X% cumulative failure, F(LB), at t = LB can be evaluated. That is, F(LB) might be stated as follows:
F ( t ) = λ ( t ) d t = l n R ( t )
Or A ( o r X ) = λ · L B = 0 L B λ ( t ) · d t = l n R ( L B ) = l n ( 1 F ) F ( L B )
If T1 is assumed to be the time of the first failure in the second section of the bathtub, reliability, R(t), will be stated as follows:
R ( t ) = P ( T 1 > t ) = P ( n o f a i l u r e i n ( 0 , t ] ) = ( m ) 0 e m 0 ! = e m = e λ t
where m is the Poisson parameter, which can be defined as λt (mean).
If the failure rate of a product follows the attributes of the bathtub curve, it will probably not be successful in the market. Because of design imperfections, large early failures could harm the brand name from the product launch. That is, high failure rates in the early life of a product incur the manufacturer to pay warranty expenses. The market share could be expected to eventually be negatively impacted by the high failure rates. The manufacturer would need to improve the product by (1) eliminating unanticipated early failures, (2) reducing random nonsuccess for its operation period, and (3) increasing its system life compared with that of other companies.
As the design is improved, the product life from the market enhances, and its failure rate decreases. For such circumstances, the traditional bathtub curve should be transformed into an uncomplicated curve with a small failure rate and a lengthier lifetime. In the end, if the product is well designed, the accumulated failure rate of the product, F(t), is reduced until the desirable lifetime is achieved. The product’s reliability curve would then resemble the line labeled the “Hockey stick line” in Figure 3.
The reliability of a mechanical system in Equation (5) can be straightforwardly defined as the product of failure rate,   λ , and lifetime, L B . That is:
R ( L B ) = 1 F ( L B ) = e λ L B 1 λ L B
This relationship is satisfactory below approximately 20% of the accumulative failure rate [33].
As an example, consider a water dispenser in a domestic refrigerator. It involves a simple mechanical procedure. First, a consumer pushes the lever, and then water is dispensed by the lever mechanism. Because the dispenser was failing in the field, the reliability as a product of failure rate and lifetime could be estimated from statistics for the dispensers returning from the field. These failures were also important in helping identify the normal utilization patterns of purchasers of the product and recognizing potential structural imperfections in the dispenser. Identifying these usage patterns and structural imperfections allows the design engineer to optimally redesign the dispenser (Figure 4).
Based on the field data—the current life and failure rate—from the field, the basic cause(s) of the problematic dispenser lever returned from the field has been clearly identified. That is, to achieve the desired reliability from the target life, LB, and failure rate, λ, the potential structural imperfections of the product part could be identified and modified by employing a parametric ALT.
There are typically subsystems A–E in a domestic refrigerator (see Figure 1). To fulfill the objective of a system life by parametric ALT because there was no field reliability data (defined as the multiplication of failure rate and lifetime in Equation (6)), three subsystems (or modules) can be required: (1) an altered subsystem, (2) a new subsystem, and (3) a similar subsystem. The water dispenser in a domestic refrigerator used as a test case here was a subsystem that had structural imperfections that needed to be modified. Customers had been requesting the replacement of dispensers that had been failing before the expected lifetime of the domestic refrigerator. Subsystem B (Table 1) from the field statistics had a failure rate of 0.24% per year and a B1 life of 4.2 years. To respond to customer concerns, a new life objective for the dispenser was set to be a B1 life of 10 years with an accumulative failure rate of 1% over the lifetime of the system.

2.3. Derivation of the (Generalized) Life-Stress Prototype

If a consumer wants chilled water, a water dispenser system can be added as a new design feature in a refrigerator. The water dispenser needs to have enough strength for repetitive force to push it by using a lever mechanism. The following processes are included in a water dispenser. (1) The customer pushes the cup to the lever and (2) water distributes into it. The main parts of a water dispenser are made up of the dispenser cover, dispenser lever, spring, etc. Consequently, the product will be subjected to repetitive stresses due to the loading/unloading of cups that are used by the consumer to push on the dispenser lever. If there are (structural) flaws in the original design, such as inadequate strength to endure repetitive loading, the dispenser can fail suddenly before fulfilling its expected life (Figure 5).
In correcting the design imperfections in the structure, an engineer needs to derive the (generalized) life-stress model, based on the relationship between load and life. The engineer needs to decide how rapidly the expected failure mode might be recognized. That is why accelerated tests need to be performed. Fatigue starts to emerge due to the pre-existence of imperfections, such as tiny cracks or defects in the structure. If there is stress concentration in a part such as a notch, groove, thin area, etc., a crack will develop from a microscale void, propagate, and create failure in the system. Therefore, a quantum/transport-based life-stress prototype may be required. It is assumed that fatigue may initiate from matter imperfections—electron/void—which arise in a macro, microscopic, or nano range. Consider an (electric) particle that is controlled to proceed only in the x direction from x = 0 to x = a. The potential energy,   V ( x ) , will be defined as follows:
V ( x ) = { 0   ( 0 x a )   ( x < 0   o r   x > a )
The time-independent Schrodinger wave equation in operator form can be expressed as follows:
H ^ ψ = E ψ
where H ^ is the Hamiltonian operator in the x direction, ψ is the wave function, and E is the (electron) energy.
If H ^ = h 2 8 π 2 m d 2 d x 2 + V , this can be put in Equation (8). That is:
d 2 ψ d x 2 + 8 π 2 m h 2 ( E 0 ) ψ = 0   or   d 2 ψ d x 2 + 8 π 2 m h 2 ( E V ) ψ = 0
where m is the electron mass, h is the Planck constant, and V is the potential energy.
Because V = ∞ outside the walls, this is possible only when ψ = 0 . That is, particles are not outside the walls. Because V = 0 inside the walls, Equation (9) can be stated as follows:
d 2 ψ d x 2 + 8 π 2 m h 2 ( E 0 ) ψ = 0
or   d 2 ψ d x 2 + K 2 ψ = 0
where K 2 = 8 π 2 m E h 2 .
The solution of Equation (11) can be assumed as follows:
ψ ( x ) = A sin K x + B cos K x
where A, B = constants.
Because x = 0 or x = a at walls, ψ(0) = ψ ( a ) = 0 , B = 0, K = n π a , and E = n 2 h 2 8 m a 2 , n = 1,2,3,4.
Therefore, Equation (12) can be stated as follows:
ψ ( x ) = A sin ( n π a ) x
The probability of finding the particle in a small space between x and x + dx is given as follows:
0 a ψ 2 ( x ) d x = 1   or 0 a ( A sin ( n π a ) x ) 2 d x = 1
Therefore, the solution to Equation (12) can be obtained as follows:
ψ ( x ) = 2 a sin ( n π a ) x
where ψ ( x + a ) = ψ ( x ) , a is the (periodic) distance, and n is the principal quantum number.
The transport procedure, namely, the diffusion process of shallow-level dopants of silicon in a semiconductor, may be stated as follows (Table 2) [34,35]:
J = L D
where J is the flux, D is the propelling force, and L is the transport quantity.
For instance, as an electromagnetic field, ξ, is employed, and the impurities in metals produced by electronic movement comfortably drift to the right as the height of the junction power is reduced. The procedures for assessing the solid-state diffusion of impurities in a semiconductor, such as silicon, may be abridged by (1) electromigration-induced voiding; (2) the build-up of chloride ions; and (3) the trapping of electrons or holes. Solid-state diffusion of impurities in a semiconductor, J, might be expressed as [36]:
J = [ a C ( x a ) ] · exp [ q k T ( W 1 2 a ξ ) ] · v
= [ a 2 v e q w / k T ] · cosh q a ξ 2 k T C x + [ 2 a v e q w / k T ] C sin h q a ξ 2 k T = Φ ( x , t , T ) sin h ( a ξ ) exp ( Q k T ) = B sin h ( a ξ ) exp ( Q k T )
where A is a constant, C is the concentration amount, q is the quantity of stored electrical energy, ν is the leap frequency, Φ () is a constant quantity, a is the atom distance, ξ is the exerted field, k is Boltzmann’s constant, Q is the energy quantity, and T is the absolute temperature.
Conversely, the chemical reaction that rests on speed can be defined as follows:
K = K + K = a k T h e Δ E a S k T a k T h e Δ E + a S k T = B sin h ( a S ) exp ( Δ E k T )
where K is the reaction rate, S is the (chemical) field effect, T is the temperature, k is Boltzmann’s parameter, E is the (activation) energy, and Δ is the difference.
Equations (17) and (18) might be abridged as:
K = B sin h ( a S ) exp ( Q k T )
If Equation (19) puts an inverted expression, the life-stress (LS) prototype could be expressed as:
T F = A [ sin h ( a S ) ] 1 exp ( E a k T )
As a life-stress (LS) model, Equation (20) is proposed as a generalized formulation because the sine hyperbolic formula [ sin h ( a S ) ] 1 , indicating stress will be changed into a power or exponential expression. This equation can thus describe most LS models for a variety of failures, such as fatigue in mechanical systems. It may be expressed as follows: (1) ( S ) 1 has a little linear, (2) ( S ) n has what is contemplated, and (3) ( e a S ) 1 is large (Figure 6).
As ALT is often executed in the middle-stress range, Equation (20) can be restated as:
T F = A ( S ) n exp ( E a k T )
where n = [ l n ( T F ) l n ( S ) ] T , Q = [ l n ( T F ) l n ( 1 T ) ] S
For a stated crack and component shape, Equation (21) also might be defined as:
T F = B ( Δ K ) n exp ( Q k T )
where B is a constant quantity and Δ K = Y S ( o r   Δ σ ) π a is the stress intensity factor.
That is, as an intensity range, when ∆K is applied to matter, a crack will be produced by a particular quantity ∆a, which is dependent on the crack growth rate, ∆a/∆N, in a part of geometries (crack tip), such as sharp edges, holes, thin areas, grooves, etc. It thus propagates until it grows to a critical size. As repeated loads are applied until the objective life, LB, or mission cycles, the structural imperfections (or stress raisers) in a part may be found.
The stress of a system operated by machinery is not straightforward to compute in elevated testing. As the energy is represented as the multiplication of effort and flow, the stress starts from effort in a product [37]. Therefore, Equation (21) or (22) can be redefined as follows:
T F = A ( S ) n exp ( E a k T ) = C ( e ) λ exp ( E a k T )
where C is a constant quantity.
The acceleration factor (AF) shall be redefined as the ratio between the elevated stress quantities and normal operating circumstances. AF from Equation (23) could be altered to combine the effort notions:
A F = ( S 1 S 0 ) n [ E a k ( 1 T 0 1 T 1 ) ] = ( e 1 e 0 ) λ [ E a k ( 1 T 0 1 T 1 ) ]

2.4. Deduction of Sample Size Expression for the Design of Mechanical Systems

To acquire the assigned mission cycles of (parametric) ALT from the aimed BX life on the test strategy, which is described in Section 2.1 and Section 2.2, the sample size expression merged with AF in Equation (24), which is described in Section 2.3, shall be decided.
First, each Bernoulli trial has one of two outputs: success or failure. The cumulative probability that follows a binomial distribution for failures can be expressed as follows:
L ( p ) = r = 0 c ( n r ) p r · ( 1 p ) n r α
where n is the number of test samples and c is the assumed number of failures.
In case probability, p is tiny and n is not small; thus, Equation (25) that follows a Poisson distribution for failure shall be rewritten as follows:
L ( n · p ) = r = 0 c 1 r ! ( n · p ) r · e ( n p ) = r = 0 c 1 r ! m r · e m α
where m = parameter = n · p .
From Equation (26), when the p-value is α, parameter m follows the chi-square distribution, χ α 2 (). That is:
m = n · p ~ χ α 2 ( 2 r + 2 ) 2
The Weibull distribution for product life is widely used because it is straightforwardly expressed as a function of the characteristic life and shape parameter. Thus, if the product operation follows the Weibull distribution function, the cumulative failure rate, F(t), in Equation (1) is expressed as:
F ( t ) = 1 e ( t η ) β
where t is the elapsed time, η is the characteristic lifetime, and β is the shape parameter.
In the case of unreliability, p = F ( t ) , and reliability, 1 p = R ( t ) , Equation (28) can be inserted into Equation (25). That is:
L ( p ) = r = 0 c ( n r ) ( 1 e ( t η ) β ) r · ( e ( t η ) β ) n r α
Because e ( t η ) β 1 ( t η ) β , Equation (29) can be approximated as follows:
L ( p ) r = 0 c 1 r ! ( t η ) β r · ( 1 ( t η ) β ) n r α
Because Equations (26) and (30) have a similar form, the characteristic life with a confidence level of 100 (1 − α) can be stated as follows:
m = n · p = n · ( t η ) β ~ χ α 2 ( 2 r + 2 ) 2   o r   η α β = 2 χ α 2 ( 2 r + 2 ) · n · t β  
At BX life, LB, in Equation (28), the testing time, t, is h:
L B β x · η α β = x · 2 χ α 2 ( 2 r + 2 ) · n · t β = x · 2 χ α 2 ( 2 r + 2 ) · n · h β L B * β   for   x     0.2  
where x = 0.01F(t).
If Equation (32) is arranged again, the sample size formulation is expressed as:
n χ α 2 ( 2 r + 2 ) 2 × 1 x × ( L B * h ) β
Within a 60% confidence level, the first term χ α 2 ( 2 r + 2 ) 2 in Equation (33) is close to (r + 1), and Equation (33) can be rewritten as:
n ( r + 1 ) × 1 x × ( L B * h ) β
If the acceleration factor in Equation (24) is inserted into the testing cycles, h, Equation (34) can be expressed as:
  n ( r + 1 ) × 1 x × ( L B * A F · h a ) β
where the sample size formulation in Equation (35) may be expressed as n ~ (failure numbers + 1)·(1/accumulative failure rate)·((target lifetime/(testing plan time)) ^ β.
Equation (35) may also be confirmed as [1,38]. That is, for n r , the sample size formulation may be stated as:
n = χ α 2 ( 2 r + 2 ) 2 m β l n R L = χ α 2 ( 2 r + 2 ) 2 m β l n R L 1 = χ α 2 ( 2 r + 2 ) 2 m β l n ( 1 F L ) 1 = χ α 2 ( 2 r + 2 ) 2 × 1 l n ( 1 F L ) 1 × ( L B h ) β
where   m h / L B .
If the life target of a mechanical product (a water dispenser) is assumed to be a B1 life of 10 years, the assigned testing needs to be calculated for the tested samples under elevated conditions. In carrying out ALTs, the structural imperfections of a new mechanical system shall be pinpointed and modified to attain the desired product lifetime.

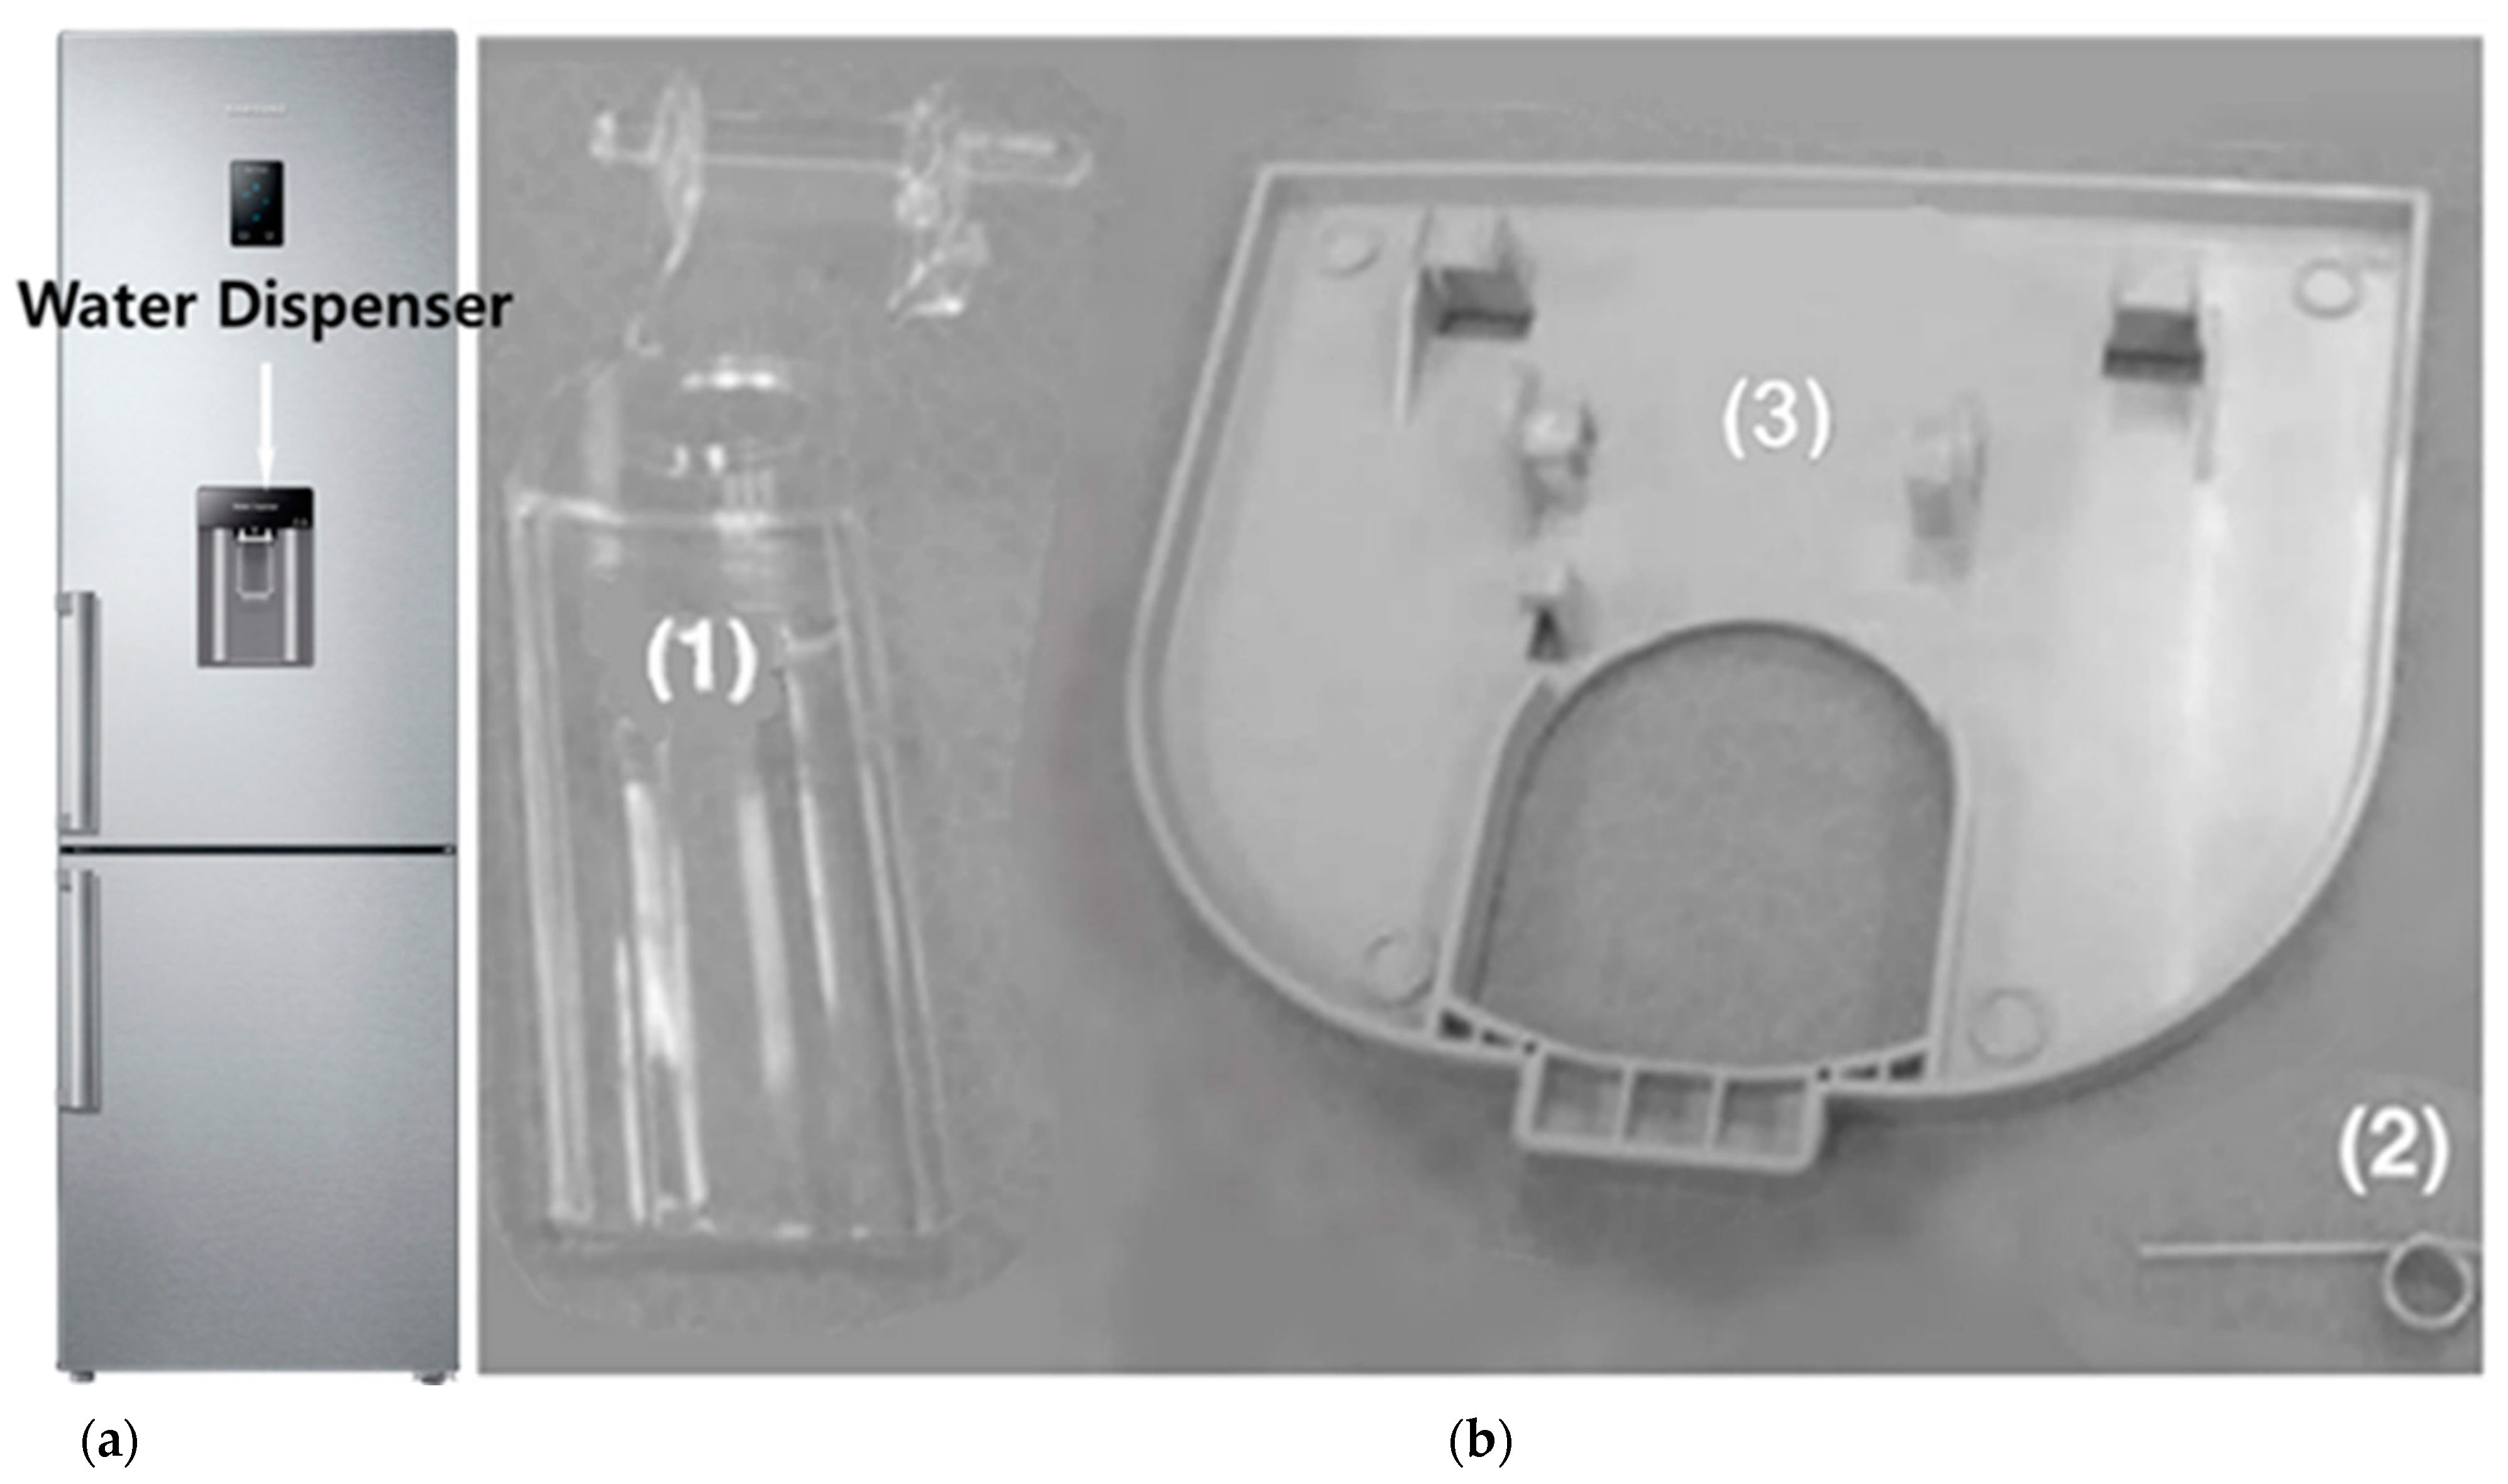
2.5. Case Study—Increasing the Life of a New Water Dispenser System in a BMF Refrigerator

Because consumers want to have the convenience of cold water being dispensed from a domestic refrigerator, a water dispenser system, including a lever, a cover, and a spring, was designed into the front of the refrigerator. The dispenser lever was also changed from stainless steel to polypropylene (PP) because of market requirements, such as material cost. When the consumer uses a cup to exert force on the dispenser lever, cold water is dispensed to the cup. They require high-strength fatigue at room temperature because of the repeated impact stresses (Figure 7).
First, the customer usage conditions should be investigated. In the dispensing operation, components, such as a lever made of stainless steel or polypropylene (PP), in a dispenser system experience various mechanical loads and are required to have enough strength not to fail due to fatigue until the anticipated lifetime. Domestic refrigerators in the United States are designed to distribute water from four to twenty times per day. As the dispenser is pressed, it is repeatedly subjected to (impact) loads on the lever. In the field, water dispensing systems in a domestic refrigerator failed under unspecified consumer operations after some period. As investigated, field data demonstrated that the products returned from the field might have had design defects, such as stress raisers (sharp corner angles and thin ribs) in the dispenser. As the consumer requested it to be replaced because the lever systems suddenly fractured and no longer worked, engineers needed to find the root causes by failure analysis or reliability testing and correct them (Figure 8).
By employing failure analysis (and laboratory tests) for returned field products, a crack was observed that started in the front corner of the lever and propagated to the end of the lever. To keep it functioning for its anticipated lifetime, an engineer was required to redesign the product with imperfections (sharp corner angles, thin ribs, etc.). To reproduce the problematic part(s) and alter them, an engineer needed to carry out parametric ALT for the newly designed product by targeting product lifetime, LB—a B1 life of 10 years in Equation (6) in Section 2.1 and Section 2.2. The systematic method was made up of (1) a load examination for the problematic returned product in the subsequent Equations (37)–(39), which is connected in Equation (23) in Section 2.3, (2) the action of making the practical and effective use of ALTs with design alternations, and (3) the evaluation of whether the lifetime objective of designs had been fulfilled by attaining from the actual mission cycle, ha, in Equation (35) in Section 2.4.
From the free-body illustration of the water dispenser (Figure 9), the balance of momentum and force can be stated as:
M z = a F X b F Y = 0  
F X = ( b / a ) F Y
As the lever stress depends on the impacted force, F, of the cup, Equation (23) might be stated as:
T F = A ( S ) n = A ( F X ) λ = B ( F Y ) λ
where A and B are constant quantities.
The acceleration factor (AF) from Equation (24) can be expressed as:
A F = ( S 1 S 0 ) n = ( F 1 F 0 ) λ
where S1 (or F1) is structural stress (or impact force) under accelerated circumstances and S0 (or F0) is structural stress (or impact force) under normal circumstances.
Parametric ALT from Equation (35) can be performed until the assigned cycles that supply the aimed life—a B1 life of 10 years—are fulfilled.
The environmental circumstances of the water dispenser in a domestic refrigerator may change from approximately 0 to 43 °C, with humidity varying from 0% to 20%. Relying on consumer use conditions, an ice maker is utilized approximately four to twenty times per day, which assumes the maximum usage for ten years would incur 73,000 cycles.
To resolve the stress quantity for parametric ALT, based on the expected use range, the step-stress lifetime test might assess the life under a steady use circumstance for many accelerated loads of parametric ALT, such as 20 N, 30 N, and 35 N from Equations (39) or (40) [39]. As the dissimilar stress level was altered because the usual load was 10 N, the failure time of the dispenser lever at particular stress levels can be measured.
Based on market data and laboratory tests, the greatest impact load anticipated by the user in releasing water was approximately 15–20 N [40]. For parametric ALT, the exerted impact force was 35 N. For a coefficient λ of 2, the whole AF was approximately 4.0 utilizing Equation (40).
For a B1 life of 10 years, the assigned mission time for ten samples (calculated by utilizing Equation (35)) was approximately 65,000 cycles when the shape parameter was presumed to be 2.0. The parametric ALT was planned to secure a life target—a B1 life of 10 years—if it might be successful less than once for 65,000 cycles. Figure 10 shows the test framework of parametric ALT for reproducing the unsuccessful dispenser system in the marketplace and the duty time for the impact force F.
The assessed life LB in each ALT is stated as:
L B β x · n · ( h a · A F ) β r + 1
where ha is the actual testing cycles (or cycles).
If x = λ · LB, the assessed failure rate, λ, may be stated as:
λ 1 L B · ( r + 1 ) · L B β n · ( h a · A F ) β
In every ALT stage, the measured cycles,   h a , the lifetime target, x, sample size, n, accelerated factor, AF, shape parameter, β , and failure number, r, are used to estimate the assessed life, LB, in Equation (41).

3. Results and Discussion

From Equation (39), the lifetime (or cycles) of the water dispenser depends on the applied impact force, F. To quickly discover the failure of the dispenser, the impact force was increased from Equation (40). As placing a scale of stress quantity due to exerted load through the step-stress lifetime testing, we examined the failure cycles at three stress levels: 20 N, 30 N, and 35 N (impact force for parametric ALT), which can be attained from the control of the pressure of an air cylinder. For 20 N, the dispenser stopped at approximately 35,000 cycles. For 30 N, the dispenser stopped at approximately 28,000 cycles. For 35 N, the dispenser stopped at approximately 25,000 cycles. Thus, the stress quantity for 35 N for ALT was resolved because it had a relatively fine data linearity on the Weibull plot, which contrasted with the other stress levels. The parametric ALT was carried out to determine the life and imperfections of the design of the current dispenser lever.
In the first ALT, the water dispensing system fractured at approximately 25,000 cycles. To better understand the relationship between the product life and the applied elevated impact load (35 N), an SEM, model JSM-840 manufactured by JEOL Co. (Tokyo, Japan), was used. The morphology of the fractured surface impacted with a cup force of 35.0 N (accelerated impact load) at room temperature was observed. Figure 11 shows a photo contrasting the system returned from the field and that from the first ALT independently. Polypropylene (PP) is a type of plastic composed of polymer resins. Because it has a poor impact property, impact modifiers, such as ethylene-propylene-diene terpolymers (EPDMs) or polyolefin elastomers (POEs), have been added. In this case, the dispenser material was utilized as PP-based blends containing 15% POE. Some of the PP matrices had a lamellar morphology explained by a tight interface adhesion of PP and POEs, which was caused by the deformation of PP by impact force. Thus, voids formed due to repeated load, and the falling out POE particles with spherical shapes were found. The scattered POE as (repeated) stress concentrations seemed to develop shear bands and fractures.
Because they were alike in form, through parametric ALT, the fracturing of the dispenser system found in the marketplace was reproduced. One of the design imperfections in this dispenser was that there was no corner rounding. This allowed for plastic deformation due to (generated/transported) voids, as explained in Equations (15)–(17), and (22). As the dispenser lever was repeatedly struck, it started to crack/propagate and it finally fractured for the mission cycle of the parametric ALT that is obtained from Equation (35). Figure 12 shows the graphic examination of the ALT consequences and market data on a Weibull plot. The shape parameter in the first ALT that depended on load conditions was approximated to be 2.0 because the field and ALT, β, were not attainable at the period of the initial test design. For the last design, the shape parameter was confirmed to be 3.5 on the Weibull plot. As they were alike in form, through parametric ALT, the fractured dispenser system in the marketplace was reproduced. Because the dispenser lever (polypropylene) was repeatedly struck by a cup-shaped apparatus, it began to crack and finally failed. This method was effective in identifying the fragilities in the structure of the products returned from the marketplace because (1) the similar place and form of the troublesome dispenser lever from the market and the first ALT were close, and (2) the shape parameters of the ALT outcomes, β1 and market data, β2, were close on the Weibull chart.
As shown in Figure 11a,b and Figure 13, failure of the dispenser system in the field and ALTs occurred in its front corner and hinge, which have a high-stress raiser. That is, the dispenser structure has no rounding at the corner and not enough thickness to withstand the repetitive impact loading that is caused by end usage. Fatigue fracture can be determined by two components: (1) the structural stress and (2) the pattern of shape (or materials) employed.
To endure repeated impact loads, the problematic water dispenser system utilized in the market was altered by (1) thickening the hinge rib rounding (Fillet1), C1, from 0.0 mm to 1.5 mm; (2) enlarging the front corner rounding (Fillet2), C2, from 0.0 mm to 1.5 mm; (3) thickening the hinge rib (Rib1), C3, from 1.0 mm to 1.8 mm; and (4) thickening the front side rounding (Fillet3), C4, from 0.0 mm to 8.0 mm (Table 3).
Stress analysis, which may be integrated with fatigue analysis and parametric ALT, was performed by utilizing finite element analysis (FEA). As the dispenser system was attached to the upper wall, there were uncomplicated impact loads, as shown in Figure 8. Using materials and processing conditions similar to those of the dispenser, the constitutive properties of the polypropylene (dispenser lever) were determined. For the two designs, the greatest stresses were assessed. According to this investigation, the stress of the altered designs in the dispenser structure was evaluated. By modifying the current structures to improve the fatigue design, the approximated stress concentrations at the front corner and the shaft hinge of the dispenser lever lessened from 8.37 MPa and 5.66 MPa (Figure 14) [41,42].
In the second ALT (approximately 32,000 cycles), the fracture and cracking of the dispensing lever occurred at the front corner of the lever where there was not sufficient corner rounding (see Table 4). To identify the root cause of the unsuccessful dispenser system, the failed product was checked. There were structural design defects, namely hinge rib rounding and front side rounding. As a modification, we altered it by (1) enlarging the hinge rib rounding (Fillet 1), C1, from 1.5 mm to 2.0 mm and (2) enlarging the front side rounding (Fillet 3), C4, from 8.0 mm to 11.0 mm.
While the water dispenser assembly design was improved in the second ALT, it only achieved 32,000 mission cycles. Thus, the desired life was still not achieved. The dispenser system had insufficient fatigue strength for the repeated impact stress. Therefore, a third ALT was performed. It was confirmed that the estimated value of β in the Weibull diagram was 3.5.
In the third ALT, there were no structural flaws in the dispenser system until the ALT was performed for 68,000 cycles. At 68,000 cycles, the fracture and cracking of the dispensing lever occurred at the front of the lever, which still had insufficient strength (see Table 4). The front lever (Rib2), C5, was thickened from 3.0 mm to 4.0 mm. Over the route of ALTs with structural modifications, the water dispenser was established to have a B1 life of 10 years with a cumulative failure rate of 1%, based on Equations (41) and (42), when the actual cycles,   h a = 68 , 000   c y c l e s , by plugging in the lifetime target, x = 0.01, the sample size, n = 8, the accelerated factor, AF = 4.0, the shape parameter, β = 3.5 , the and failure number, r = 0.0. Table 4 represents an abridged result of the ALTs.

4. Summary and Conclusions

A systematic reliability method for the implementation of newly designed mechanical products was proposed. It involved (1) an ALT strategy generated on the BX life, (2) a load investigation, (3) ALTs with structural alternations, and (4) a judgment of whether the final design(s) achieved the desired BX life. Therefore, a quantum-transported stress prototype and sample size expression were suggested for explaining the (generated/transported) voids and crack propagation. As a test-case examination, a new water dispenser system subjected to repetitive impacts was studied.
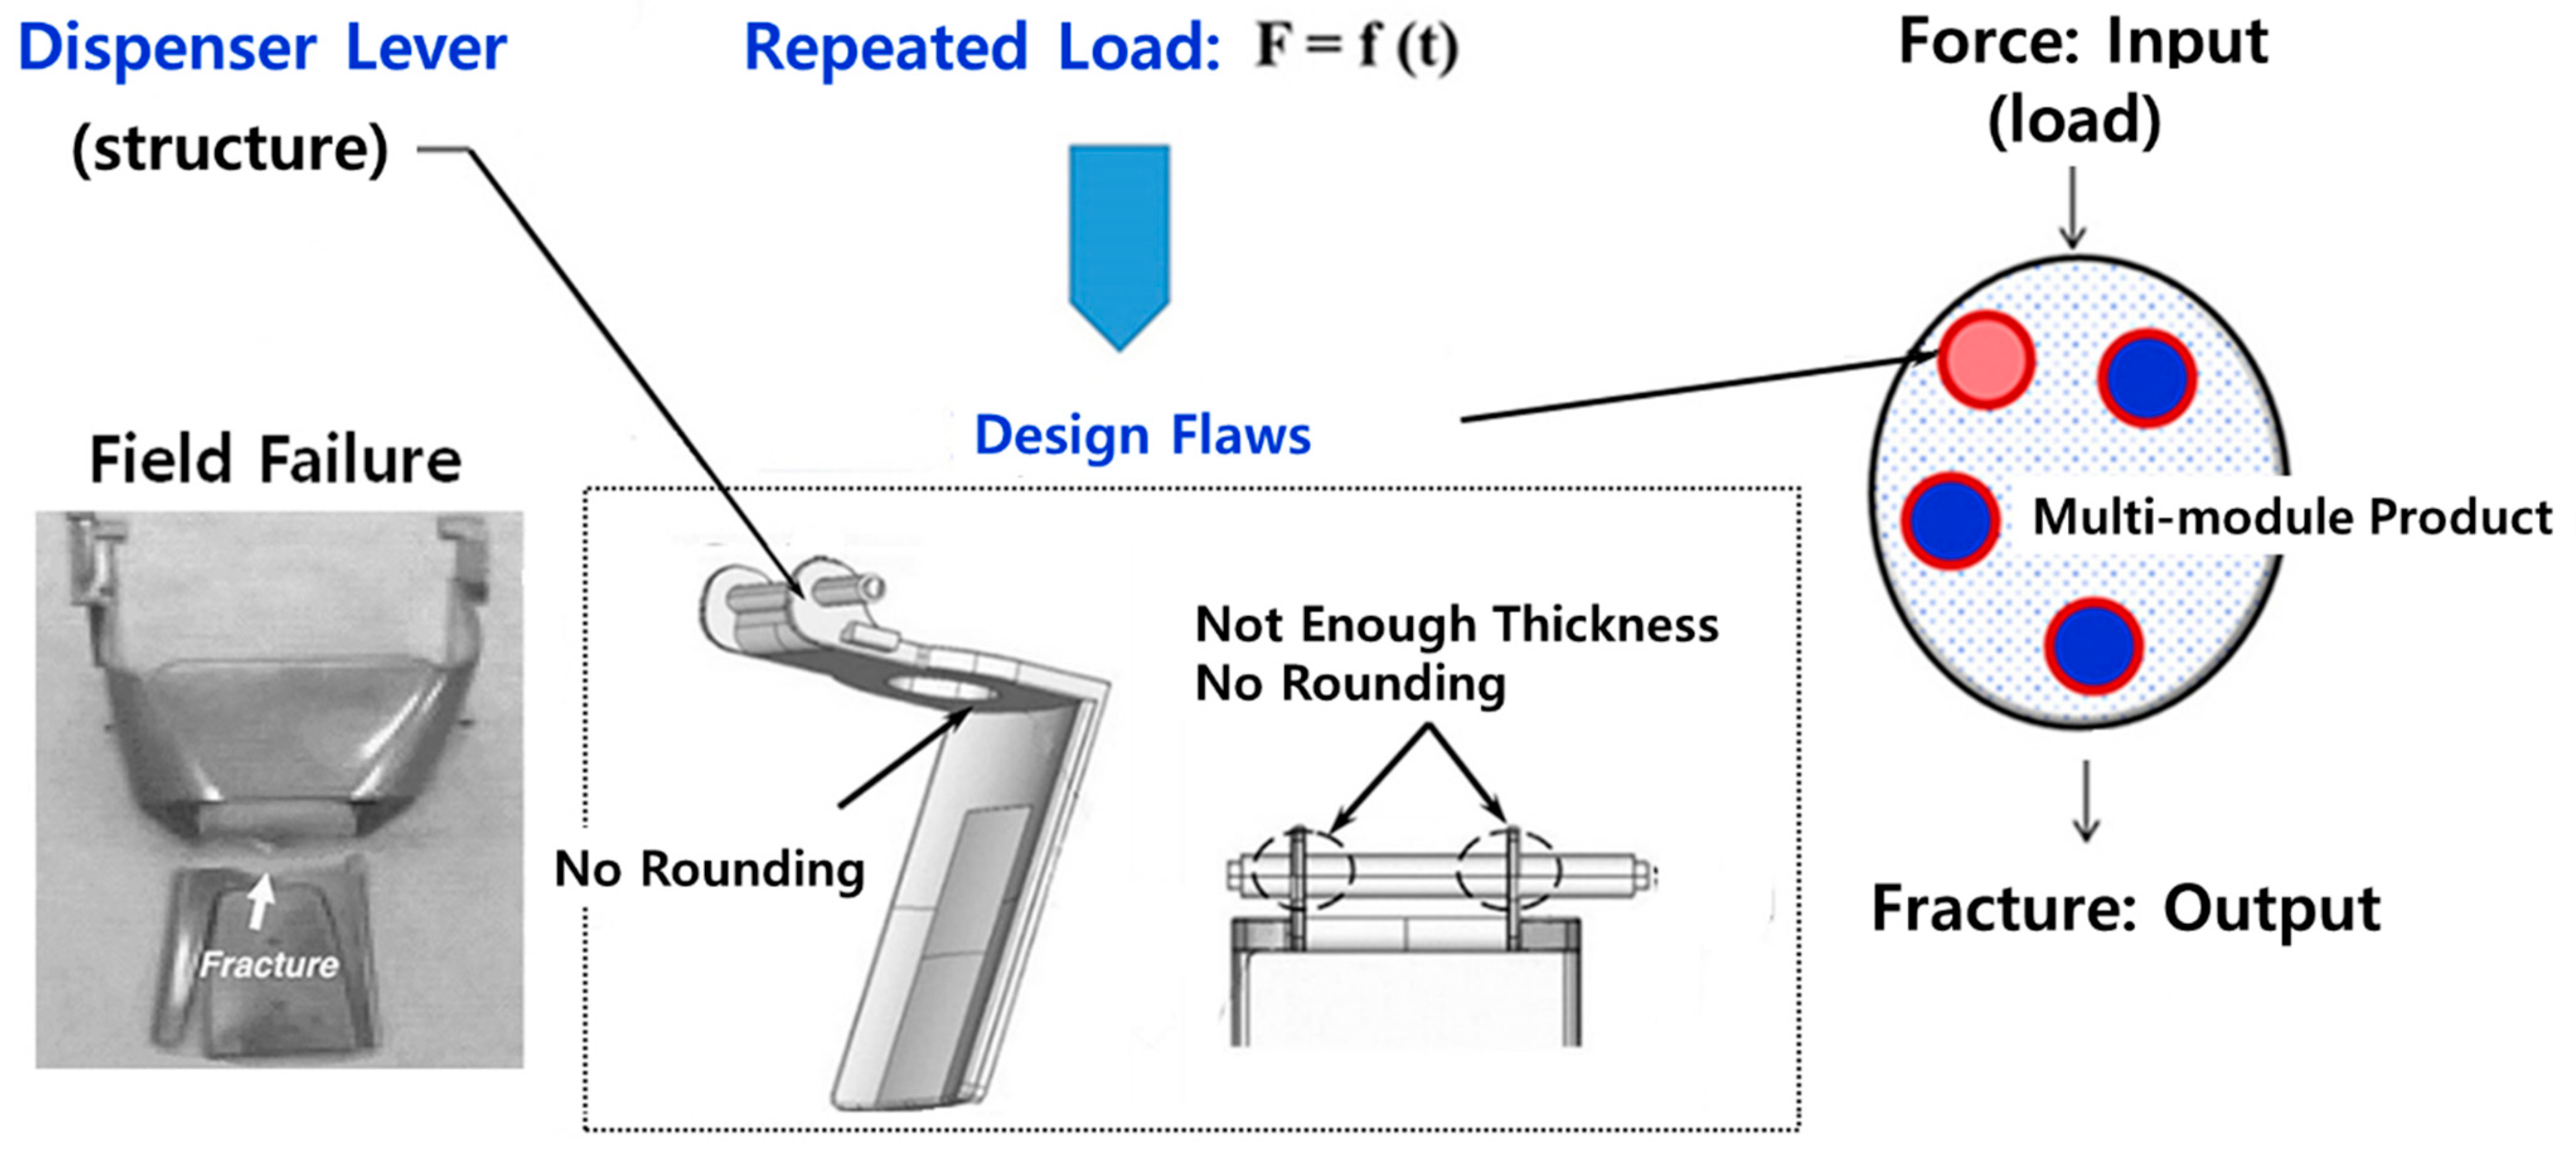
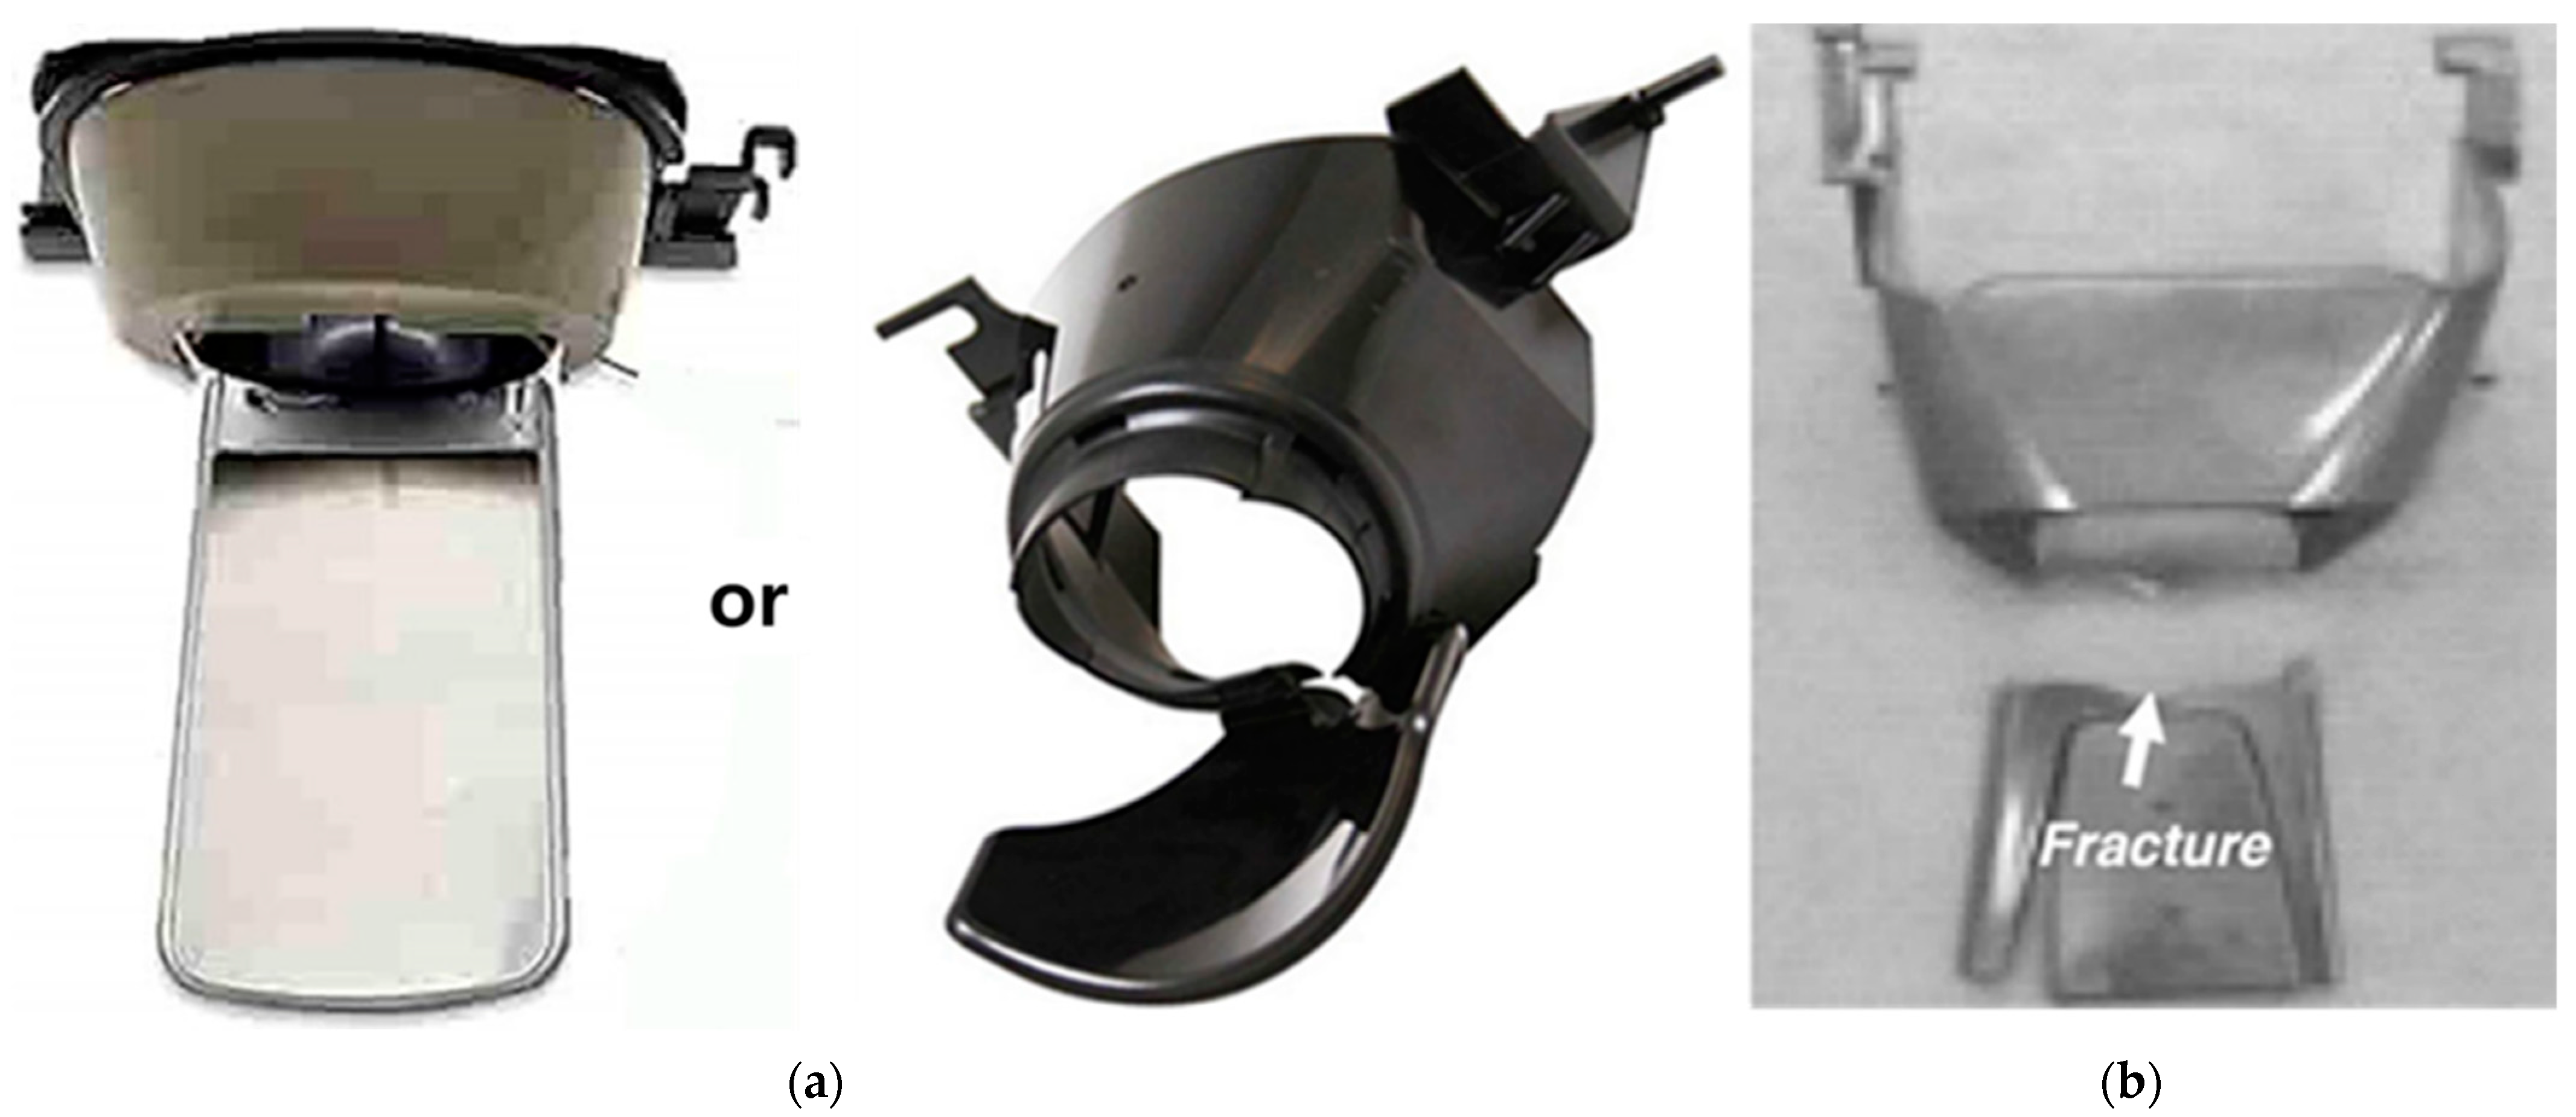
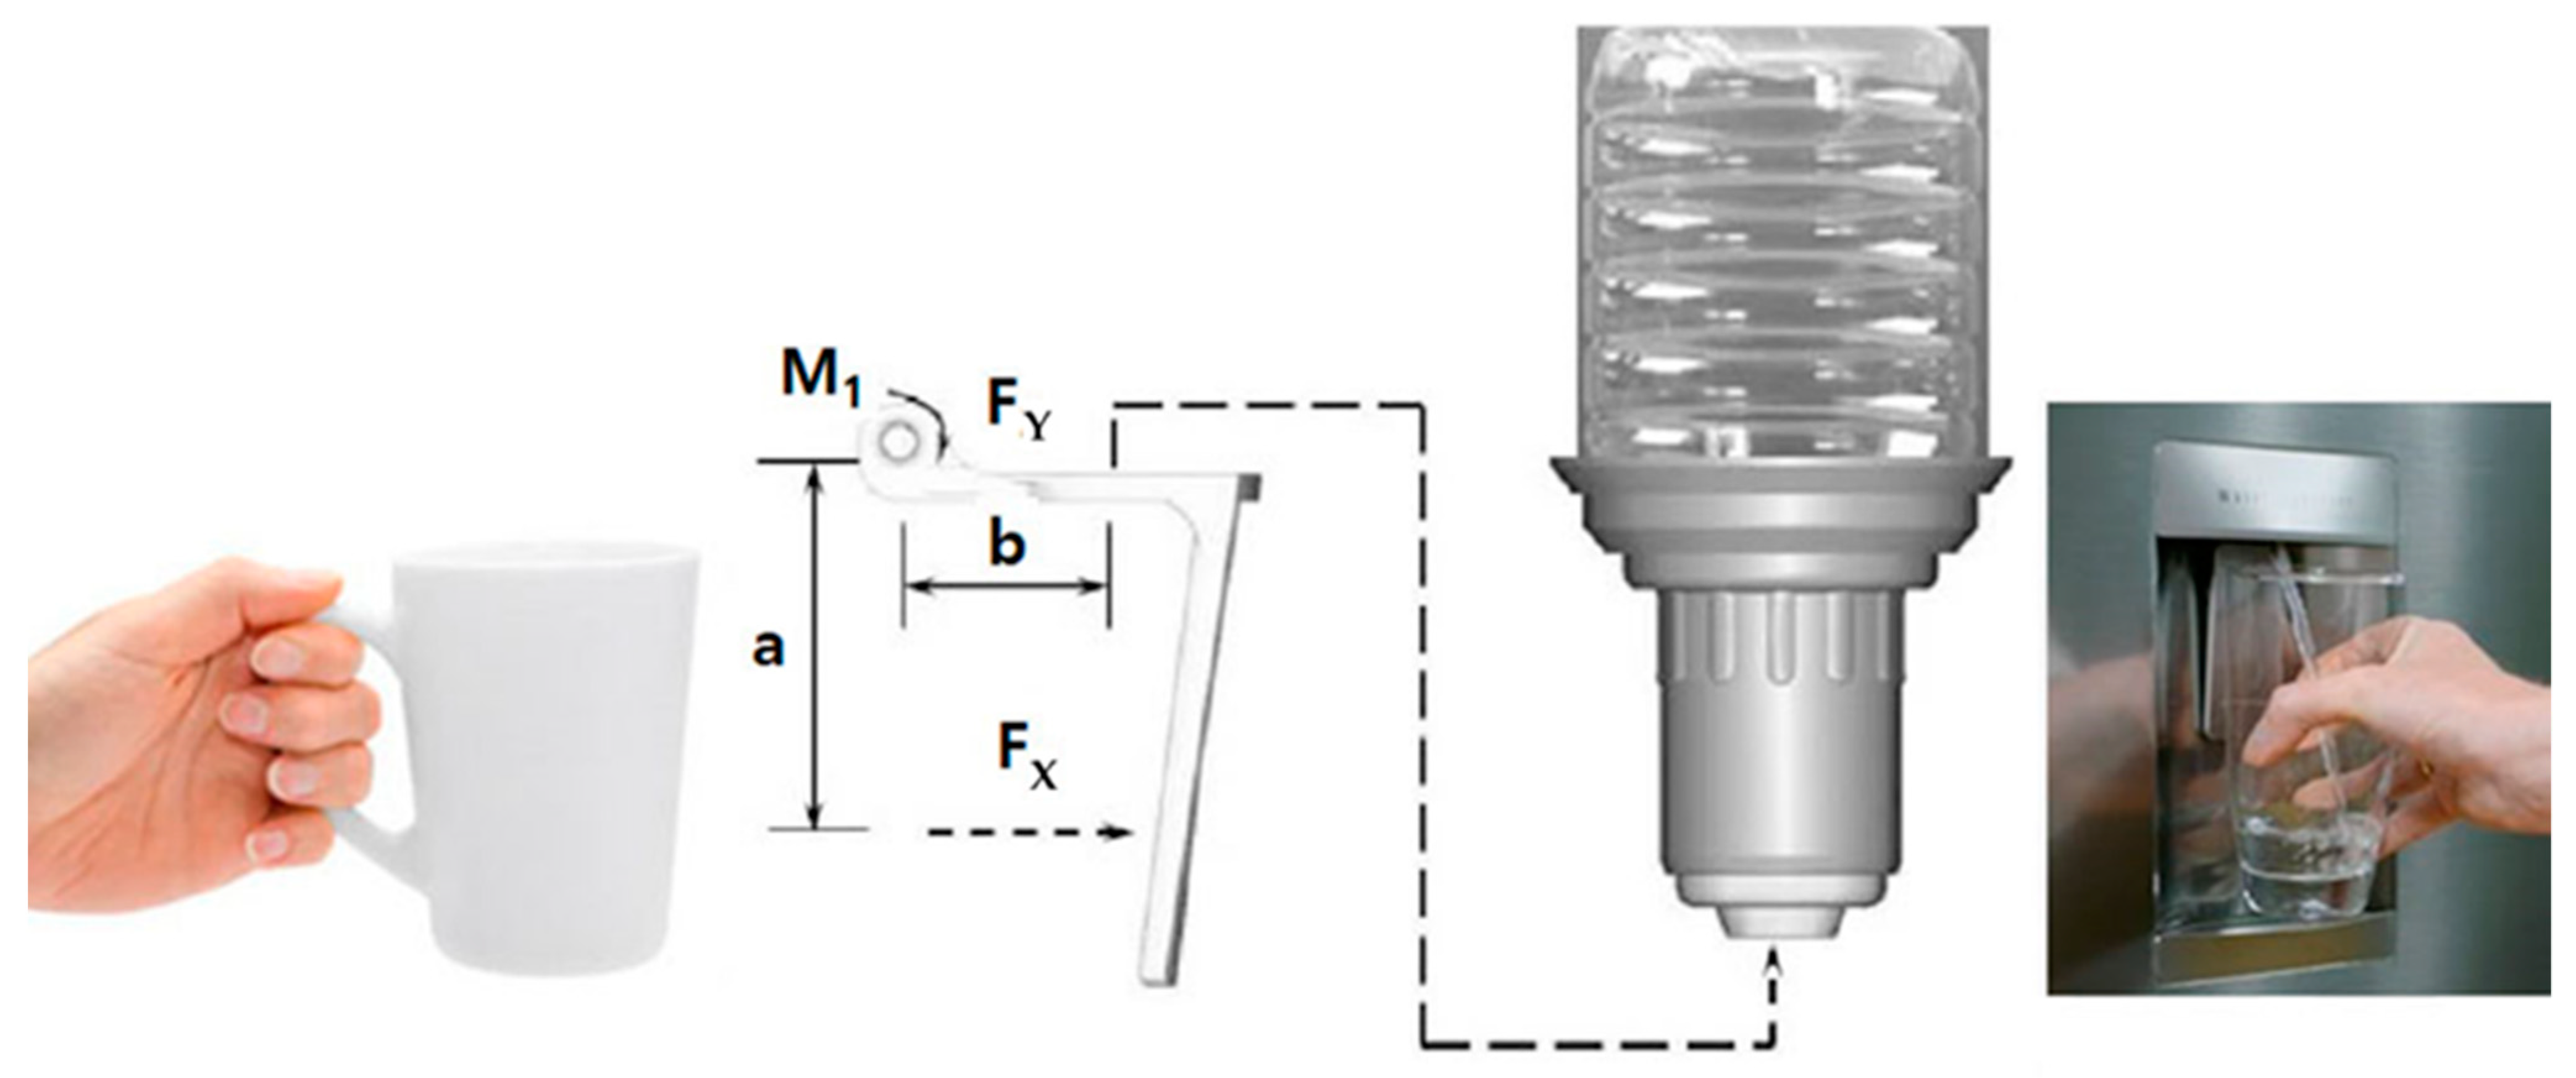
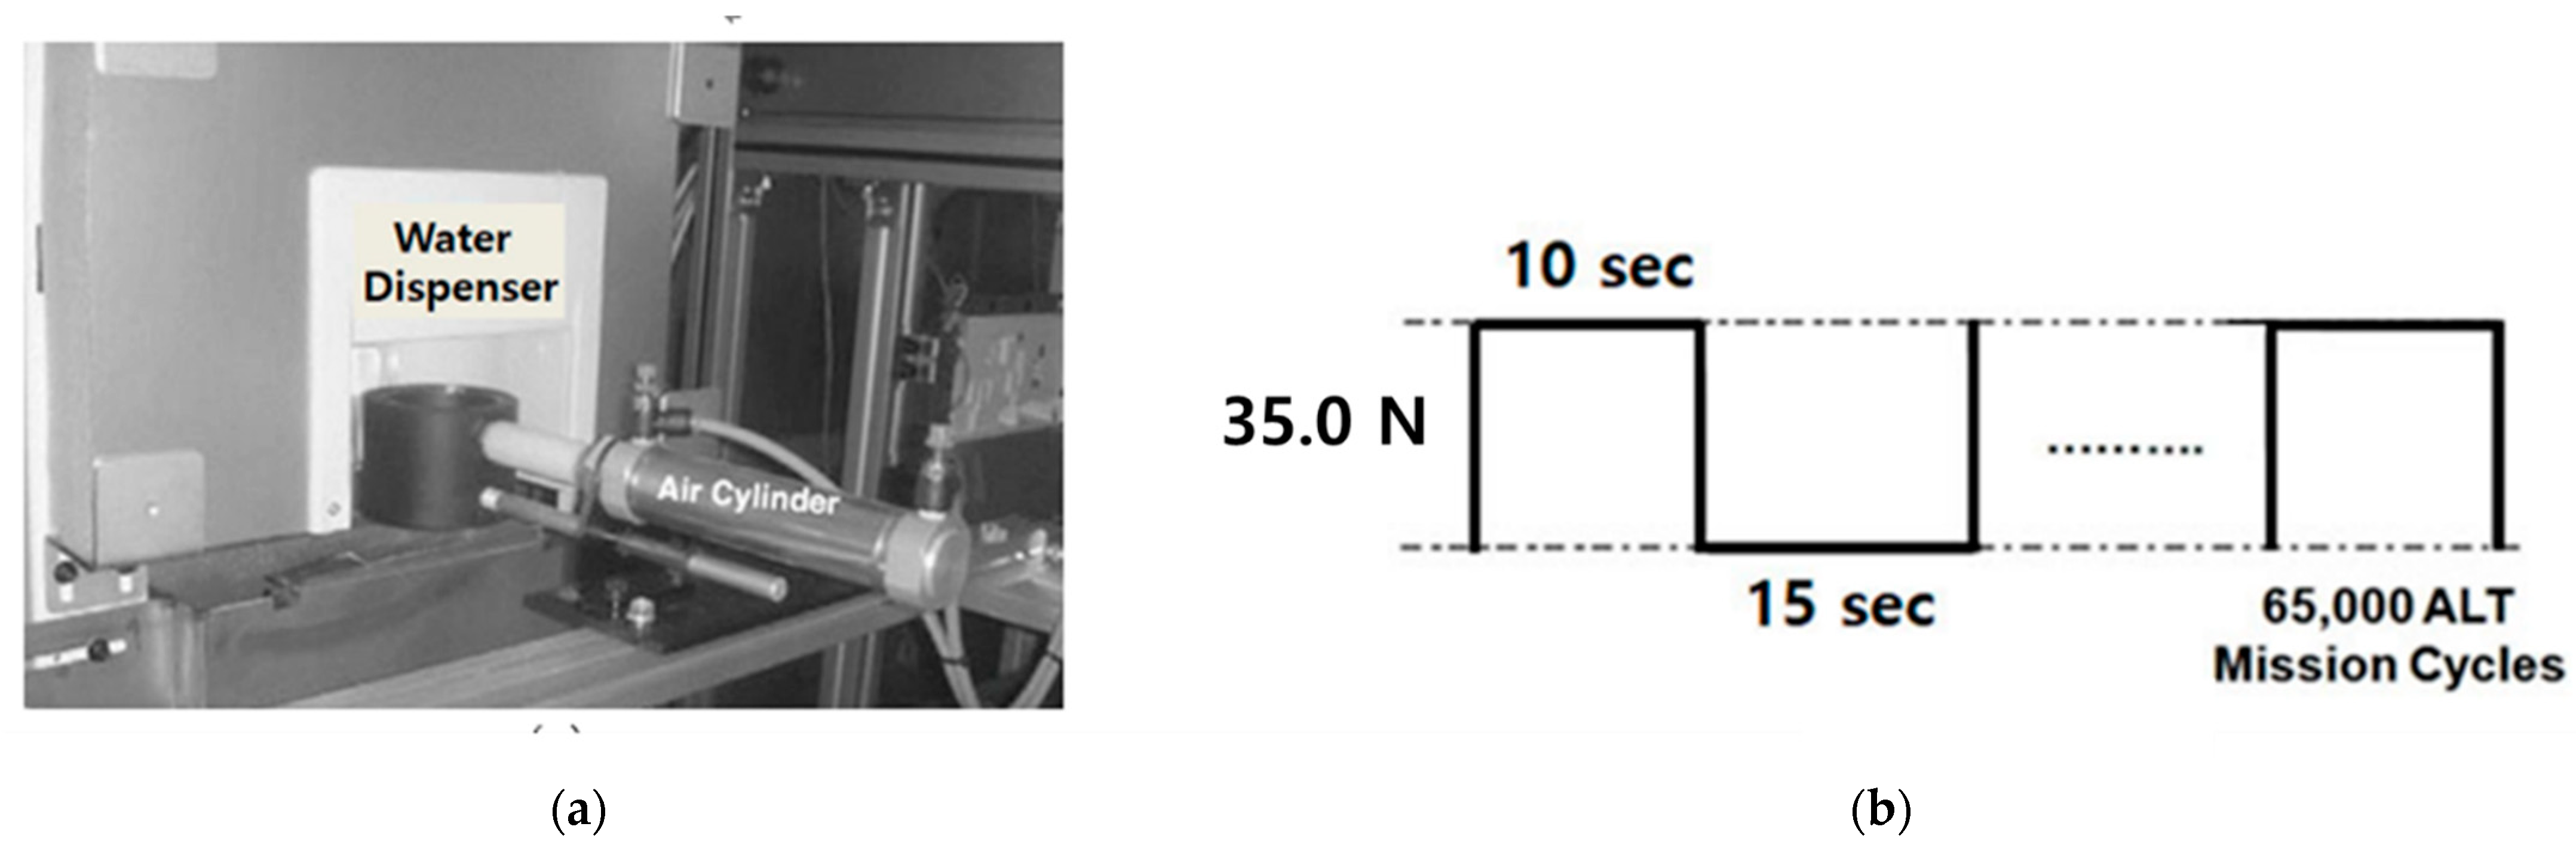
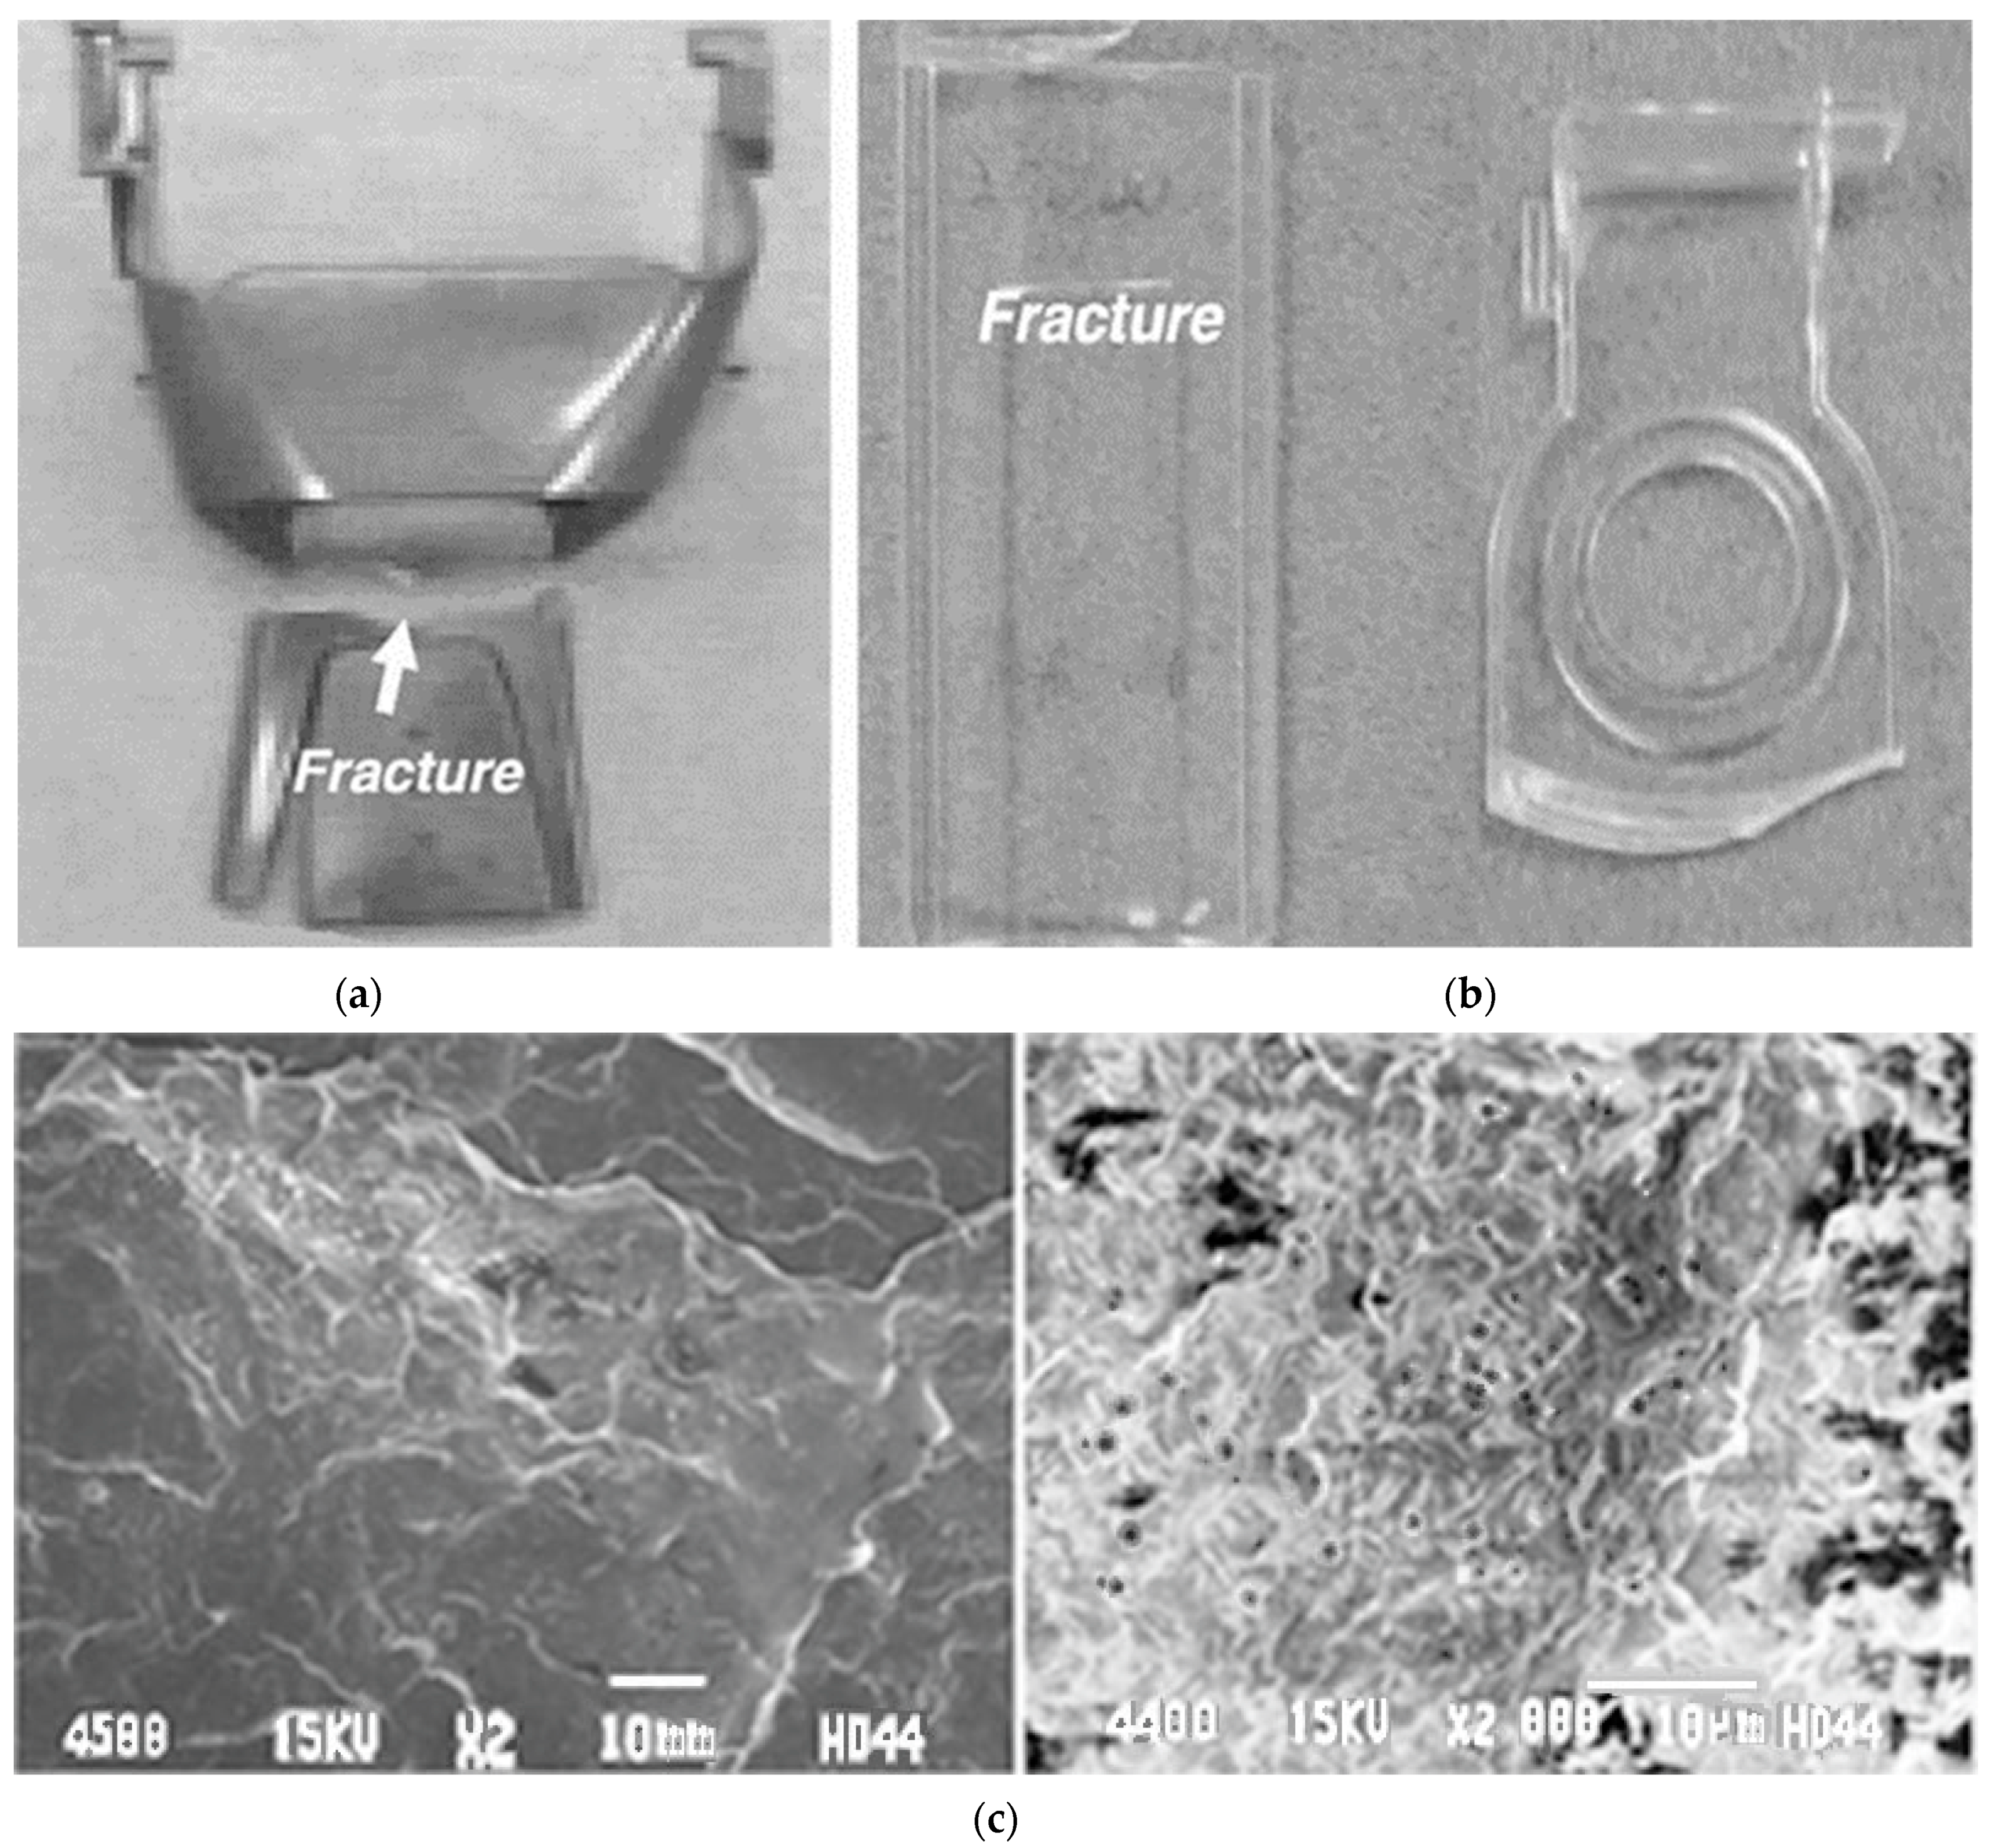
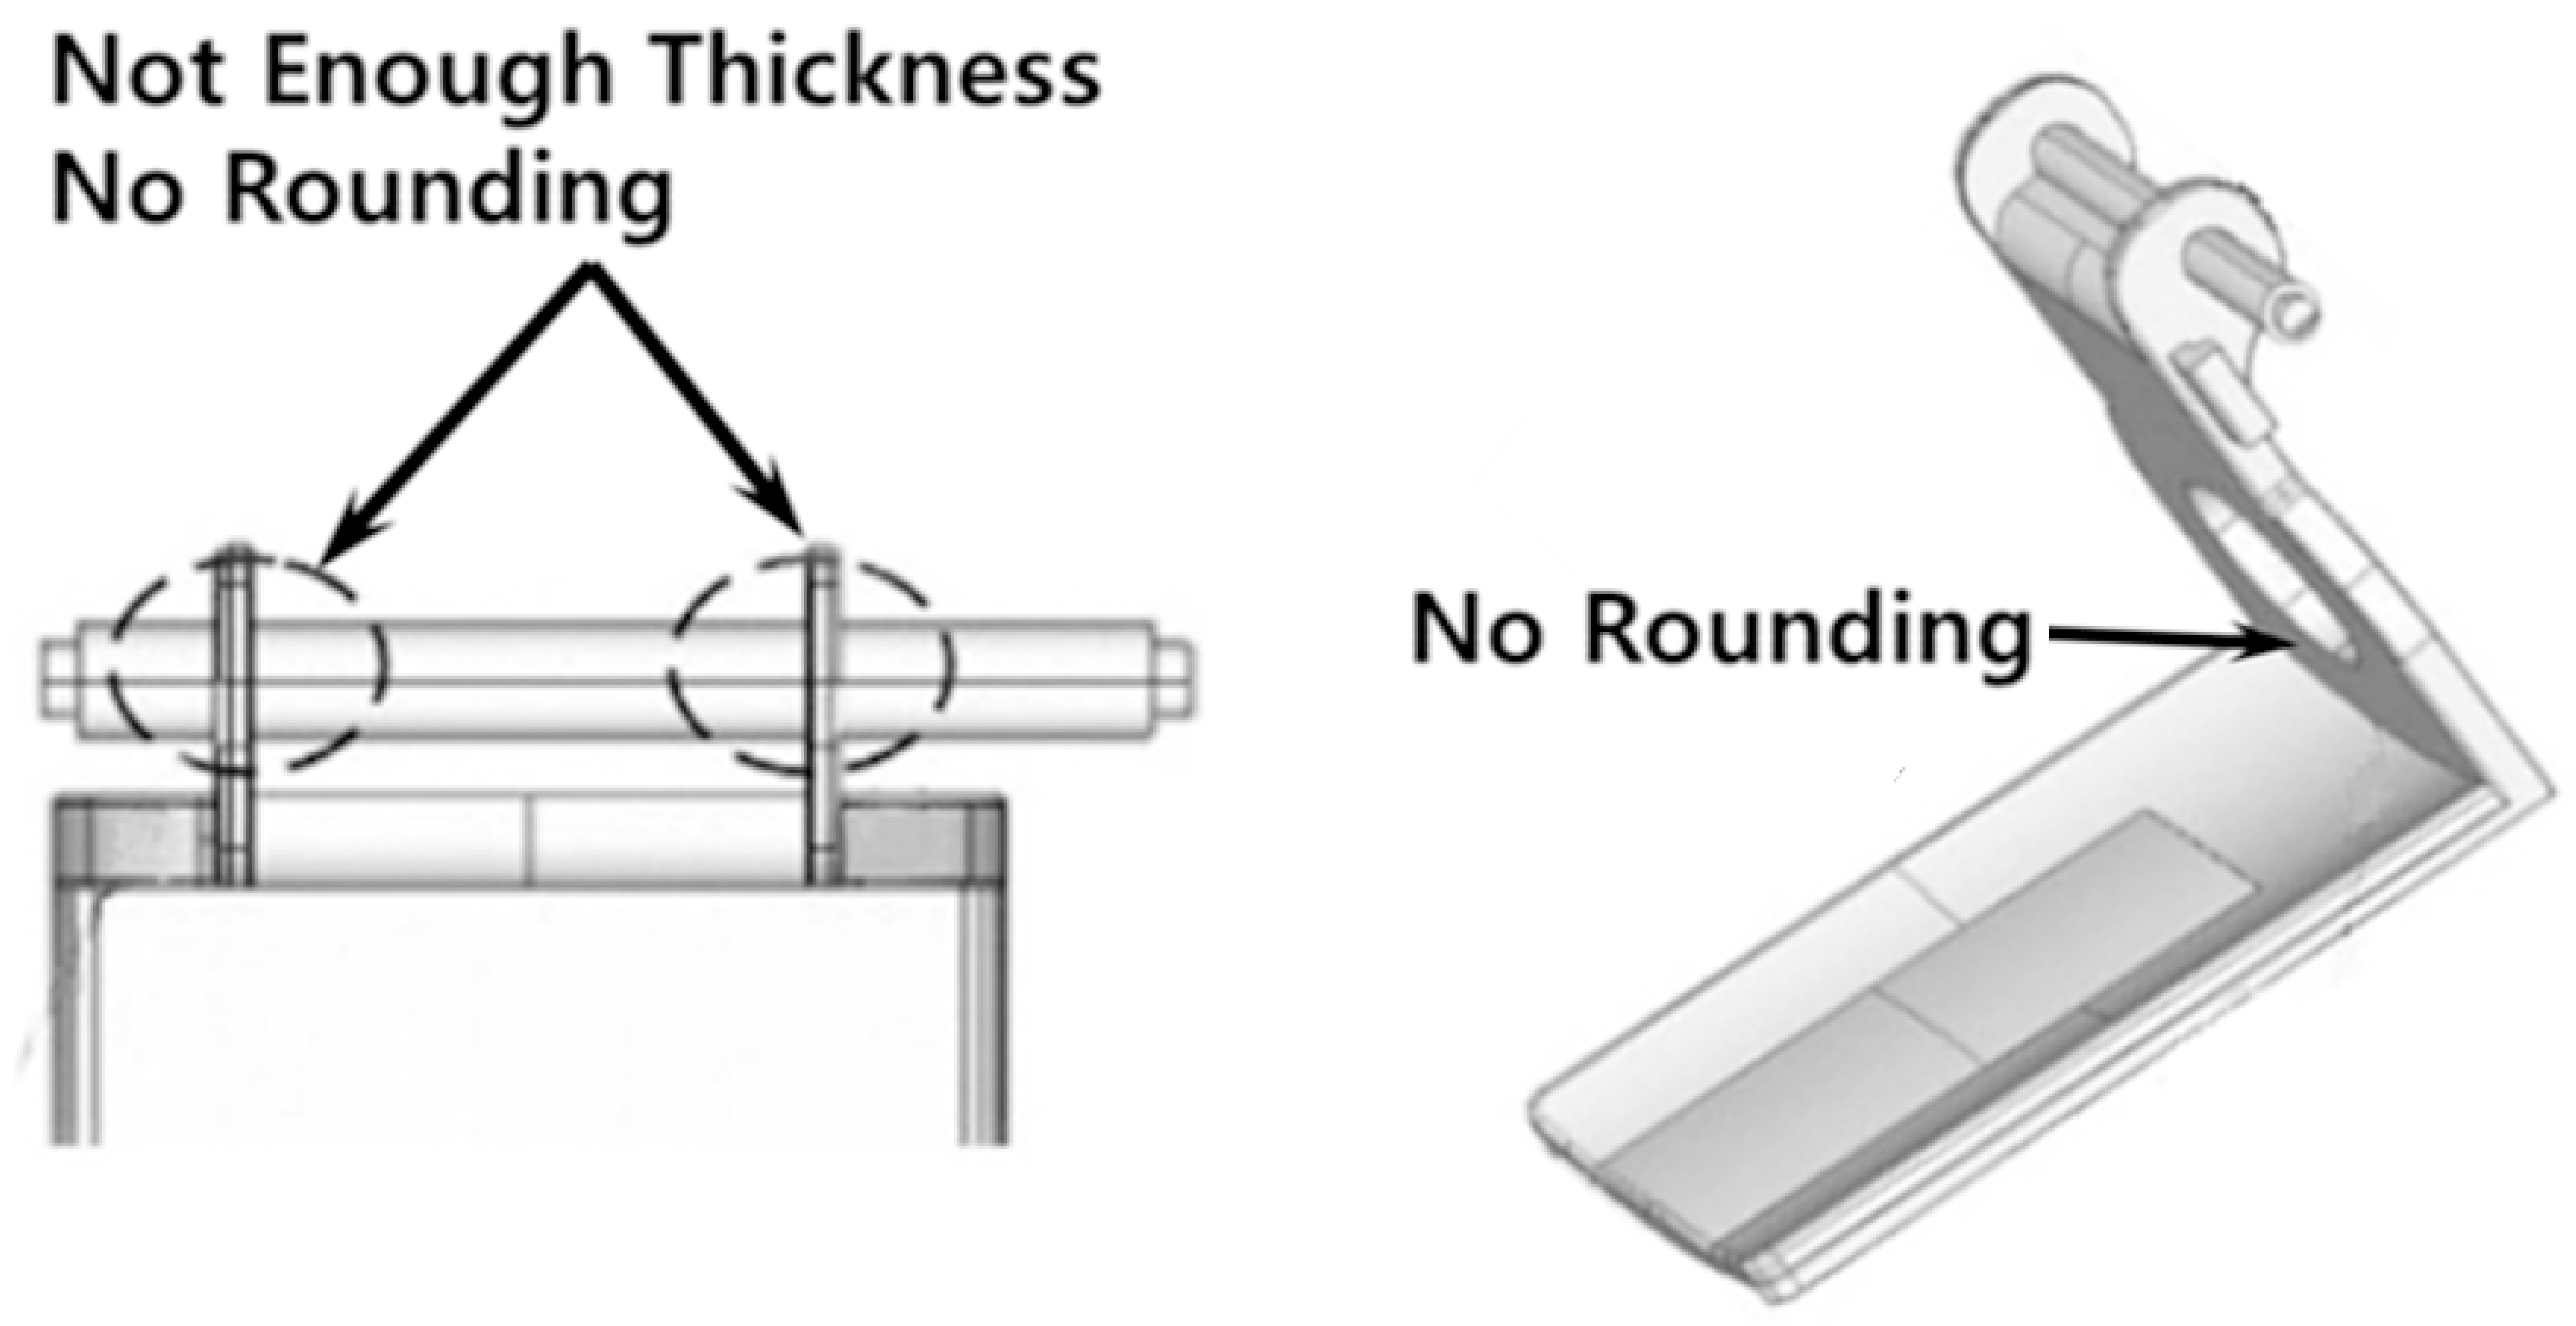
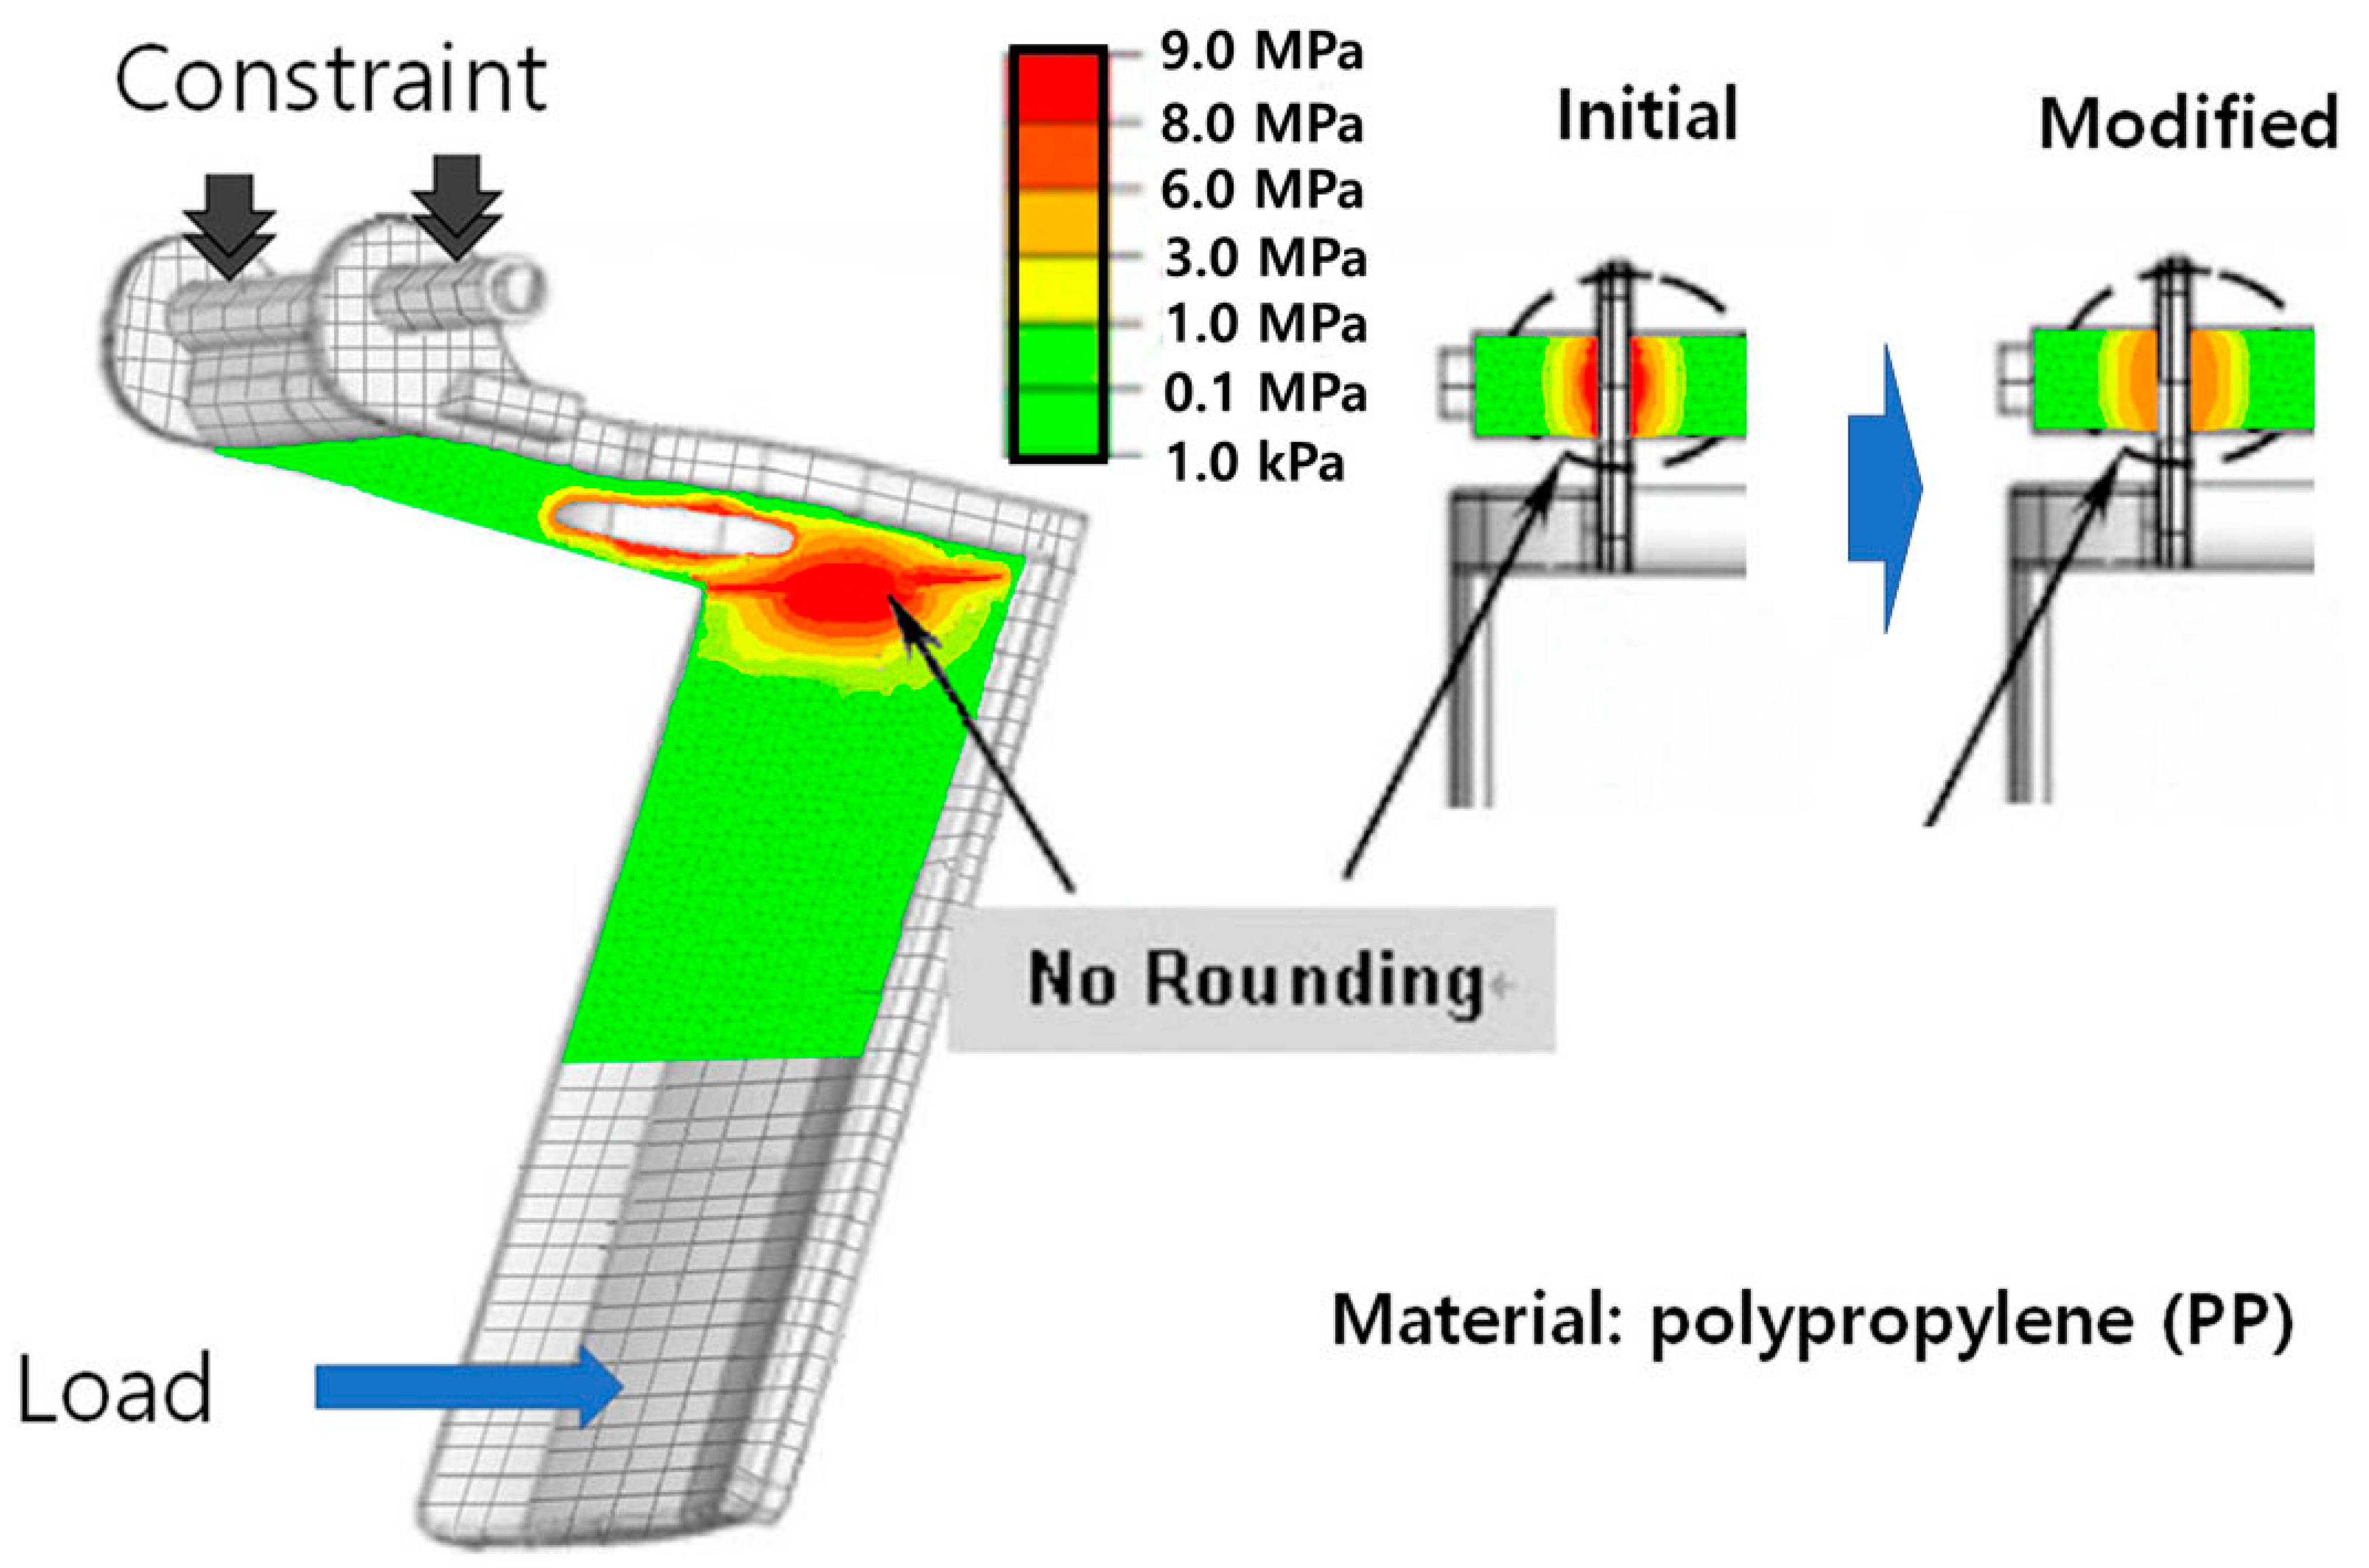
  • In the field and ALTs, a dispenser lever made of stainless steel or polypropylene (pp) was fracturing at the hinge and front corner because of design defects combined with repeated impacts. In the first ALT, the dispenser system (n = 8) was stopped at approximately 25,000 cycles with an impact force of 35 N. After examining two problematic samples, the dispenser structure had no rounding at the corner and insufficient thickness. They were altered by (1) enlarging the hinge rib rounding (Fillet1), C1, from 0.0 mm to 1.5 mm; (2) thickening the front corner rounding (Fillet2), C2, from 0.0 mm to 1.5 mm; (3) thickening the hinge rib (Rib1), C3, from 1.0 mm to 1.8 mm; and (4) enlarging the rounding of the front side (Fillet3), C4, from 0.0 mm to 8.0 mm.
  • In the second ALT, at approximately 32,000 cycles the fracture and cracking of the dispensing lever occurred at the front corner of the lever. As a modification, we altered it by (1) enlarging the hinge rib rounding (Fillet 1), C1, from 1.5 mm to 2.0 mm and (2) enlarging the front side rounding (Fillet 3), C4, from 8.0 mm to 11.0 mm.
  • During the third ALT, no issues were discovered. Thus, the water dispensing system with modified designs was insured to have the life requirement—a B1 life of 10 years.
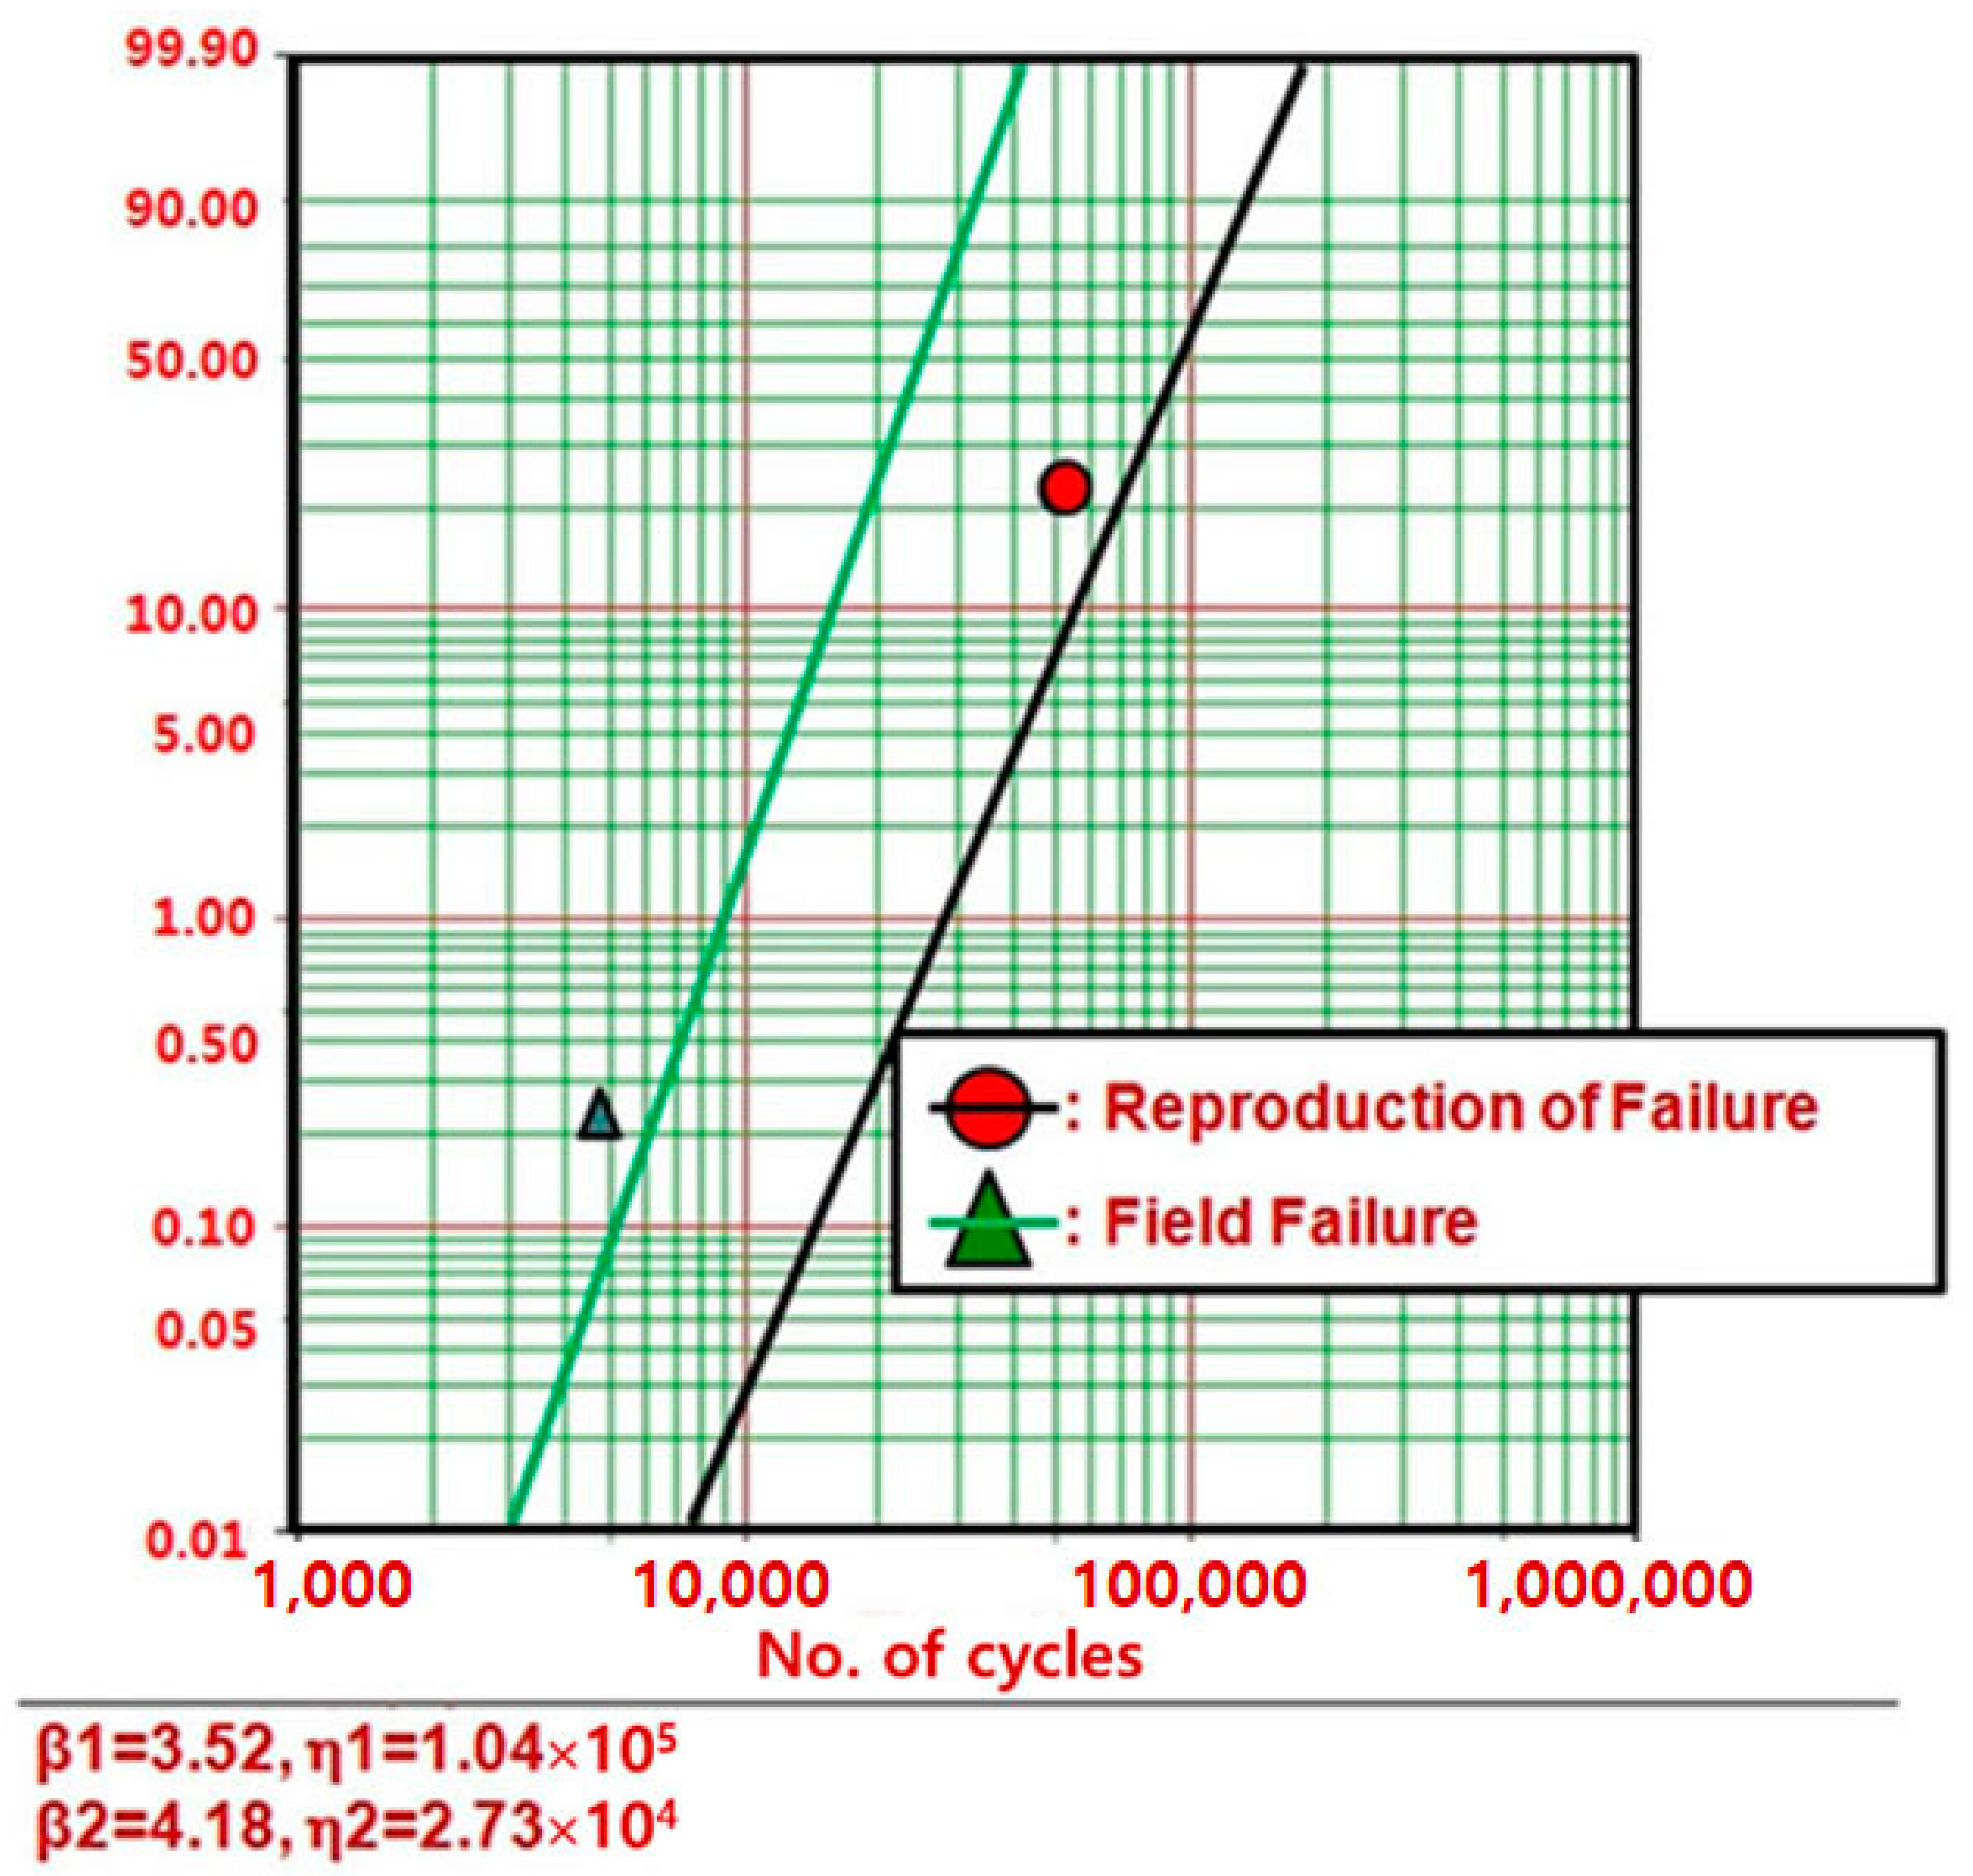
  • By understanding the design issues of products returned from the field, parametric ALTs with design alternations might be performed. After reproducing the field failure, they could be altered. Eventually, we assessed whether the product met the life goals. In the meantime, the quantum-based time to failure prototype and sample size equation were used.
This methodology has been applied to other mechanical products and, as mentioned here, was effective in enhancing the lifetime of the dispenser system. Designers need to understand why parts in multimodule products are unsuccessful during their life. That is, if there are design defects in the newly designed module structures where the system is subjected to repetitive (impact) loads during its functioning, the product may fail in its anticipated lifetime. Engineers should recognize the (dynamic) loading of a mechanical product so that the elevated testing expressed as the proportion of greatest stress in contrast to minimum stress may be performed until the required mission cycles (reliable quantitative specification) are obtained from the sample size equation. In the meantime, ALT may be used to identify the design issues of systems and modify them.

Author Contributions

S.W. carried out concept evolution, methodology, examination, experiment, and wrote the draft. Y.G.M. and D.L.O. checked the methodology and test and wrote the original document. G.M. modified the test and draft. All authors have read and agreed to the published version of the manuscript.

Funding

This research received no external funding.

Institutional Review Board Statement

Not applicable.

Informed Consent Statement

Not applicable.

Data Availability Statement

The data provided in this investigation may be obtained upon request from the corresponding author.

Conflicts of Interest

The authors declare no conflict of interest.

Abbreviations

AFAcceleration factor
BXCycles that are an accumulated failure rate of X%: durability index
D(Thermodynamic or propelling) force
EaActivation energy of a chemical reaction, eV
eEffort in a multiport system
fFlow in a multiport system
F(t)Unreliability
hTesting time (or cycles)
h*Nondimensional testing cycles, h * = h / L B 1
haActual test time (or cycles)
kBoltzmann’s constant quantity, 8.62 × 10⁻⁵ eV/deg
KReaction speed
LPhenomenological transport quantity
LBTarget BX life and x = 0.01 X, on the circumstances that x ≤ 0.2
nNumber of test samples
rUnsuccessful numbers
SStress
TTemperature, K
tiTesting cycle for individual sample
TFTime to failure
XCumulated failure rate, %
xx = 0.01 X, on condition that x ≤ 0.2.
Greek symbols
ξElectrical field applied
ηCharacteristic life
λCumulative damage quantity in Palmgren–Miner’s rule
χ2Chi-square distribution
αConfidence level
Superscripts
βShape parameter in Weibull distribution
nStress dependence, n = [ l n ( T f ) l n ( S ) ] T
Subscripts
0Normal stress circumstances
1Elevated stress circumstances

References

  1. Woo, S.-W.; Pecht, M.; O’Neal, D.L. Reliability design and case study of the domestic compressor subjected to repetitive internal stresses. Reliab. Eng. Syst. Saf. 2019, 193, 106604. [Google Scholar] [CrossRef]
  2. Magaziner, I.C.; Patinkin, M. Cold competition: GE wages the refrigerator war. Harv. Bus. Rev. 1989, 89, 114–124. [Google Scholar]
  3. Bigg, G.; Billings, S. The iceberg risk in the Titanic year of 1912: Was it exceptional? Significance 2014, 11, 6–10. [Google Scholar] [CrossRef]
  4. Rogers, W.P.; Armstrong, N.A.; Acheson, D.C.; Covert, E.E.; Feynman, R.P.; Hotz, R.B.; Kutyna, D.J.; Ride, S.K.; Rummel, R.W.; Sutter, J.F.; et al. Report of the Presidential Commission on the Space Shuttle Challenger Accident; NASA: Washington, DC, USA, 1986. [Google Scholar]
  5. DVB Bank SE Aviation Research (AR). An Overview of Commercial Jet Aircraft 2013; DVB Bank SE Aviation Research (AR): Schiphol, The Netherlands, 2014; p. 20. [Google Scholar]
  6. WRDA 2020 Updates. The Final Report of the US House Committee on Transportation and Infrastructure on the Boeing 737 Max. Available online: https://transportation.house.gov/committee-activity/boeing-737-max-investigation (accessed on 1 September 2020).
  7. Woo, S.; O’Neal, D.L.; Hassen, Y.M. Study on Reliability Design of Mechanical Systems Such as Compressor Subjected to Repetitive Stresses. Metals 2022, 11, 1261. [Google Scholar] [CrossRef]
  8. Woo, S.; O’Neal, D.L.; Hassen, Y.M. Systematic Methods to Increase the Lifetime of Mechanical Products Such as Refrigerators by Employing Parametric Accelerated Life Testing. Appl. Sci. 2022, 12, 7484. [Google Scholar] [CrossRef]
  9. Duga, J.J.; Fisher, W.H.; Buxaum, R.W.; Rosenfield, A.R.; Buhr, A.R.; Honton, E.J.; McMillan, S.C. The Economic Effects of Fracture in the United States; Final Report; Available as NBS Special Publication 647-2; Battelle Laboratories: Columbus, OH, USA, 1982. [Google Scholar]
  10. Gope, P.C.; Mahar, C.S. Evaluation of fatigue damage parameters for Ni-based super alloys Inconel 825 steel notched specimen using stochastic approach. Fatigue Fract. Eng. Mater. Struct. 2020, 44, 427–443. [Google Scholar] [CrossRef]
  11. Sola, J.F.; Kelton, R.; Meletis, E.I.; Huang, H. Predicting crack initiation site in polycrystalline nickel through surface topography changes. Int. J. Fatigue 2019, 124, 70–81. [Google Scholar] [CrossRef]
  12. Campbell, F.C. (Ed.) Fatigue. In Elements of Metallurgy and Engineering Alloys; ASM International: Materials Park, OH, USA, 2008. [Google Scholar]
  13. Taguchi, G. Off-line and on-line quality control systems. In Proceedings of the International Conference on Quality Control, Tokyo, Japan, 17–20 October 1978. [Google Scholar]
  14. Chowdhury, S.; Taguchi, S. Robust Optimization: World’s Best Practices for Developing Winning Vehicles, 1st ed.; John Wiley and Son: Hoboken, NJ, USA, 2016. [Google Scholar]
  15. Montgomery, D. Design and Analysis of Experiments, 10th ed.; John Wiley and Son: Hoboken, NJ, USA, 2020. [Google Scholar]
  16. Weingart, R.G.; Stephen, P. Timoshenko: Father of Engineering Mechanics in the U.S. Structure Magazine, August 2007. [Google Scholar]
  17. Goodno, B.J.; Gere, J.M. Mechanics of Materials, 9th ed.; Cengage Learning, Inc.: Boston, MA, USA, 2017. [Google Scholar]
  18. Anderson, T.L. Fracture Mechanics—Fundamentals and Applications, 3rd ed.; CRC: Boca Raton, FL, USA, 2017. [Google Scholar]
  19. ASTM E606/E606 M; Standard Test Method for Strain-Controlled Fatigue Testing. ASTM International: West Conshohocken, PA, USA, 2019.
  20. ASTM E399; Standard Test Method for Linear-Elastic Plane-Strain Fracture Toughness of Metallic Materials. ASTM International: West Conshohocken, PA, USA, 2020.
  21. ASTM E647; Standard Test Method for Measurement of Fatigue Crack Growth Rates. ASTM International: West Conshohocken, PA, USA, 2015.
  22. ASTM E739-10; Standard Practice for Statistical Analysis of Linear or Linearized Stress-Life (S-N) and Strain-Life (ε-N) Fatigue Data. ASTM International: West Conshohocken, PA, USA, 2015.
  23. Branco, R.; Prates, P.; Costa, J.D.M.; Berto, F.; Kotousov, A. New methodology of fatigue life evaluation for multiaxially loaded notched components based on two uniaxial strain-controlled tests. Int. J. Fatigue 2018, 111, 308–320. [Google Scholar] [CrossRef]
  24. Panahi, H.; Lone, S.A. Estimation procedures for partially accelerated life test model based on unified hybrid censored sample from the Gompertz distribution. Eksploat. Niezawodn. Maint. Reliab. 2022, 24, 427–436. [Google Scholar] [CrossRef]
  25. McPherson, J. Accelerated Testing, Electronic Materials Handbook Volume 1: Packaging; ASM International Publishing, Materials Park Vampus: Novelty, OH, USA, 1989. [Google Scholar]
  26. McPherson, J. Reliability Physics and Engineering: Time-to-Failure Modeling; Springer: New York, NY, USA, 2010. [Google Scholar]
  27. Reddy, J.N. An Introduction to the Finite Element Method, 4th ed.; McGraw-Hill: New York, NY, USA, 2020. [Google Scholar]
  28. Zupančič, B.; Prokop, Y.; Nikonov, A. FEM analysis of dispersive elastic waves in three-layered composite plates with high contrast properties. Finite Elem. Anal. Des. 2021, 193, 103553. [Google Scholar] [CrossRef]
  29. Matsuishi, M.; Endo, T. Fatigue of metals subjected to varying stress. Jpn. Soc. Mech. Eng. 1968, 68, 37–40. [Google Scholar]
  30. Palmgren, A.G. Die Lebensdauer von Kugellagern. Z. Ver. Dtsch. Ing. 1924, 68, 339–341. [Google Scholar]
  31. Cengel, Y.; Boles, M.; Kanoglu, M. Thermodynamics: An Engineering Approach, 9th ed.; McGraw—Hill: New York, NY, USA, 2018. [Google Scholar]
  32. IEEE Std 610. IEEE Std 610.12-1990; IEEE Standard Glossary of Software Engineering Terminology. IEEE: Manhattan, NY, USA, 1990; pp. 1–84. Available online: https://ieeexplore.ieee.org/document/159342 (accessed on 31 December 2020).
  33. Kreyszig, E. Advanced Engineering Mathematics, 10th ed.; John Wiley and Son: Hoboken, NJ, USA, 2011; p. 683. [Google Scholar]
  34. Bird, R.B.; Stewart, W.E.; Lightfoot, E.N. Transport Phenomena, 2nd ed.; John Wiley and Son: Hoboken, NJ, USA, 2006. [Google Scholar]
  35. Plawsky, J.L. Transport Phenomena Fundamentals, 4th ed.; CRC Press: Boca Raton, FL, USA, 2019. [Google Scholar]
  36. Grove, A. Physics and Technology of Semiconductor Device, 1st ed.; Wiley International Edition: New York, NY, USA, 1967; p. 37. [Google Scholar]
  37. Karnopp, D.C.; Margolis, D.L.; Rosenberg, R.C. System Dynamics: Modeling, Simulation, and Control of Mechatronic Systems, 6th ed.; John Wiley & Sons: New York, NY, USA, 2012. [Google Scholar]
  38. Wasserman, G. Reliability Verification, Testing, and Analysis in Engineering Design; Marcel Dekker: New York, NY, USA, 2003; p. 228. [Google Scholar]
  39. Tang, L.C. Multiple-steps step-stress accelerated life tests: A model and its spreadsheet analysis. Int. J. Mater. Prod. Technol. 2004, 21, 423–434. [Google Scholar] [CrossRef]
  40. SAMSUNG. Refrigerator Field Report Data, SRTP 97-2; SAMSUNG: Gwangju, Republic of Korea, 2003; p. 45. [Google Scholar]
  41. El-Azeem, S.O.A.; Abu-Moussa, M.H.; El-Din, M.M.M.; Diab, L.S. On Step-Stress Partially Accelerated Life Testing with Competing Risks Under Progressive Type-II Censoring. Ann. Data Sci. 2022, 1–22. [Google Scholar] [CrossRef]
  42. Samanta, D.; Mondal, S.; Kundu, D. Optimal plan for ordered step-stress stage life testing. Statistics 2022, 56, 1–26. [Google Scholar] [CrossRef]
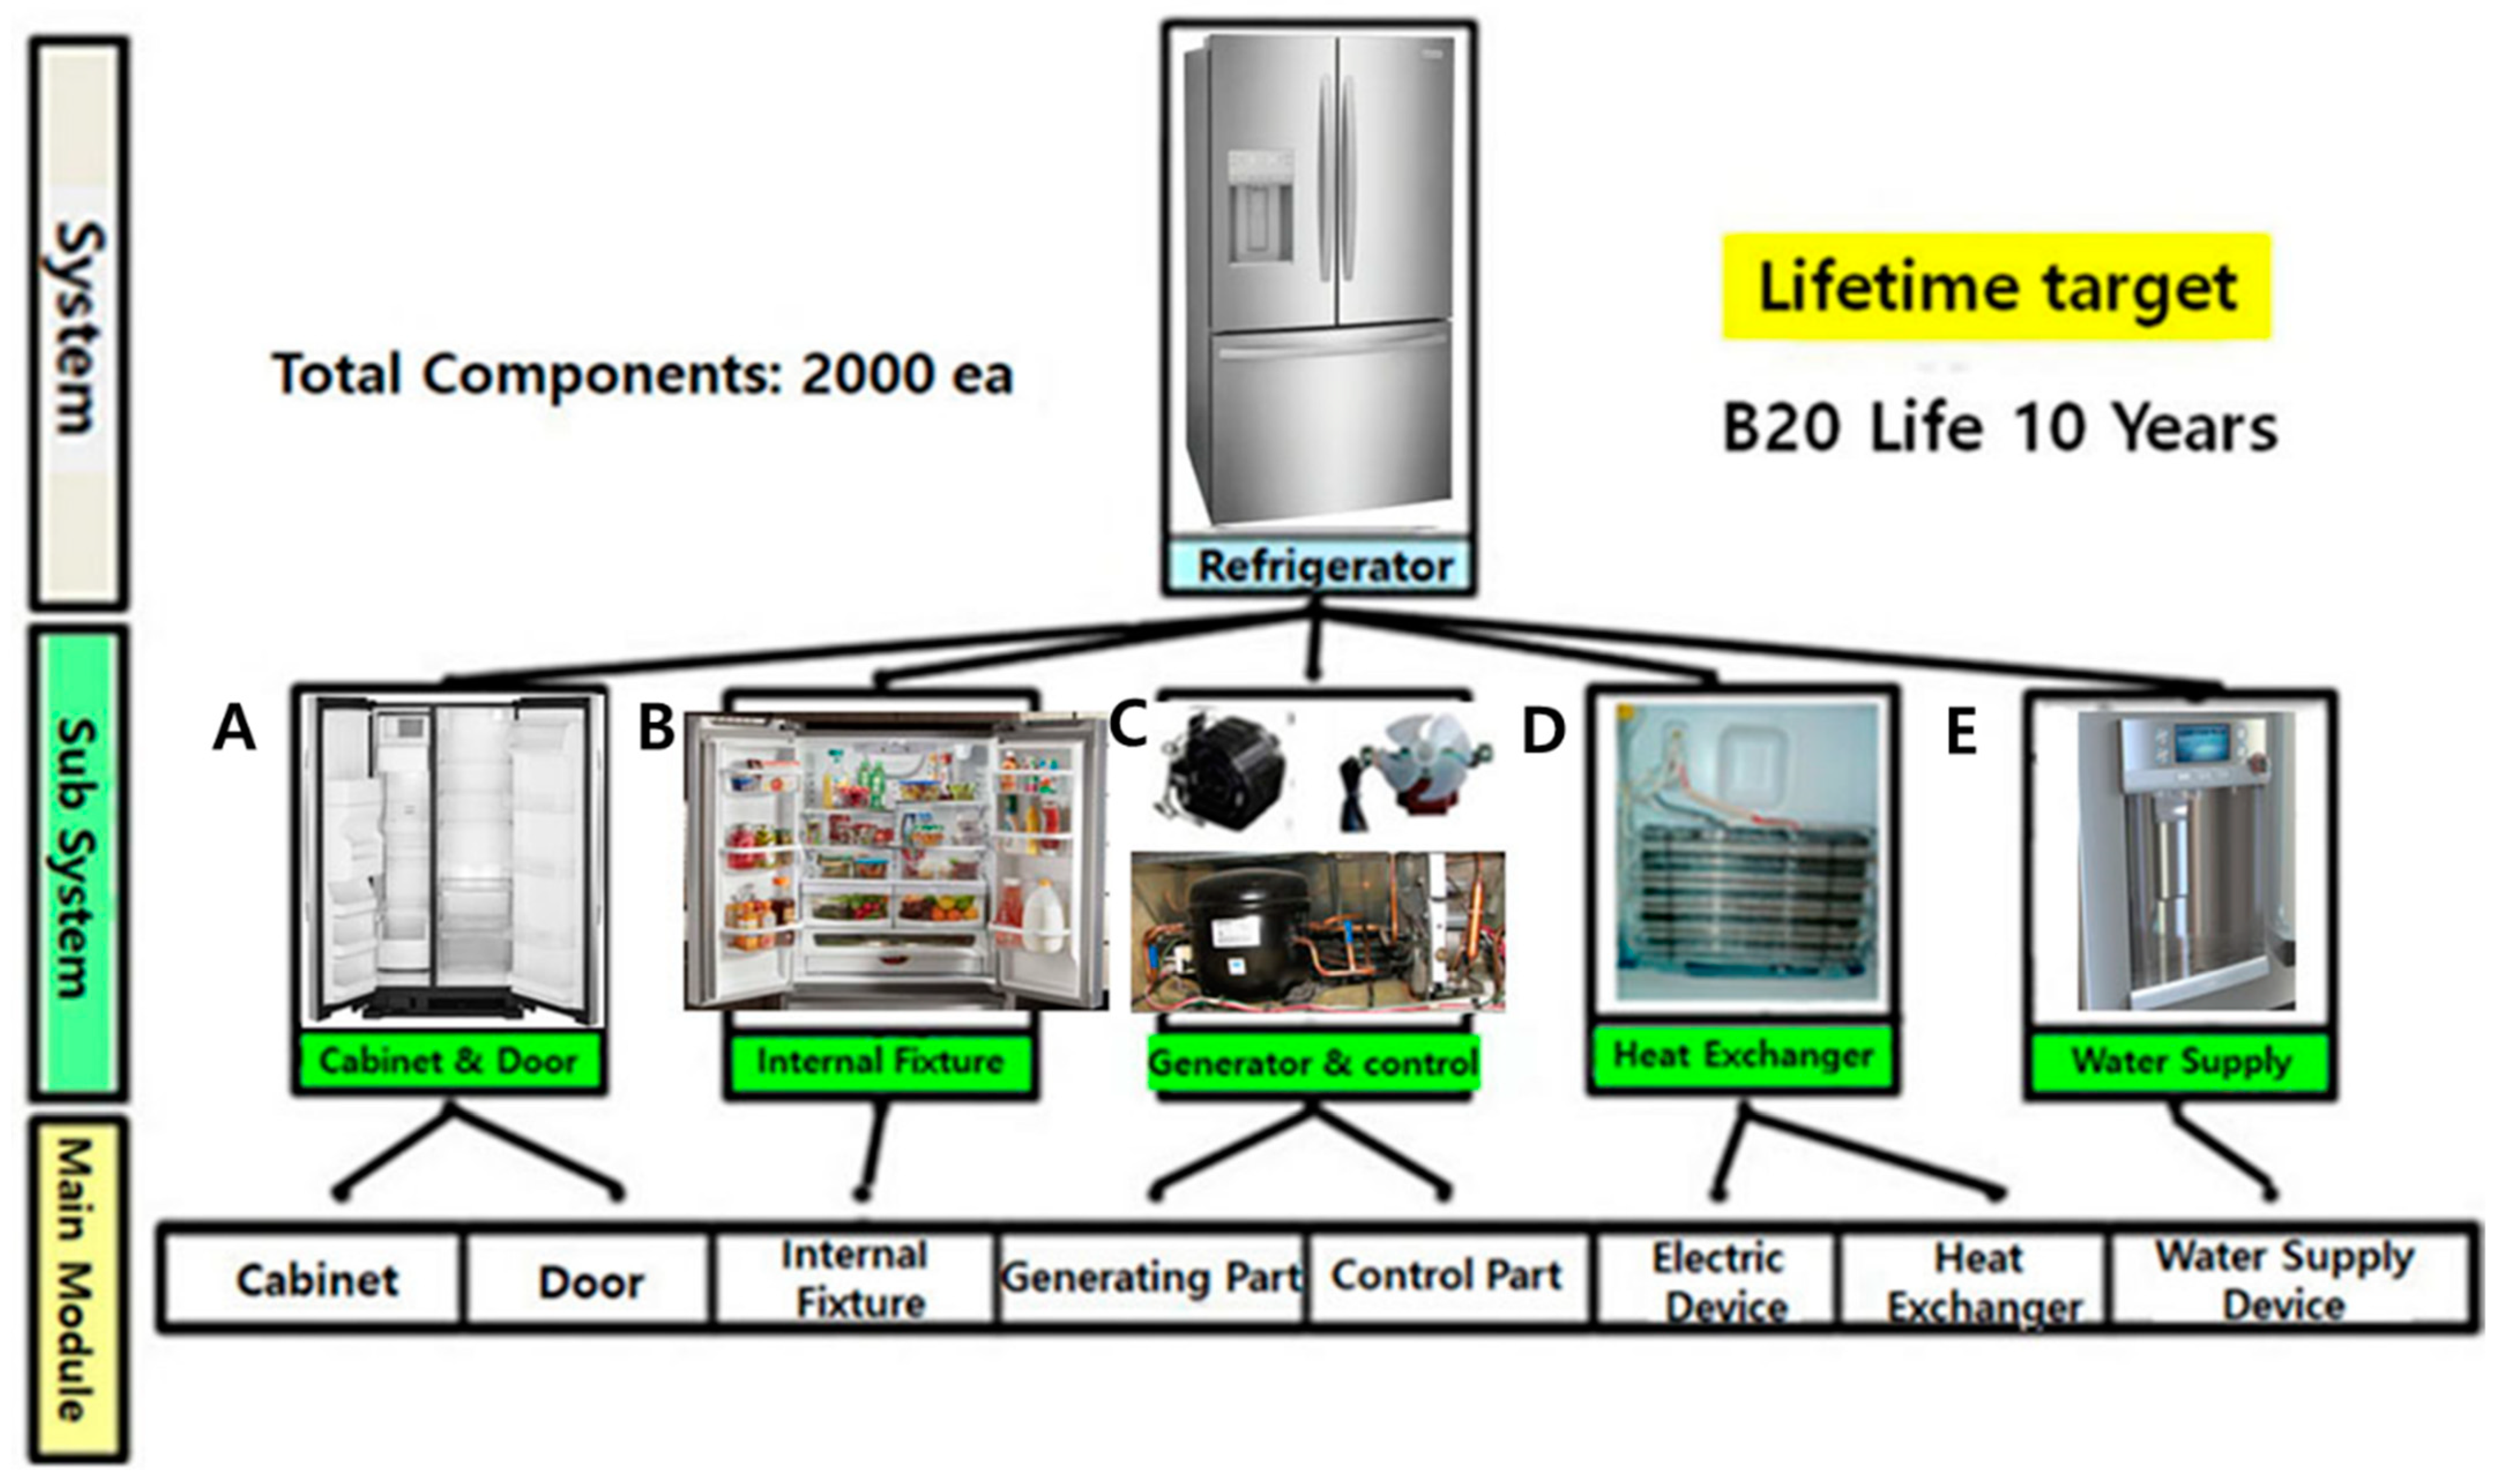
Figure 1. Breakdown of the refrigerator with multi-modules.
Applsci 13 01358 g001
Figure 2. A multimodule system life is resolved by the newly conceived module.
Applsci 13 01358 g002
Figure 3. Reliability measure; BX life (LB) on the bathtub.
Applsci 13 01358 g003
Figure 4. Parameter representation of the water dispenser (instance).
Applsci 13 01358 g004
Figure 5. Fatigue generated by repetitive impact loading and structural imperfections.
Applsci 13 01358 g005
Figure 6. Definition of the hyperbolic sine stress expression on the Paris law and S-N curve.
Applsci 13 01358 g006
Figure 7. New water dispenser assembly in a refrigerator. (a) A domestic refrigerator and (b) mechanical components of the water dispenser. (1) Dispenser lever cost-downed from stainless steel, (2) spring, and (3) cover.
Applsci 13 01358 g007
Figure 8. Damaged dispenser lever after usage. (a) Water dispenser and (b) failed dispenser lever in the field.
Applsci 13 01358 g008
Figure 9. Practical designs of the dispenser system.
Applsci 13 01358 g009
Figure 10. ALT apparatus with duty cycles. (a) Equipment and (b) duty cycles of repetitive impact load F.
Applsci 13 01358 g010
Figure 11. Failed water dispensers from the market and in the first ALT. (a) Failed product from the market, (b) fractured dispenser within the first ALT, and (c) SEM micrographs of fractured surfaces.
Applsci 13 01358 g011
Figure 12. Outcomes of fail reproduction and market failure on the Weibull plot.
Applsci 13 01358 g012
Figure 13. Structure of problematic lever in the field and ALTs.
Applsci 13 01358 g013
Figure 14. Result of stress analysis by utilizing finite element analysis (FEA).
Applsci 13 01358 g014
Table 1. Unabridged ALT strategy of mechanical modules in a domestic refrigerator.
ModulesField DataAnticipated ReliabilityAimed Reliability
Failure Rate per Year, %/YearBX Life, YearFailure Rate per Year, %/YearBX Life,
LB (Year)
Failure Rate per Year, %/YearBX Life, Year
A0.303.3Similar×10.303.330.1010(BX = 1.0)
B0.244.2New×51.200.830.1010(BX = 1.0)
C0.352.9Similar×10.352.90.1010(BX = 1.0)
D0.313.2Altered×20.621.610.1010(BX = 1.0)
E0.156.7Altered×20.303.330.1010(BX = 1.0)
Others0.5010.0Similar×10.5010.00.5010(BX = 5.0)
Product1.92.9--3.270.831.0010(BX = 10)
Table 2. Power stated as effort and flow in an energy transport system.
Ohm’s Law of electrical conduction:   j = σ V
J = electric current density, j (units: A/cm2)D = electric field, −∇ V
(units: V/cm, V = electrical potential)
L = conductivity, σ = 1/ρ
(units: ρ = resistivity (Ω cm))
Fourier’s Law of heat transport: q = −κ∇T
J = heat flux, q (units: W/cm2)D = thermal force, −∇ T
(units: °K/cm, T = temperature)
L = thermal conductivity, κ
(units: W/°K cm)
Fick’s Law of diffusion: F = −D∇ C
J = material flux, F (units:/sec cm2)D = diffusion force, −∇ C
(units:/cm4, C = concentration)
L = diffusivity, D
(units: cm2/sec)
Newton’s Law of viscous fluid flow: Fu = −μ∇ u
J = fluid velocity flux, Fu (units:/sec2 cm)D = viscous force, −∇ u
(units:/sec, u = fluid velocity)
L = viscosity, μ
(units:/sec cm)
Table 3. Summary for the redesigned dispenser lever.
Applsci 13 01358 i001
C1: Fillet1 R0 → R1.5 (first ALT)
→ R2.0 (second ALT)
C3: Rib1 T1 → T1.8 (first ALT)
C5: Rib2 T3 → T4 (third ALT)
C2: Fillet2 R0 → R1.5 (first ALT)
C4: Fillet3 R0 → R8.0 (first ALT)
→ R11.0 (second ALT)
Table 4. The abridged consequence of parametric ALTs.
Parametric ALTFirst ALTSecond ALTThird ALT
Draft Design-Final Design
In 38,000 cycles, the water dispenser has no problems25,000 cycles: 2/8 Fracture32,000 cycles:
1/8 Fracture
38,000 cycles: 8/8 OK
56,000 cycles: 8/8 OK
68,000 cycles: 1/8 Fracture
Structure Applsci 13 01358 i002 Applsci 13 01358 i003 Applsci 13 01358 i004
Action plansC1: Fillet 1 R0 → R1.5
C2: Fillet2 R0 → R1.5
C3: Rib1 T1 → T1.8
C4: Fillet3 R0 → R8.0
C1: Fillet 1 R1.5 → R2.0
C4: Fillet 3 R8.0 → R11.0
C5: Rib2 T3 → T4
Disclaimer/Publisher’s Note: The statements, opinions and data contained in all publications are solely those of the individual author(s) and contributor(s) and not of MDPI and/or the editor(s). MDPI and/or the editor(s) disclaim responsibility for any injury to people or property resulting from any ideas, methods, instructions or products referred to in the content.

