Article

The Temperature Interval of the Liquid–Glass Transition of Amorphous Polymers and Low Molecular Weight Amorphous Substances

by
Migmar V. Darmaev
1,2,
Michael I. Ojovan
3,*,
Alexey A. Mashanov
1 and
Timur A. Chimytov
1,2
1
Department of General and Theoretical Physics, Banzarov Buryat State University, Ulan-Ude 670000, Russia
2
Institute of Physical Materials Science, Siberian Branch of the Russian Academy of Sciences, Ulan-Ude 670047, Russia
3
Department of Radiochemistry, Lomonosov Moscow State University, Moscow 119991, Russia
*
Author to whom correspondence should be addressed.
Appl. Sci. 2023, 13(4), 2742; https://doi.org/10.3390/app13042742
Submission received: 29 January 2023 / Revised: 18 February 2023 / Accepted: 20 February 2023 / Published: 20 February 2023

Abstract

:
We present calculation results of the temperature interval δTg characterizing the liquid–glass transition in amorphous materials obtained on the basis of available data of the empirical parameters C1 and C2 in the Williams–Landel–Ferry (WLF) viscosity equation. We consider the unambiguous dependence of the relative transition temperature interval δTg/Tg on the fraction of the fluctuation volume fg frozen at the glass transition temperature Tg utilizing Sanditov’s model of delocalized atoms. The parameter f = ΔVe/V, which determines the molecular mobility characteristic of delocalized atoms in the liquid–glass transition region, is weakly dependent on the nature of most vitreous substances and can be found as fg = 1/C1. We show that the temperature interval δTg is less than 1% of the Tg for most amorphous substances. This result conforms with Simon’s classical idea of a small temperature range in which the structure freezes. The structural relaxation time τg at Tg of polymers and chalcogenide glasses is also calculated.

1. Introduction

Currently, one of the urgent tasks of modern materials science is the search and development of functional materials with desired properties. Vitreous polymers occupy a special place among such functional materials and have a number of unique advantages that allow them to be used in electronics as binders for nanocomposites, etc. An important direction in the study of the structure and properties of polymers and nanocomposites is the study of the regularities of the liquid–glass transition process (vitrification), which is qualitatively similar in polymers, inorganic substances, amorphous metals, and aqueous systems, including biological species, etc., regardless of their nature and confirmed by the presence of universal rules and equations in the glass transition region [1,2,3,4,5]. In this case, it can be noted that for different classes of substances, the mobility of kinetic units at the glass transition temperature Tg is frozen, implying a different nature of interaction with each other. Thus, the glass transition process (vitrification) of linear amorphous polymers is associated with a relaxation process and a loss of segmental mobility at the glass transition temperature, while in inorganic glasses with a fundamentally different structure, this process is associated with chemical relaxation (bond formation or configuron annihilation [6,7]) and freezing of switching valence chemical bonds process. The presence of such universal regularities allows us to assume that the vitrification of liquids of different natures can be described by a unified theory. We have utilized in this paper the model of delocalized atoms developed by Sanditov [8], aiming to calculate the temperature interval δTg characterizing the liquid–glass transition in amorphous polymers and low molecular weight amorphous substances.

2. Materials and Methods

This work is based on an analysis of the kinetic criterion of glass transition in amorphous polymers and chalcogenide glasses As-S, Se-Ge, and As-Se. It is known that when a glass-forming liquid is cooled at temperatures in the region of the glass transition temperature, the viscosity of substances increases sharply. Conventionally, the liquid–glass transition (i.e., vitrification) occurs when the viscosity reaches ηg = η(Tg), where
η g c o n s t 10 12   Pa s
Relation (1) is an approximate rule for the constancy of the logarithm of viscosity at the glass transition temperature Tg, i.e., this relation (1) can be considered as a logarithmical approximate phenomenological criterion for glass transition [9]. Mazurin [10] states that, for most of the studied glasses, the value of Tg corresponds to temperatures at which the viscosity ηg takes values in the range from 1011 to 1012 Pa∙s, and its value fluctuates in the region of the approximate value (1) with some scatter. However, this is not always the case, as can be seen from Table 4 of Ref. [11], which reveals that the actual viscosities at glass transition temperatures vary from 108.8 to 1013 Pa∙s, which is far different from arbitrarily agreed viscosity (1). The constancy of log(ηg) is better fulfilled for glassy systems of the same class [10]. In the scientific literature, it is also generally accepted that the liquid–glass transition for amorphous substances, including the studied polymers, occurs at viscosity values η(Tg) in the range of 1012–1013 Pa∙s [10]. Attempts were made to determine the temperature dependence of the viscosity of amorphous substances using the Arrhenius equation, but they were unsuccessful in view of the fact that the activation energy of a viscous flow in the region of the glass transition temperature depends on temperature and can be determined only in a narrow temperature range [10,12]. For simple low-viscosity liquids, the Frenkel equation is used for the temperature dependence of viscosity [1,2,3,13]:
η = η 0 exp U R T
where the activation energy U is taken as a constant value, and η0 is the high-temperature viscosity limit [14]. However, as mentioned above, for glass-forming melts, the activation energy of viscous flow in the glass transition region depends quite noticeably on the temperature U = U(T). In this regard, the scientific community considers it most successful in determining the temperature dependence of the viscosity of amorphous materials, including polymers using the Williams–Landel–Ferry (WLF) equation [1,2,3,15,16,17]:
ln a T = C 1 T T g T T g + C 2 ,   a T = η T η T g τ T τ T g ,
where aT is the relative viscosity, and τ is the structural relaxation time. The values of the parameters of the WLF equation C1 and C2 and some characteristics of the glass transition process calculated on their basis for various chalcogenide glasses and polymers are shown in Table 1 [5,18].
At the same time, C1 in Equation (3) is, in the first approximation, a universal constant for various classes of amorphous substances, including the studied polymers.
It is noteworthy that the WLF equation is practically equivalent to the Vogel–Fulcher–Tammann (VFT) equation:
η T = A exp B T T 0 ,  
while substituting B = C1(TTg), T0 = TgC2.
It is worth noting that we are using the WLF empirical equation to identify the temperature interval where different liquids transform into glasses because the activation energy of flow starts changing, namely, at Tg (see, e.g., [19] and Figures 1, 2 and 4 of [20]). Indeed, the viscous flow in glass-forming melts exhibits three regimes [19]: Stage I (T  <  Tg): isostructural Arrhenius law viscosity of the non-relaxed liquid, the upper and lower lines referring to the two limiting fictive temperatures; Stage II (Tliq >  T  >  Tg): variable activation energy of viscosity, with a VFT or WLF fitting through the data; and Stage III (T  >  Tliq): Arrhenius law viscosity, with a crossover temperature TA assumed to be close to Tliq [19] or more exactly, TA = kTm (where k = 1.1–0.15) regardless of the type of glass-forming liquid [21] in line with the results of Refs. [22,23]. Indeed, the VFT and WLF empirical equations are successfully used to consider various aspects of molecular kinetic processes in the glass transition region (see, e.g., [19,24,25]). The WLF equation also describes the temperature dependence of relaxation time τ(T) and viscosity η(T) in the glass transition region for amorphous polymers, inorganic glasses, and metallic amorphous alloys [15,16,26,27].

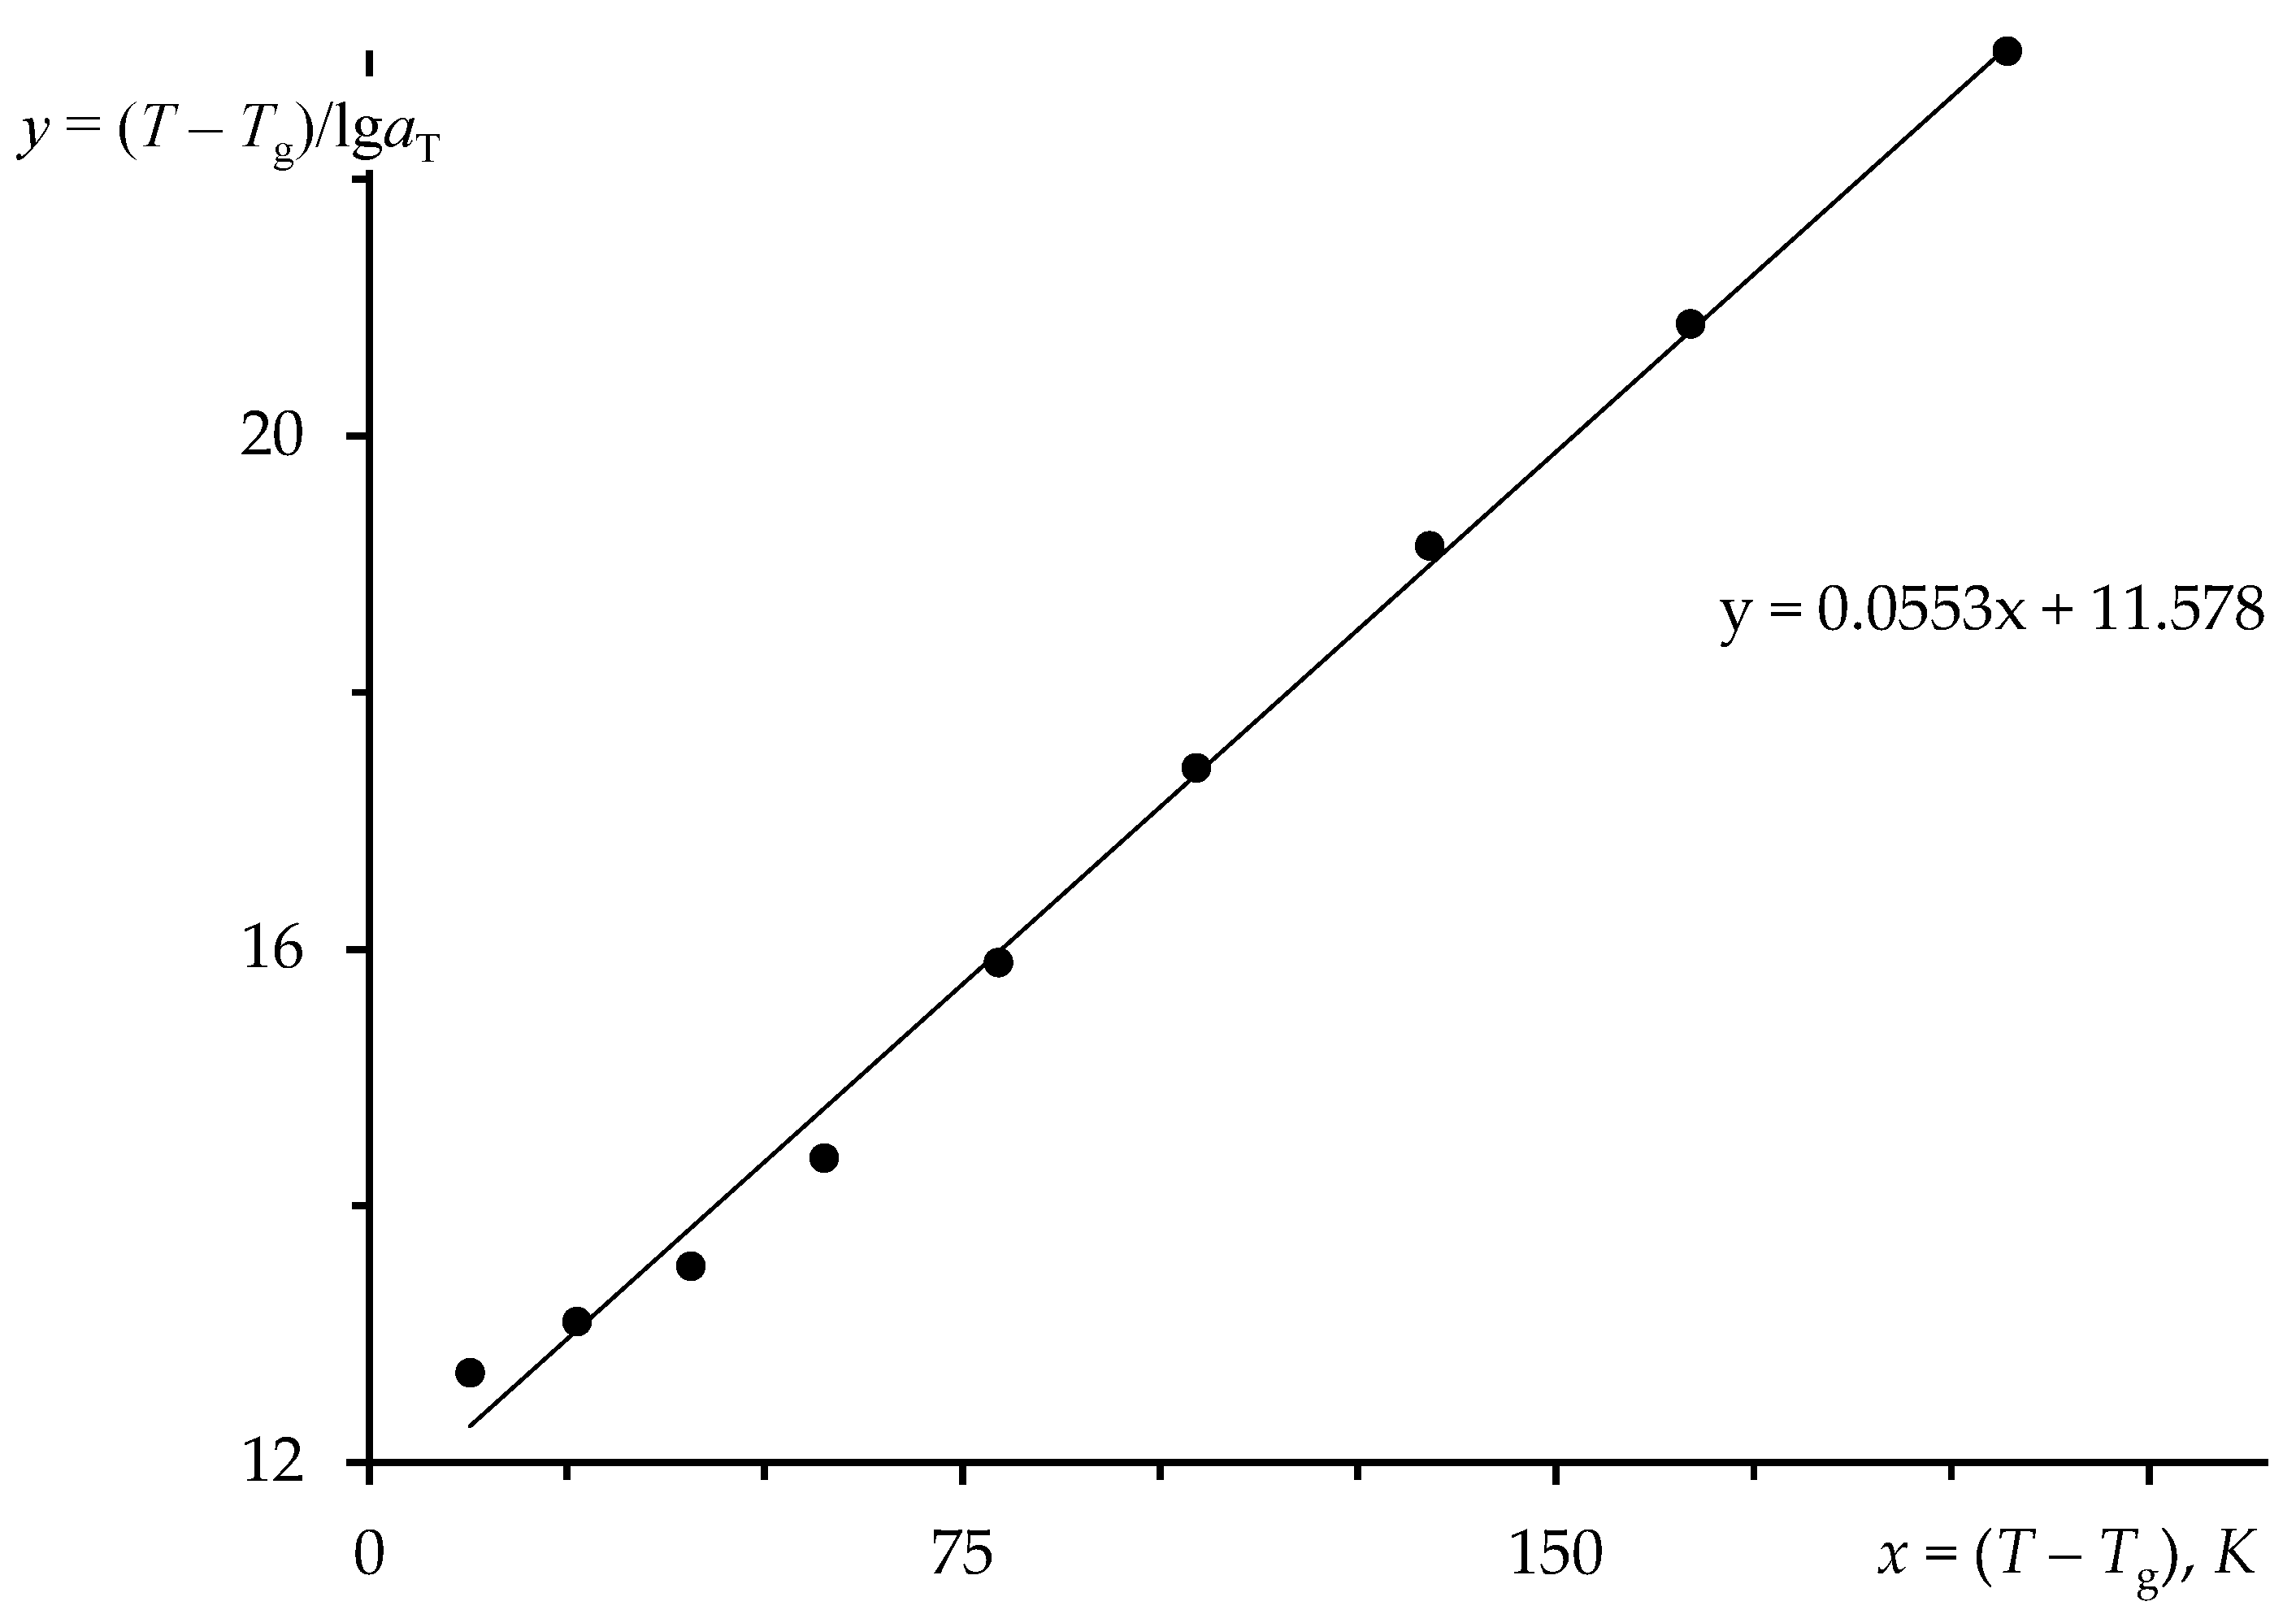
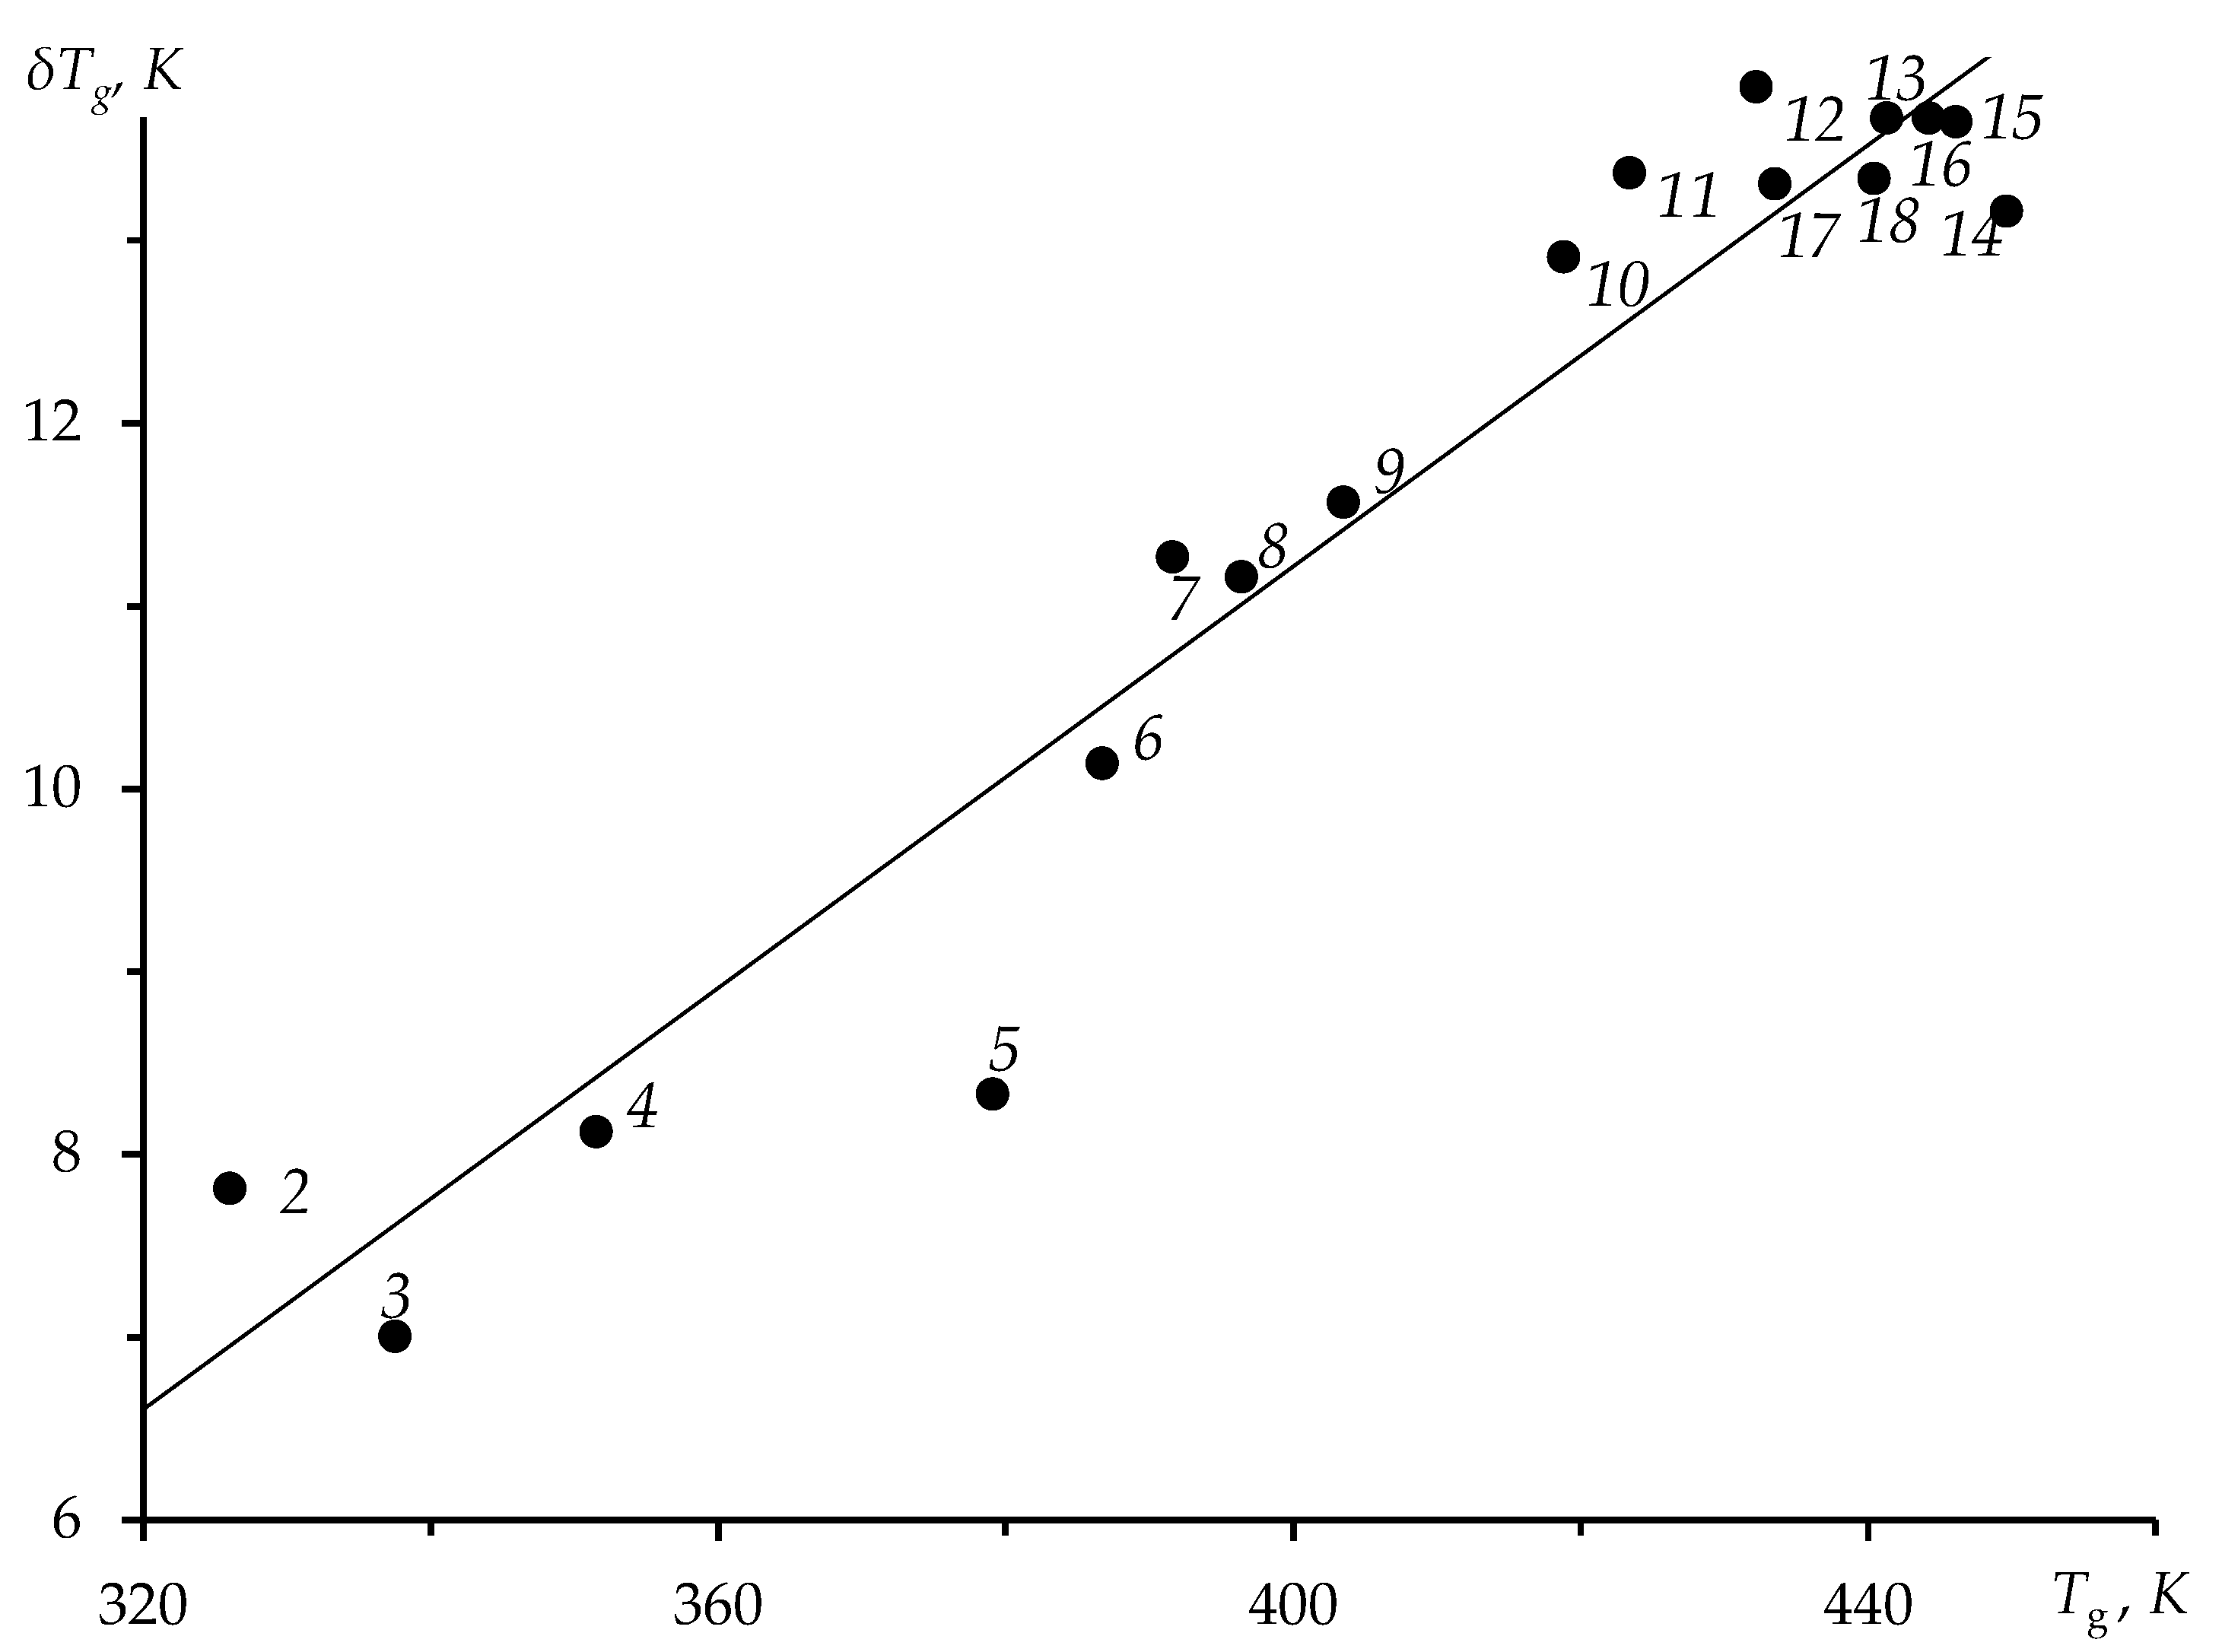
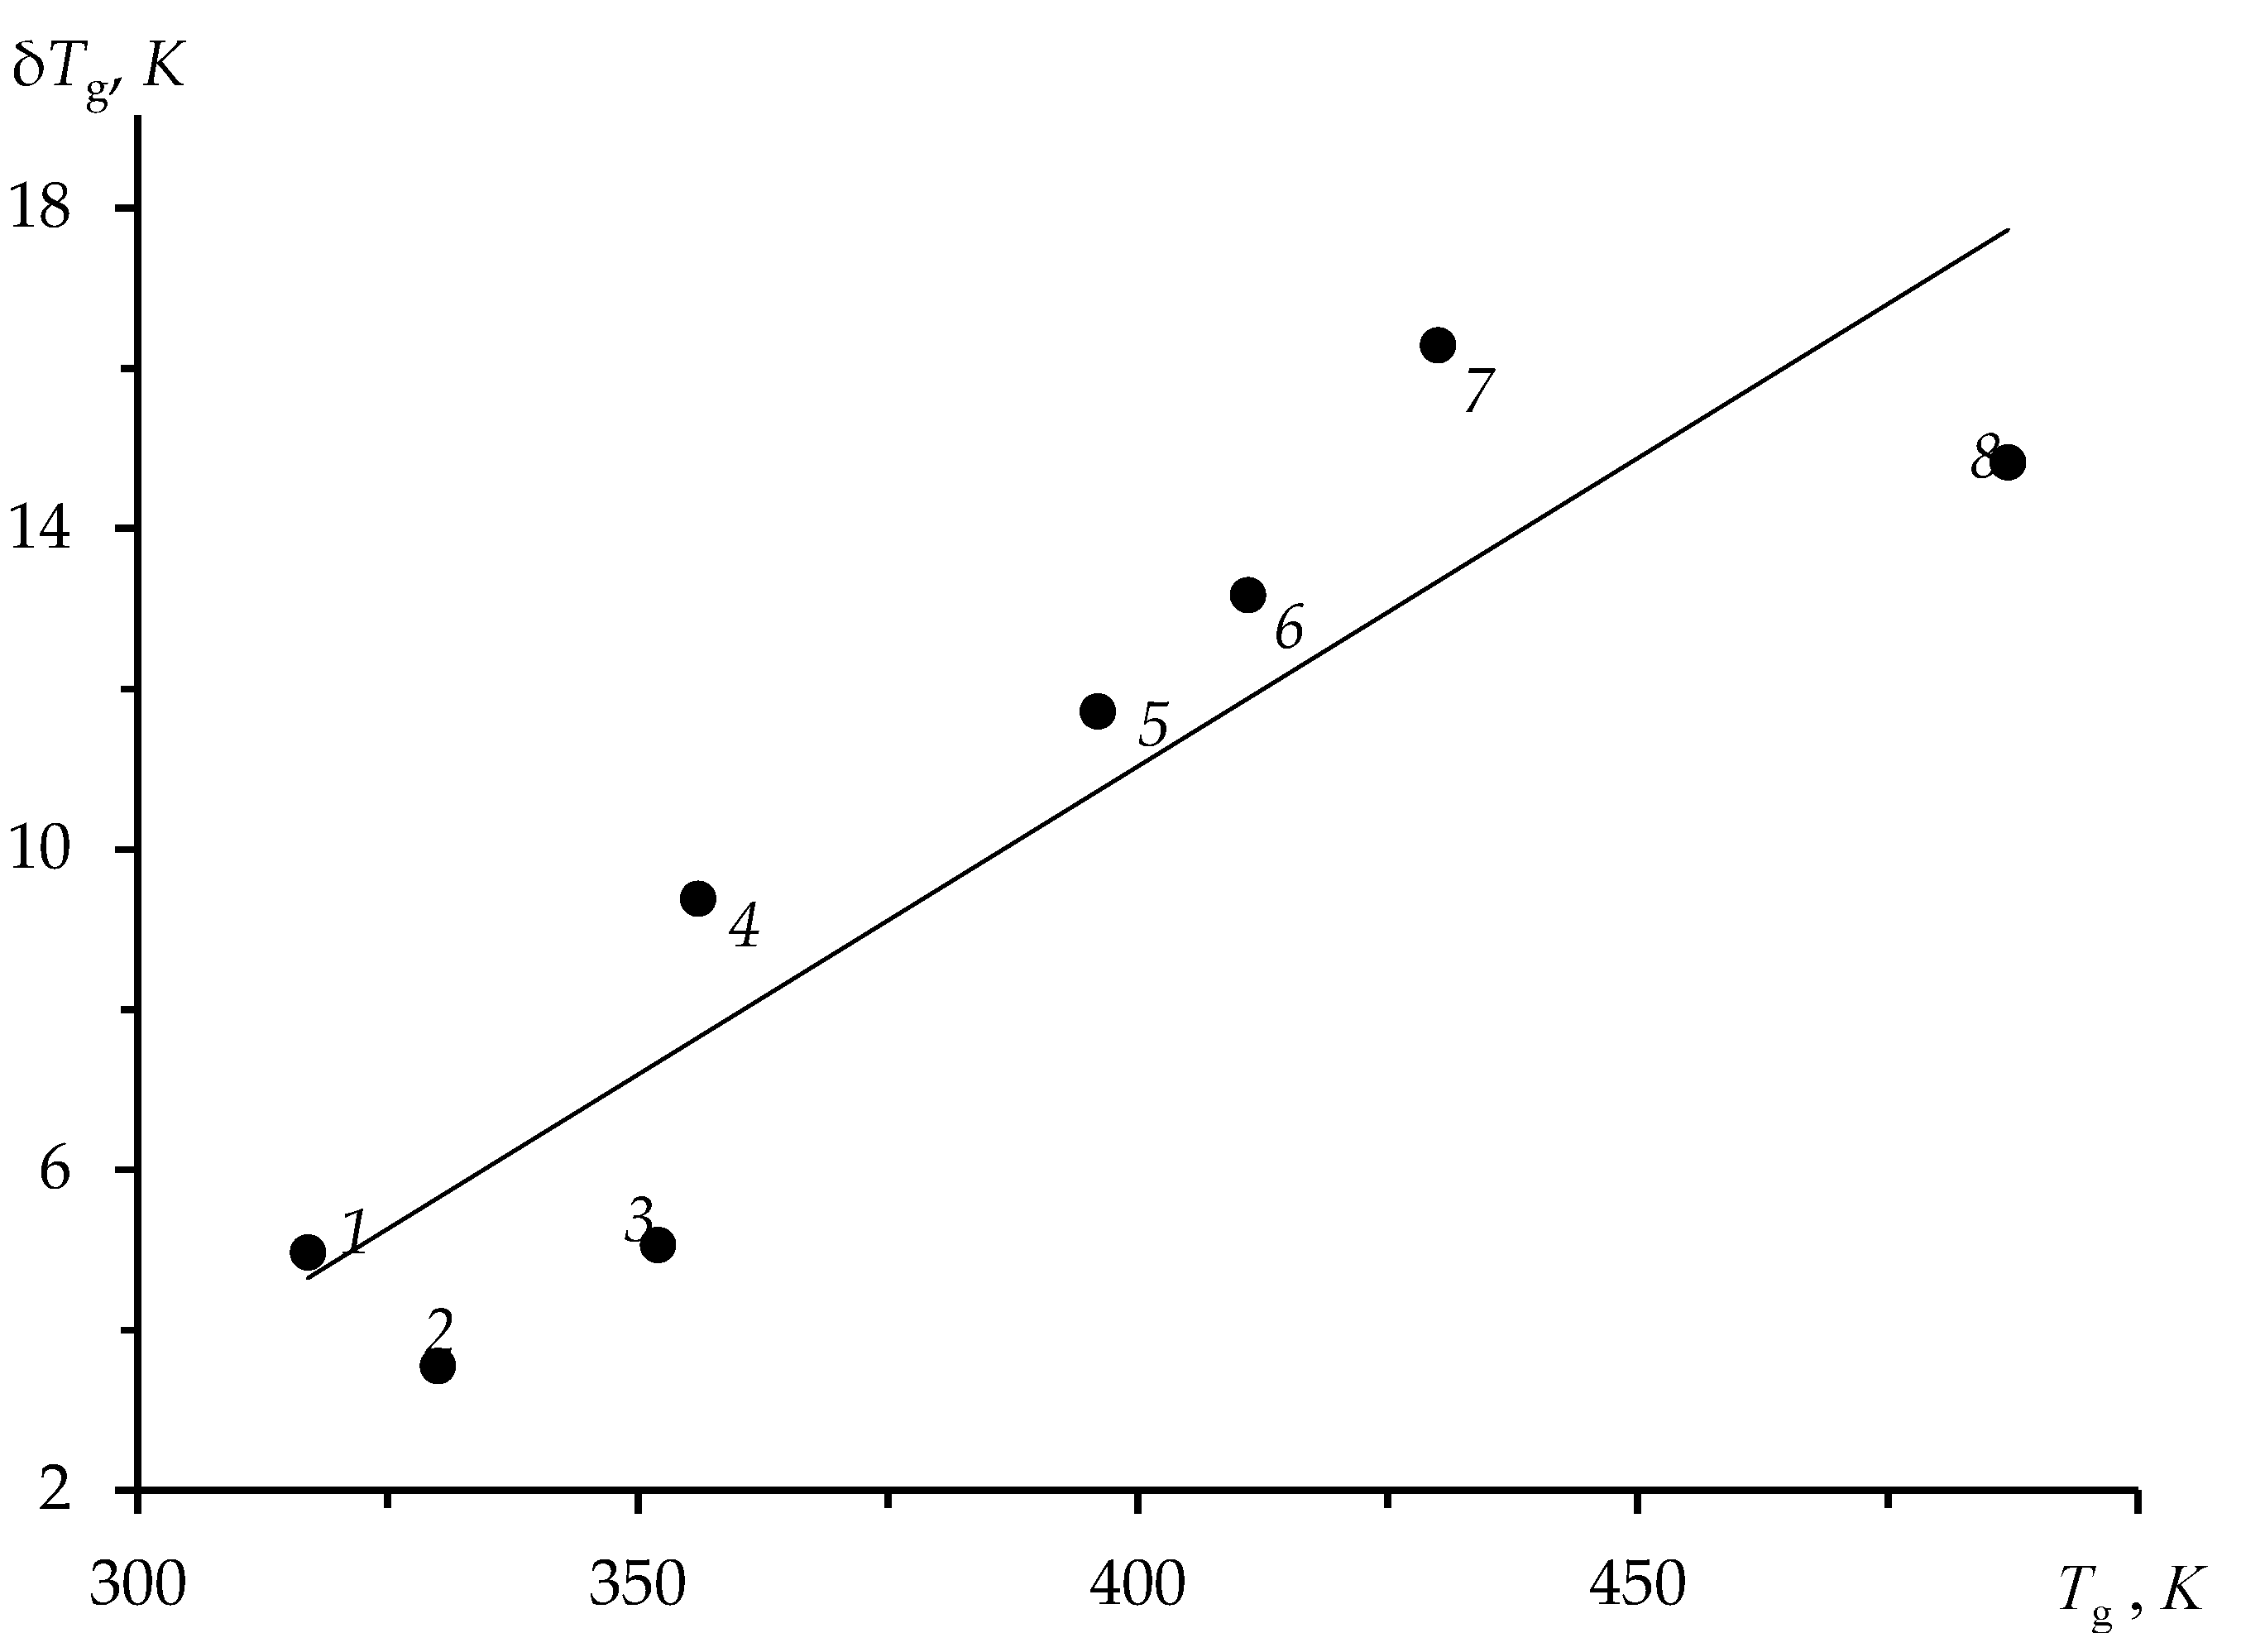
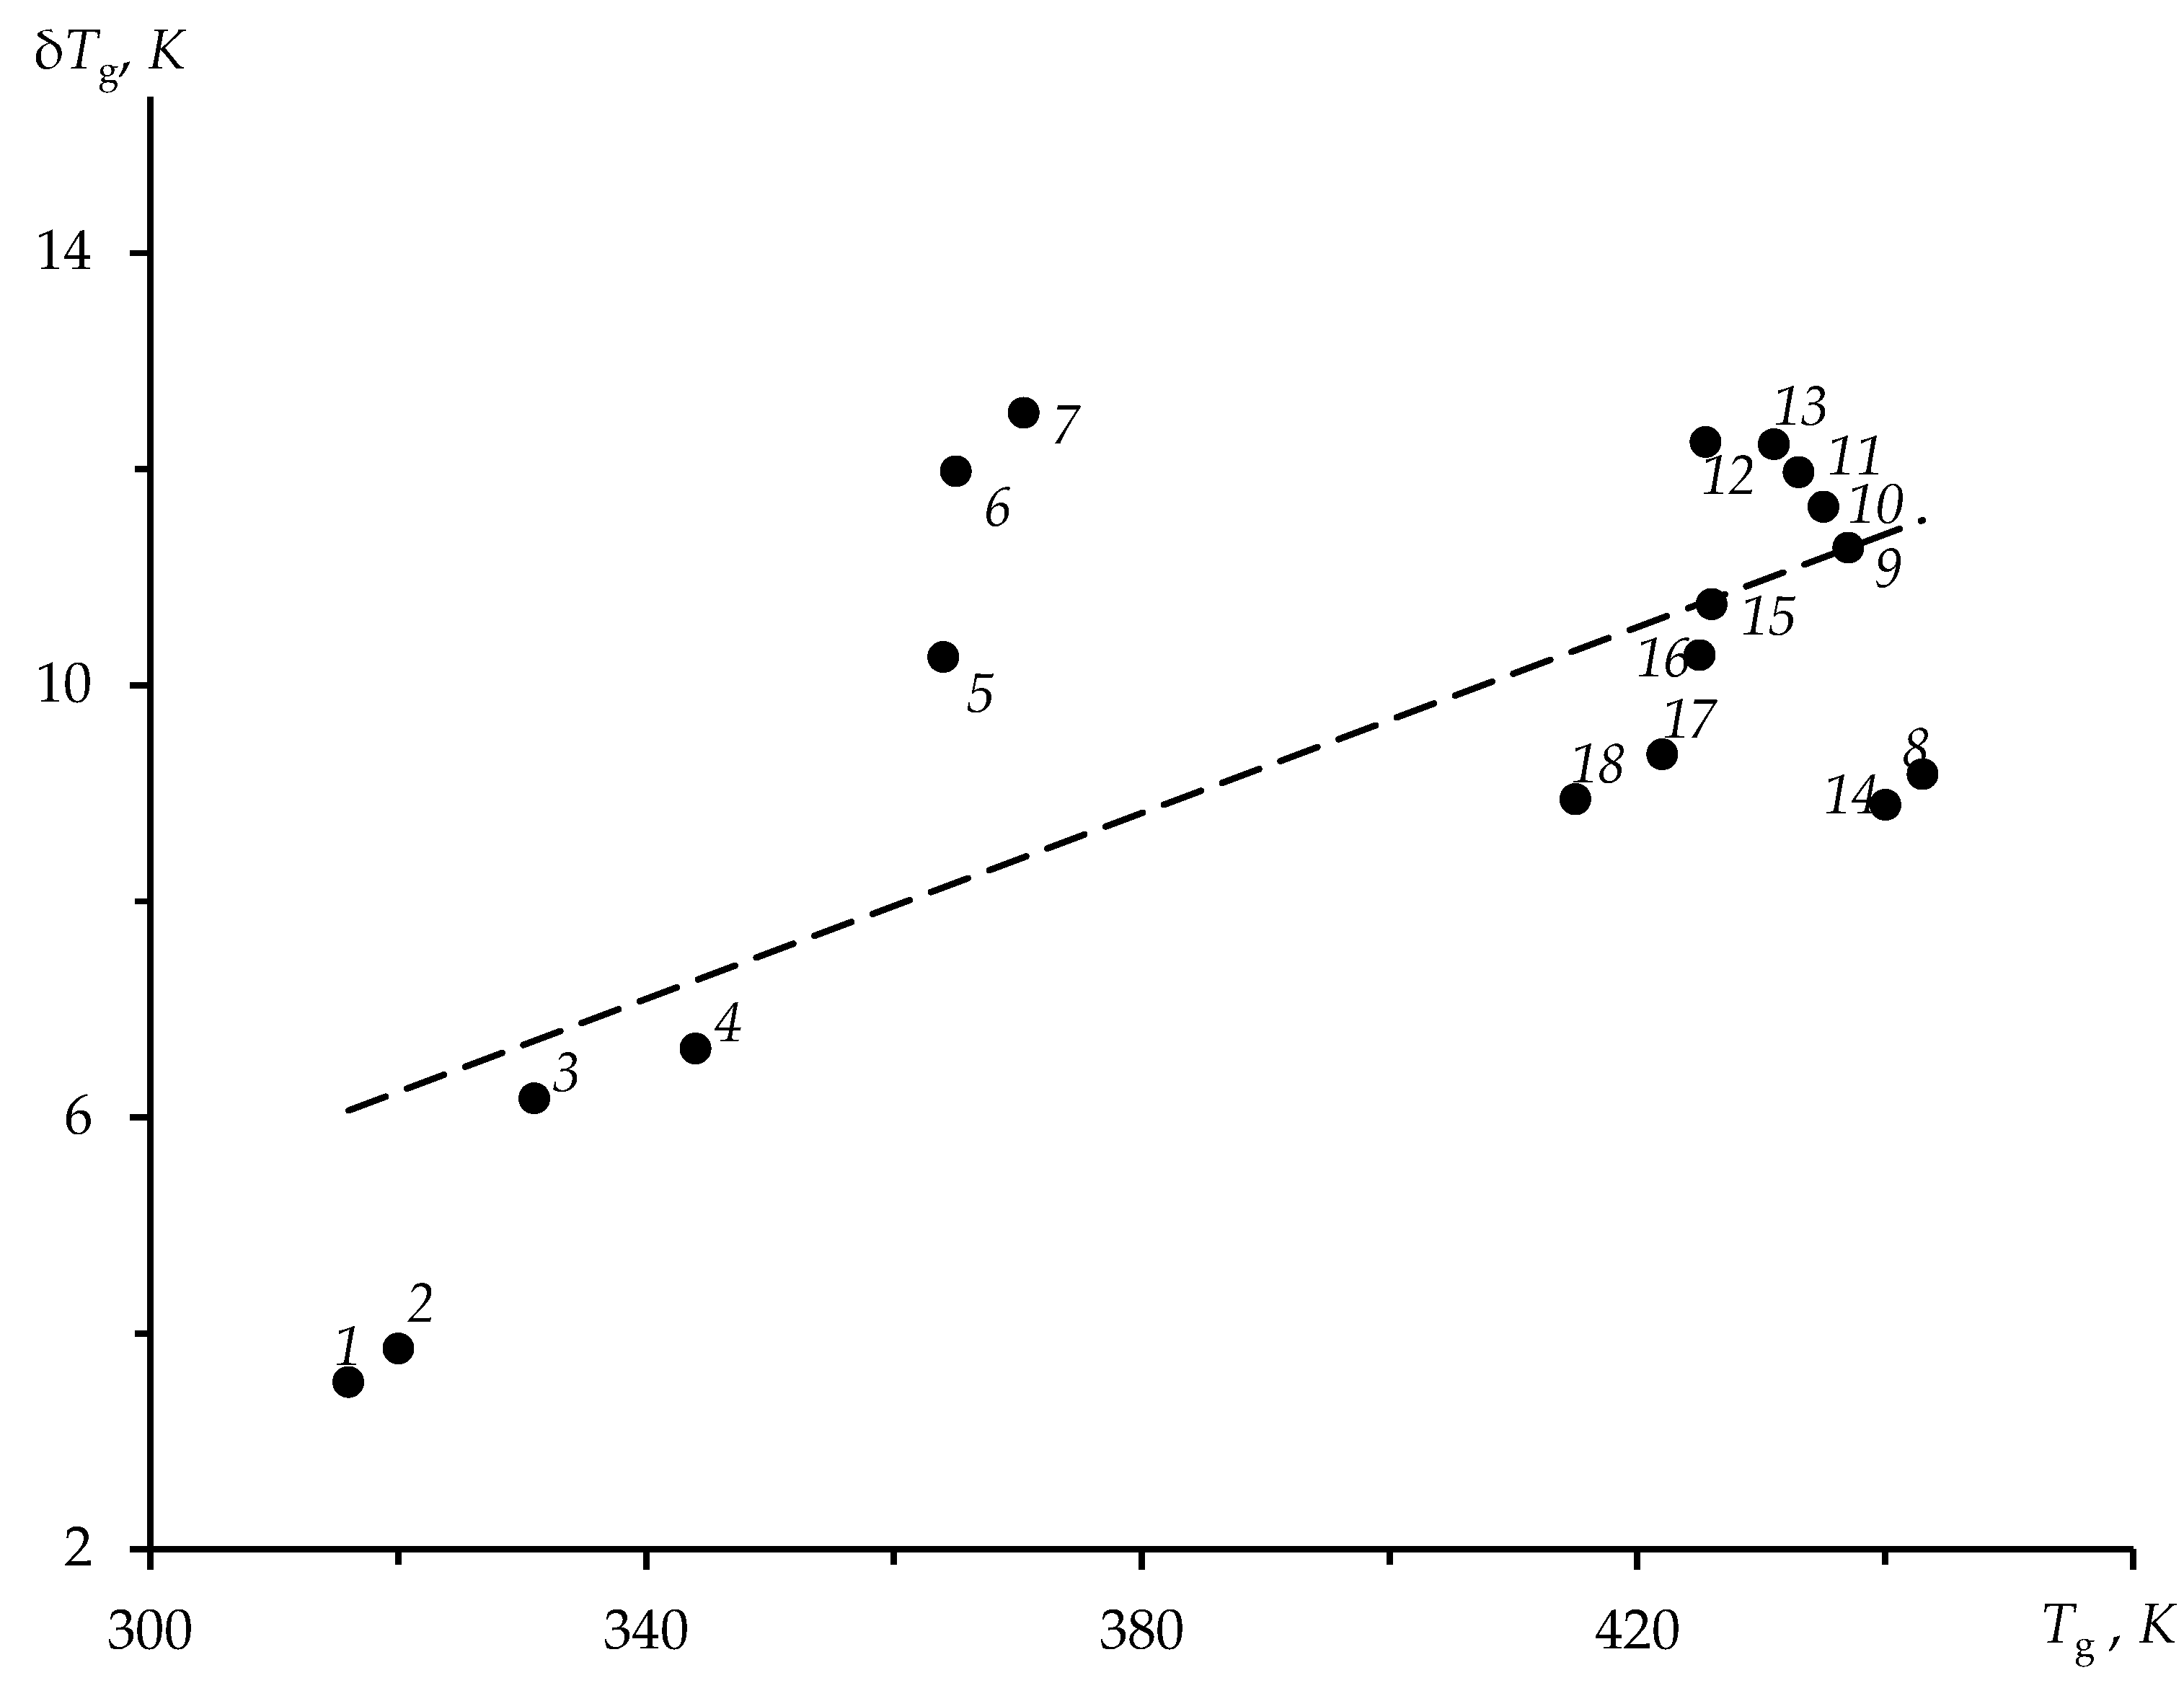
3. The Temperature Interval of the Liquid–Glass Transition

If we rewrite the WLF Equation (3) as a straight line equation and draw graphs in the coordinates y = −[(TTg)/ln(aT)] and x = (TTg); then, we can get a linear dependence of y on x. Figure 1 shows that the dependence y(x) in the glass transition region is linear, which confirms the applicability of the WLF equation.
Experimental data on the temperature dependence of the viscosity of chalcogenide glasses were used from the electronic database SciGlass [18], which are shown in Table 2.
Similarly, graphs were constructed for all compositions of studied polymers. From these straight lines y–x, the values of the parameters of the WLF equation C1 and C2 are determined (Table 1).
Within Sanditov’s model of delocalized atoms [8,17,28], an interpretation of the WLF equation is proposed, from which it follows that the parameter C1 is the reciprocal of the fraction of the fluctuation volume fg frozen at the glass transition temperature:
C 1 = 1 f g
The fluctuation volume of an amorphous substance ΔVe is due to thermal displacements of atoms (kinetic units) [17,28]
Δ V e = N e Δ v e ,  
where Ne is the number of delocalized atoms, and Δve is the elementary fluctuation volume required for the delocalization of an atom, i.e., its maximum displacement from the local equilibrium position.
The volume fraction of the fluctuation volume fg, obtained from the data on the parameter C1, of course, weakly depends on the nature of amorphous substances [8,17] (Table 1) and is no higher than 10%.
f g = Δ V e V T = T g c o n s t 0.03 0.08
During cooling in the glass transition region, due to the slowing down of molecular rearrangement, the change in the structure of the melt does not have time to follow the change in temperature. In the glass transition region, the viscosity of the melt sharply increases, as well as the relaxation time τ(T), which, in turn, is related to the liquid cooling rate q = (dT/dt). According to relaxation theories [5,29,30,31,32,33,34], the relationship between the relaxation time and the melt cooling rate plays a decisive role in the glass transition process. Bartenev [29], in 1951, from general considerations based on experimental data, proposed an equation relating these quantities in the following form:
q τ g = C ,  
where τg is the structural relaxation time at the glass transition temperature Tg, and C is an empirical parameter with the dimension of temperature. The rate q in this equation implies the absolute value of the rate of temperature change |q| when the melt is cooled or when the glass is heated. The relationship (8) gave good results in terms of determining the dependence of the glass transition temperature on the cooling rate using the methods of relaxation spectrometry of amorphous polymers and other glassy systems [33].
A rigorous physical theory about the behavior of kinetic units that can be in two states with different states separated by an energy barrier was developed by Volkenstein and Ptitsyn [30]. The solution of the kinetic equation shows that the glass transition of the system occurs at a certain temperature Tg when the fraction of particles in the excited state freezes. The temperature Tg satisfies the condition:
d τ d T T = T g = 1 q
The kinetic criterion for the liquid–glass transition in this theory is the glass transition equation [28]:
q τ g = δ T g
The value of δTg, which was proposed in this notation by Nemilov [31], characterizes the temperature range of the transition from liquid to glass upon cooling.
To estimate this parameter of the glass transition equation δTg for the glasses and polymers under study, we turn to expressions (3) and (9) discussed earlier. Substituting the dependence τ(T) from the WLF Equation (3) into relation (9) leads to the equality:
q τ g = C 2 C 1 ,  
a comparison of which with the glass transition Equation (10) allows one to obtain a formula for calculating the temperature interval δTg from the data on the parameters of the WLF equation:
δ T g = C 2 C 1 .  
For the studied materials (Table 1), the values of δTg are as follows: As-S: 6.7–13.8 K; Se-Ge: 3.5–16.3 K; As-Se: 3.5–13.4 K; polyisobutylene: 2.7 K; polyvinyl acetate: 1.3 K; natural rubber: 1.4 K; polymethyl methacrylate: 1.1 K; polyurethane: 0.9 K, etc.
While the first empirical parameter C1 of the WLF equation, as noted above, is equal to the reciprocal of fg; then, the second parameter C2 is equal to the ratio of fg to the thermal expansion coefficient of the fluctuation volume at the glass transition temperature βf [17]
C 2 = f g β f .  
Moreover, the product βf·Tg is a single-valued function of fg:
β f T g = f g ln 1 / f g
From equalities (5), (12) and (13), taking into account (14), it follows that the parameter of the glass transition Equation (10) δTg can be determined by the glass transition temperature and the fluctuation volume fraction fg:
δ T g = f g ln 1 / f g T g
Formula (15) implies a linear correlation between the temperature interval δTg and the glass transition temperature Tg since fg ~ const for glasses of the same class (see Table 1). The slope of the straight lines δTgTg is determined by the value fg. The value of fg, although weak, depends on the nature of the glasses, which is sometimes quite strong and can cause a deviation from the linear dependence of δTg on Tg. The possibility of some inaccuracies in the experimental data on the temperature dependence of viscosity is also not ruled out. Since materials of the same class have fg ≈ const, one can expect a linear correlation between the values of δTg and Tg. Indeed, as we see from Figure 2 and Figure 3, for As-S and Se-Ge glasses, the temperature interval δTg, within which the transition from liquid to glass occurs, depends linearly on the glass transition temperature Tg.
For the As-Se glassy system, there is practically no linear dependence (Figure 4).
A small scatter in the values of the fraction of the fluctuation volume fg for amorphous polymers, according to the data in Table 1, which ranges from 0.024 to 0.028, also indicates the relative constancy of the factor in front of Tg in the Equation (15).

4. Calculation of the Structure Relaxation Time at the Glass Transition Temperature

The temperature at which the glass transition of the liquid occurs depends on the melt cooling rate q, although this dependence is weak. The standard glass transition temperature Tg is considered to be the temperature at which the limiting viscosity ηg ≈ 1012 Pa∙s is reached. It corresponds to the cooling rate
q = 3   K / min = 0.05   K / s ,
which is considered a standard cooling rate [3,10,32,33]. In the dilatometry of glasses and polymers, approximately the same cooling rate is almost universally used (16). In view of the weak (logarithmic) dependence of Tg on q, small fluctuations of q around the standard value (16) do not particularly affect the value of Tg. Therefore, it is generally assumed that most available data on Tg actually refer to the standard cooling rate. There are little data for other rates q.
According to Formula (11), at a standard cooling rate q = 0.05 K/s, according to the data on the WLF equation parameters C1 and C2, the structural relaxation time τg was calculated at the glass transition temperature (Table 1) As-S: 135–277 s; Se-Ge: 71–325 s; As-Se: 71–267 s; polyvinyl acetate: 61 s; natural rubber: 57 s; polymethyl methacrylate: 22 s; polyurethane: 18 s; polyvinyl chloroacetate: 20 s; polyisobutylene: 54 s.
For comparison, we can present the results of calculating the relaxation time of the structure for oxide systems using the well-known Maxwell formula: τ = η/G, where G is the shear modulus. For most oxide inorganic glasses, the instantaneous shear modulus G is about G = (20–25)·109 Pa, which changes little with temperature. For a large set of oxide inorganic glasses at a standard cooling rate q = 0.05 K/s, the logarithm of viscosity at the glass transition temperature is log(ηg, Pa∙s) = 12.76 ± 0.26. At a standard cooling rate, the approximate constancy of viscosity at the glass transition temperature can be represented as ηg ≈ 1012–1013 Pa∙s. From these data on the quantities G and ηg, at the level of qualitative estimates, we obtain [10,31,32,34,35]:
τ g = η g G 10 2   s ,
which coincides in order of magnitude with the results of calculation by Formula (11), according to the data on the parameters of the WLF equation C1 and C2.

5. Discussion

The liquid–glass transition has a dual nature demonstrating both kinetic [36,37,38,39] and thermodynamic phase transformation features [7,38,39,40,41,42,43]. Indeed, the higher the temperature of an amorphous material, either polymer or inorganic, including metallic systems, the more chemical bonds are broken in it. Broken bonds weaken the bond lattice of material, and because of that, the viscosity of amorphous materials is lower at higher temperatures, with typical molecular building blocks of the material becoming increasingly free to move. Hence, there is a gradual change of its solid-like behavior to a more gas-like type behavior which in the kinetic approach is agreed to occur when the viscosity is getting lower than a certain value, such as the generically agreed through Equation (1) ηg = 1012 Pa∙s.
In the thermodynamic phase transformation approach, often labeled as configuron percolation theory (CPT) [5,9,11], the broken bonds in amorphous materials are termed configurons [6] and are analyzed as a separate phase [7,40]. The glass–liquid transition is then described on the basis of the Kantor–Webman theorem, which states that the rigidity threshold of an elastic percolating network is identical to the percolation threshold [44]. The configuron phase up to the temperatures close to Tg is a point-like set, and the mathematical set theory characterizes it as a set with a Hausdorff dimensionality equal to nil. On the further increase in temperature of the glass, exactly at Tg, the system of configurons forms for the first time a macroscopic percolation cluster. Accordingly to Kantor–Webman theorem, at this temperature and above it, the material is not anymore an elastic solid (glass), transforming into a liquid. The cluster made up of configurons is known to be a fractal characterized by the Hausdorff dimensionality 2.55 ± 0.05 within set theory [45]. Thus, the set of configurons changes its dimensionality in a stepwise manner from 0 to 2.55 ± 0.05 at Tg, which can be interpreted as a kind of symmetry change characterizing the structural difference between glasses and a molten phase of matter [34,40]. It is important that this approach (i.e., CPT) enables structurally to distinguish glasses from melts using experimental data of X-ray diffraction in amorphous materials [11,34,46,47]. Thus, the account of configuron phase formation above the Tg (in the melt) shows that the glass–liquid transition within CPT is similar in nature to the second-order phase transformations following Ehrenfest’s classification of phase transformations.
From the point of view of the relaxation theory of glass transition, the liquid–glass transition process (vitrification) has a pronounced relaxation character and is subject to kinetic laws [4,5]. During the cooling of the glass-forming liquid in the glass transition region, molecular rearrangements become slower, as a result of which the change in the structure does not have time to follow the decrease in temperature. An equation similar to the Bartenev Equation (8) has been successfully used not only for the liquid–glass transition process but also for other relaxation processes [29]. When the temperature changes at a constant rate q, the condition for observing a structural relaxation transition is written as i = C, where τi is the relaxation time of the i-th relaxation process. As an example, thermal stimulation of the electrical depolarization of an amorphous polymer can be cited, which refers to structural relaxation, and the condition for its observation is described by a similar relation [48]. Within the framework of this approach, the relation between the structural relaxation time τ and the melt cooling rate q = dT/dt plays a decisive role in the glass transition of a liquid. The relationship between these quantities is expressed by the glass transition equation: g = δTg, where τg is the relaxation time at T = Tg, and δTg is the temperature range. In the model of delocalized atoms developed by Sanditov [8], it is considered that atom delocalization, which is an ultimate displacement of an active atom, is a necessary condition for an elementary event in the process of viscous flow of glasses and melts. For this reason, as a result of the freezing of the atom delocalization process in the glass transition region, viscous flow effectively stops at Tg, and the melt vitrifies, e.g., passes into a glassy state. This occurs when the energy of thermal vibrations of the disordered lattice per atom becomes equal to or lower than the atom delocalization enthalpy, which provides a certain glass transition criterion [11]. It was shown that the analysis of the viscosity equations allows numerical estimations of δTg [8,17]. Moreover, it shall be noted that these are not limited to only WLF or VFT models [5,9,20].
The dependence of the glass transition equation parameter δTg on the glass transition temperature Tg in Equation (15) is due to a small spread in the fraction of the fluctuation volume fg. Such a dependence can also be obtained from several other considerations. If the equation for the so-called fragility of glass-forming melts, which is determined by the temperature dependence of the viscosity of the liquid η(T) near the glass transition temperature [49]
m = d ln η T d T g / T T = T g
substitute the temperature dependence of viscosity from the WLF Equation (3); then, this will lead to the expression:
m = C 1 C 2 T g .
Considering expression (12) at mconst, a linear correlation follows between the temperature interval δTg and the glass transition temperature Tg:
δ T g = 1 m T g .
The fragility m serves as a characteristic of glass classification [50]. Hence, we can conclude that this linear correlation is valid for glasses of the same class with an almost constant fragility m ≈ const. For example, silicate glasses with a network structure have a lower fragility m than glasses with a chain structure.
For most glasses, the value of δTg, according to (15), at known values of fg is no higher than 1% of the glass transition temperature. Thus, the narrowness of the temperature interval δTg can be explained by the low value of the fraction of the fluctuation volume fg frozen at the glass transition temperature, which agrees with the classical concept of a small temperature interval in which the liquid structure freezes.
Although we currently do not have the necessary data for calculations, we note that empirical parameters of the WLF equation for polystyrene polymers could be of particular interest, as it was recently shown that the architecturally-different blends of these polymers could exhibit interesting surface transitions potentially affected by the liquid–glass transition related to the evident role played by the polymer topology in it [49,51,52].

6. Conclusions

The calculation of the temperature interval δTg, within which the liquid transforms into a glassy solid state, was carried out in this work according to the empirical parameters of the Williams–Landel–Ferry equation C1 and C2 at the standard cooling rate q. e.g., for the investigated chalcogenide glasses, the value of δTg is in the range from 3.5 K to 16.3 K for amorphous organic polymers and low molecular weight organic glasses from 0.6 K to 1.6 K. It is assumed that due to the relatively small spread in the fluctuation volume fraction fg for amorphous polymers and glassy systems of the same class, there is a linear dependence of the temperature interval δTg on Tg, although not for all materials, which requires further research in this area.

Author Contributions

Conceptualization, M.V.D. and M.I.O.; methodology, M.V.D. and M.I.O.; software, A.A.M. and T.A.C.; validation, M.V.D.; formal analysis, M.V.D., M.I.O., A.A.M. and T.A.C.; investigation, M.V.D., M.I.O., A.A.M. and T.A.C.; resources, M.V.D.; data curation, M.V.D.; writing—original draft preparation, M.V.D. and M.I.O.; writing—review and editing, M.V.D. and M.I.O. All authors have read and agreed to the published version of the manuscript.

Funding

This research received no external funding.

Institutional Review Board Statement

Not applicable.

Informed Consent Statement

Not applicable.

Data Availability Statement

Data supporting reported results can be found within references.

Acknowledgments

The authors are grateful to Dandar S. Sanditov for the proposed subject for this article and consultations.

Conflicts of Interest

The authors declare no conflict of interest.

References

  1. Zarzycki, J. Glasses and the Vitreous State; Cambridge University Press: New York, NY, USA, 1982. [Google Scholar]
  2. Varshneya, A.K. Fundamentals of Inorganic Glasses; Society of Glass Technology: Sheffield, UK, 2006; p. 682. [Google Scholar]
  3. Sanditov, D.S.; Bartenev, G.M. Physical Properties of Disordered Structures; Nauka: Moscow, Russia, 1982; 259p. [Google Scholar]
  4. Angel, C.A.; Ngai, K.L.; McKenna, G.B.; McMillan, P.F.; Martin, S.W. Relaxation in glass forming liquids and amorphous solids. J. Appl. Phys. 2000, 88, 3113–3157. [Google Scholar] [CrossRef] [Green Version]
  5. Sanditov, D.S.; Ojovan, M.I. Relaxation aspects of the liquid—Glass transition. Phys. Uspekhi 2019, 62, 111–130. [Google Scholar] [CrossRef]
  6. Angell, C.A.; Rao, K.J. Configurational excitations in condensed, and the “bond lattice” model for the liquid-glass transition. J. Chem. Phys. 1972, 57, 470–481. [Google Scholar] [CrossRef]
  7. Ojovan, M.I.; Tournier, R.F. On structural rearrangements near the glass transition temperature in amorphous silica. Materials 2021, 14, 5235. [Google Scholar] [CrossRef]
  8. Sanditov, D.S. Model of delocalized atoms in the physics of the vitreous state. J. Exp. Theor. Phys. 2012, 115, 112–124. [Google Scholar] [CrossRef] [Green Version]
  9. Richet, P.; Conradt, R.; Takada, A.; Dyon, J. (Eds.) Encyclopedia of Glass Science, Technology, History, and Culture; Wiley: Hoboken, NJ, USA, 2021; Volume 1, Chapter 3.1; pp. 249–259. Available online: https://onlinelibrary.wiley.com/doi/book/10.1002/9781118801017 (accessed on 28 January 2023).
  10. Mazurin, O.V. Problems of compatibility of the values of glass transition temperatures published in the world literature. Glass Phys. Chem. 2007, 33, 22–36. [Google Scholar] [CrossRef]
  11. Sanditov, D.S.; Ojovan, M.I.; Darmaev, M.V. Glass transition criterion and plastic deformation of glass. Physica B 2020, 582, 411914. [Google Scholar] [CrossRef]
  12. Ojovan, M. Viscous flow and the viscosity of melts and glasses. Phys. Chem. Glasses Eur. J. Glass Sci. Technol. B 2012, 53, 143–150. [Google Scholar]
  13. Frenkel, J. Kinetic Theory of Liquids; Oxford University Press: Oxford, UK, 1946. [Google Scholar]
  14. Mauro, J.C.; Yue, Y.; Ellison, A.J.; Gupta, P.K.; Allan, D.C. Viscosity of glass-forming liquids. Proc. Natl. Acad. Sci. USA 2009, 106, 19780–19784. [Google Scholar] [CrossRef] [Green Version]
  15. Williams, M.L.; Landel, R.F.; Ferry, J.D. The Temperature Dependence of Relaxation Mechanisms in Amorphous Polymers and Other Glass-Forming Liquids. J. Am. Chem. Soc. 1955, 77, 3701–3707. [Google Scholar] [CrossRef]
  16. Ferry, J.D. Viscoelastic Properties of Polymers; Wiley: New York, NY, USA, 1970. [Google Scholar]
  17. Sanditov, D.S. On the nature of the liquid-to-glass transition equation. J. Exp. Theor. Phys. 2016, 123, 429–442. [Google Scholar] [CrossRef]
  18. MDL®SciGlass-7.8; Institute of Theoretical Chemistry: Shrewsbury, MA, USA, 2012.
  19. Deubener, J. Viscosity of glass-forming melts. In Encyclopedia of Glass Science, Technology, History, and Culture; Wiley: New York, NY, USA, 2021; Chapter 4.1. [Google Scholar] [CrossRef]
  20. Ojovan, M.I. On viscous flow in glass-forming organic liquids. Molecules 2020, 25, 4029. [Google Scholar] [CrossRef]
  21. Galimzyanov, B.; Doronina, M.; Mokshin, A. Arrhenius Crossover Temperature of Glass-Forming Liquids Predicted by an Artificial Neural Network. Materials 2023, 16, 1127. [Google Scholar] [CrossRef]
  22. Tournier, R.F.; Ojovan, M.I. Undercooled phase behind the glass phase with superheated medium-range order above glass transition temperature. Physica B 2021, 602, 412542. [Google Scholar] [CrossRef]
  23. Tournier, R.F.; Ojovan, M.I. Building and breaking bonds by homogenous nucleation in glass-forming melts leading to transitions in three liquid states. Materials 2021, 14, 2287. [Google Scholar] [CrossRef] [PubMed]
  24. Zheng, Q.; Mauro, J.C. Viscosity of glass-forming systems. J. Am. Ceram. Soc. 2016, 100, 6–25. [Google Scholar] [CrossRef]
  25. Wen-Sheng Xu, W.-S.; Douglas, J.F.; Sun, Z.-Y. Polymer Glass Formation: Role of Activation Free Energy, Configurational Entropy, and Collective Motion. Macromolecules 2021, 54, 3001–3303. [Google Scholar]
  26. Sanditov, D.S.; Razumovskaya, I.V. New Approach to Justification of the Williams–Landel–Ferry Equation. Polym. Sci. Ser. A 2018, 60, 156–161. [Google Scholar] [CrossRef]
  27. Sanditov, D.S.; Darmaev, M.V.; Sanditov, B.D. Application of the model of delocalized atoms to metallic glasses. Tech. Phys. 2017, 62, 53–57. [Google Scholar] [CrossRef]
  28. Sanditov, D.S.; Badmaev, S.S. Delocalized-atom model and properties of sulfophosphate glasses. Inorg. Mater. 2019, 55, 90–95. [Google Scholar] [CrossRef]
  29. Bartenev, G.M. On the relationship between the glass transition temperature of silicate glass and the rate of cooling or heating. Rep. Acad. Sci. 1951, 76, 227–230. [Google Scholar]
  30. Volkenstein, M.V.; Ptitsyn, O.B. Relaxation theory of glass transition. I. Solution of the basic equation and its study. J. Tech. Phys. 1956, 26, 2204–2222. [Google Scholar]
  31. Nemilov, S.V. Maxwell equation and classical theories of glass transition as a basis for direct calculation of viscosity at glass transition temperature. Glass Phys. Chem. 2013, 39, 609–623. [Google Scholar] [CrossRef]
  32. Schmelzer, J.W.P. Kinetic criteria of glass formation and the pressure dependence of the glass transition temperature. J. Chem. Phys. 2012, 136, 074512. [Google Scholar] [CrossRef]
  33. Bartenev, G.M.; Lukyanov, I.A. The dependence of the glass transition temperature of amorphous substances on the heating rate and the relationship between the glass transition temperature and the activation energy. J. Phys. Chem. 1955, 29, 1486–1498. [Google Scholar]
  34. Ojovan, M.I. Configurons: Thermodynamic parameters and symmetry changes at glass transition. Entropy 2008, 10, 334–364. [Google Scholar] [CrossRef] [Green Version]
  35. Sanditov, D.S. Elastic properties and anharmonicity of solids. Phys. Solid State 2022, 64, 235–247. [Google Scholar] [CrossRef]
  36. Hunt, A. A purely kinetic justification for application of Ehrenfest theorems to the glass transition. Solid State Commun. 1992, 84, 263–266. [Google Scholar] [CrossRef]
  37. Angell, C.A. Glass-formers and viscous liquid slowdown since David Turnbull: Enduring puzzles and new twists. MRS Bull. 2008, 33, 544–555. [Google Scholar] [CrossRef] [Green Version]
  38. Tournier, R.F. Thermodynamic and kinetic origins of the vitreous transition. Intermetallics 2012, 30, 104–110. [Google Scholar] [CrossRef]
  39. Zheng, Q.; Zhang, Y.; Montazerian, M.; Gulbiten, O.; Mauro, J.C.; Zanotto, E.D.; Yue, Y. Understanding glass through differential scanning calorimetry. Chem. Rev. 2019, 119, 7848–7939. [Google Scholar] [CrossRef] [PubMed]
  40. Ojovan, M.I. Ordering and structural changes at the glass–liquid transition. J. Non-Cryst. Solids 2013, 382, 79–86. [Google Scholar] [CrossRef]
  41. Albert, S.; Bauer, T.; Michl, M.; Biroli, G.; Bouchaud, J.-P.; Loidl, A.; Luckenheimer, P.; Tourbot, R.; Wiertel-Gasquet, C.; Ladieu, F. Fifth-order susceptibility unveils growth of thermodynamic amorphous order in glass-formers. Science 2016, 352, 1308–1311. [Google Scholar] [CrossRef] [PubMed] [Green Version]
  42. Tournier, R.F. First-order transitions in glasses and melts induced by solid siperclusters nucleated and melted by homogeneous nucleation instead of surface melting. Chem. Phys. 2019, 524, 40–54. [Google Scholar] [CrossRef] [Green Version]
  43. Benigni, P. CALPHAD modeling of the glass transition for a pure substance, coupling thermodynamics and relaxation kinetics. Calphad 2021, 72, 102238. [Google Scholar] [CrossRef]
  44. Kantor, Y.; Webman, I. Elastic properties of random percolating systems. Phys. Rev. Lett. 1984, 52, 1891–1894. [Google Scholar] [CrossRef]
  45. Isichenko, M.B. Percolation, statistical topography, and transport in random media. Rev. Mod. Phys. 1992, 64, 961–1043. [Google Scholar] [CrossRef] [Green Version]
  46. Louzguine-Luzgin, D.V. Structural Changes in Metallic Glass-Forming Liquids on Cooling and Subsequent Vitrification in Relationship with Their Properties. Materials 2022, 15, 7285. [Google Scholar] [CrossRef]
  47. Ojovan, M.I.; Louzguine-Luzgin, D.V. On Structural Rearrangements during the Vitrification of Molten Copper. Materials 2022, 15, 1313. [Google Scholar] [CrossRef]
  48. Bartenev, G.M.; Barteneva, A.G. Relaxation Properties of Polymers; Chemistry: Moscow, Russia, 1992; 384p. [Google Scholar]
  49. He, Q.; Wang, S.-F.; Hu, R.; Akgun, B.; Tormey, C.; Peri, S.; Wu, D.T.; Foster, M.D. Evidence and Limits of Universal Topological Surface Segregation of Cyclic Polymers. Phys. Rev. Lett. 2017, 118, 167801. [Google Scholar] [CrossRef] [Green Version]
  50. Angell, C.A. Perspective on the Glass Transition. J. Phys. Chem. Solids 1988, 49, 836–871. [Google Scholar] [CrossRef]
  51. Pellicane, G.; Megnidio-Tchoukouegno, M.; Mola, G.T.; Tsige, M. Surface enrichment driven by polymer topology. Phys. Rev. E 2016, 93, 050501. [Google Scholar] [CrossRef] [PubMed] [Green Version]
  52. Zhang, X.; Waymouth, R.M. Zwitterionic Ring Opening Polymerization with Isothioureas. ACS Macro Lett. 2014, 3, 1024–1028. [Google Scholar] [CrossRef] [PubMed] [Green Version]
Figure 1. Temperature dependence of the viscosity of As-S glasses in coordinates corresponding to the Williams–Landel–Ferry equation. The data of [18] were used where the composition is as follows: As—32.5 mol%; S—67.5 mol%.
Applsci 13 02742 g001
Figure 2. Linear correlation between the temperature interval δTg characterizing the glass transition range and the glass transition temperature Tg of glasses in the As-S system. The point numbers correspond to the glass order numbers in Table 1.
Applsci 13 02742 g002
Figure 3. Linear correlation between δTg and Tg for Se-Ge glasses. The point numbers correspond to the glass order numbers in Table 1.
Applsci 13 02742 g003
Figure 4. Correlation between δTg and Tg for As-Se glasses. The point numbers correspond to the glass order numbers in Table 1.
Applsci 13 02742 g004
Table 1. The parameters of the WLF Equation (3) C1 and C2 and the characteristics of the glass transition process for polymers and glasses As-S, Se-Ge, and As-Se [5,18].
MaterialC1C2, KTg, KδTg, Kfgτg, s
Polyisobutylene381042022.70.02654
Polyvinyl acetate36473051.30.02826
Polyvinyl chloroacetate40402961.00.02520
Polymethyl acrylate42452761.10.02422
Polyurethane36332380.90.02818
natural rubber38543001.40.02657
Methacrylate polymers:
ethyl40653351.60.02532
n-butyl39973002.50.02650
n-octyl371072532.90.02758
NoAs, mol%S, mol%Chalcogenide glasses
112.587.512.081.20318.56.70.083134.8
215.085.013.0101.5326.07.80.077156.3
317.582.512.386.50337.57.00.081140.1
420.080.013.9112.8351.58.10.072162.5
525.075.014.5120.7379.18.30.069166.6
627.073.017.2174.8386.710.10.058202.8
728.671.419.2216.7391.611.30.052225.4
830.070.018.9210.6396.411.20.053223.2
932.567.518.2210.4403.511.60.055231.4
1035.065.022.2286.9418.812.90.045258.2
1136.763.322.7303.9423.413.40.044267.4
1237.662.426.3364.2432.213.80.038276.8
1339.061.025.6350.5441.313.70.039273.4
1440.060.027.0355.7449.613.20.037263.2
1540.659.427.8379.2446.113.70.036273.0
1641.158.926.3359.7444.213.70.038273.4
1742.157.927.0360.5440.413.30.037266.8
1842.757.327.0359.7433.513.30.037266.2
NoSe, mol%Ge, mol%Chalcogenide glasses
197312.863.73175.00.07899.3
295511.841.83303.50.08571.0
392812.764.03525.10.079101.2
4901019.6183.93569.40.051187.6
5851519.2225.439611.70.052234.4
6831718.5243.941113.20.054263.4
7802021.7354.143016.70.046325.8
8752513.5200.448714.80.074296.6
NoAs, mol%Se, mol%Chalcogenide glasses
139711.841.83163.50.08571.0
259512.748.83203.90.07977.2
3109017.5108.43316.20.057123.5
414.985.116.7110.63446.60.060132.7
5257523.3238.636410.30.043205.2
626.573.525.0299.536512.00.040239.6
728.671.429.4368.2370.512.50.034250.4
8406018.5169.94439.20.054183.5
942.257.821.7245.043711.30.046225.4
1043.356.721.3247.943511.70.047233.0
11455520.4244.343312.00.049239.4
1248.551.520.0245.0425.512.30.050245.0
13495122.7278.043112.20.044244.6
14505015.6138.94408.90.064177.8
1550.649.417.2185.342610.80.058215.0
16514916.1165.842510.30.062205.6
1752.747.316.4153.44229.40.061187.2
1853.746.315.2135.54158.90.066178.9
Table 2. Temperatures of As-S glasses of composition in mol%, temperature in K, at which the viscosity log[η(T), poise] takes given values.
AsS13121110987654
12.587.5318.5324.7333.0345.3362.0384.0410.5440.5476.5531.0
15.085.0326.0333.3344.0357.6373.9392.5418.0450.0489.5539.0
17.582.5337.5344.0353.0365.3381.3403.5429.4458.7496.0546.0
20.080.0351.5360.8370.6380.9395.5415.2439.0467.5504.5561.5
25.075.0379.1389.1399.4410.2421.6438.0461.0491.0532.5586.0
27.073.0386.7398.3410.7424.0438.5454.5473.0500.0537.5593.0
28.671.4391.6404.3417.8432.2447.6464.3484.0511.5547.5599.0
30.070.0396.4409.0422.4436.6451.9468.3489.0516.5552.0603.0
32.567.5403.5416.2429.7444.1461.0483.0508.0537.5570.5610.5
35.065.0418.8432.7447.6463.6480.8500.6524.9552.0583.0620.0
36.763.3423.4437.7453.1469.6487.4507.0531.0557.8588.8626.5
37.662.4432.2446.8462.6479.4497.6516.9538.4562.7591.0630.0
39.061.0441.3455.8471.3487.9506.0525.6546.2569.7598.0639.0
40.060.0449.6463.7478.7494.1510.6528.5548.7571.0599.3636.5
40.659.4446.1460.5475.8492.3510.6528.5548.7571.0599.3636.5
41.158.9444.2458.7474.3490.9508.7527.5549.0573.0601.5641.0
42.157.9440.4454.5469.6485.7503.0521.4542.0565.2592.0629.0
42.757.3433.5477.7462.7478.8496.0514.5533.7555.5583.0624.5
Disclaimer/Publisher’s Note: The statements, opinions and data contained in all publications are solely those of the individual author(s) and contributor(s) and not of MDPI and/or the editor(s). MDPI and/or the editor(s) disclaim responsibility for any injury to people or property resulting from any ideas, methods, instructions or products referred to in the content.

