1. Introduction
Constantly evolving architecture brought about the development of spatial bar structures. These are architecturally stunning buildings, yet in addition to the static-strength analysis, they require a study of their dynamic response, which is related to their individual characteristics. Modal analysis is a design essential tool because it provides information on the structure dynamic parameters. The most important parameters of modal analysis include frequencies and modes of free vibration, which are obtained after solving the eigenproblem. For structures sensitive to dynamic loads (e.g., wind load, earthquake load, crowd of people, impact), modal analysis makes it possible to adopt appropriate measures aimed at reducing vibration and its harmful effects, such as resonance.
The need to account for the effect of dynamic loads in the design is illustrated by the example of the motorcycle speedway stadium in Zielona Góra (Poland). Expert opinion on the facility was provided in [
1,
2,
3]. In the author’s opinion, if the fans had continued jumping for a little longer during the event, the probability of structural collapse would have been high. The undulating movement of the roof would have led to its collapse onto the stand, and the failure mechanism would have been rapid. It was found that the designer had neglected the effect of dynamic loading and had not checked for the possibility of resonance occurrence. As the investigations showed, the frequency of the roof structure free vibration was about 2.45 Hz, whereas during the events, the facility was subjected to vibrations of 2.2–2.3 Hz. This situation, namely, similar frequency values, caused resonant vibrations. During the measurements, it was observed that the pattern of vibration increased considerably when the fans enjoyed themselves very much. Roof vibration was recorded on video footage, clearly indicating resonant excitations. The situation made it necessary to retune the structure. The aim was to ensure that the lowest frequency of free vibration of the roof structure was much higher than the frequency of forced vibration. Finally, it was decided the retuning should include additional support of the girder by a steel column. Numerical analysis showed that the natural frequency spectrum shifted so that the first resonance frequency was 5.31 Hz. The strengthening produced a “high tuning” effect. The dynamic load generated by the crowd of people is also the theme of the work [
4]. The research was aimed at determining the most effective bracing system for a typical example of a temporary steel grandstand. Three different bracing systems were analyzed using the five criteria recommended in the literature. The greatest improvement in the behavior of the structure was obtained for the stand equipped with a bracing system, meeting all the proposed criteria. The work [
5] consisted in the analysis of the seismic response of 100 m, 200 m, and 300 m lattice domes to horizontal and vertical movement during an earthquake. Time history analysis was used to analyze the seismic response of the truss domes. This paper aimed to study the seismic properties of lattice domes in terms of eigenvalue modes, displacement, and acceleration response. In the paper [
6] on the dynamic response of lattice domes, cylindrical shell roofs were investigated. Additionally, a simple acceleration response evaluation method using response amplification factors was delivered. The article [
7] discusses the optimal geometry of each of the three different types of single-layer steel domes analyzed under gravity and earthquake loads. For earthquake loads, equivalent static, spectral, and time history analysis (THA) methods were used. The article [
8] describes a novel excitation method for experimental modal analysis (EMA) in situ compared to ambient vibration analysis, the so-called operational modal analysis (OMA). The analyses were performed on an eleven-story building in Austin, Texas. The article [
9] presents a nonlinear static and dynamic analysis of six Schwedler domes of different spans to study the seismic behavior. The authors proposed a formula for calculating the natural period of vibrations and the response modification factor of Schwedler domes. The work [
10] describes the analyses taking into account four different seismic excitations, which show the impact of individual types of earthquakes on the construction of geodesic domes. Geodesic domes are often considered as structural coverings or self-supporting structures. The papers [
11,
12] raise the problem of the sensitivity of parameters of reticulated domes under impact loads. The conclusions provide a constructive criterion for the impact resistance design of reticulated domes. Interesting results of the experimental modal analysis performed both experimentally and numerically are presented in the works [
13,
14,
15,
16,
17,
18]. Wind load, with its dynamic nature, is another vital issue in the design of roof cover. Paper [
19] numerically studies the wind effect on grooved and scallop domes. This paper develops equations for the distribution of Cp on the surface of spherical, grooved, and scallop domes with rise to span ratios [0, 0.7]. The results of the equations agree reasonably well with that of the computational fluid dynamic CFD. In paper [
20], the study aimed to investigate the effect of wind load on traditional dome buildings using the computational fluid dynamic techniques. In this study, fifteen commonly used Iranian dome architectures with combined arcs were chosen to numerically investigate the variations in wind pressure coefficient (Cp) on these domes at different heights and angles. An interesting study of the dynamic stability analysis of tensegrity structures is included in the paper [
21].
The main goal of this paper is to provide a modal analysis of two domes that differ in the rise-to-span ratio H/L. The first one is a low-rise Schwedler dome with an H/L ratio of 1 m/25 m (H/L = 0.04). The other is a geodesic dome with an H/L ratio equal to 6.5 m/21 m (H/L = 0.31). In the design of the low-rise dome, geometric nonlinearity should be considered because of the possibility of the occurrence of large displacement gradients. In the design of a geodesic dome, the differences in the results of static calculations between linear and nonlinear FEM analysis are insubstantial. As a result, we decided to perform computations according to linear FEM analysis. Bar structures of this type are often used as roof covers for sports facilities. A system of frames is often used to connect roof covers to the stadium stands. A crowd of people can generate a large dynamic impact, especially when their movement is, for example, the rhythmic jumping of fans. Coordinated jumps of a crowd of people produce dynamic impacts that induce displacements which are much greater compared with static displacements. In the modal analysis, the mass of the bars of the supporting structure was modeled as evenly distributed, while the mass of the covering and roof equipment was concentrated in the nodes. Classic calculations have been enriched with modal analysis taking into account normal forces. Normal forces affect the vibration frequency of the structure. Commonly used modal analysis does not take into account the influence of normal forces. In order to approximate the actual working conditions of the structure, calculations performed in Autodesk Robot Structure Professional 2022 can be performed in accordance with the modal analysis, taking into account the applied normal forces in the modal analysis.
Additionally, stability loss was verified using linear or geometrical nonlinear buckling analysis. Stability phenomena can be important in the design of single-layer steel domes. The theory of stability is distinguished in the mechanics of structures by the need to depart from the principle of stiffness, which means that nonlinear equations of at least second order should be used [
22,
23,
24,
25,
26,
27]. Geometrically nonlinear analysis (GNA) allows for a complete description of the potential form of instability, including equilibrium paths and singularity locations. These problems were also shown in the probabilistic approach of earlier papers [
28,
29].
2. Materials and Methods
2.1. Static-Strength Analysis
The choice method of static-strength analysis depends on the type of structure. The linear analysis LA is based on linear geometrical and physical relations between displacements, strains, and stresses. The linear analysis of the finite element method (FEM) is reduced to the solution of a linear set of algebraic Equation (1):
where:
KL—linear stiffness matrix of the structure,
q—vector of nodal displacements,
P—vector of nodal load.
The FEM software is additionally equipped with a linear LBA bifurcation analysis, the main purpose of which is to solve its own problem (2):
where:
KG—geometrical stiffness matrix,
—load multiplier.
Linear analysis with linear bifurcation analysis works well for the design of single-layer steel domes. Shallow, single-layer domes are subject to large displacement gradients and should be designed according to geometrically nonlinear analysis. The mathematical model of nonlinear FEM analysis corresponds to a set of nonlinear algebraic equations. The system of equations can be formulated as a sum or an increment. In the first case, the equations have the form (3):
where:
Ks—secant stiffness matrix of the structure.
In the second case, the equations have the form (4):
where:
KT(
q)—tangent stiffness matrix of the structure,
R =
P −
F—vector of residual forces,
F—vector of internal forces.
In the equilibrium state R = 0, while in the iterative process, the R standard defines the distance from the equilibrium state. The iterative process converges if R-> 0.
The tangent stiffness matrix
KT of the structure is obtained by aggregating the stiffness matrix of the elements
:
where
is the tangent stiffness matrix of the element composed of linear stiffness matrix
, stress stiffness matrix
and nonlinear stiffness matrices:
and
.
In geometrically nonlinear problems, we are dealing with a quadratic form of the eigenproblem:
The constant arc-length method developed by Riks [
30] was applied to compute nonlinear equations using Autodesk Robot Structure Professional 2022 software (finite element method code). In this paper, the Schwedler dome is subjected to large displacement gradients and susceptible to stability loss from the condition of node snapping. Nonlinear geometrical relations are defined in the Lagrangian description. The constitutive relations are linear. The geometrical nonlinear analysis GNA is performed using the “Autodesk Robot Structural Analysis” software (finite element method code).
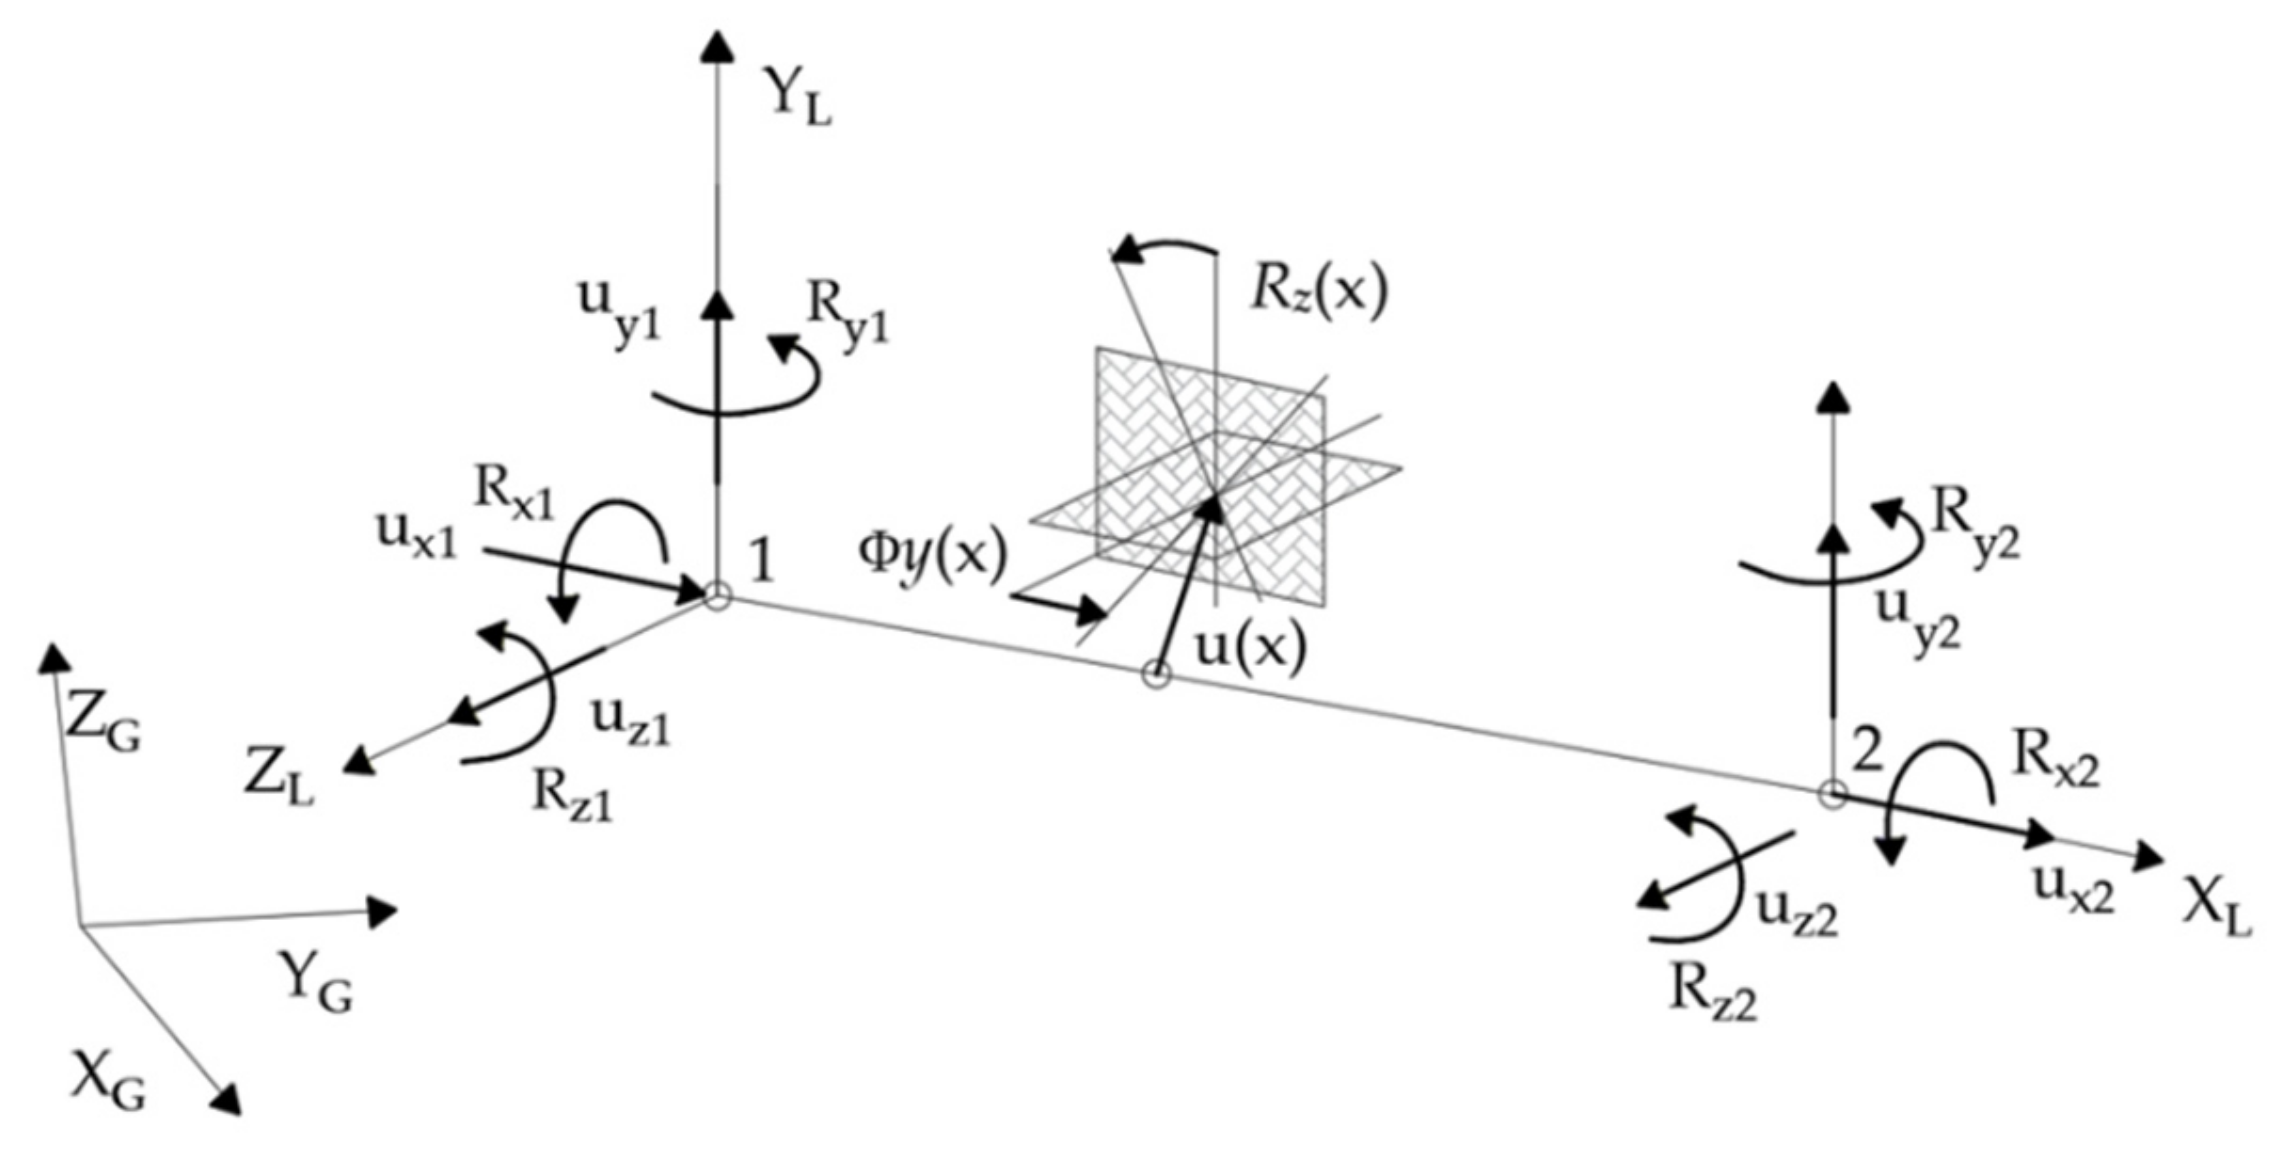
In this paper, the single-layer steel domes are modeled using frame elements, which have 6 degrees of freedom at the node (
Figure 1) (u
x, u
y, u
z, R
x, R
y, R
z, where u denotes displacements in the X
G, Y
G, or Z
G direction in a global coordinate system, and R denotes rotations around the axes). The local coordinate system of an element is a dextrorotary Cartesian system with the following orientation of axes. The local x axis is always the longitudinal element axis, whose direction is defined from the beginning point to the end point. The local axes y and z lie in the plane of the bar section and are arranged according to dextrorotary rotation. By standard, the axes mentioned represent: y axis—the axis of the greater moment of inertia of a bar, the z axis—the axis of the lesser moment of inertia of a bar (depending on the element section).
2.2. Standard Modal Analysis
Modal analysis is a method commonly used in practice to study the dynamic properties of various objects. As a result of the analysis, eigenfrequencies, vibration modes, and damping coefficients are obtained. It enables the identification of dynamic properties of building objects. Thus, it allows you to effectively solve construction problems related to vibrations at the design stage or during operation. Its main application is to compare the frequency of excitations in the system with the frequencies of natural vibrations. If these values are close to each other or overlap, the phenomenon of resonance is created. During the resonance, the vibrations are repeatedly strengthened, which can lead to failure or complete destruction of the building. Eigenvalues and eigenvectors are obtained from the following formula:
where:
KL—linear stiffness matrix of the structure,
M—mass matrix of the structure, ω
i—natural pulsation (natural circular frequency) of i-th mode [rad/sec],
—frequency [Hz],
qi—eigenmode vector of i-th mode.
The eigenvectors are normalized such that the maximum term of each vector is 1.0. In Autodesk Robot Structure Professional 2022, the precision value displayed in the eigenvalue dialog box is considered the achieved convergence accuracy. This value is a tolerable error that determines how exactly the eigenvalue λ
i =
and the eigenvector
qi obtained during iteration for the i-th mode satisfy the eigenproblem equation. The participation factor is defined as:
where:
D—vector of direction cosines is defined as follows:
Vi—i-th normalized eigenvector with:
Participation masses are dynamic, participating in the motion of the structure for every mode and degree of freedom. They are regarded as the current masses for the current mode and as the relative masses which are the sum of the current masses from the first mode to the current one. Values are shown as a percentage of the total dynamic masses. Current participation masses are defined as follows:
Currently, the default method for finding a solution to an eigenproblem is the Lanczos algorithm [
31,
32], which is a powerful approach to solve large-scale eigenvalue problems. It finds the required n eigenvalues and eigenvectors with arbitrary precision.
2.3. Modal Analysis Taking into Account Normal Forces
The static forces applied to the structure affect the vibration frequency of the structure. Commonly used modal analysis (determination of structure vibrations) does not take into account the influence of normal forces. In order to approximate the real working conditions of the structure, the calculations made in Autodesk Robot Structure Professional 2022 can be carried out in accordance with the modal analysis, taking into account the applied static forces in the modal analysis. There are two stages of structural vibration calculations taking into account the action of static forces.
2.3.1. Step 1—Linear or Nonlinear Static Analysis
The purpose of this step is to calculate the internal forces in the bars that are necessary to determine the matrix in the current configuration. The vector of static load may be a simple load case or a combination of defined load cases.
2.3.2. Step 2—Modal Analysis Taking into Account Normal Forces
In the second step, eigenvalues and eigenvectors are obtained from the following formulas:
Stable equilibrium states are described by positive values ωi (ωi > 0), while unstable equilibrium states are described by negative values (ωi < 0). In turn, the zero value (ωi = 0) indicates a stability (buckling) problem. If the matrices (KL + ) or (KL + ) are not positively determined, the static load approaches the critical value (buckling).
3. Results
3.1. Schwedler Dome
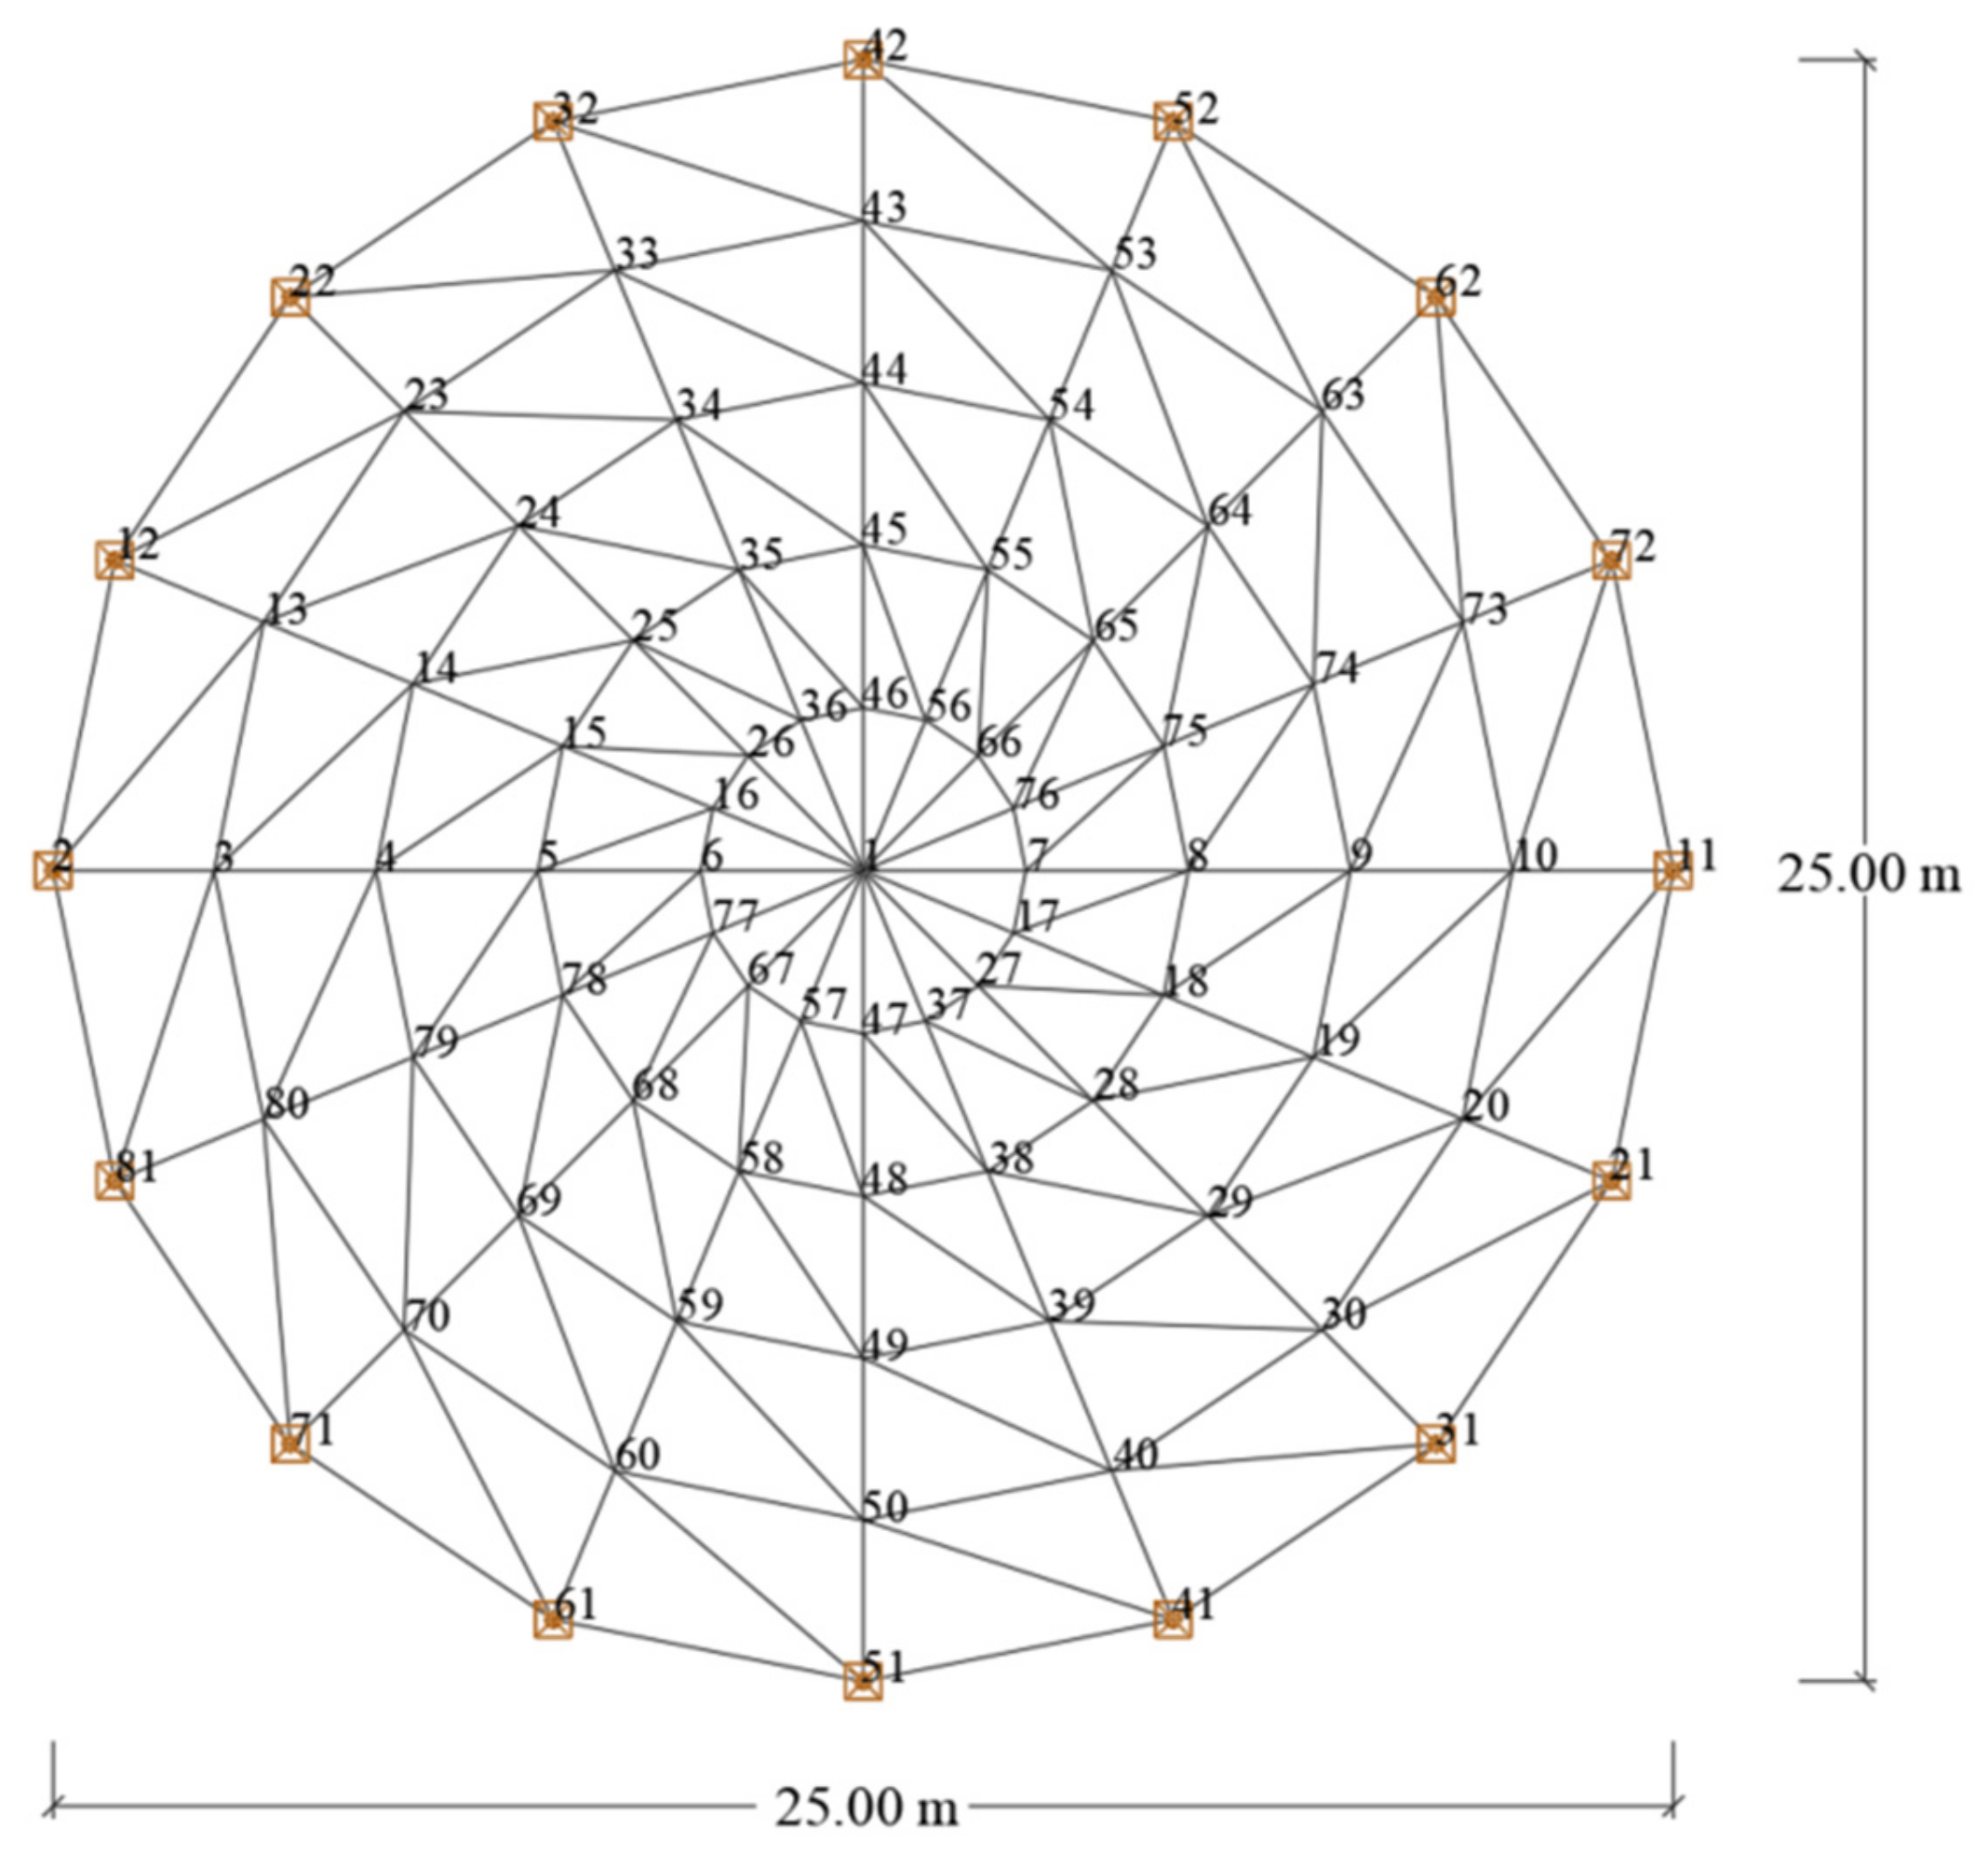
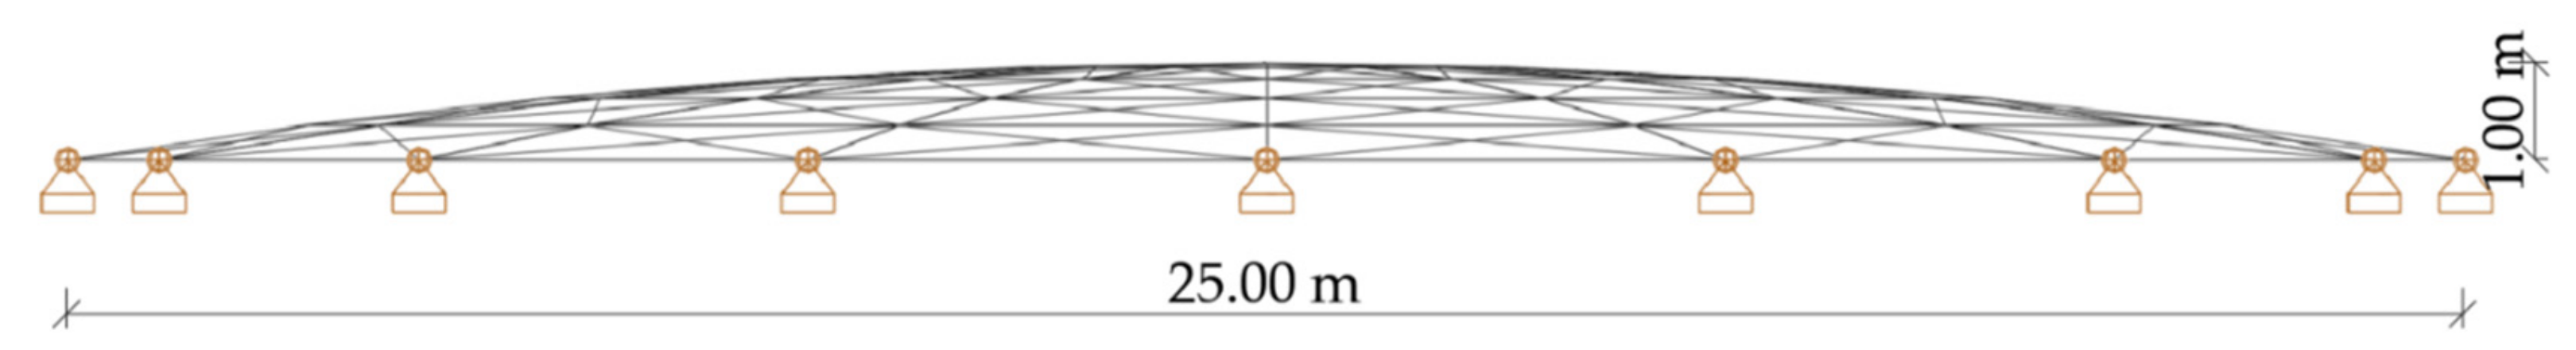
The Schwedler dome [
9] with diameter of 25 m and height of 1 m is situated in the Beskid Niski Mountains (Poland). A reinforced concrete ring supported by 16 reinforced concrete columns, 5 m high, constitutes a rigid support for the dome. The structure can cover the sports and entertainment hall. The dome consists of 81 nodes and 224 bars (
Figure 2 and
Figure 3). Each of the bars was divided into 10 finite elements. The elements of the structure were made of steel tubes with yield stress fy = 355 MPa, Young’s modulus E = 210 GPa, and Poisson’s ratio v = 0.3. In order to dimension the designed structure, three groups of rods were modeled: meridians, parallels, and diagonals. Each meridian has a length of 2.511 m. The lengths of the parallels are, respectively: 4.877 m, 3.908 m, 2.934 m, 1.958 m, and 0.979 m. The roofing consists of tubular steel bars and glass panels. The loads were collected in accordance with applicable standards [N.1–N.3]. The static-strength analysis was performed according to EN-1993-1-1 [N.4] using Autodesk Robot Structure Professional 2022 software for the spatial frame structure, intended to produce the dimensioning of the steel elements. This structure was designed according to geometrically nonlinear analysis. Cross sections of individual groups of members are as follows: parallel (RO 273 × 8), meridian (RO 127 × 8.8), diagonal (RO 82.5 × 6.3).
The mass of the Schwedler dome is 40,953 kg. The mass of the bars of the supporting structures was modeled as evenly distributed, while the mass of the covering and roof equipment was modeled as concentrated in the nodes.
Table 1,
Table 2,
Table 3 and
Table 4 summarize the results of analyzes for the Schwedler dome.
Table 1 shows the critical load multipliers for linear buckling analysis and non-linear buckling analysis.
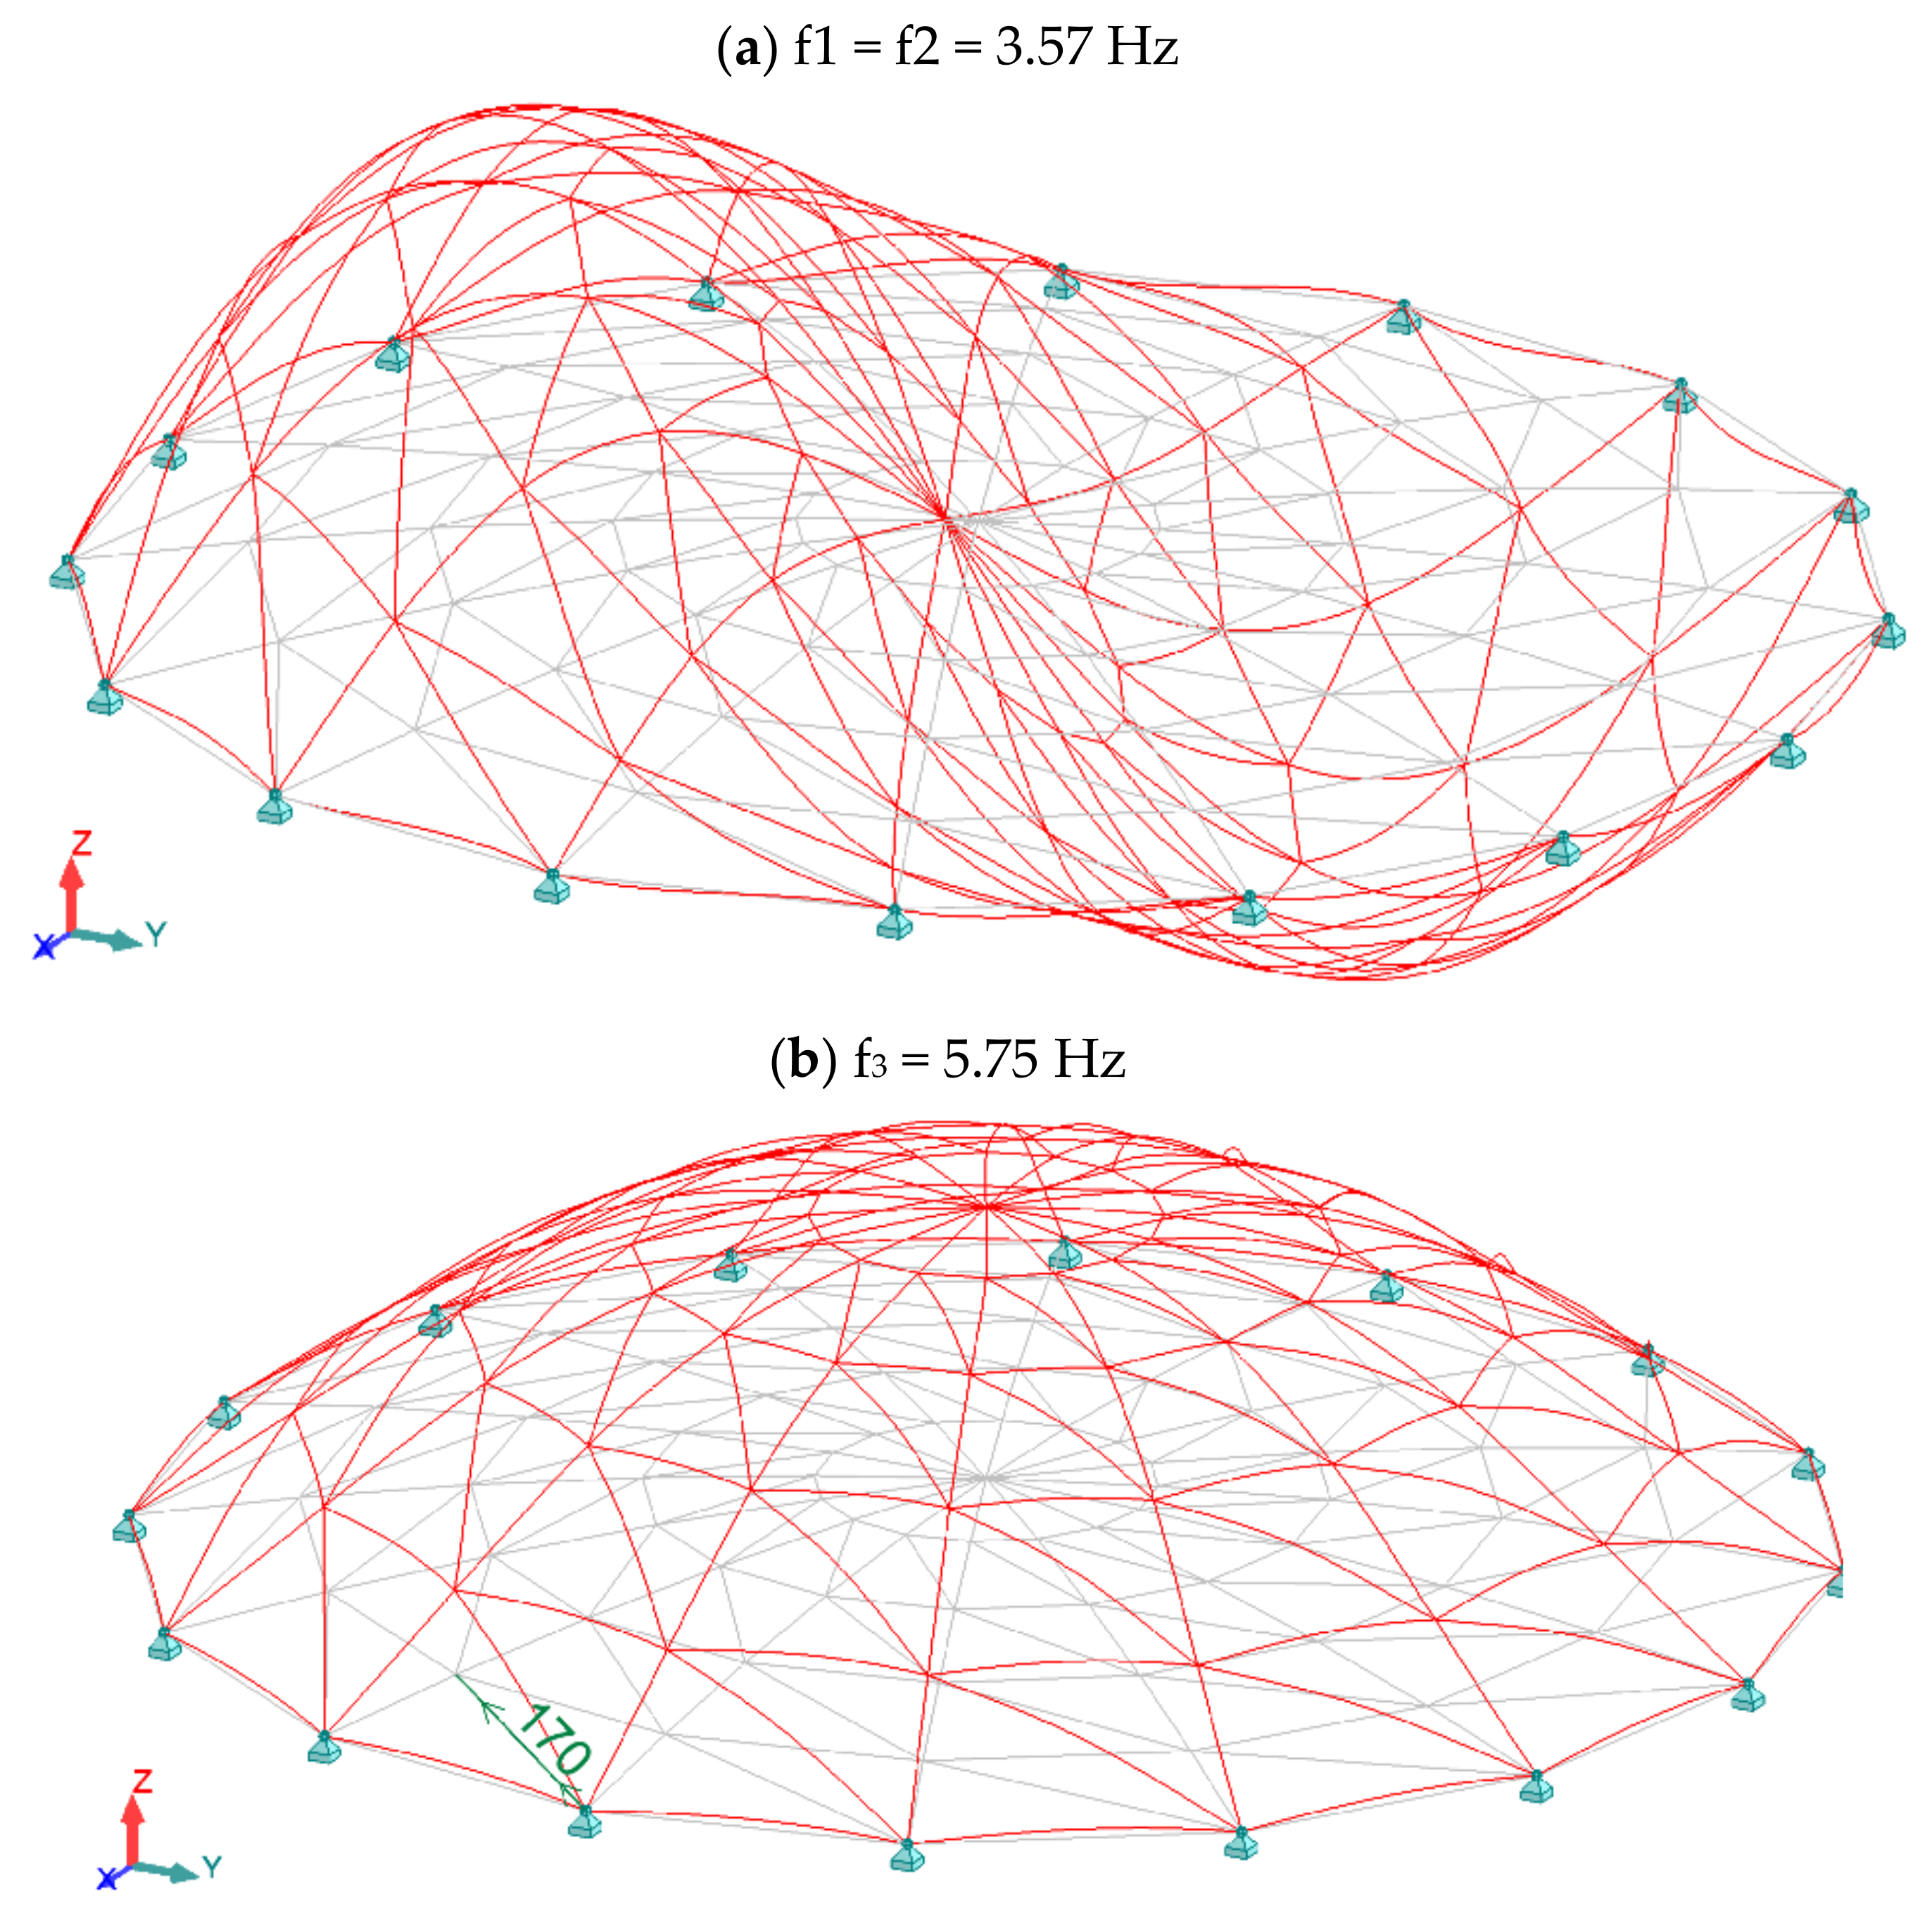
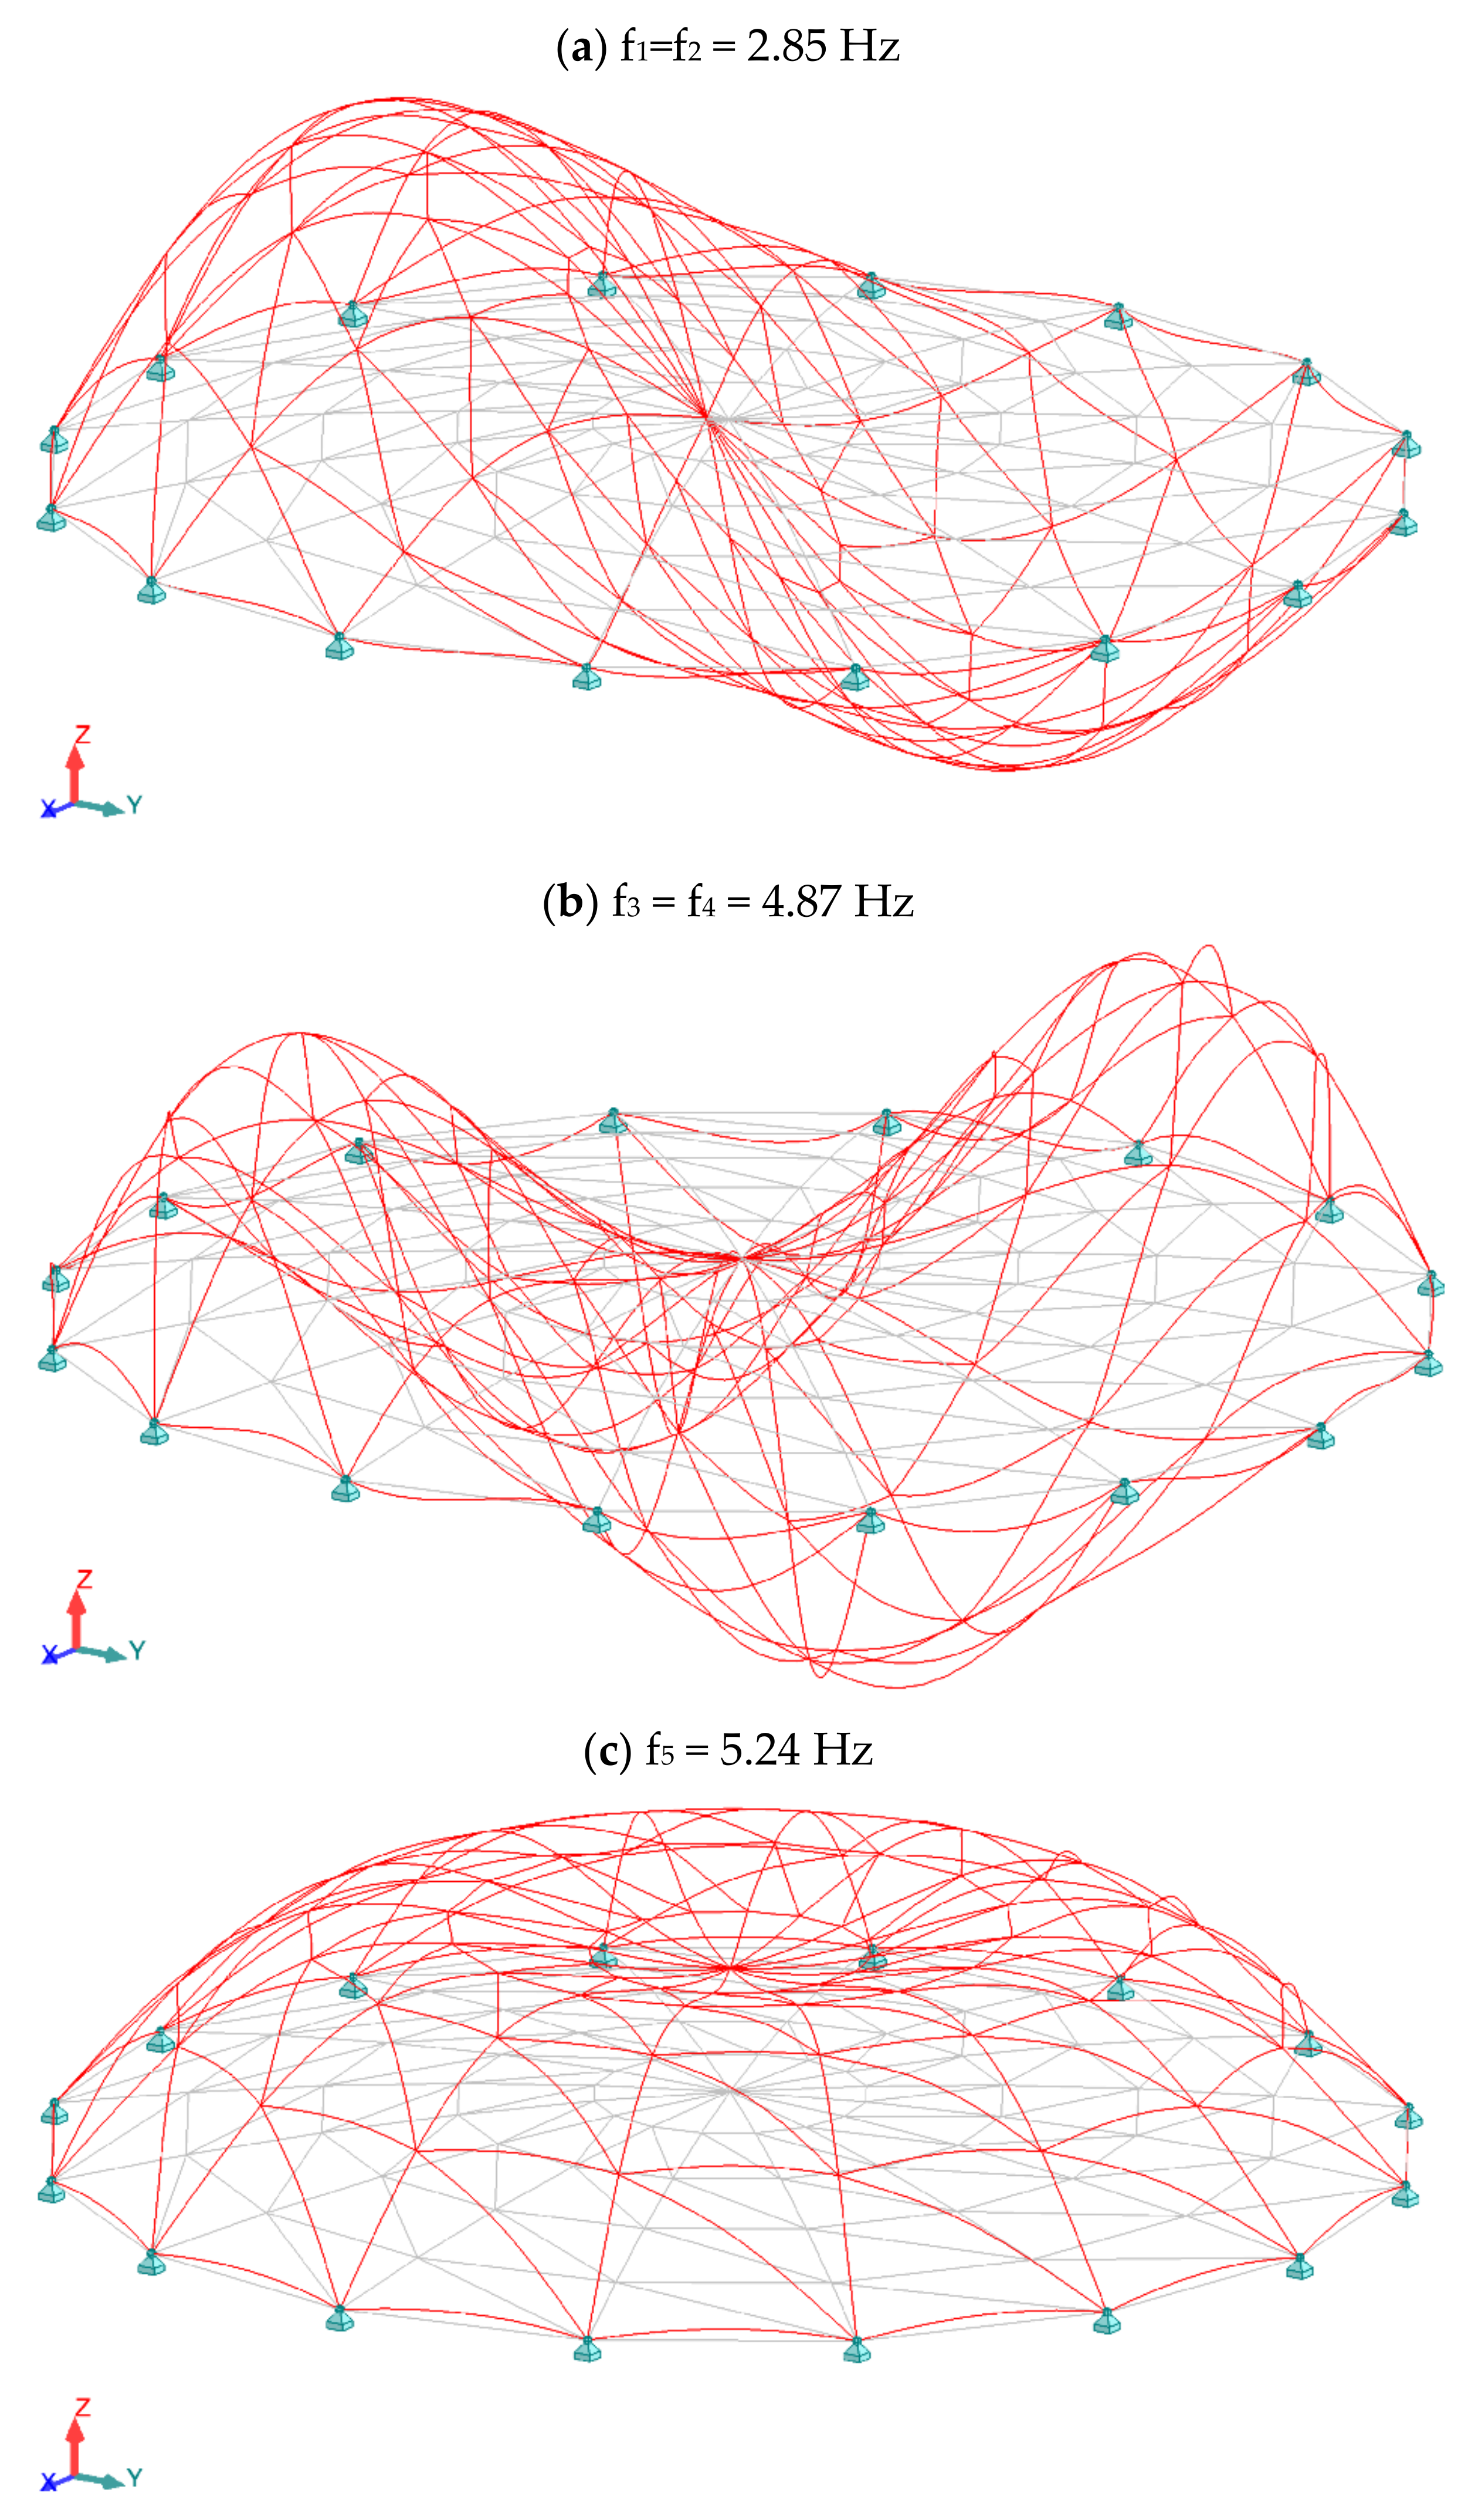
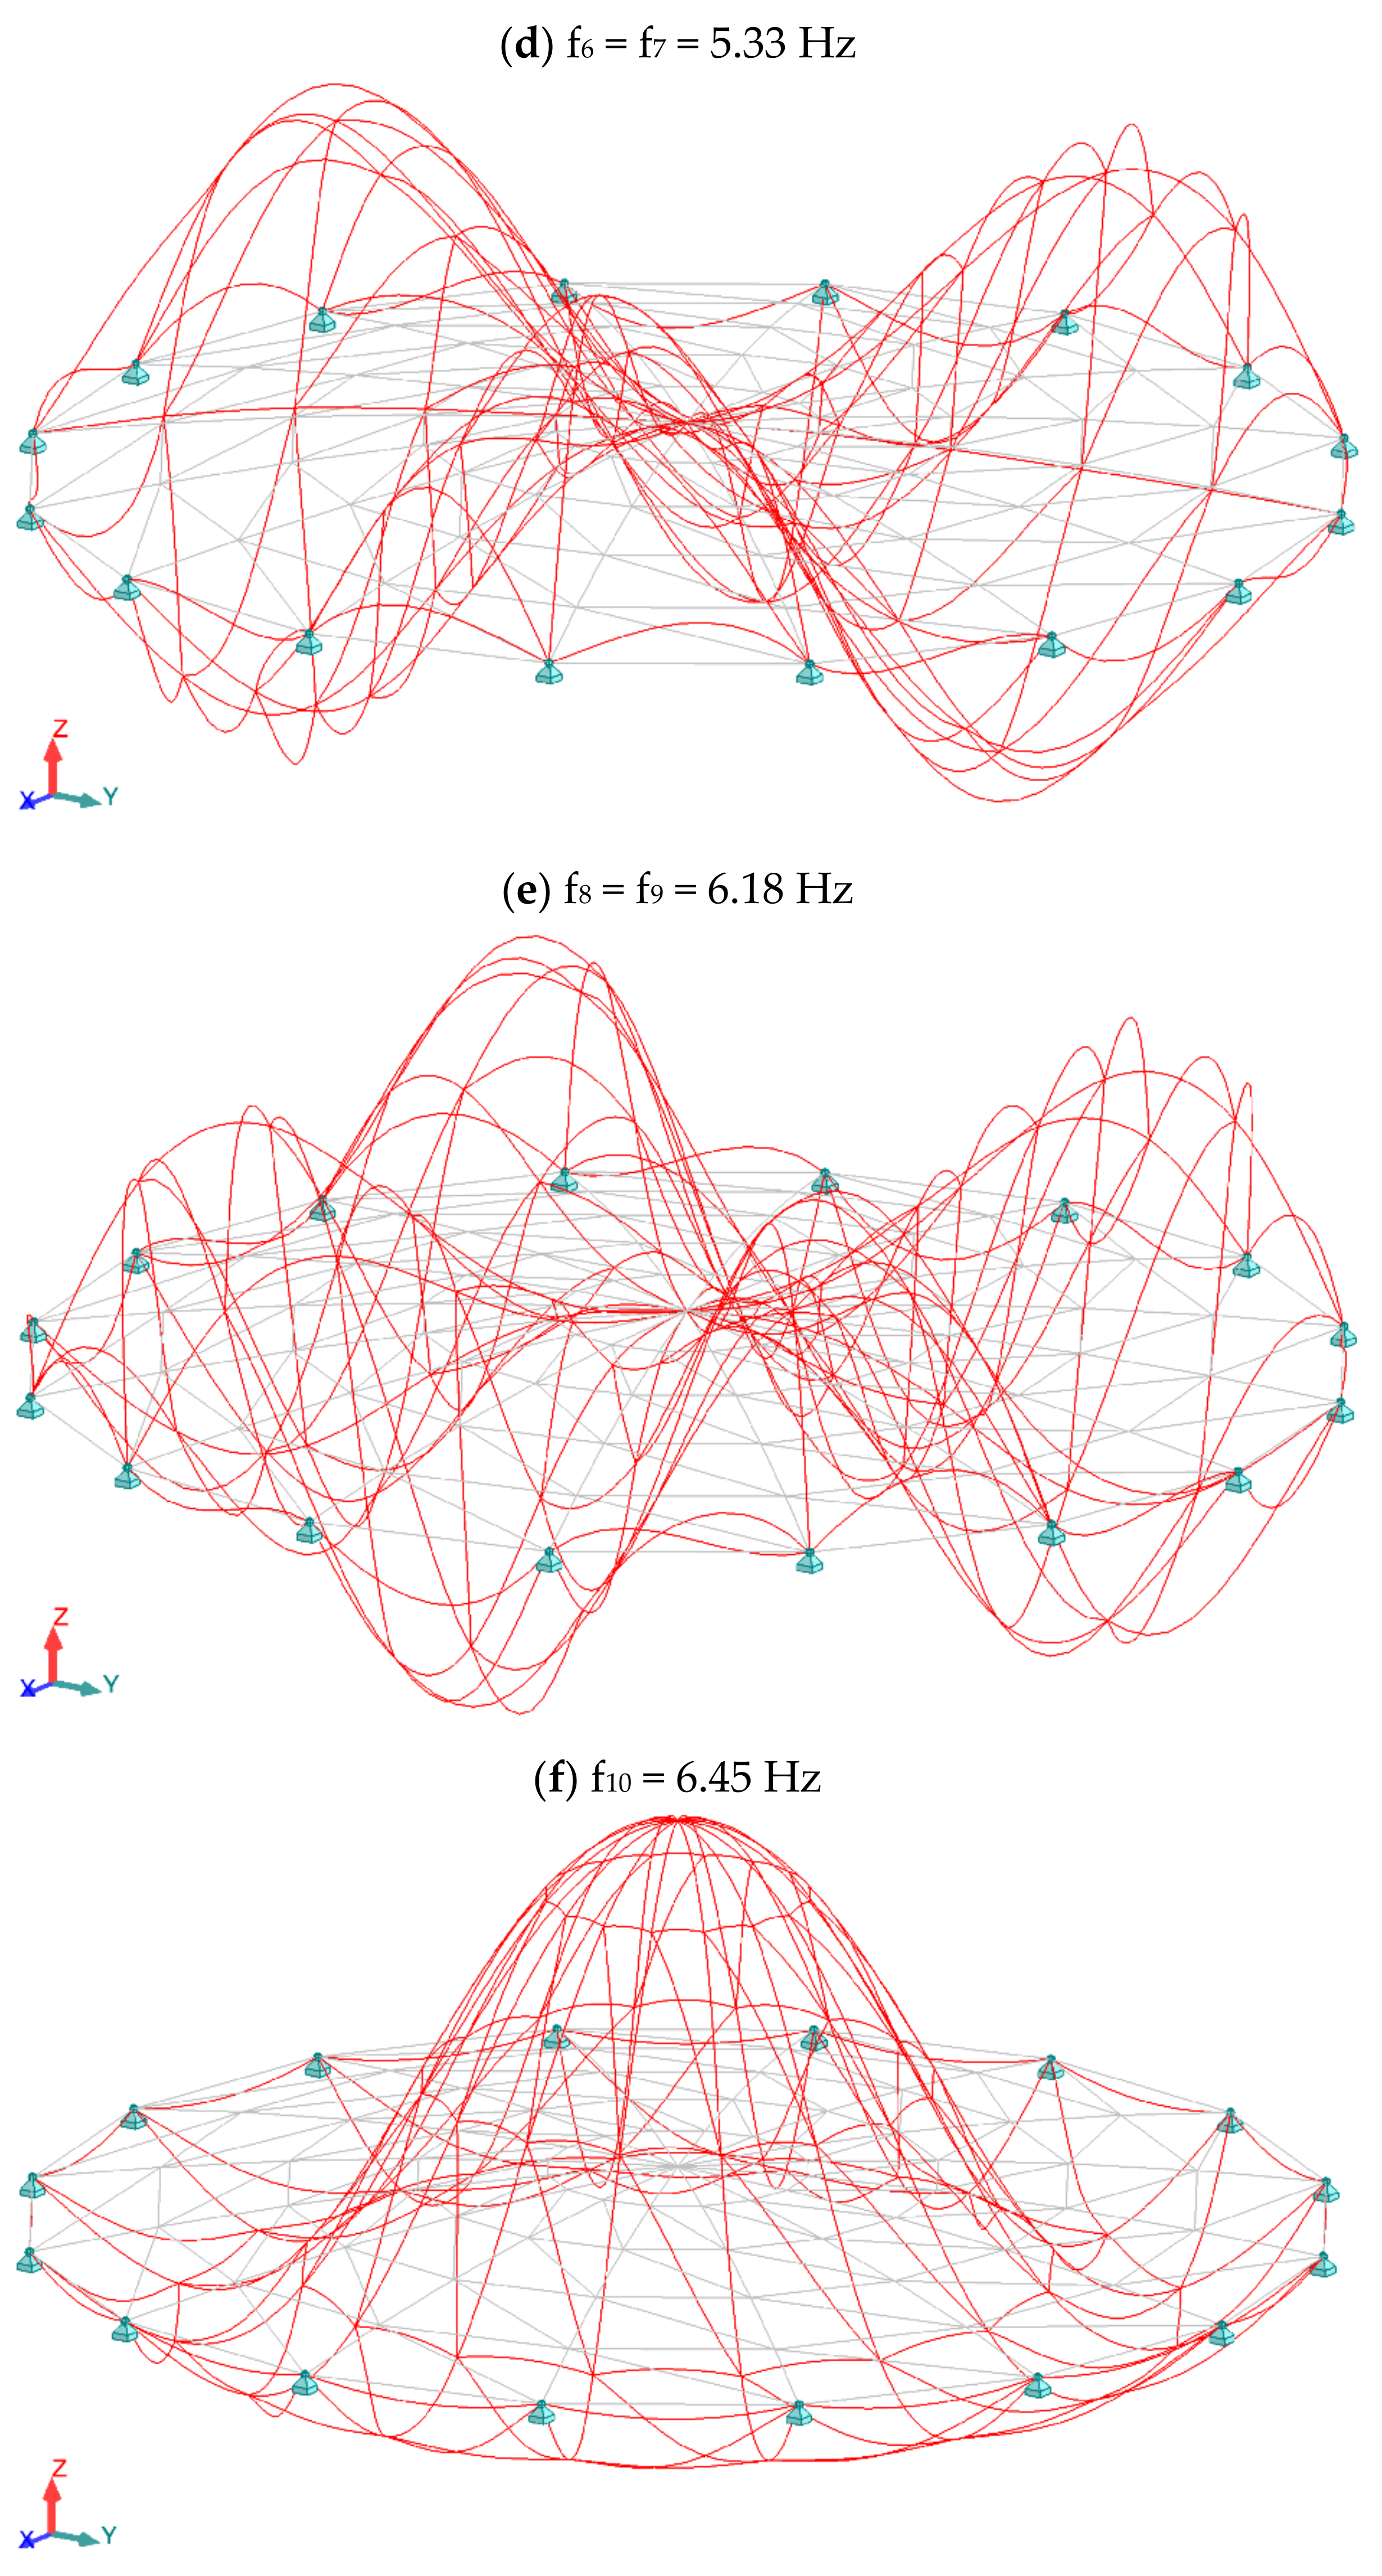
Table 2 lists the vibration frequencies of the Schwedler dome in the case of standard modal analysis and modal analysis with normal forces taken into account. A graphical summary of selected eigenvectors of the standard modal analysis of the Schwedler dome is shown in
Figure 4.
Table 3 and
Table 4 show the current masses and effective masses for the first 10 forms, respectively.
Table 5 and
Table 6 show the actual masses and effective masses for the first 10 forms of modal analysis, taking into account normal forces, respectively.
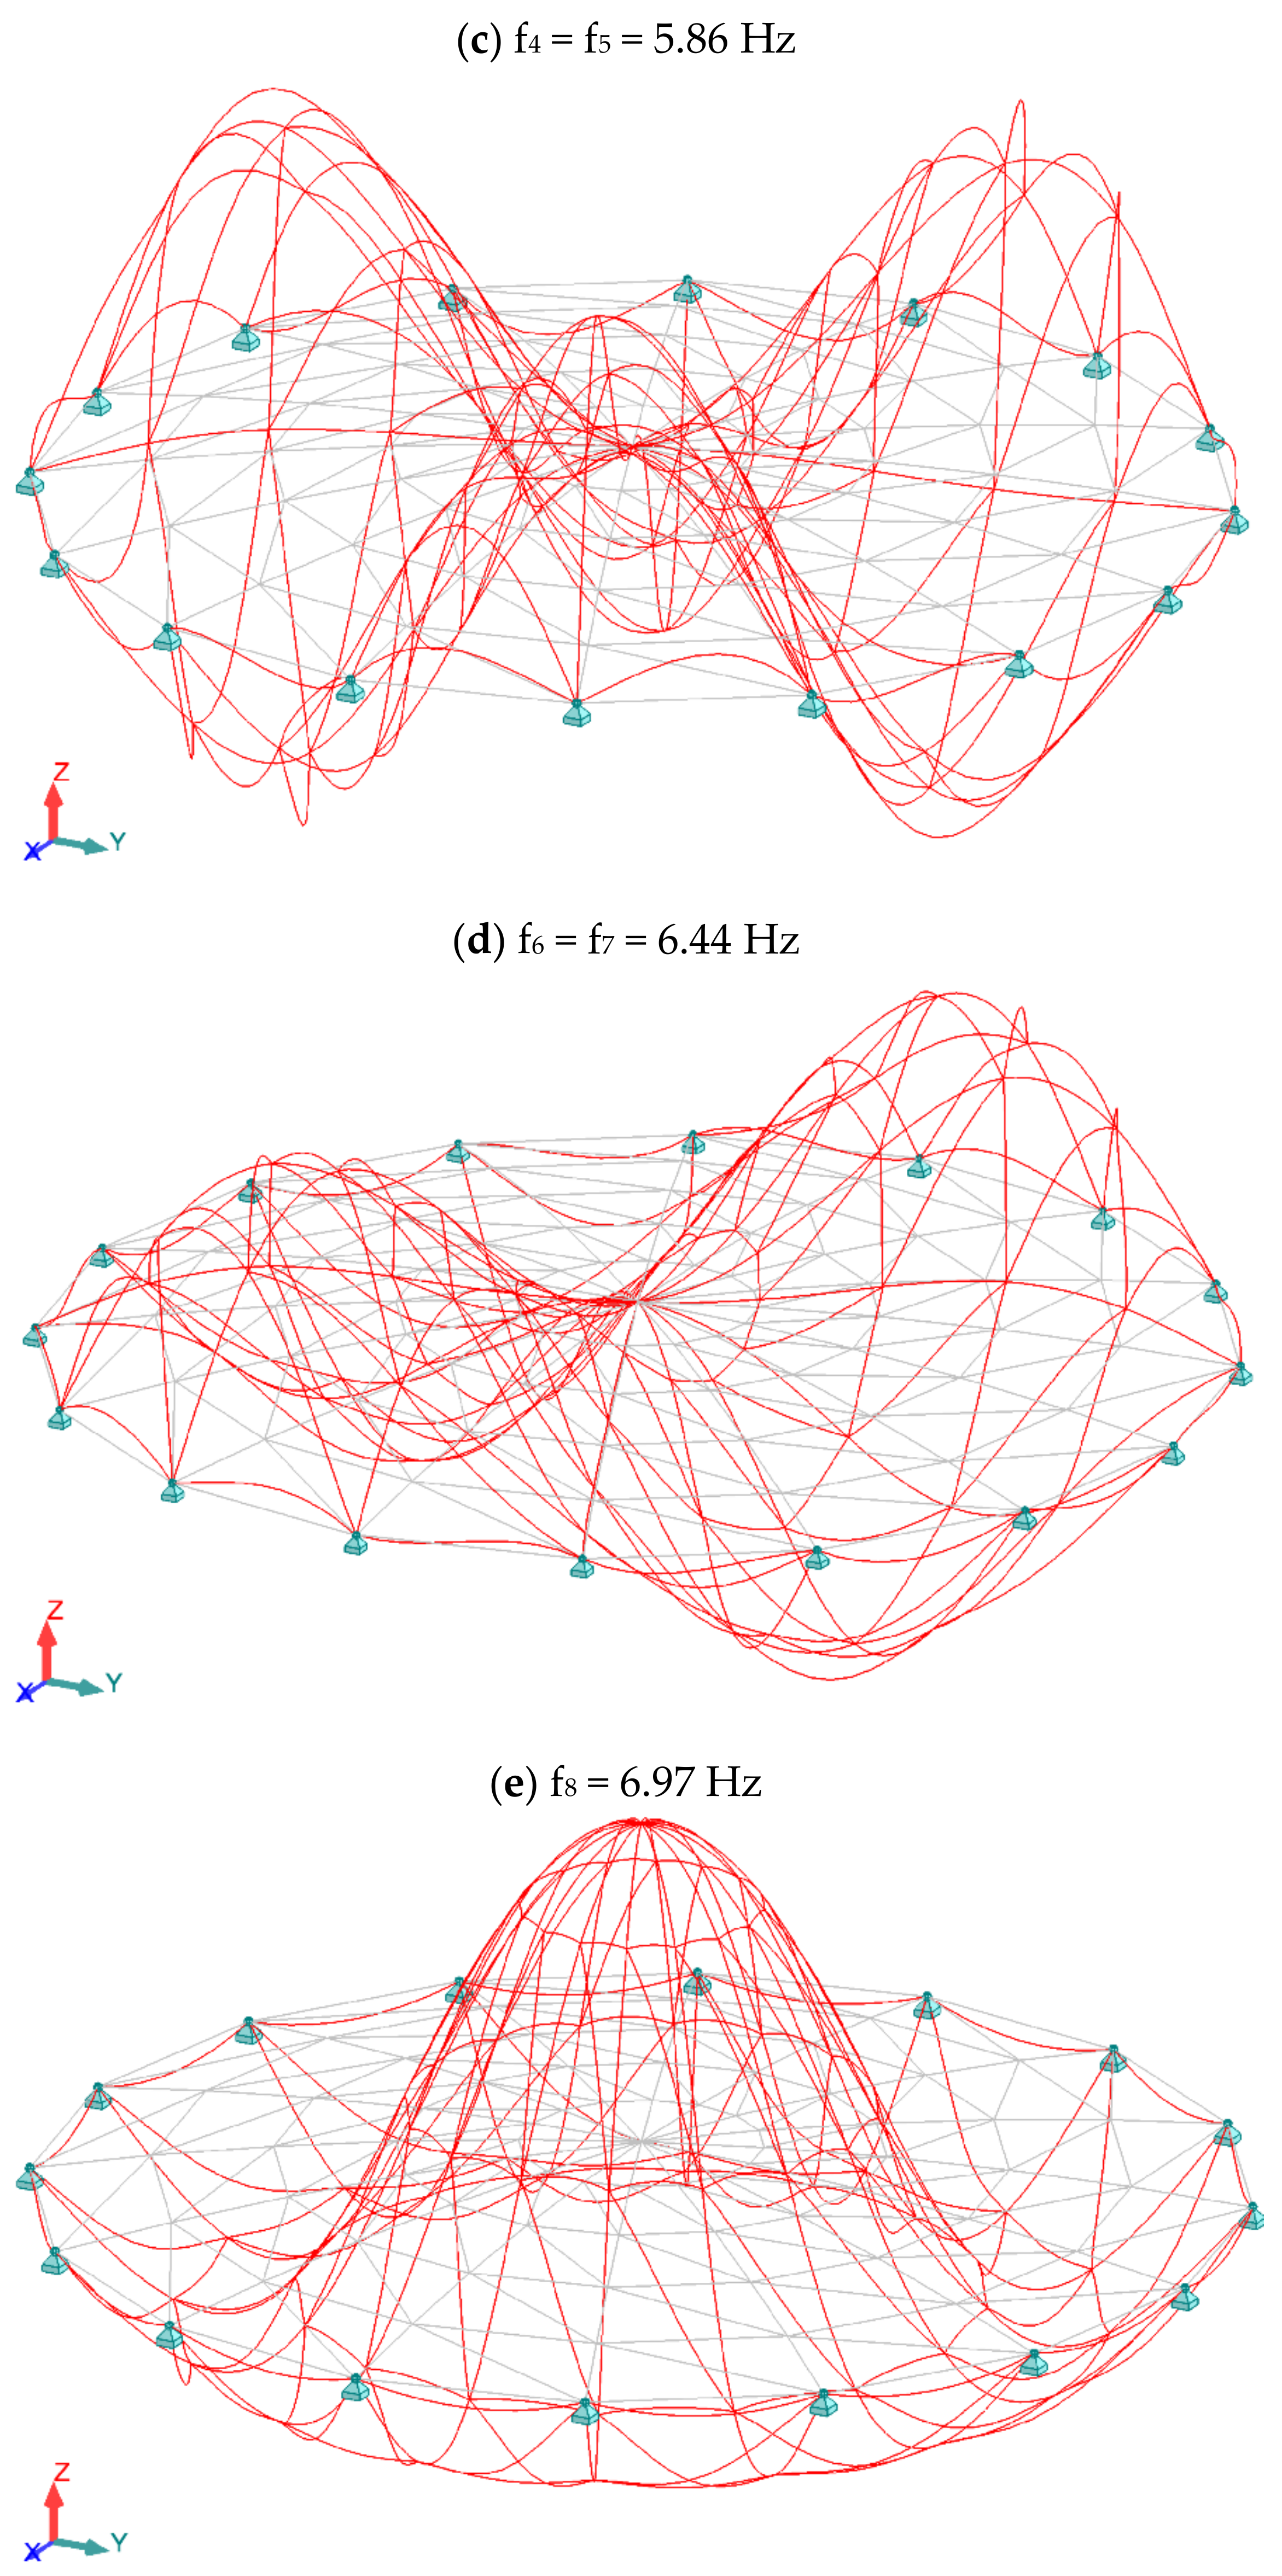
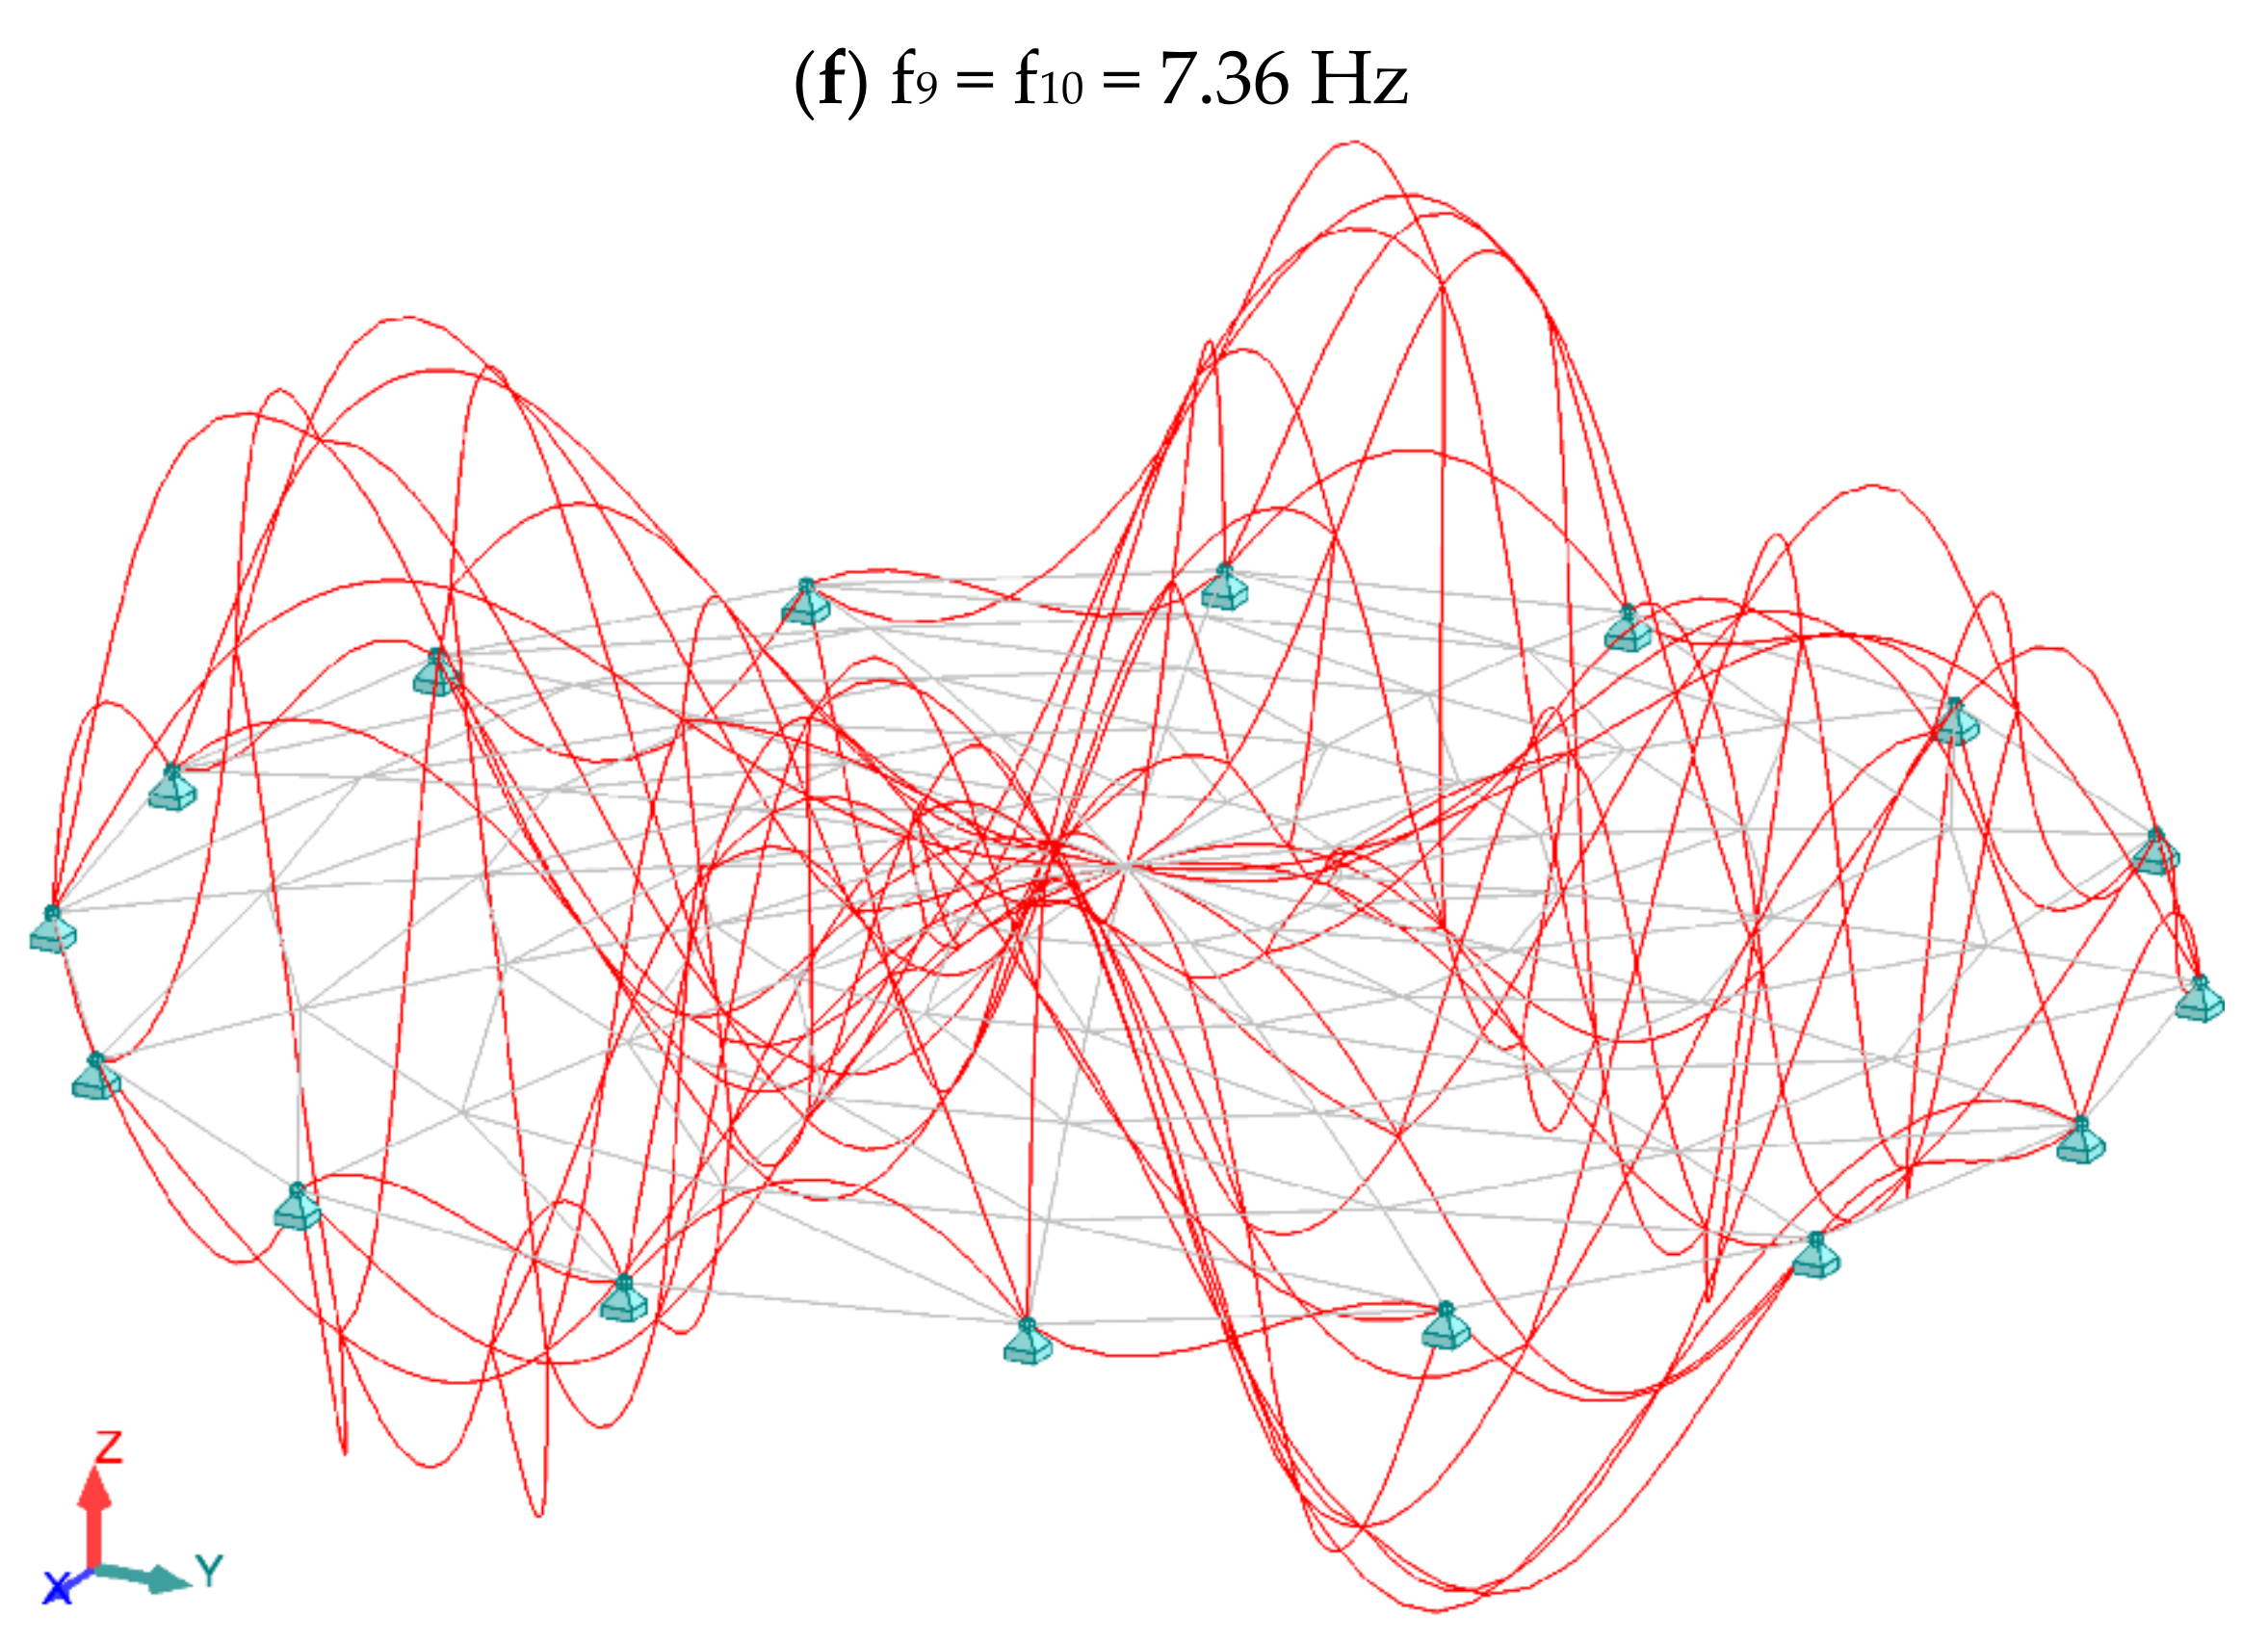
Figure 5 shows a graphical summary of the eigenvectors in the case of modal analysis with normal forces taken into account.
3.2. Geodesic Dome
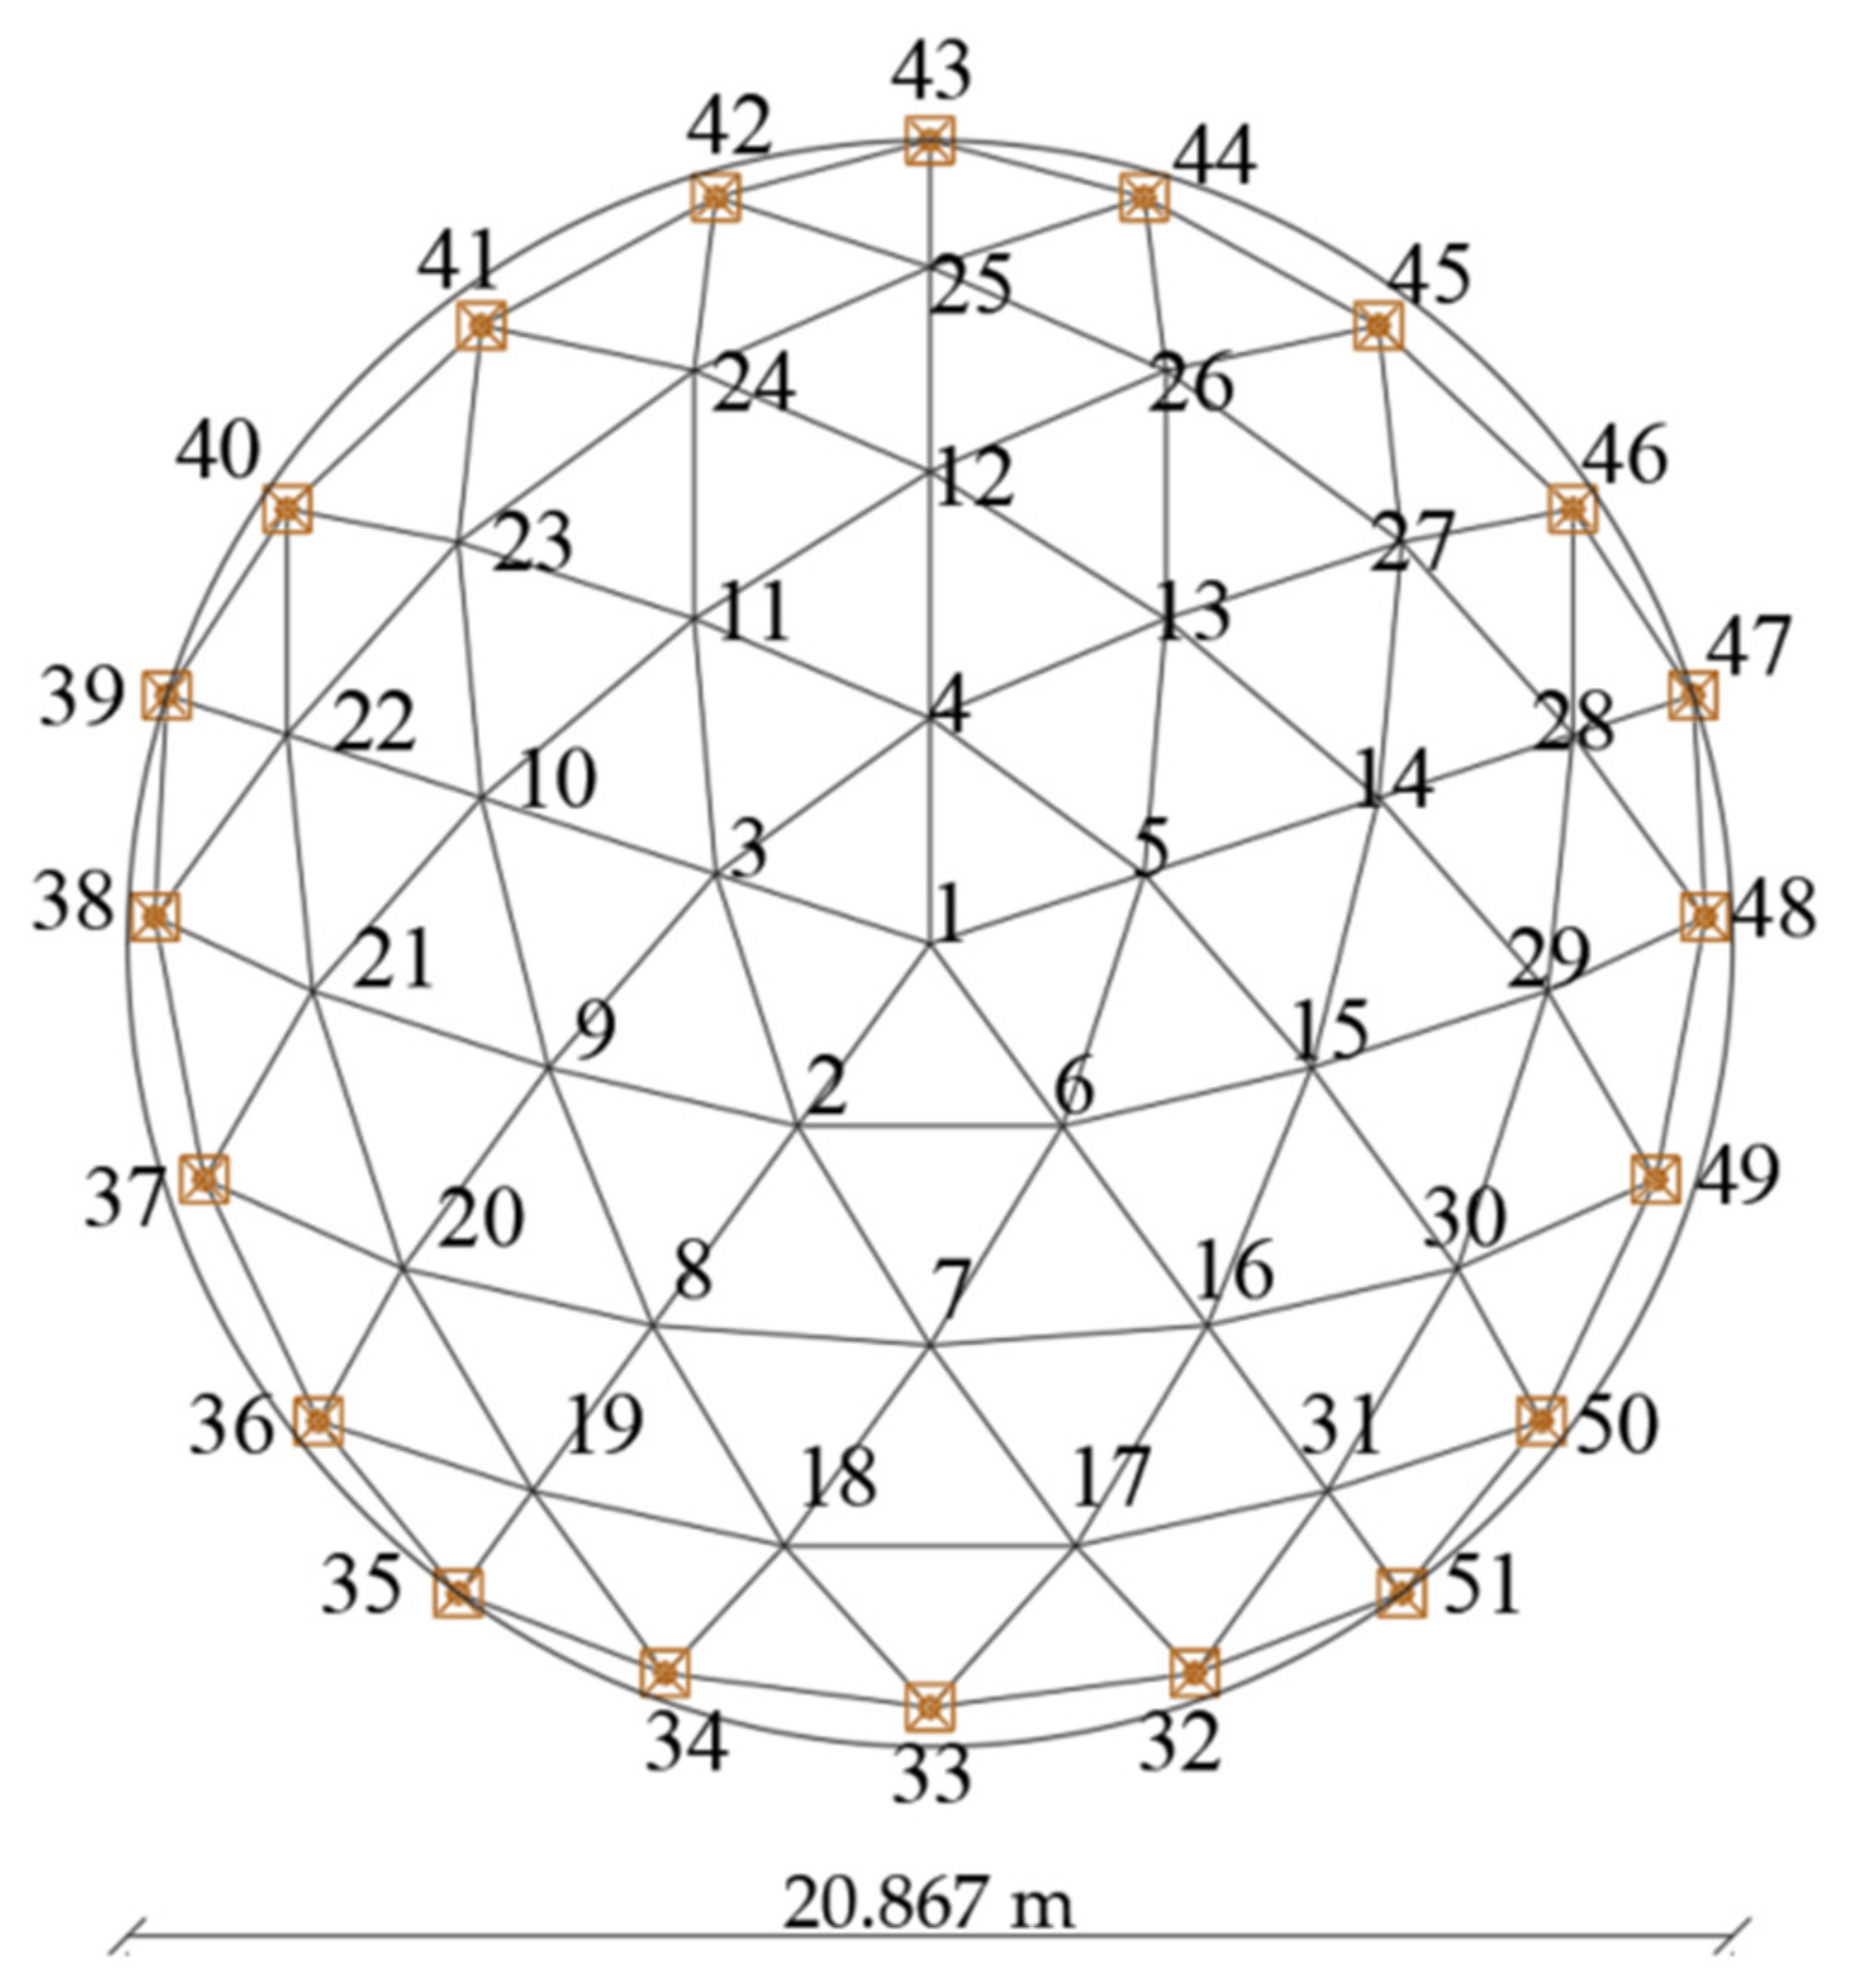
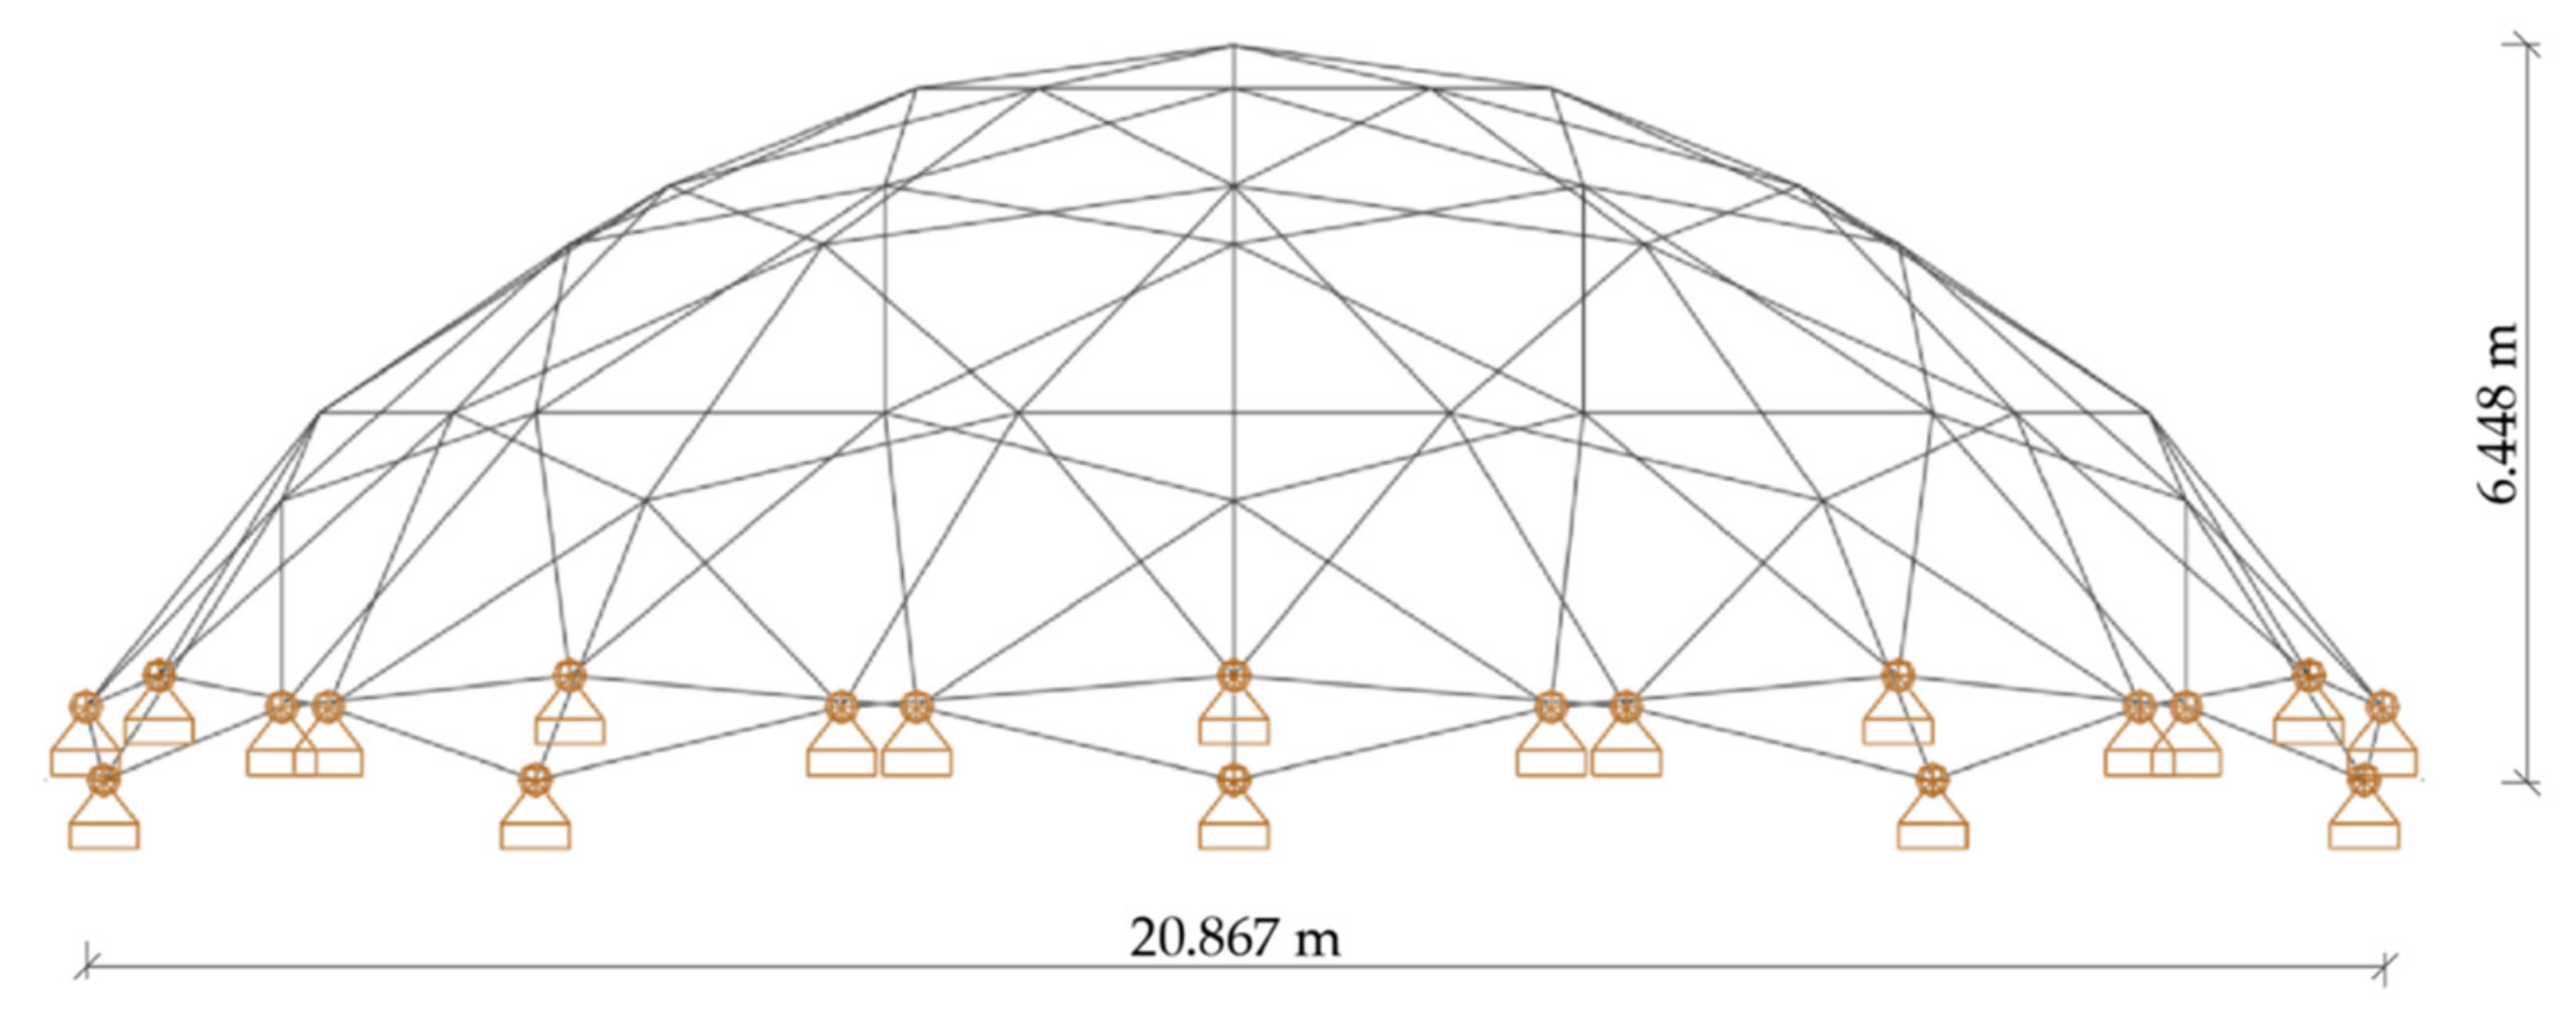
The geodesic dome [
33] with the span equal to 21 m and rise equal to 6.5 m lies in the Beskid Niski Mountains in Poland. The dome is based on 20 reinforced concrete columns, 5 m high. The whole covering is closed with a reinforced concrete ring forming a rigid structure, which simulates boundary conditions. The structure can cover the sports and entertainment hall. The dome consists of 51 nodes and 130 bars (
Figure 6 and
Figure 7). Each of the dome bars was divided into 5 finite elements. The elements of the structure were assumed to be made of steel tubes with yield point fy = 235 MPa, Young’s modulus E = 210 GPa, and Poisson’s ratio v = 0.3. The loads were collected in accordance with applicable standards [N.1–N.3]. The static-strength analysis, intended to produce the dimensioning of the steel elements, was performed acc. To EN-1993-1-1 [N.4] using Autodesk Robot Structure Professional 2022 software for spatial frame structure. This structure was designed according to linear analysis. The bars of the structure were made with RO 101.6 × 8. The mass of the geodesic dome is 25,350.7 kg.
Table 7,
Table 8,
Table 9 and
Table 10 summarize the results of the geodesic dome analyses.
Table 7 lists the critical load multipliers for the linear buckling analysis and the non-linear buckling analysis.
Table 8 shows a comparison of the geodesic dome vibration frequency for standard modal analysis and modal analysis with normal forces considered. The current and effective masses for both considered cases are compared in
Table 9 and
Table 10, respectively.
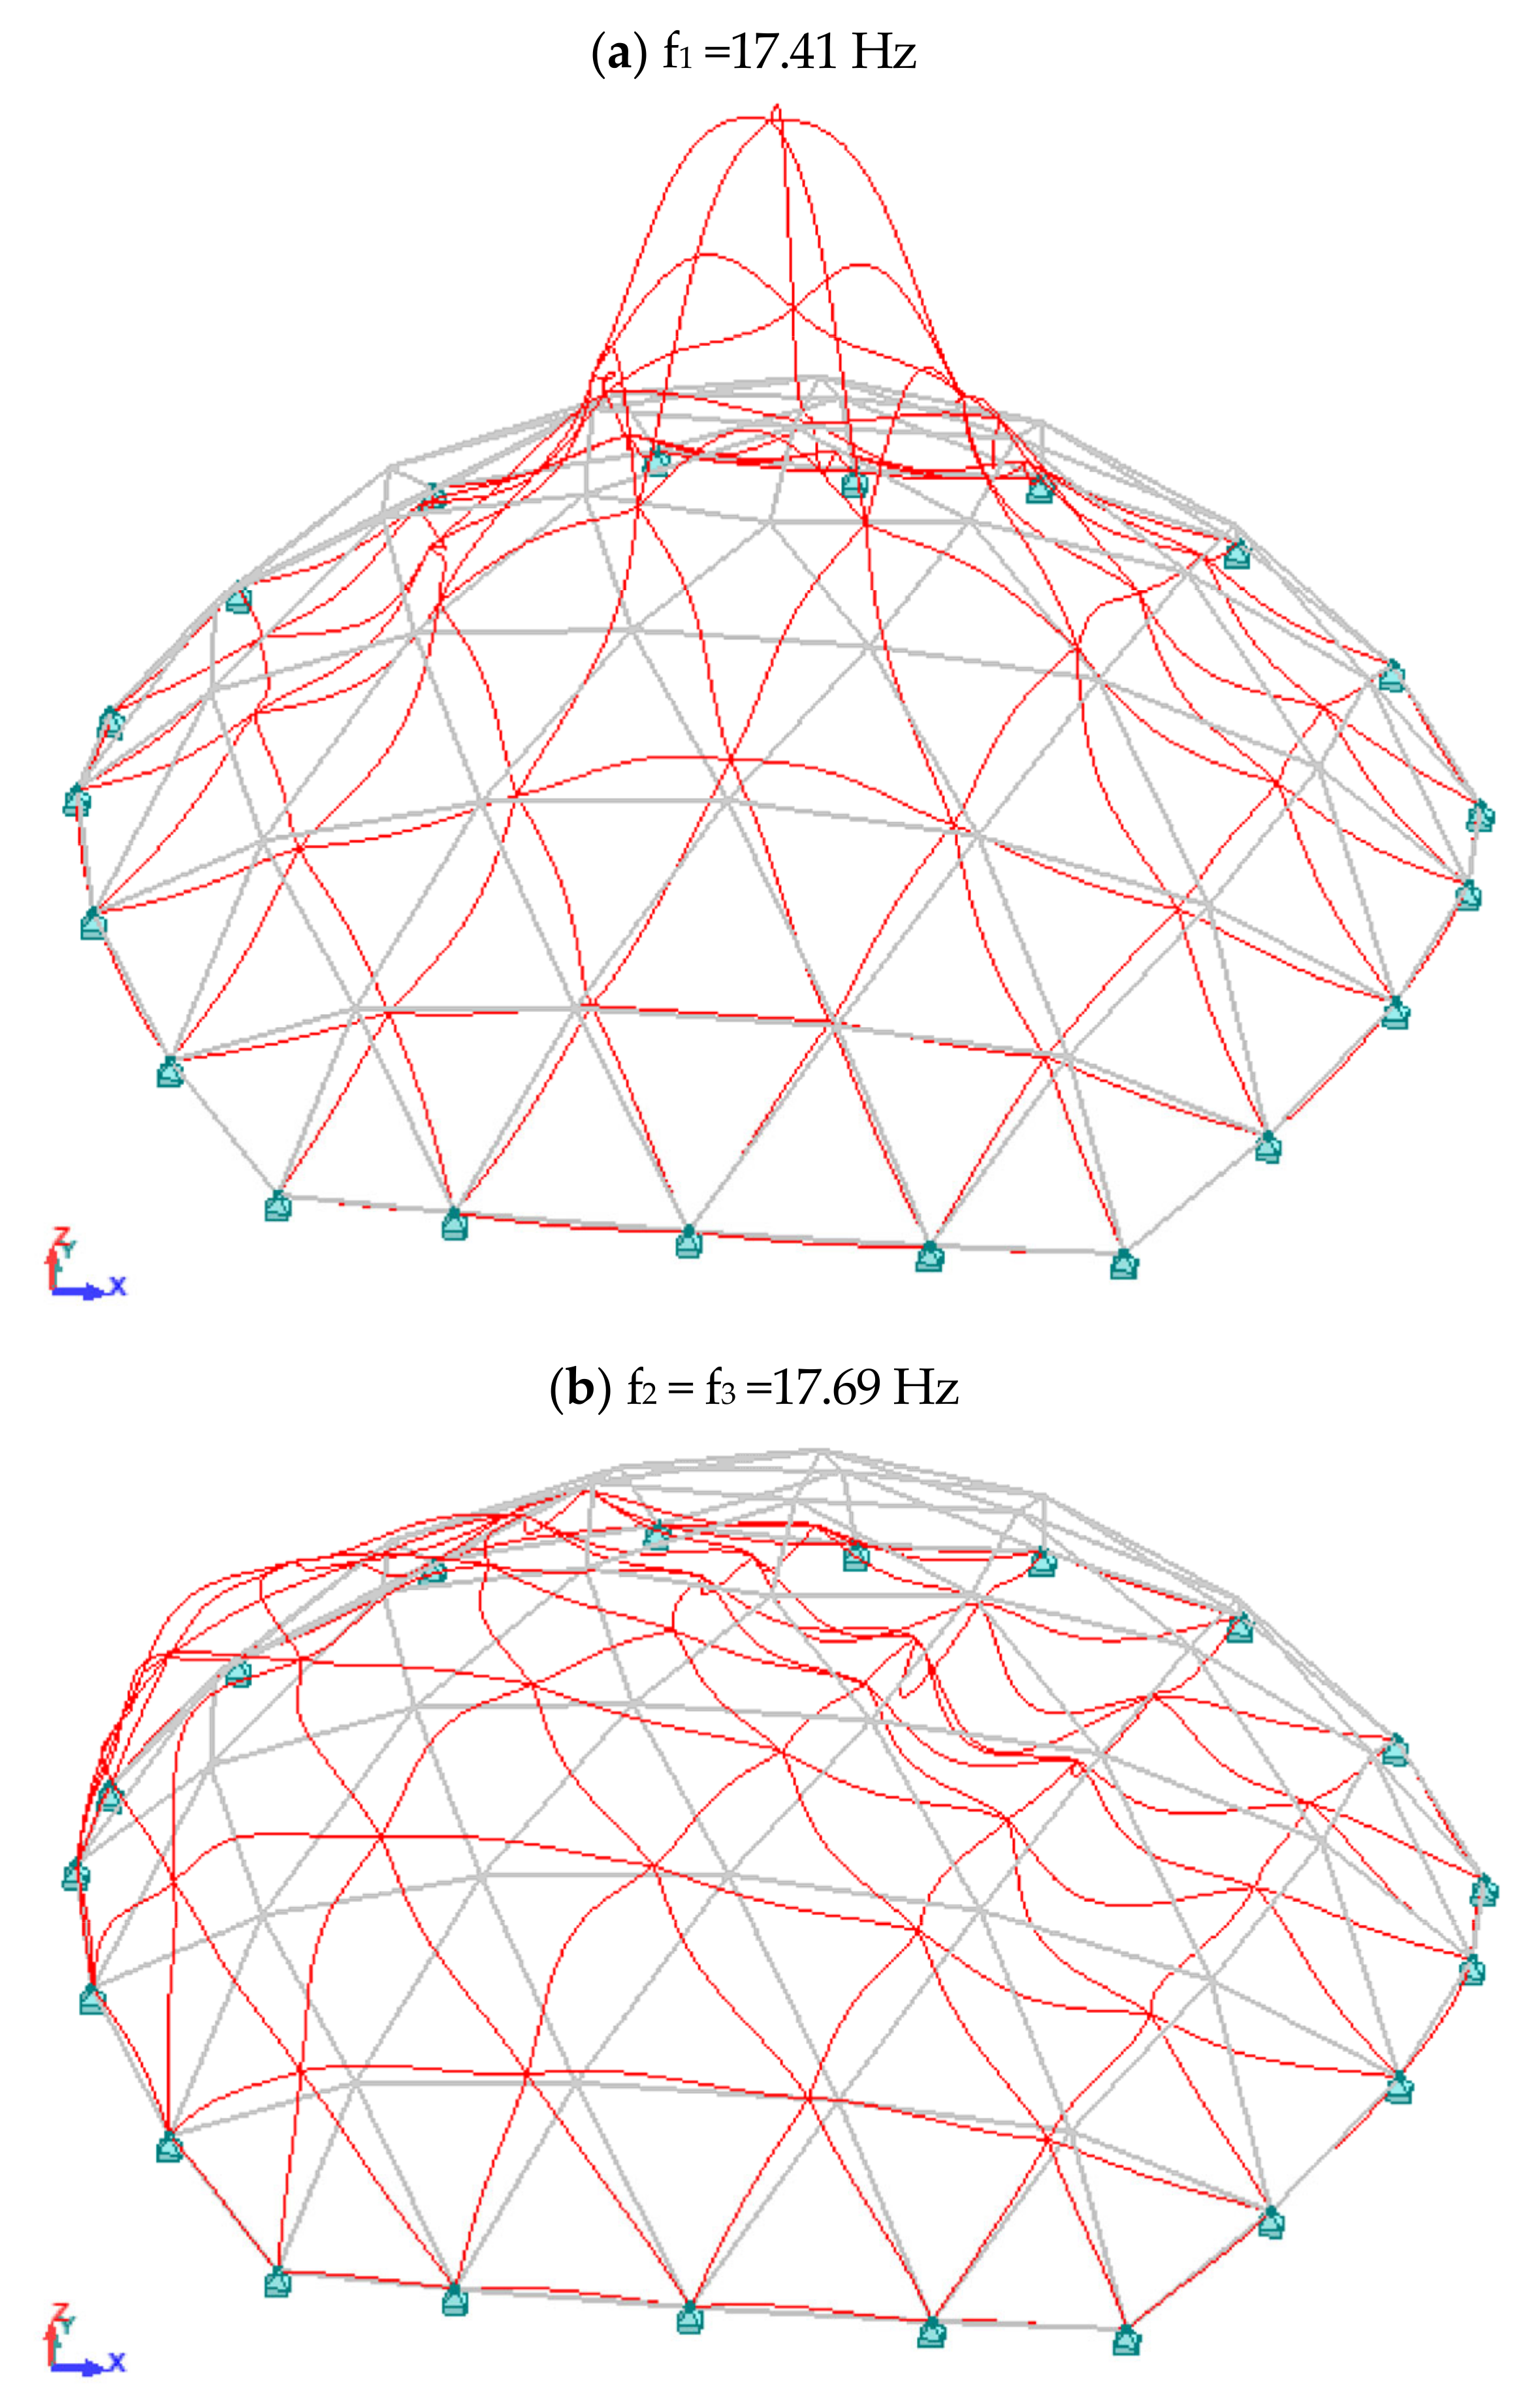
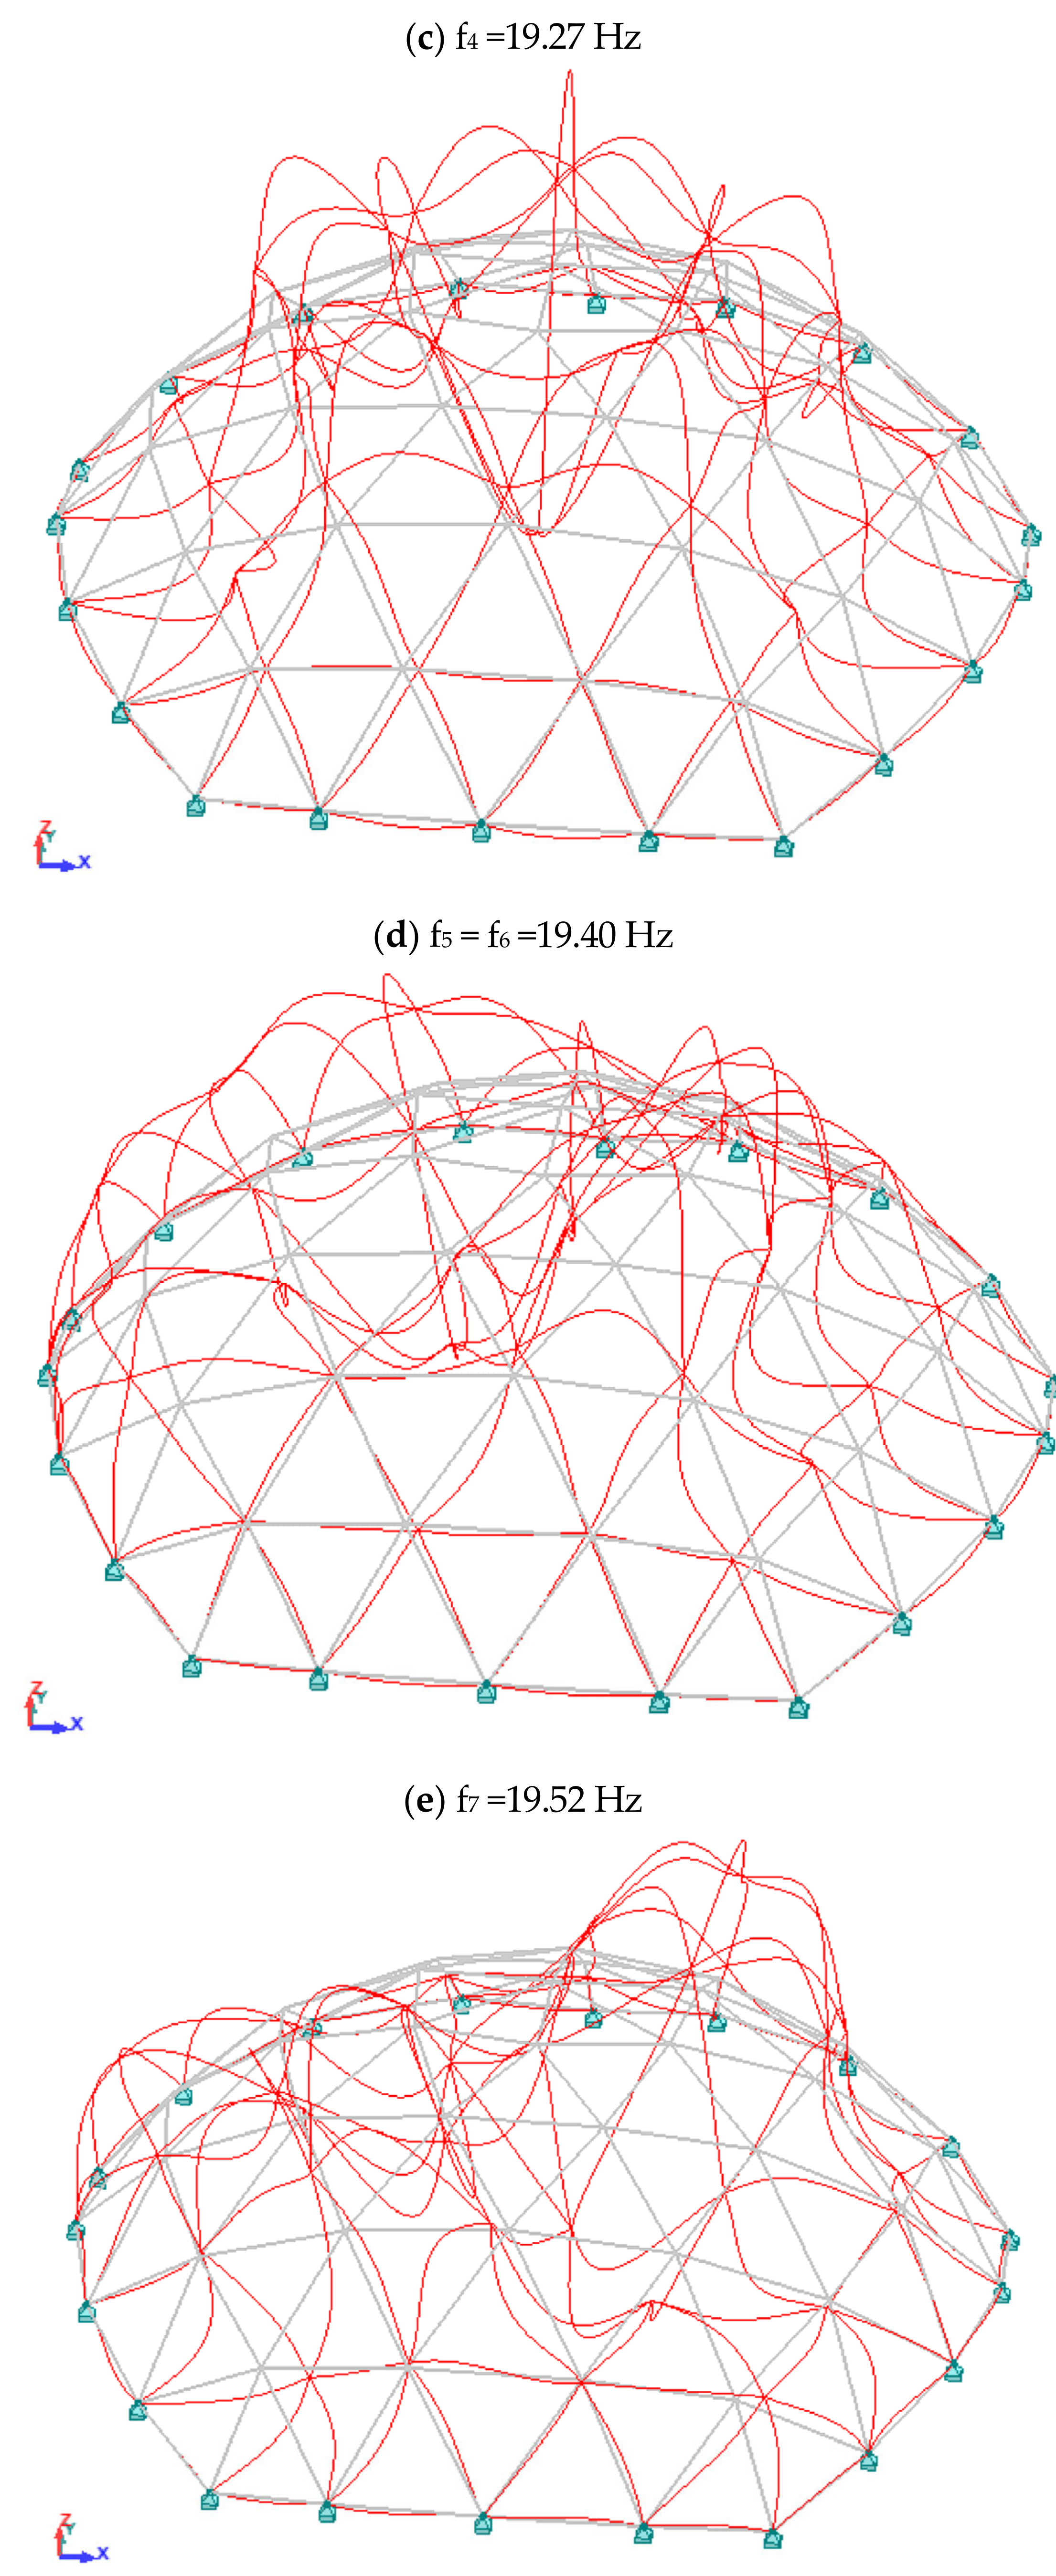
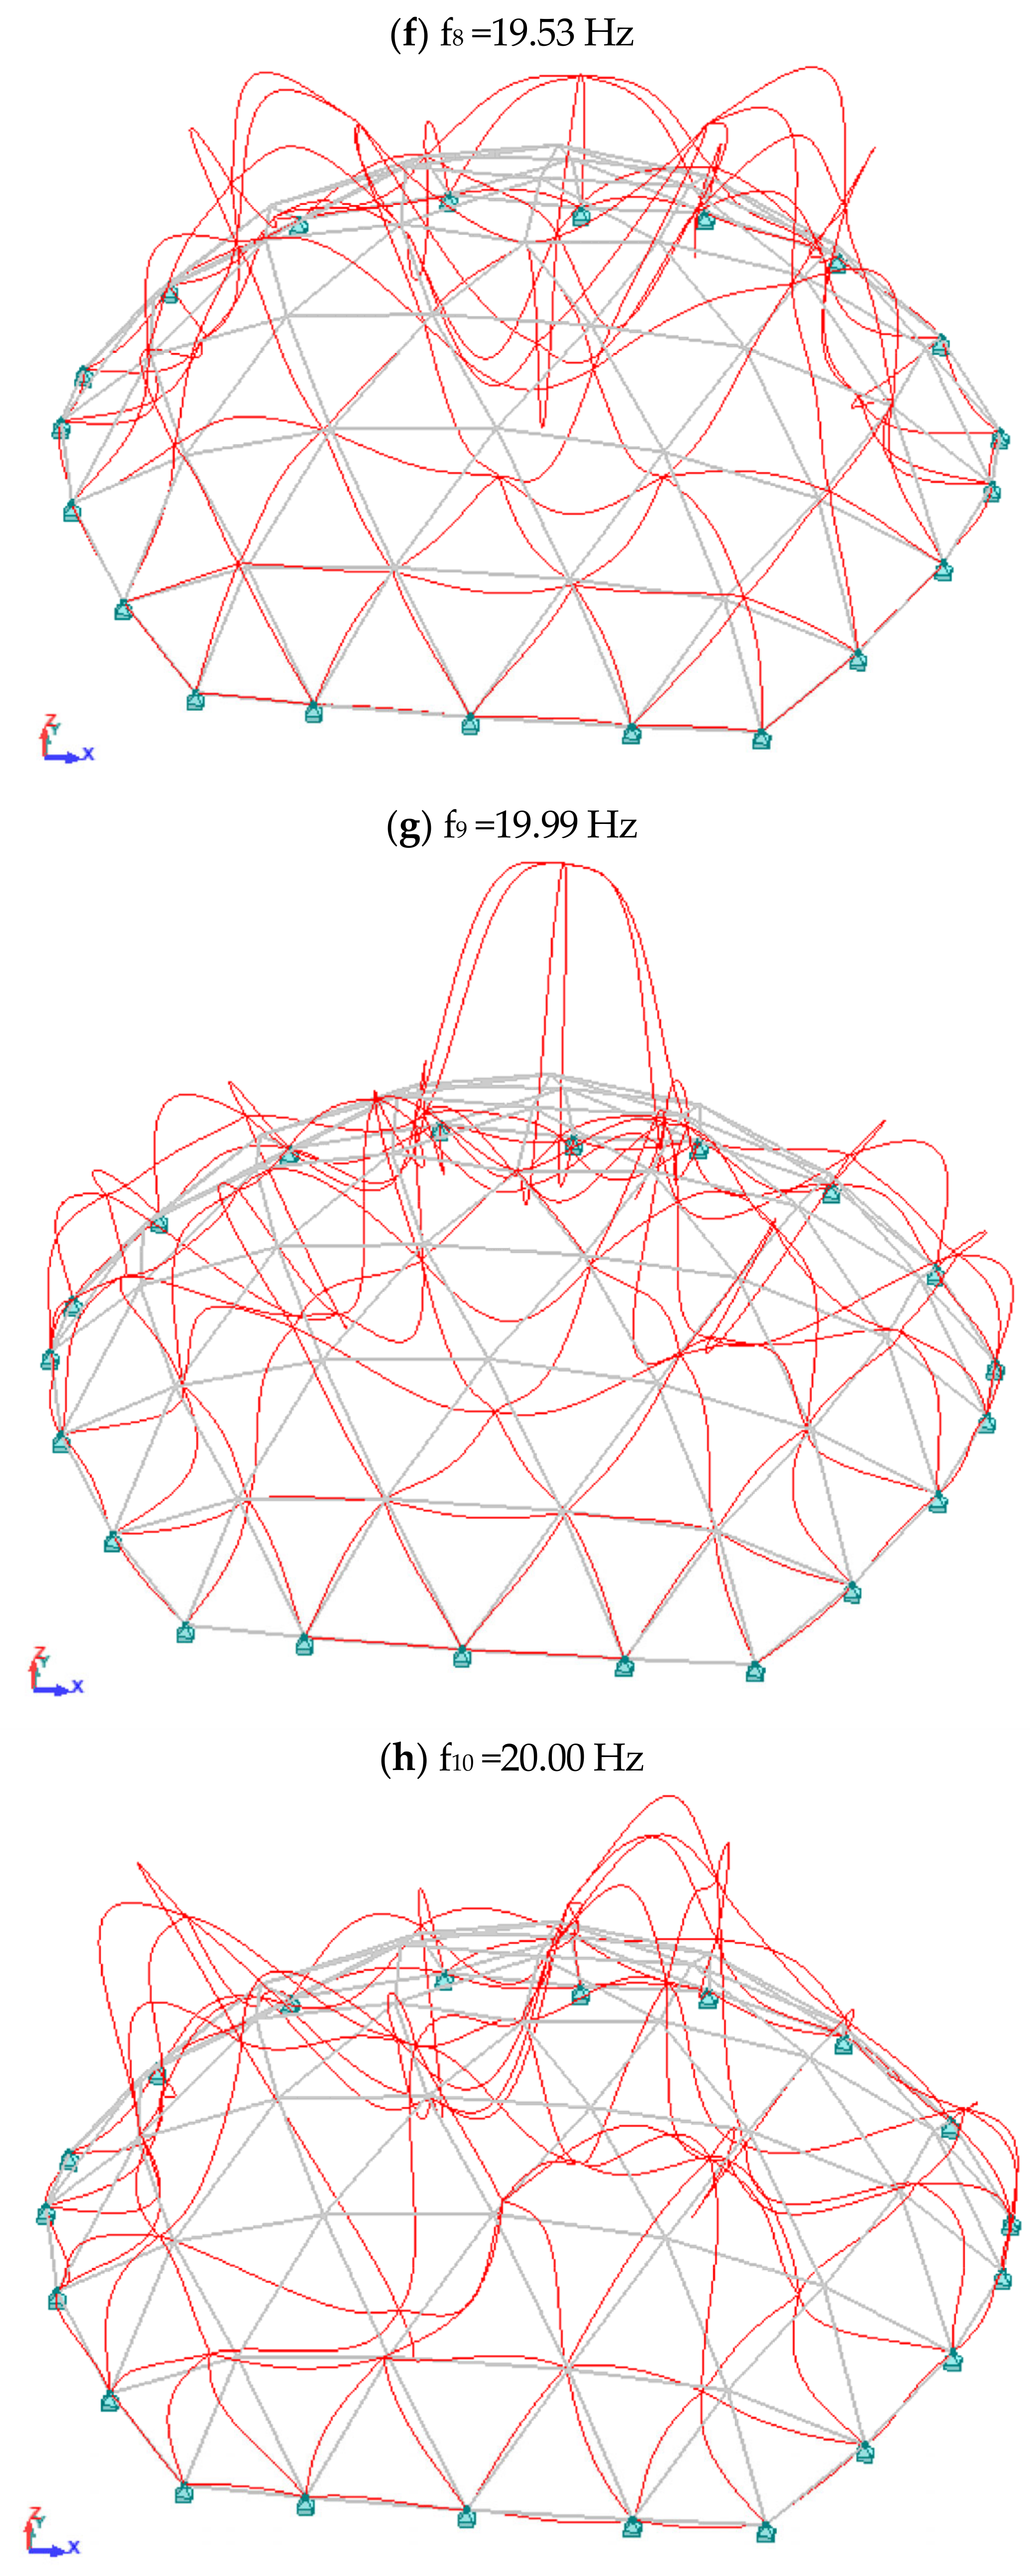
Figure 8 shows a graphical summary of the eigenvectors in the case of a standard modal analysis.
4. Discussion
The natural frequencies of each structure depend on its stiffness and mass. Assume that the masses of the two structures are the same. In this case, the natural frequency of vibrations is determined by the stiffness of the structure, which in FEM is represented by the stiffness matrix. If, for some reason, the stiffness of the structure decreases, the natural frequency values decrease.
After this short introduction, let us return to the two domes analyzed in the paper. The first is the geodesic dome. The mass of the dome is 25,350.7 kg. The critical load multiplier in both linear and nonlinear buckling analysis is quite high, 12.42 and 11.45, respectively. The relative error is (12.42 − 11.45)/11.45 = 0.08 = 8%. Such values of the critical load multiplier, in accordance with the standard guidelines, entitle us to design structures in accordance with the first order theory. In the case of standard modal analysis, the first eigenvalue is 17.41 Hz, and after taking into account normal forces, it is 17.35 Hz. The relative error is (17.41 Hz − 17.35 Hz)/17.35 Hz = 0.0035 = 0.35%. The influence of normal forces on the obtained values of structure characteristics in the analysis of stability and dynamics is negligibly small. We did not observe a significant change in the stiffness of the structure after taking into account the normal forces. The presented design situation applies to most building structures, but not all.
There is a group of structures where linear analysis is insufficient. The aim of this work was to draw attention to certain groups of structures in which failure to take into account the influence of normal forces may lead to large errors. An example of such a structure is the Schwedler dome with a mass of 40 953 kg. Already, in the buckling analysis, we can see a clear difference between the values of the critical load multipliers. Using the linear buckling analysis, we obtained a multiplier of 3.78, while in the nonlinear, it was 2.42. The relative error is (3.78 − 2.42)/2.42 = 0.56 = 56%. In the case of standard modal analysis, the first eigenvalue is 3.57 Hz, while after taking into account normal forces, it is 2.85 Hz. The relative error is (3.57 − 2.85)/2.85 = 0.25 = 25%. Differences are observed not only in eigenvalues but also in eigenvectors. The same eigenvectors describe the first vibration modes for both analyses. In addition, the eighth mode for the standard solution and the 10th mode for the nonstandard solution are the same.
It is worth noting the different form of deformation of both considered structures. In the case of the Schwedler structure, there is a clear tendency to global deformation (taking into account the entire structure at the same time), while in the case of the geodesic dome, local rod deformations dominate. In the case of the Schwedler dome, the first form of vibration is antisymmetric, while in the case of the geodesic dome, it is symmetrical.
Each of the domes was previously dimensioned based on the appropriate combination of loads, and on this basis, the values of internal forces were obtained. Including normal forces in the analysis brings our computational model closer to the real operating conditions of the dome. The low-rise domes are susceptible to loss of stability due to the joint jump condition, not bifurcation of individual bars. On the equilibrium paths of these domes, we can see a decrease in structure stiffness. Reducing the value of the first natural frequency is a logical consequence of reducing the stiffness of the structure.
5. Conclusions
Steel roofs used as load-bearing structures in industrial halls, commercial pavilions, train station halls, sports halls, etc. were analyzed, i.e., where a large free space between columns is required. These roofs are architecturally stunning, but in addition to static and strength analysis, they require checking their dynamic reaction, which is related to their individual characteristics. The safe use of this type of structure depends on the provision of clear and practical design methods that take into account all possible actions. This article draws attention not only to stability problems, but also to the phenomenon of excited resonance vibrations. Vibrations occur when the natural frequencies of the structure, albeit for a short period of time, are equal to or close to the excitation frequency. Information on the natural frequencies of the structure is provided by the modal analysis. This article clearly emphasizes that the standard version of the modal analysis is not sufficient for low-rise roofs (type: bar mesh). In order to show the structural differences, a comparative analysis of two steel roofs was carried out. Classical calculations have been enriched with a modal analysis taking into account normal forces. The commonly used standard modal analysis does not take into account the influence of normal forces. Including normal forces in the analysis brings our computational model closer to the real operating conditions of the dome.
The most effective way to avoid resonant oscillations is to design the structure in such a way that under all dynamic excitation conditions there is only a high tuning state. For this purpose, in the design phase, in addition to the static analysis, a numerical dynamic analysis should be carried out in terms of frequency and form of vibration. The dynamic system tuning project can be considered complete when the lowest natural frequency reaches a value of at least 1.3 times the forced vibration frequency. In addition, it is worth considering including preloads in the calculations. With the example of the Schwedler dome, the shift of the frequency spectrum towards low tuning is clearly visible.
In addition, the loss of stability was verified using a linear or geometric analysis of nonlinear buckling. In the stability analysis of building structures, the first eigenvalue was identified with the so-called critical load multiplier. According to the PN EN 1993-1-1/5.2.2 (5)B standard, if the critical load multiplier for the structure is in the range of 3 < μcr < 10.0, it is recommended to perform an approximate linear order II-elastic analysis (PDNA) or finer second-order analysis (GNA). First-order analysis may be used if the criterion that the value of the critical load multiplier μcr in relation to design loads is not less than 10 is met (μcr ≥ 10). The low Schwedler dome presented in the article is characterized by a strongly nonlinear static and dynamic response. Ignoring nonlinear effects leads to large computational errors.
The obtained results of the modal analysis clearly indicate the direction of further research. The proposed, architecturally interesting low-rise Schwedler dome does not meet the structural conditions. Covering a sports facility with a dome inevitably heralds big troubles. A crowd of fans can generate a large dynamic impact, especially when we take into account their rhythmic jumping. In the case of stadiums and entertainment facilities, the dynamic load of the crowd is the dominant load. According to the standard guidelines, the frequencies of natural vibrations of ceilings with a span of more than 12 m should be at least 5 Hz. In further research, we intend to redesign the overlap to meet the high tuning requirements.
List of standards:
N 1. EN 1990: 2002. Eurocode—Basis for structural design.
N 2. EN 1991-1-3. Eurocode 1: Actions on structures—Part 1–3: General actions—Snow loads.
N 3. EN 1991-1-4. Eurocode 1: Actions on structures—Part 1–4: General actions—Wind actions.
N 4. EN 1993-1-1. Eurocode 3: Design of steel structures—Part 1–1: General rules and rules for buildings.
Author Contributions
Conceptualization, U.R., P.Z. and M.S.; methodology, U.R., P.Z. and M.S.; software, U.R., P.Z. and M.S.; validation, U.R., P.Z. and M.S.; formal analysis, U.R., P.Z. and M.S.; investigation, U.R., P.Z. and M.S.; resources, U.R., P.Z. and M.S.; data curation, U.R., P.Z. and M.S.; writing—original draft preparation, U.R., P.Z. and M.S.; writing—review and editing, U.R. and M.S.; visualization, U.R., P.Z. and M.S.; supervision, U.R. and M.S.; project administration, U.R., P.Z. and M.S.; funding acquisition, M.S. and U.R. All authors have read and agreed to the published version of the manuscript.
Funding
Project financed under the program of the Scientific Grant Agency of the Slovak Republic under the grant VEGA no. 1/0230/22.
Institutional Review Board Statement
Not applicable.
Informed Consent Statement
Not applicable.
Data Availability Statement
Not applicable.
Acknowledgments
The authors gratefully acknowledge the contribution of the Scientific Grant Agency of the Slovak Republic under the grant VEGA no. 1/0230/22 and the program of the Minister of Science and Higher Education under the name “Regional Initiative of Excellence” in the years 2019–2022, project number 025/RID/2018/19, amount of financing PLN 12 000 000.
Conflicts of Interest
The authors declare no conflict of interest.
References
- Marcinowski, J. Threats to buildings resulting from resonant vibrations. Constr. Rev. 2012, 5, 10. (In Polish) [Google Scholar]
- Wilde, K.; Grębowski, K.; Rucka, M. Modeling of some dynamic interactions on the construction of stands of sports facilities. Eng. Constr. 2013, 11, 612–615. (In Polish) [Google Scholar]
- Wilde, K.; Rucka, M.; Grębowski, K. Emergency condition of the stand of the stadium in Zielona Góra caused by the synchronous dance of the fans. Constr. Rev. 2014, 1, 28–32. (In Polish) [Google Scholar]
- Lasowicz, N.; Falborski, T.; Jankowski, R. Analysis of temporary steel grandstand with different bracing systems exposed to crowd load. J. Meas. Eng. 2018, 6, 256–262. [Google Scholar] [CrossRef] [Green Version]
- Choi, D.-I.; Kim, D.-J.; Park, K.-G. Dynamic Response of 100 m, 200 m, 300 m Lattice Domes with LRB Seismic Isolator. J. Civ. Eng. Archit. 2019, 13, 523–537. [Google Scholar] [CrossRef] [Green Version]
- Takeuchi, T.; Ogawa, T.; Kumagai, T. Seismic response evaluation of lattice shell roofs using amplification factors. J. Int. Assoc. Shell Spat. Struct. 2007, 48, 197–210. [Google Scholar]
- Hosseini, M.; Hajnasrollah, S.; Herischian, M. A Comparative Study on the Seismic Behavior of Ribbed, Schwedler, and Diamatic Space Domesby Using Dynamic Analyses. In Proceedings of the 15th World Conference on Earthquake Engineering, Lisbon, Portugal, 24–28 September 2012. [Google Scholar]
- Berteto, S.; Tarazaga, P.A.; Sarlo, R. In situ seismic testing for experimental modal analysis of civil structures. Eng. Struct. 2022, 270, 114773. [Google Scholar] [CrossRef]
- Yahyai, M.; Chahardoli, M. Seismic Behavior of Single Layer Schwedler Domes. Int. J. Space Struct. 2014, 29, 39–48. [Google Scholar] [CrossRef]
- Pilarska, D.; Maleska, T. Numerical Analysis of Steel Geodesic Dome under Seismic Excitations. Materials 2021, 14, 4493. [Google Scholar] [CrossRef]
- Lin, L.; Huang, B.; Sun, Y.; Zhu, Y.; Wang, D. Dynamic Response of a Single-Layer Reticulated Dome during Aircraft Impact Based on S-J Modeling Method. Shock Vib. 2019, 2019, 9056810. [Google Scholar] [CrossRef] [Green Version]
- Fan, F.; Wang, D.; Zhi, X.; Shen, S. Failure modes of reticulated domes subjected to impact and the judgment. Thin-Walled Struct. 2010, 48, 143–149. [Google Scholar] [CrossRef]
- Chróścielewski, J.; Miśkiewicz, M.; Pyrzowski, Ł.; Rucka, M.; Wilde, K. Research of the viaduct over the railway tracks at the PGE Arena in Gdańsk during its implementation. Bud. Archit. 2013, 12, 15–22. (In Polish) [Google Scholar] [CrossRef]
- Sokol, M.; Venglár, M.; Lamperová, K.; Márföldi, M. Performance Assessment of a Renovated Precast Concrete Bridge Using Static and Dynamic Tests. Appl. Sci. 2020, 10, 5904. [Google Scholar] [CrossRef]
- Sokol, M.; Ároch, R.; Lamperová, K.; Marton, M.; García-Sanz-Caledo, J. Parametric Analysis of Rotational Effects in Seismic Design of Tall Structures. Appl. Sci. 2021, 11, 597. [Google Scholar] [CrossRef]
- Sokol, M.; Márföldi, M.; Venglár, M.; Lamperová, K. Evaluation of Performance Indicator of Railway Bridges Using Updated Finite Element Model. J. Mech. Eng. 2019, 69, 89–96. [Google Scholar]
- Venglár, M.; Sokol, M. Case study: The Harbor Bridge in Bratislava. Struct. Concr. 2020, 21, 2736–2748. [Google Scholar] [CrossRef]
- Lamperová, K.; Sokol, M.; Timková, B. Identification of Bearings State on the Bridge Checked by Dynamic Tests. J. Mech. Eng. 2020, 70, 67–76. [Google Scholar]
- Sadeghi, H.; Heristchian, M.; Aziminejad, A. Wind effect on grooved and scallop domes. Eng. Struct. 2017, 148, 436–450. [Google Scholar] [CrossRef]
- Khosrowjerdi, S.; Sarkardeh, H.; Kioumarsi, M. Effect of wind load on different heritage dome buildings. Eur. Phys. J. Plus 2021, 136, 1180. [Google Scholar] [CrossRef]
- Tomasik, J.; Obara, P. Dynamic stability of tensegrity structures—Part 1: The time-independent external load. Materials 2023, 16, 580. [Google Scholar]
- Mollaei, S.; Babaei, M.; Asemi, K. Torsional buckling of functionally graded graphene reinforced composite laminated cylindrical panel. Arch. Appl. Mech. 2023, 93, 427–435. [Google Scholar] [CrossRef]
- Thompson, J.M.T.; Hunt, G.W. A General Theory of Elastic Stability; Wiley and Sons: Hoboken, NJ, USA, 1973. [Google Scholar]
- Kleiber, M. Finite Element Method for Nonlinear Continuum Mechanics; Warszawa-Poznań PWN: Warszawa, Poland, 1985. (In Polish) [Google Scholar]
- Bathe, K.J. Finite Element Procedure in Engineering Analysis; Prentice Hall: New York, NY, USA, 1982. [Google Scholar]
- Zabojszcza, P.; Radoń, U. Effect of Increased Density of Nodes in Geodesic Dome on its Critical Load Capacity. IOP Conf. Ser. Mater. Sci. Eng. 2019, 471, 052051. [Google Scholar] [CrossRef]
- Huseyin, K.; Neale, K.W. Nonlinear Theory of Elastic Stability. J. Appl. Mech. 1976, 43, 521–522. [Google Scholar] [CrossRef] [Green Version]
- Zabojszcza, P.; Radoń, U.; Szaniec, W. Probabilistic Approach to Limit States of a Steel Dome. Materials 2021, 14, 5528. [Google Scholar] [CrossRef]
- Zabojszcza, P.; Radoń, U. Stability analysis of the single-layer dome in probabilistic description by the Monte Carlo method. J. Theor. Appl. Mech. 2020, 58, 425–436. [Google Scholar] [CrossRef]
- Riks, E. An incremental approach to the solution of snapping and buckling problems. Int. J. Solids Struct. 1979, 15, 529–551. [Google Scholar] [CrossRef]
- Coutinho Alvaro, L.G.A. The application of the Lanczos Mode Superposition Method in dynamic analysis of offshore structures. Comput. Struct. 1987, 25, 615–625. [Google Scholar] [CrossRef]
- Gambolati, G.; Putti, M. A comparison of Lanczos and optimization methods in the partial solution of sparse symmetric eigenproblems. Int. J. Numer. Methods Eng. 1994, 37, 605–621. [Google Scholar] [CrossRef]
- Pilarska, D. Two subdivision methods based on the regular octahedron for single- and double-layer spherical geodesic domes. Int. J. Space Struct. 2020, 35, 160–173. [Google Scholar] [CrossRef]
| Disclaimer/Publisher’s Note: The statements, opinions and data contained in all publications are solely those of the individual author(s) and contributor(s) and not of MDPI and/or the editor(s). MDPI and/or the editor(s) disclaim responsibility for any injury to people or property resulting from any ideas, methods, instructions or products referred to in the content. |
© 2023 by the authors. Licensee MDPI, Basel, Switzerland. This article is an open access article distributed under the terms and conditions of the Creative Commons Attribution (CC BY) license (https://creativecommons.org/licenses/by/4.0/).


