Article

Research on Seismic Wave Delay and Amplification Methods in the Shaking Table Test of Large-Span Structures in Mountain Areas

1
Faculty of Engineering and Mechanics, Kunming University of Science and Technology, Kunming 650500, China
2
Earthquake Engineering Researching Center of Yunnan, Kunming 650500, China
*
Author to whom correspondence should be addressed.
Appl. Sci. 2023, 13(11), 6728; https://doi.org/10.3390/app13116728
Submission received: 10 April 2023 / Revised: 24 May 2023 / Accepted: 30 May 2023 / Published: 31 May 2023

Abstract

:
The traveling wave and slope amplification effects should be considered in the shaking table test of large-span structures in mountain areas. Based on the structural characteristics and site conditions of a large-span structure in a mountain area, this paper designed a high-rise steel frame structure with viscous dampers through finite element analysis to amplify seismic waves with a time delay. Then, the original structure and steel frame models with a similarity ratio of 1/40 were made for shaking table tests. The test results showed that a high-rise steel frame structure with reasonable viscous dampers could delay and amplify seismic waves, and the scaled model of the structure could play the same role in shaking table tests. Meanwhile, by comparing the seismic responses of large-span structural models in mountain areas before and after the amplification of seismic wave delays, it was found that the delay and amplification of seismic waves had little impact on the acceleration response of the structure. In contrast, the seismic wave delay played a dominant role in the change in the structural displacement response.

1. Introduction

In seismic engineering, the shaking table test can genuinely reproduce the earthquake process by loading actual seismic records and is the most direct method for studying the seismic response and failure mechanism of structures. Meanwhile, many large and complex structures use shaking table tests to study and evaluate the seismic performance of structures [1,2,3,4,5,6]. However, large-span structures located in mountain areas might need some help simulating seismic wave input due to the limitations of shaking table performance when using shaking table tests to study the seismic response of some unique structures, as shown in Figure 1. First, for large-span structures, due to the limited propagation speed of seismic waves, there will be significant time delays when seismic waves reach different supports of the structure, which are the traveling wave effects. At the same time, traveling wave effects can lead to different acceleration peaks and phases at different locations of the structure, significantly affecting the seismic response of various structures [7,8,9,10,11]. Therefore, some scholars have used shaking table arrays to simulate this effect in experiments for long-span structures which were affected by traveling wave effects [12,13,14,15]. Since the shaking table array was arranged on the same horizontal plane, the shaking table array was generally used in the testing of large-span structures with supports at the same horizontal plane. However, there needed to be more test cases for large-span structures in mountainous areas with significant height differences between supports.
Second, for the mountain buildings shown in Figure 1, the slope amplification effect of the cliff where some structural supports were located on the seismic wave plays a vital role in the seismic performance analysis of the structure [16,17,18]. Therefore, it was necessary to consider amplifying the seismic waves inputted at some supports when conducting shaking table tests on such structures to ensure the accuracy and rationality of the tests. However, there were no relevant research results on simulating the slope amplification effect at the support of structural parts in shaking table tests.
In summary, the study of the influence of the traveling wave effect and slope amplification effect in shaking table tests of large-span mountain structures can further improve the fidelity of shaking table tests, which is essential for improving the seismic resilience, optimizing design strategies, and enhancing the safety and performance of these structures. Based on the delay effect of viscous dampers on seismic wave acceleration peaks [18] and the amplification effect of high-rise structures on seismic wave acceleration [19,20,21,22], this paper proposed an experiment to make up for the shortcomings in the simulation of traveling wave effects and slope amplification effects proposed above in shaking table tests. In detail, a high-rise structure with viscous dampers was designed through finite element analysis to delay and amplify seismic waves following the original structural characteristics and building site conditions for the shaking table test of a large-span structure in the mountain area shown in Figure 1. Then, a dynamic scale model with a geometric similarity ratio of 1:40 was created based on the overall structure. By inputting white noise excitation into the model and simulating seismic waves, the seismic response of the model under the same seismic intensity before and after the seismic wave delay and amplification was tested and the test results were analyzed to verify the accuracy and feasibility of the test method for seismic wave delay and amplification.

2. Finite Element Model

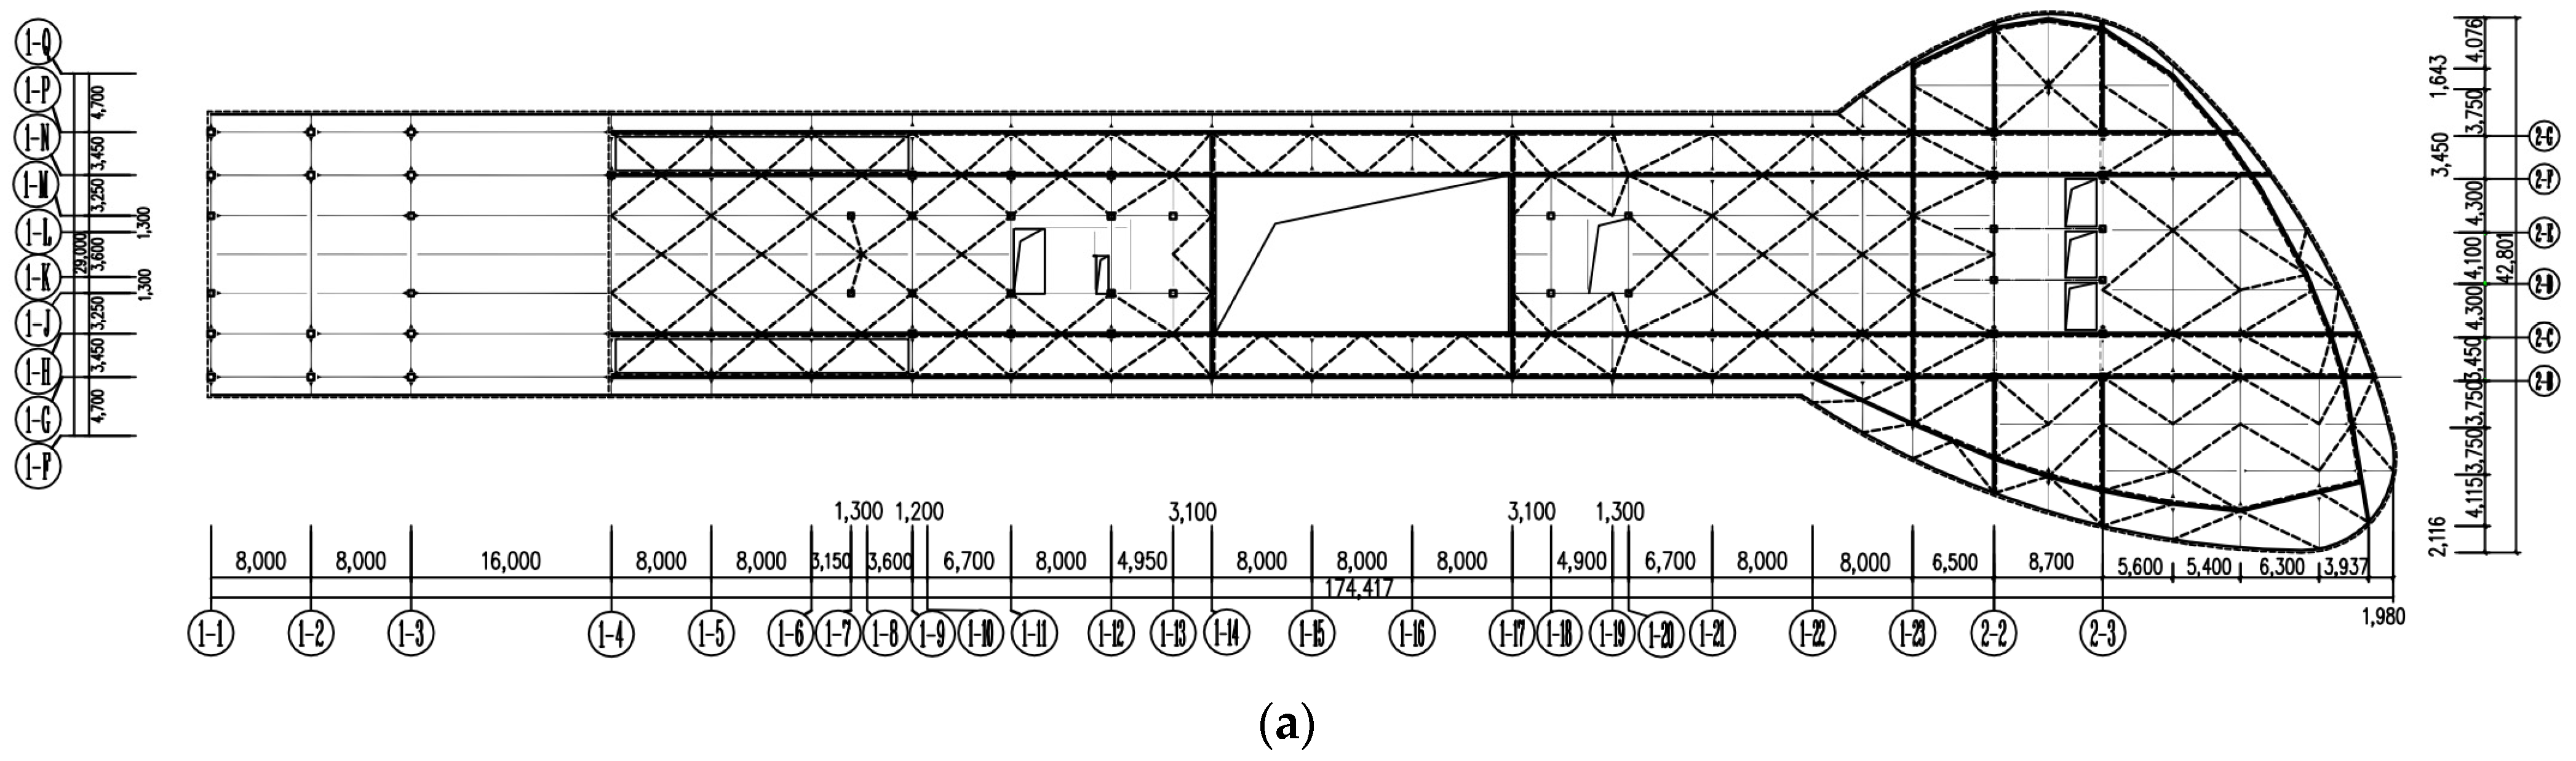
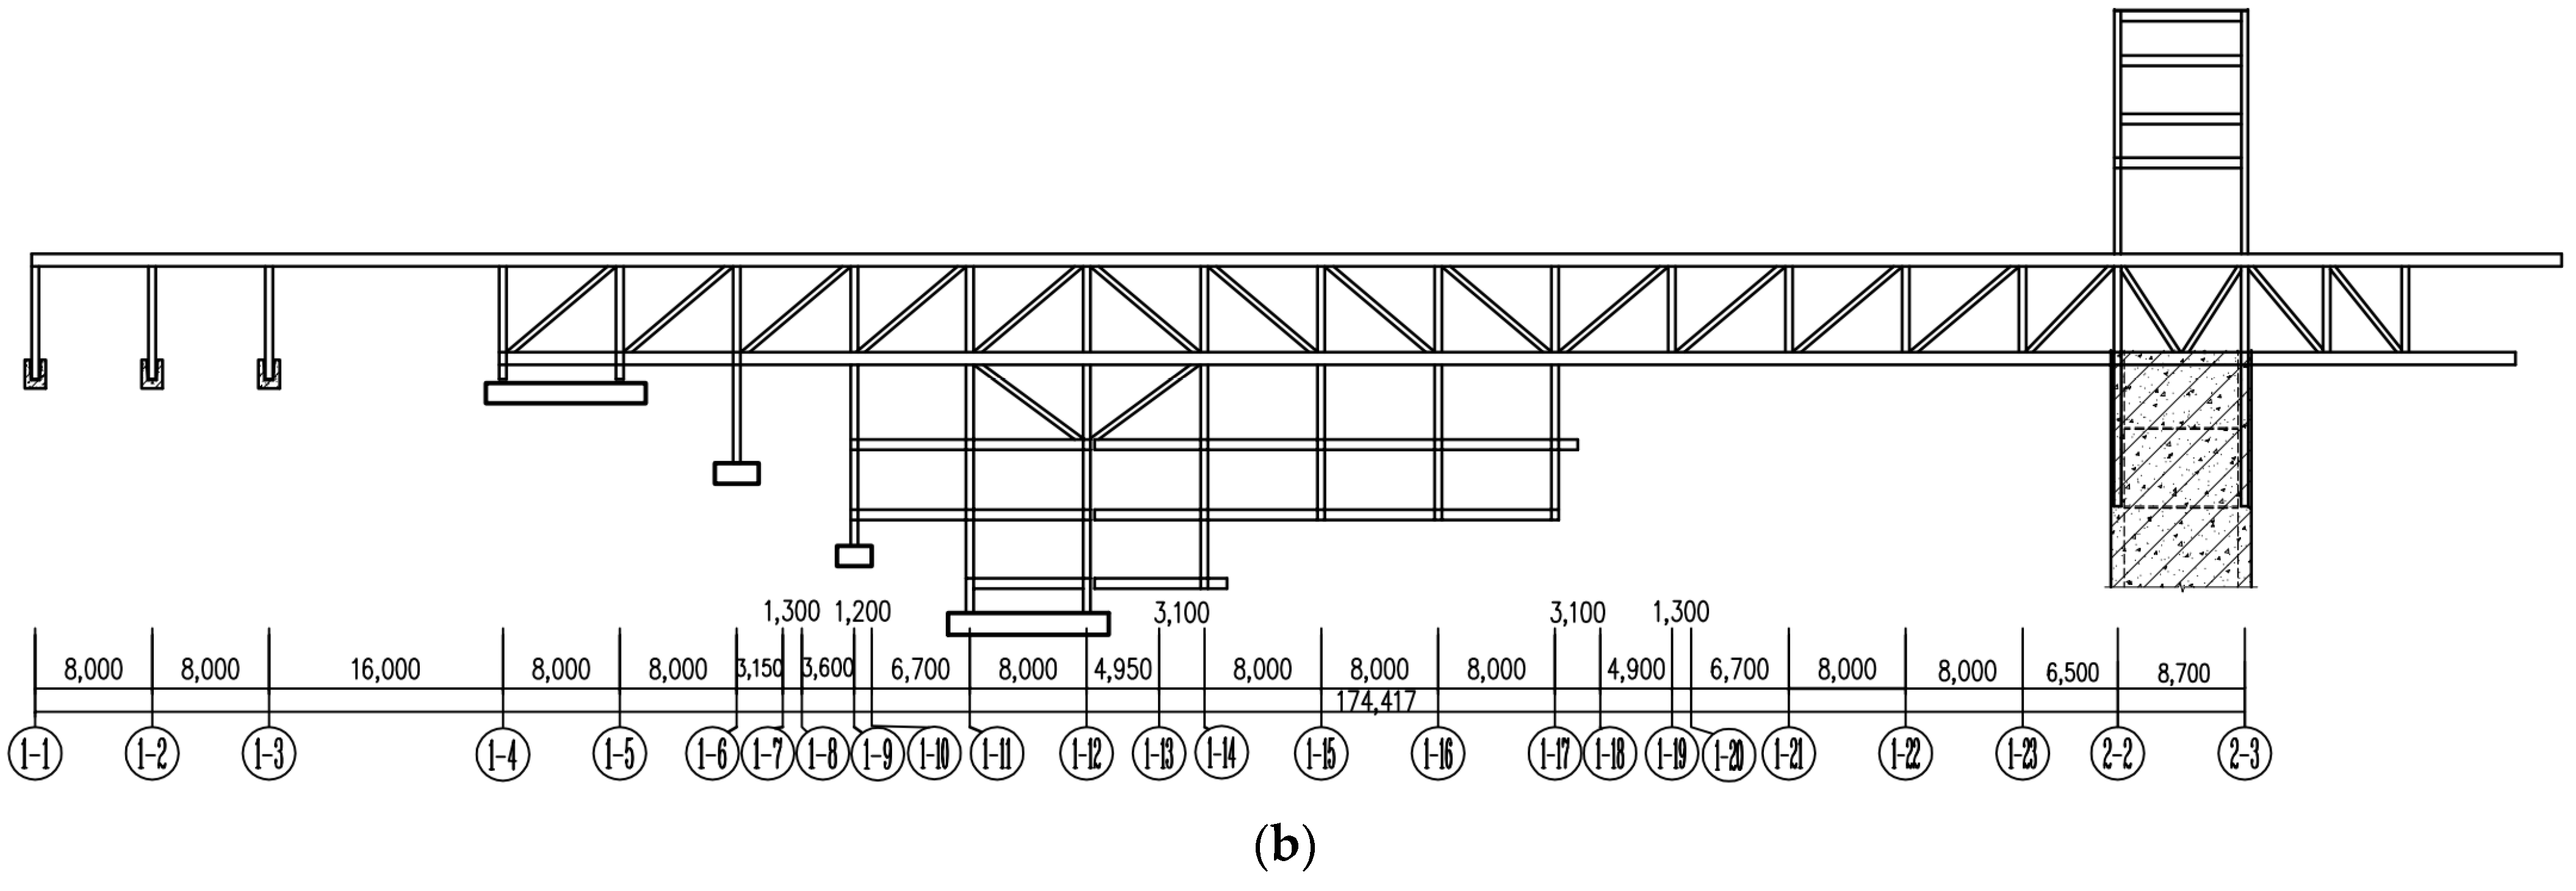
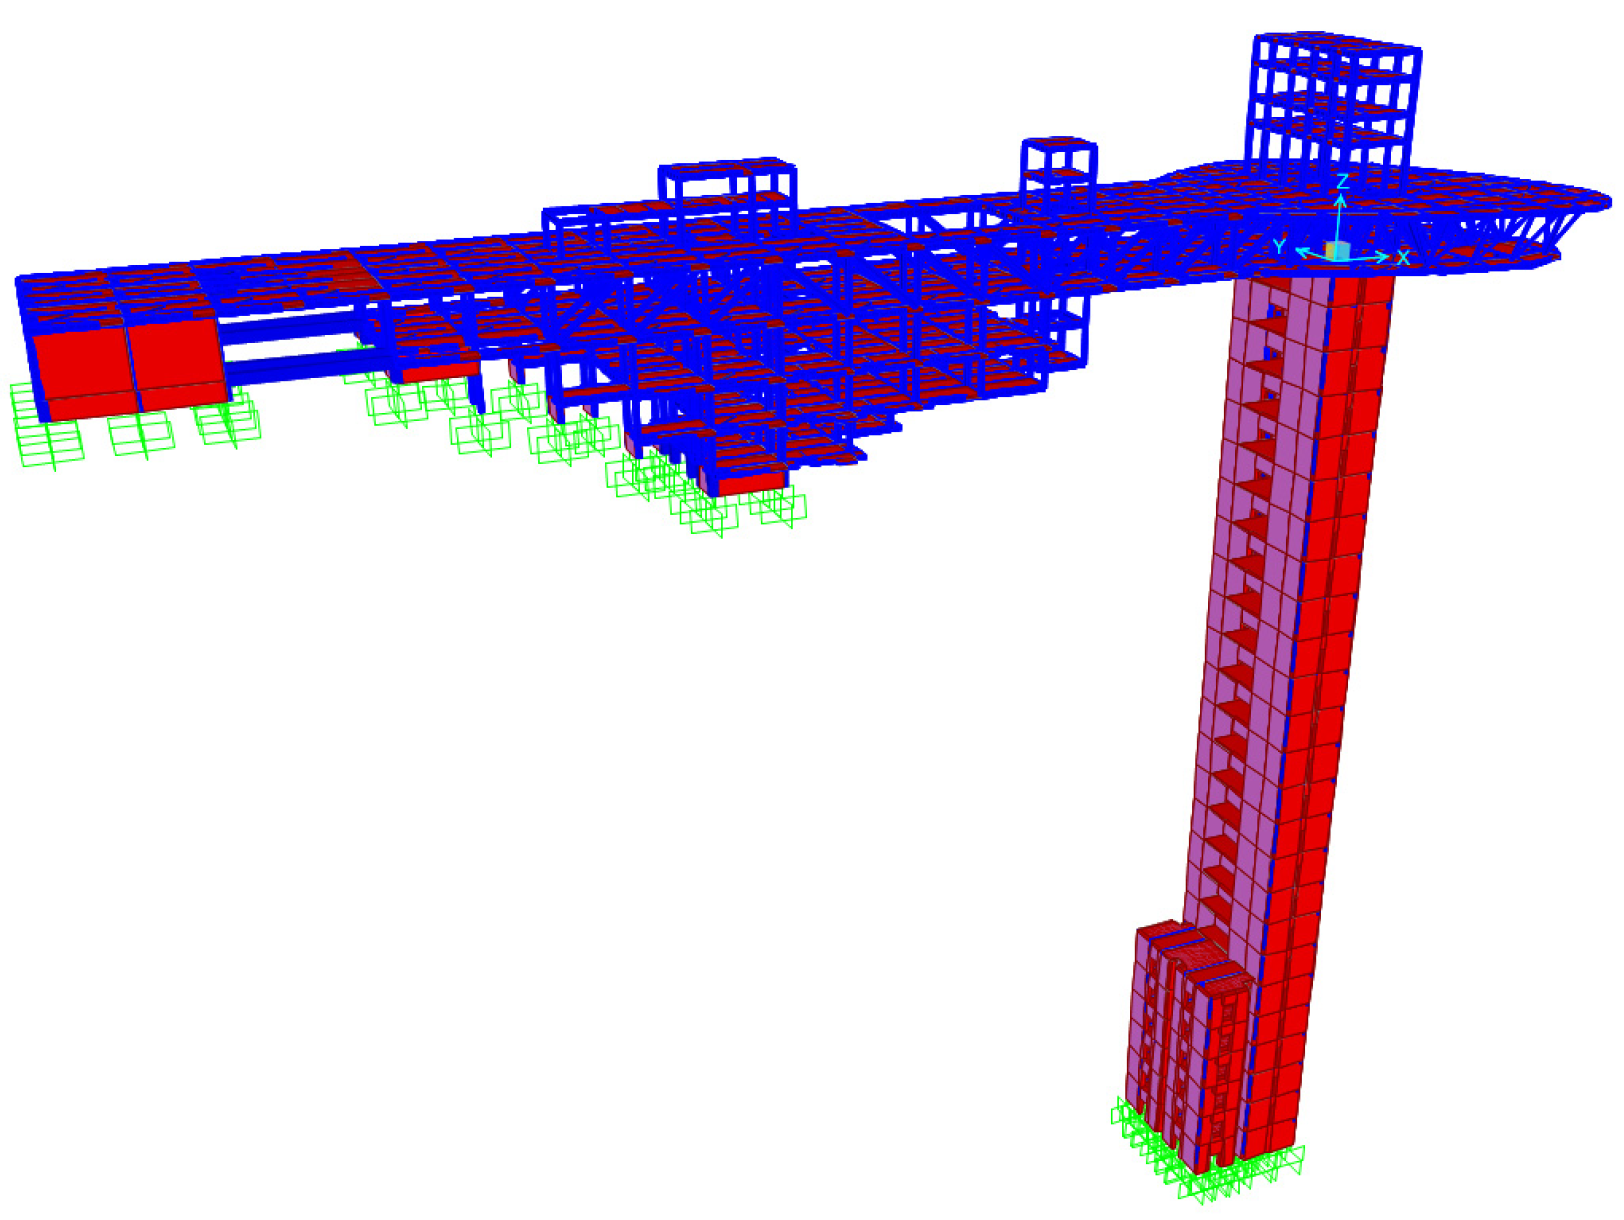
2.1. Original Structure Model

The original structure is a cliff hotel located in the mountainous areas of southern China, with a height of about 155.3 m above the ground. The structural system is a shear wall structure + steel truss structure. The height of the shear wall structure is 135 m, with 25 floors and 5.4 m floor heights. The plane is rectangular and the overall dimension is 20.4 m × 17.6 m (1–6 layers of base) and 20.4 m × 9.6 m (7–25 floors) (Figure 2). The total length of the steel truss structure is 174.5 m, with a maximum span of 70.5 m. The main part consists of two tetrahedral steel trusses with a height of 6.6 m. One end is on a high mountain and the other end is connected to the shear wall structure at the top. The lower three floors are steel frame structures suspended under the main truss (Figure 3). According to the Seismic Ground Motion Parameter Zonation Map of China (GB18306-2015) [23], the seismic peak acceleration for Class II sites within the proposed site with a 50-year exceedance probability of 10% is 0.3 g, with a characteristic period of 0.45 s and the corresponding basic seismic intensity of 8.
To properly model the structure, the frame element is used for beams and columns, the thin shell element is used for slabs, and the nonlinear multi-layer shell element is used for shear walls. When meshing, the shape and size of the mesh are automatically adjusted through FEM software to match the nodes inside the element. Concrete C30 was adopted for plates and beams and C60 was adopted for the shear wall and column. The normal rebar was employed with HPB335 and HRB400, and profile steel was employed with Q355. In the elastic time history analysis of the structure, the fast nonlinear analysis method (FNA) is used and the iterative process is converged by adjusting the integration step. Figure 4 shows a perspective view of the entire structure in finite element modeling.

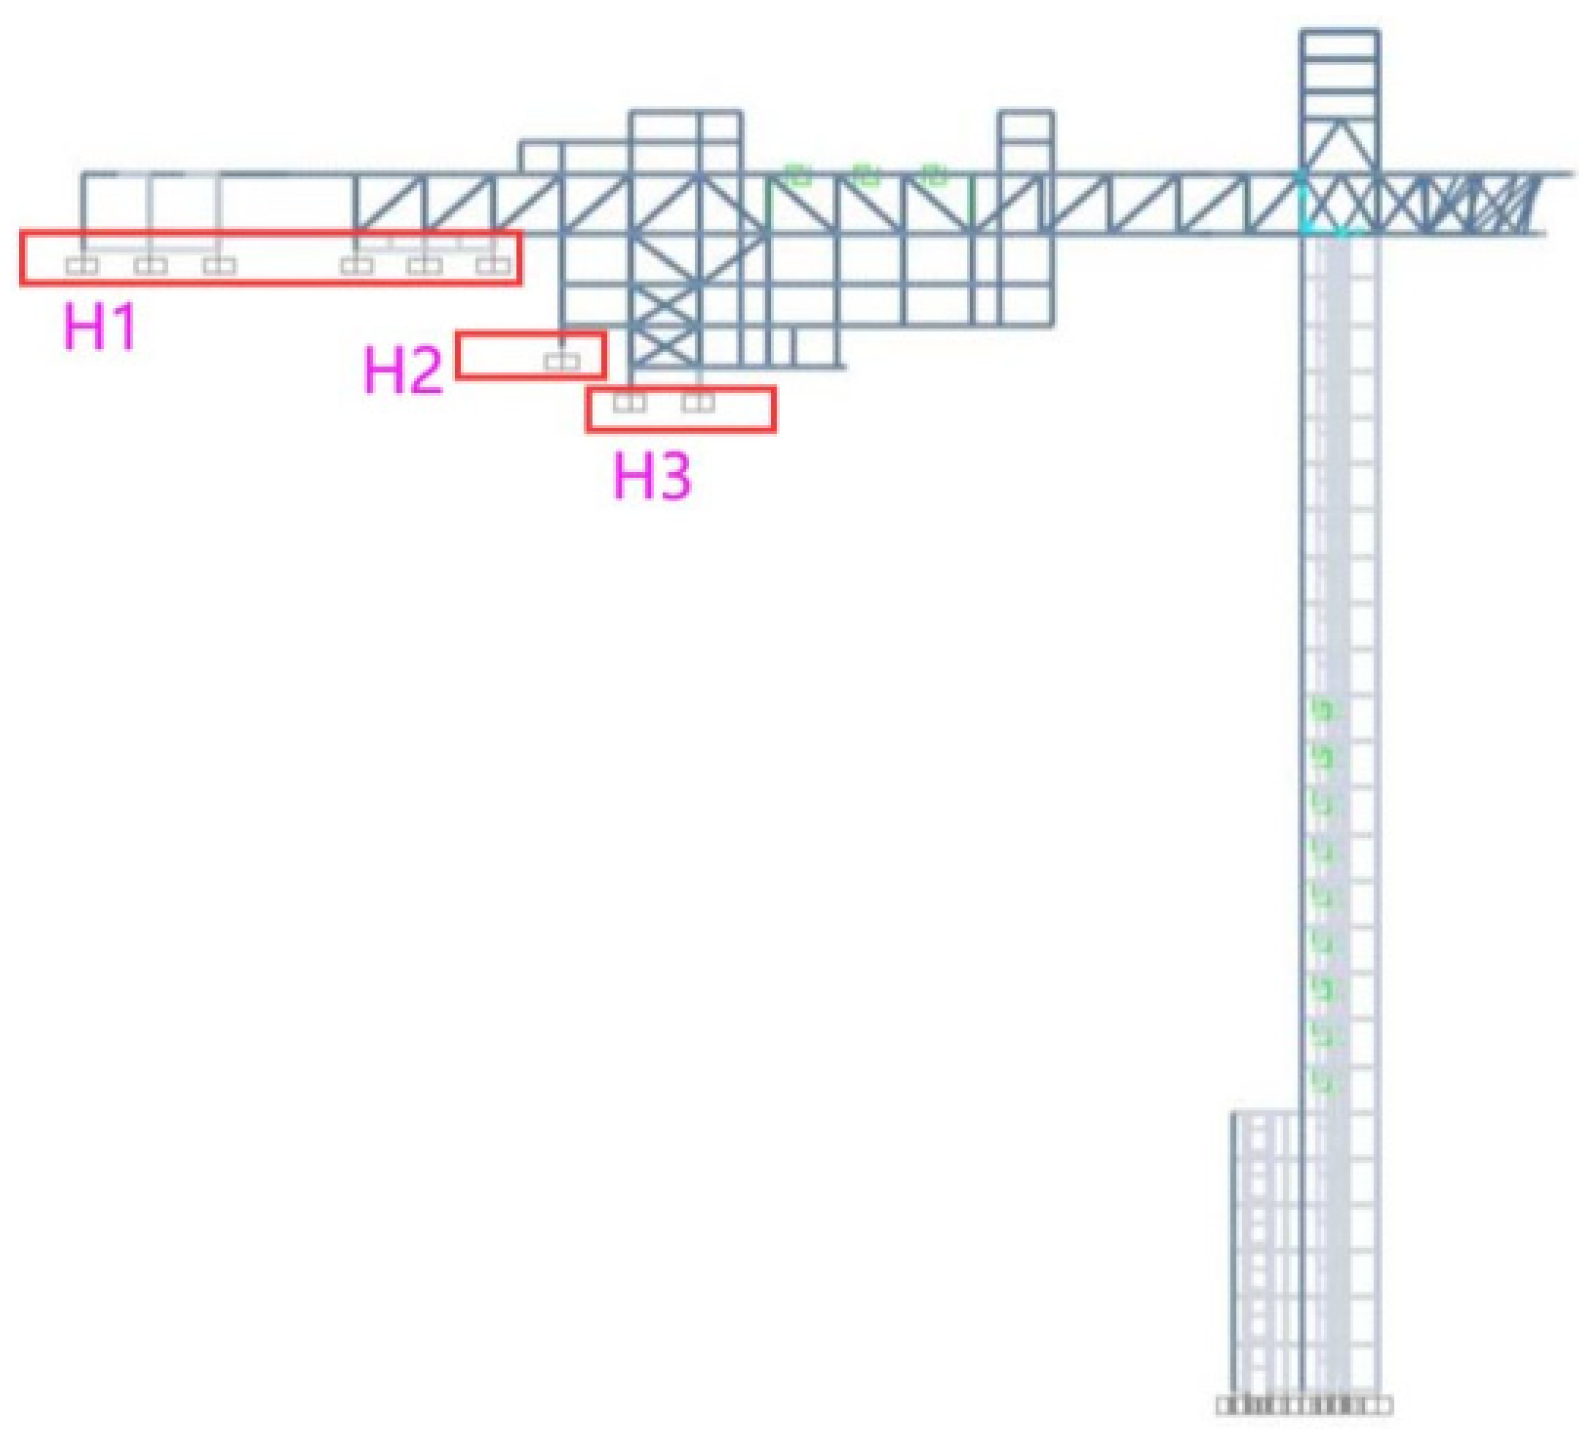
2.2. Seismic Wave Delay and Amplification

As a large-span structure, researchers should consider the impact of traveling wave effects when studying the original structure. Therefore, it is necessary to set a reasonable time difference for the seismic wave input at different supports to simulate the traveling wave effect when calculating the seismic response. Based on the data obtained from the geological survey of the building site, the equivalent shear wave velocity of the original structure building site was calculated as Vse = 339 m/s through the weighted average value. Then, the time difference between the seismic wave reaching each support was calculated (Figure 5). According to the calculation results, the time difference in seismic waves can be taken as 0.4 s. In detail, the support of the steel truss structure at the hillside is delayed by 0.4 s compared to the bottom support of the shear wall structure to input seismic waves when calculating the seismic response.
t 1 = H 1 V s e = 133 339 = 0.39   s 0.4   s t 2 = H 2 V s e = 122 339 = 0.36   s 0.4   s t 3 = H 3 V s e = 117 339 = 0.35   s 0.4   s
Since the original structure is built against a mountain and the slope and height of the mountain where the steel truss structure is supported are substantial, researchers should consider the amplification effect of the mountain on seismic waves. According to the relevant regulations in the Code for Seismic Design of Building (GB50011-2010) [24] and engineering experience, the amplification factor of seismic wave acceleration could be determined as 1.6. In other words, the peak value of acceleration is amplified by 1.6 times after a series of actions when transmitted to the slope top by the seismic wave input at the slope bottom.

2.3. Mountain Model

Based on various aspects such as laboratory conditions, material costs, and the production process of scaled models for subsequent shaking table tests, this paper proposed replacing mountains with a steel frame to unify the analysis and calculation of mountains and building structures. Combined with the above content, it could be considered reasonable to replace the mountain with the steel frame as long as the steel frame could provide a seismic wave delay of about 0.4 s in the span direction of the steel truss and the peak seismic wave acceleration at the top could be amplified by 1.6 times. In addition, due to the substantial acceleration data of seismic waves, existing experimental techniques could not uniformly amplify all peak accelerations by 1.6 times, which was unnecessary. Therefore, it was further simplified to focus only on amplifying the maximum peak acceleration.
Due to the material characteristics of steel, the steel frame could not have a time delay effect on seismic waves. Based on practical engineering experience and research [18], adding viscous dampers to structures could have a certain time delay effect on seismic waves. The more viscous the dampers, the greater the output and the more apparent the time delay effect, but the amplification effect of seismic waves would decrease accordingly. Therefore, it is necessary to continue adjusting the size of steel frame structural members and the number and output of viscous dampers to balance the time delay and amplification, achieving the expected design goals of the mountain model. Through multiple FE analyses, the appropriate size of steel frame structural members as well as the number, parameters, and location of viscous dampers were finally determined (Figure 6).
The steel frame beam was the structural form of a box girder, with the size of 2500 mm × 1500 mm × 400 mm × 400 mm, and the steel frame column was the structural form of a box column, with the size of 3500 mm × 2500 mm × 500 mm × 500 mm. Four sets of viscous dampers were arranged between the floors of the steel frame, with a damping coefficient of 400 kN/mm/s and a damping index of 0.25. Five artificial seismic waves were generated based on the building site conditions and input into the structure for time history analysis to verify the effect of steel frame structures on the amplification of seismic wave delay. In detail, the span direction of the steel truss structure was in the X direction, the vertical direction was in the Y direction, the average time delay value in X direction was 0.43 s, and the average time delay value in Y direction was 0.07 s. The average acceleration amplification coefficient in the X direction was 1.56 times and the average acceleration amplification coefficient in the Y direction was 1.58 times (Table 1).

3. Shaking Table Test

3.1. Model Similarity
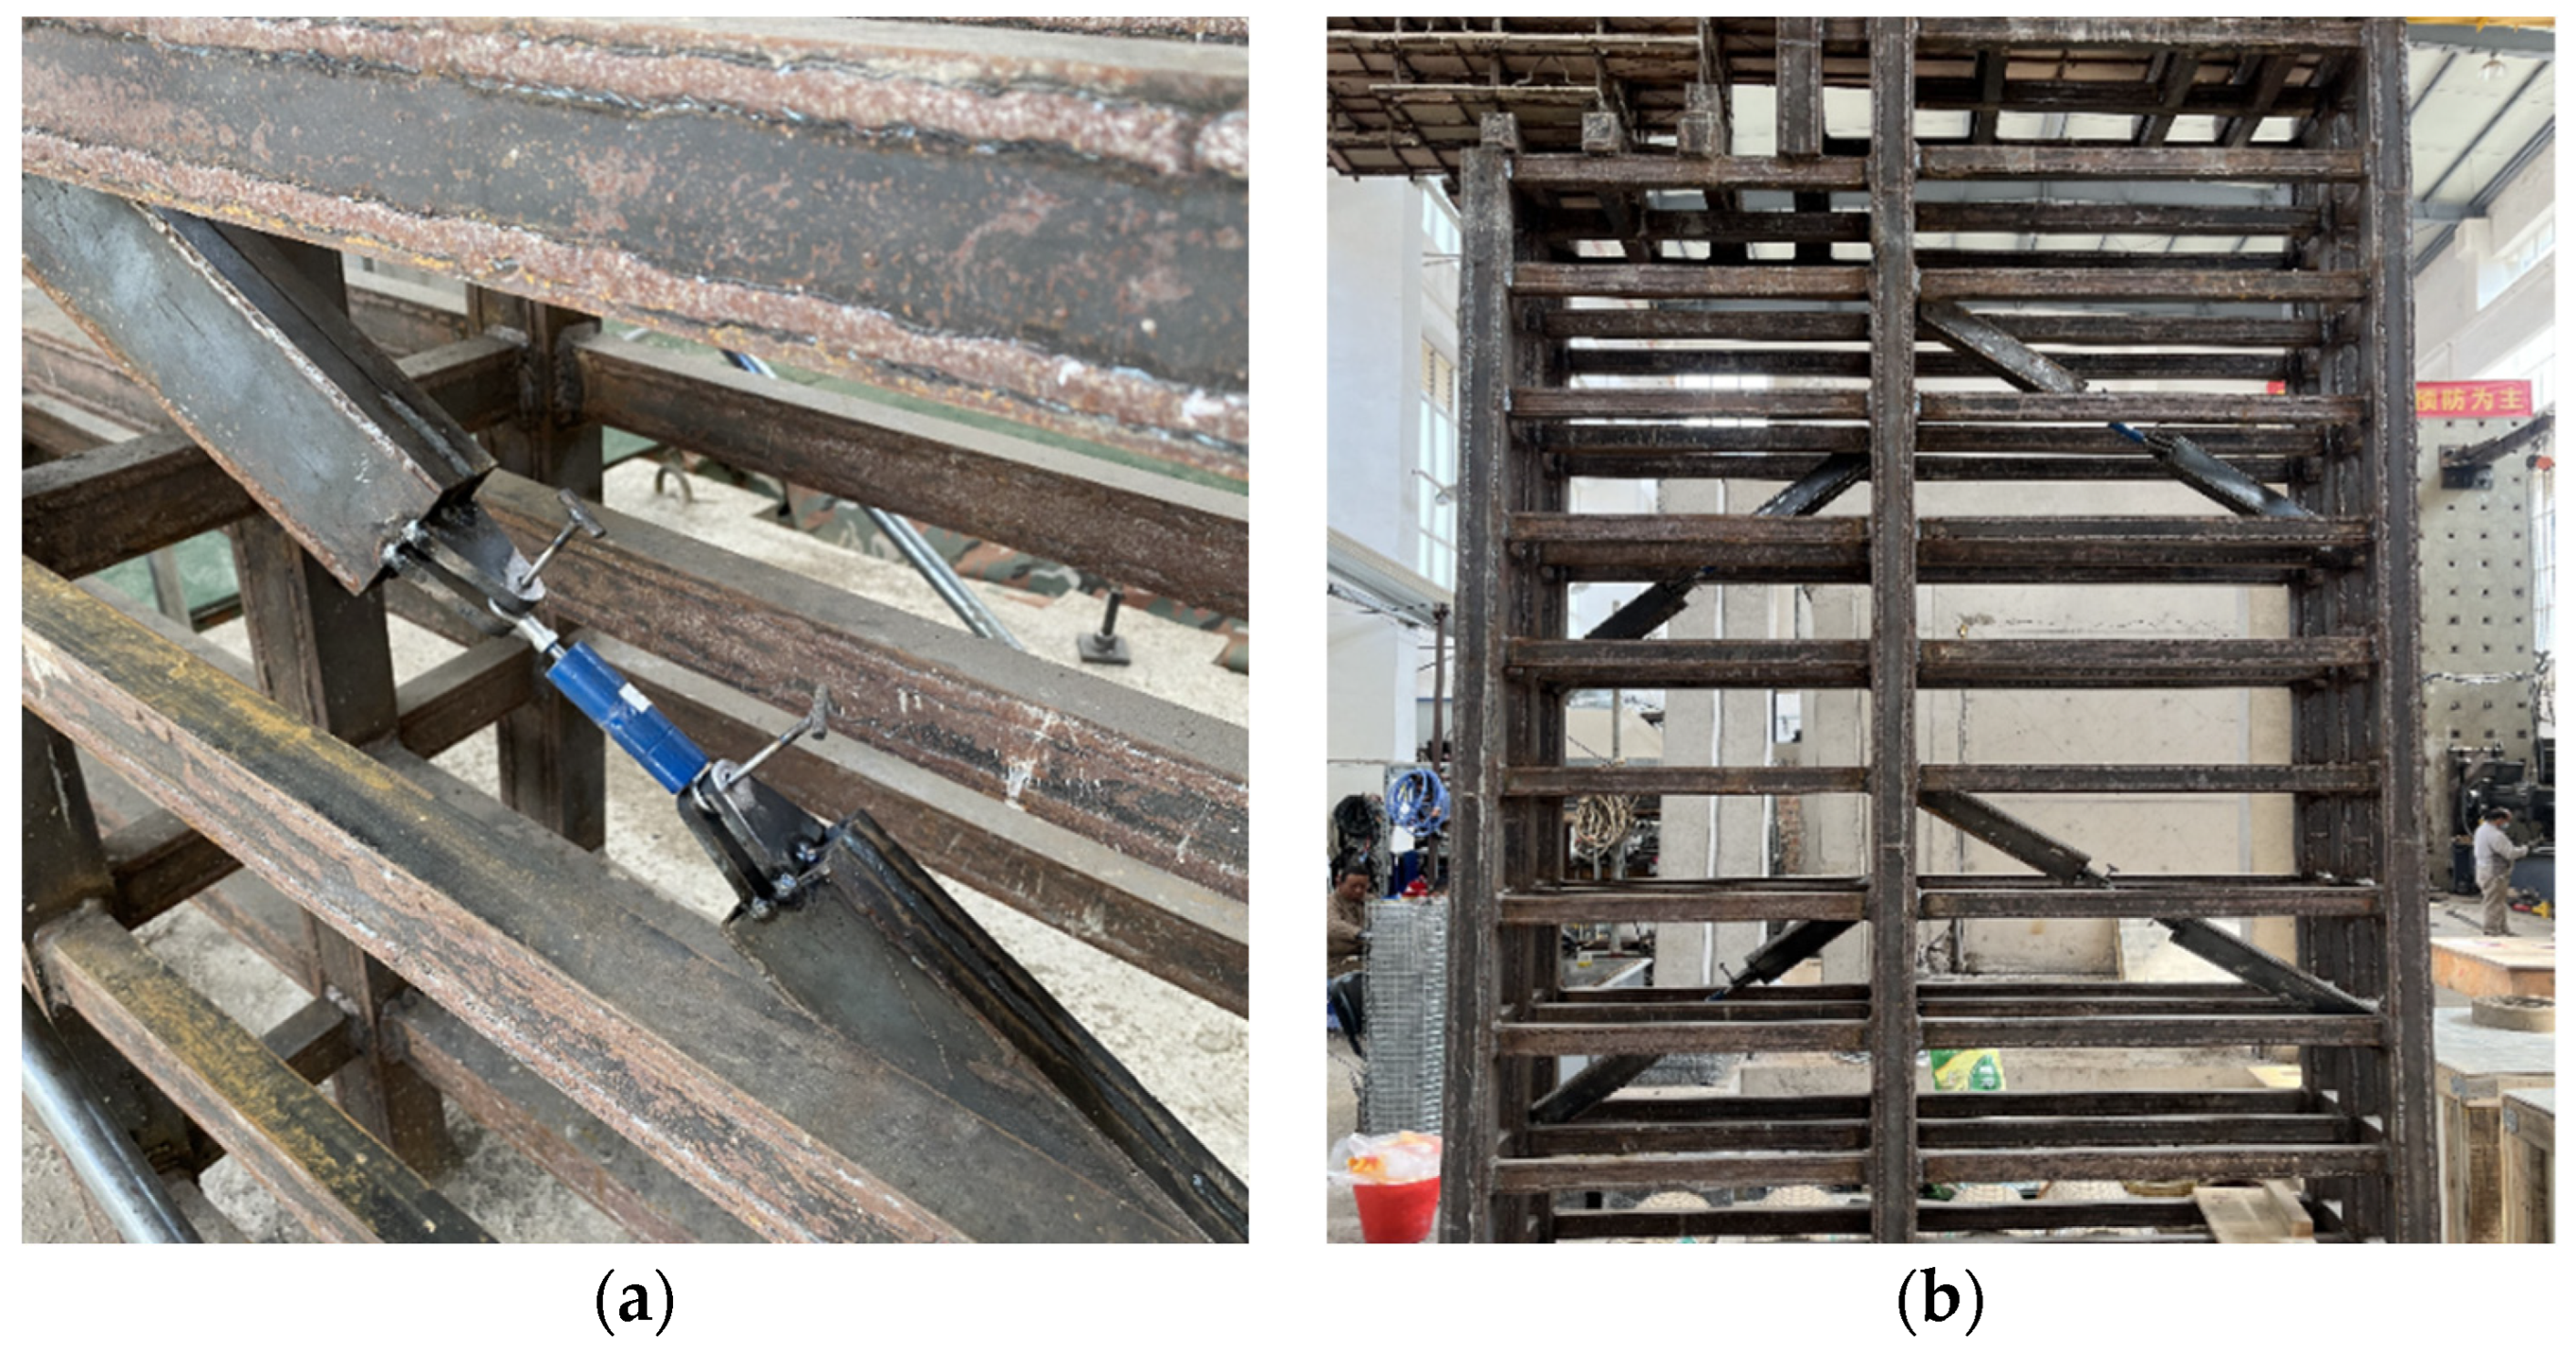
Determining the similarity between the model and the original structure was the most critical task of the entire shaking table test. To make the model and the original structure meet the physical-mechanical similarity, the following four similitude laws are required: similar geometry, similar stress–strain relationship between the model material and the prototype material, similar mass and gravity, and similar initial and boundary conditions. The similarity between mass and gravity is the most flexible similitude law in model design. In shaking table tests, the mass similitude law is widely used because it can satisfy the similarity conditions of both gravity and horizontal inertia force [25]. According to the principle of dimensional coordination, the similarity coefficients of elastic modulus, density, length, and acceleration had the following relationships:
S E / S ρ S a S L = 1
where SE, Sρ, Sa, and SL are similarity scaling factors for elastic modulus, density, acceleration, and length.
Based on the size of the shaking table and the space size of the laboratory, SL was 0.025. According to the similarity relationship requirements, fine aggregate concrete was used to simulate the prototype concrete, a galvanized iron wire was used to simulate the prototype reinforcement, and red copper was used to simulate the prototype steel member. According to the material performance test, SE was 0.2. Based on factors such as the bearing capacity of the vibration table and the maximum ground acceleration peak of the prototype structure, Sa was 1.8. The density similarity coefficient Sρ was determined by the first three similarity coefficients through the formula (1). The remaining similarity scaling factors could also be calculated through the dimensional analysis method. The main similarity scaling factors for this test are shown in Table 2.

3.2. Model Building

The original structural components were numerous and complex, while the reduced space of the model structure was small, making construction and fabrication difficult. Therefore, appropriate simplification should be made without changing the mechanical mechanism of the structure when making a shaking table test model. In this model, non-main structural load-bearing components such as guardrails and curtain wall support components were omitted. Researchers simplified the consolidation of some load-bearing components, such as the consolidation of shear wall openings with constant lateral force stiffness. The model production process is shown in Figure 7.
Based on the parameters of the viscous damper in the FE Model calculation results and the above similarity, a scaled viscous damper was fabricated and installed in a steel frame (Figure 8). Due to the need for disassembly and assembly during the test, both ends of the viscous damper were fixed with removable pins.

3.3. Instruments and Sensors

The test was conducted at the Seismic Research Institute of Kunming University of Science and Technology using a Servotest seismic simulation shaking table. The shaking table could perform two-dimensional and three degrees of freedom movement (a table size: 4.0 m × 4.0 m; maximum bearing model weight: 30 t; maximum acceleration: ±1 g; maximum displacement stroke: ±125 mm; and effective frequency range: 0.1~50 Hz.).
The acceleration sensors were arranged to record the acceleration response of the model to measure the seismic response of the model in the test. They were installed on the top of the shaking table; on the top of the simulated mountain; on the 7th, 16th, and 23rd floors of the shear wall structure; and on the 26th and 30th floors of the steel truss structure in the X and Y directions. The displacement response was obtained using a quadratic integration calculation through the acceleration response. Before the integration calculation, a wire-type displacement sensor was used to calibrate the filtering parameters during the acceleration quadratic integration process.

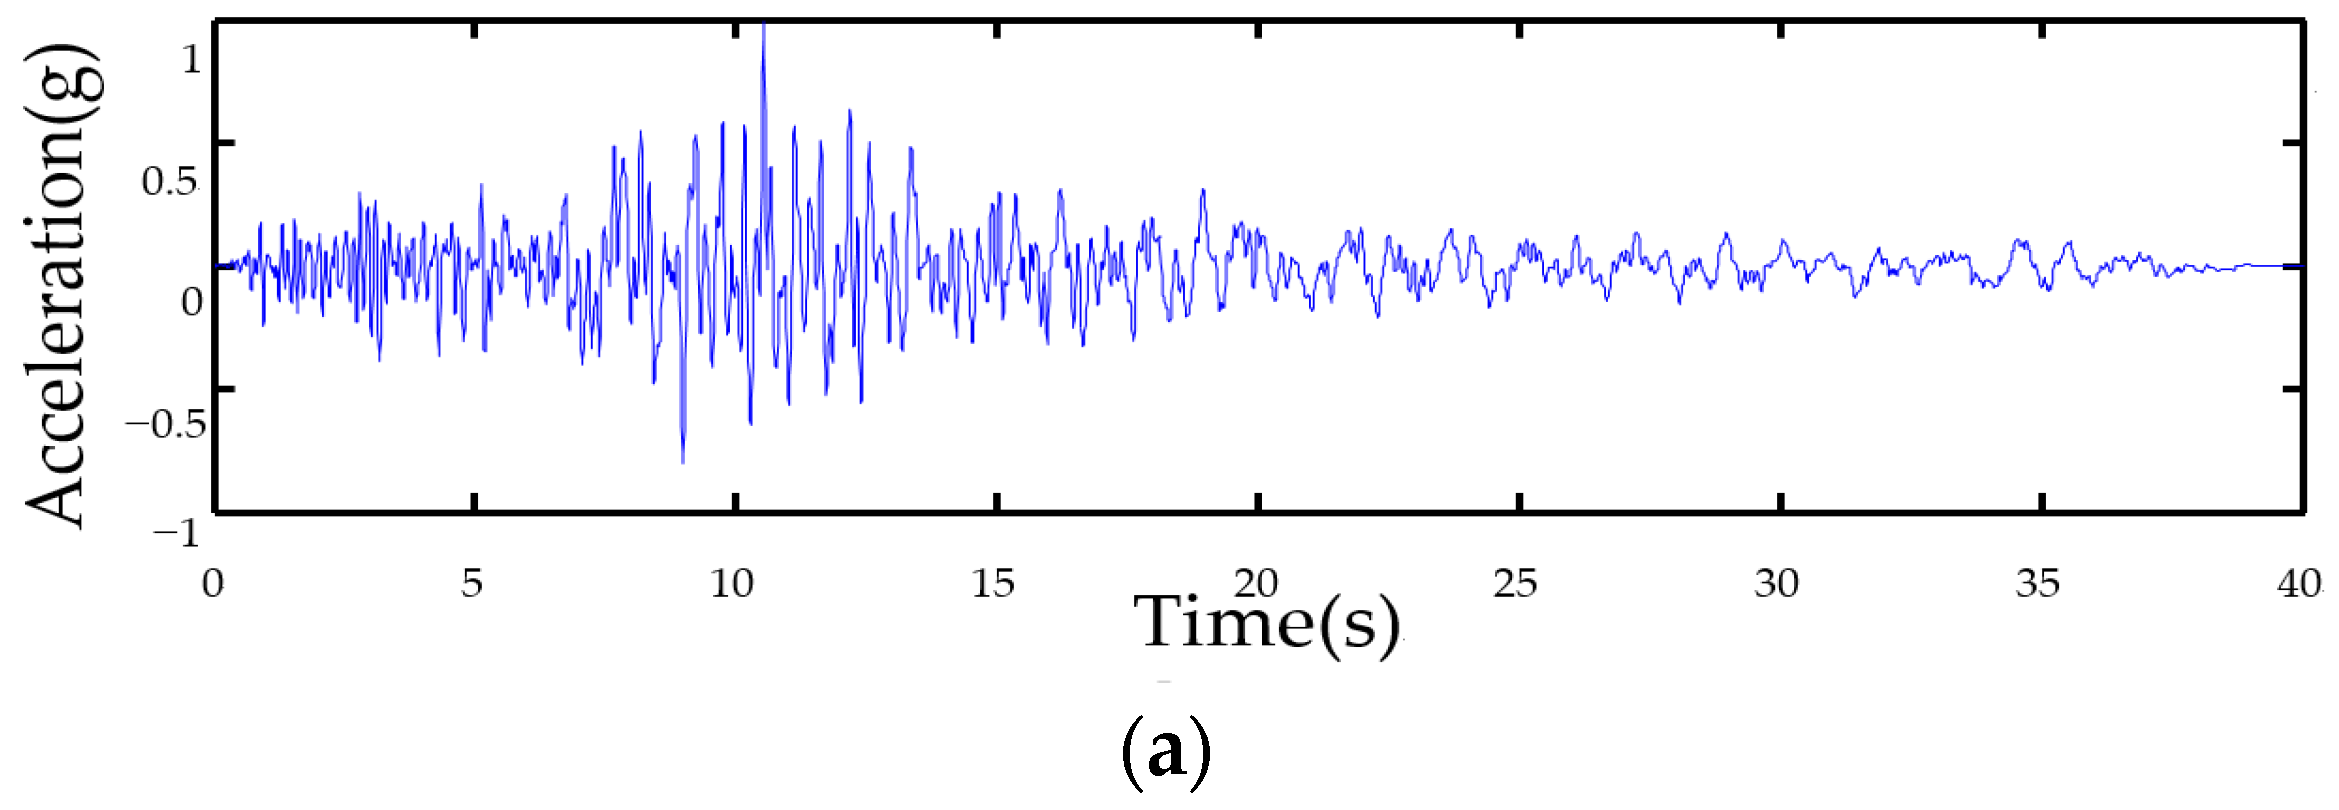
3.4. Loading History

According to the site conditions, fortification intensity, earthquake grouping, and other information about the project location, the shaking table test used two actual seismic waves (the Parkfield Vineyard strong-earthquake record of the 1983 Coalinga earthquake in the United States and the San Justo Dam strong-earthquake record of the 1984 Morgan Hill earthquake in the United States) and an artificially simulated acceleration time–history curve of seismic waves as the test input seismic waves based on the GB50011-2010. The time–history curves of the three seismic waves are shown in Figure 9. After selecting the seismic wave, researchers adjusted the peak value of each wave acceleration time–history curve based on the acceleration peak value and similarity that should be adopted for the prototype structure under the frequent level eight earthquakes specified in the GB50011-2010. In addition, based on the principle of dimensional coordination, the time of earthquake records should be compressed according to the similarity relationship.
According to GB50011-2010, there are three levels for the frequency of earthquakes occurring during the building lifetime: frequent earthquake (an earthquake intensity with a probability of exceeding about 63% within 50 years); basic earthquake (an earthquake intensity with a probability of exceeding about 10% within 50 years); and rare earthquake (an earthquake intensity with a probability of exceeding about 2% to 3% within 50 years). According to the design objectives of an artificially simulated acceleration time-history curve using seismic waves as the test input seismic waves based on the GB50011-2010 for seismic performance of structures, the prototype structure is designed to be basically undamaged under frequent level eight earthquakes, and the overall structure can be in the elastic stage. Under an eight-degree fortification earthquake, certain damage to the structure is allowed, and some components may undergo elastic–plastic deformation. Under a rare earthquake of eight degrees, the structure can undergo significant damage but not collapse, at which time most components undergo elastic–plastic deformation. The model components should avoid elastic–plastic deformation to verify the test plan by comparing the seismic response of the model before and after installing a viscous damper in the simulated mountain and analyzing the delay and amplification effect of seismic waves, so the test loading condition was limited to the frequent eight earthquake stage. In the test, the model structure was subjected to simulated earthquake loading in two stages in the order of frequent level eight earthquakes (SWD and A (seismic wave delay and amplification)) (Table 3) and white noise frequency scanning was performed on the model before and after the earthquake action input to test the dynamic characteristics of the structure.

4. Experimental Result and Analysis

4.1. Dynamic Characteristics

Through a white noise frequency sweep on the model before and after an earthquake of the same intensity, the natural frequencies of the model at different stages are obtained from the time–history data collected using the acceleration sensor (Table 4). The first two shaking modes of the model were translational in the X and Y directions and the third mode was torsional. The first-order natural shaking frequency was significantly smaller than the second order, indicating that the model stiffness was more significant in the Y direction than in the X direction. After experiencing the first frequent level eight earthquake, the natural frequency of the model did not change, indicating that the model was in an elastic state. After the second frequent level eight earthquake the natural frequency of the model decreased slightly, indicating that the model was still in an elastic state. Therefore, the model was in an initial state without damage before each seismic loading. Meanwhile, the seismic response test data of the model obtained before and after the seismic wave delay and amplification could be compared laterally.

4.2. Seismic Wave Delay and Amplification

Researchers could obtain the amplification and delay data generated by the maximum peak acceleration when the seismic wave passed through the simulated mountain and reached the top by analyzing the acceleration data collected by the acceleration sensors installed on the tabletop of the shaking table and on the top of the simulated mountain (Table 5). According to the analysis, among the three seismic waves, the maximum delay in the X direction was 0.44 s and the minimum delay was 0.33 s. The maximum value in the Y direction was 0.11 s and the minimum value was 0.06 s. The maximum acceleration amplification coefficient in the X direction was 1.84 and the minimum was 1.55. The maximum value in the Y direction was 1.76 and the minimum value was 1.54. The test results met the requirements of the test plan for providing a seismic wave delay of about 0.4 s in the X direction and amplifying the seismic wave peak acceleration at the top of the simulated mountain by 1.6 times. In general, the expected delay and amplification effect of the three seismic waves input in the test was achieved by installing viscous dampers on the simulated mountain.

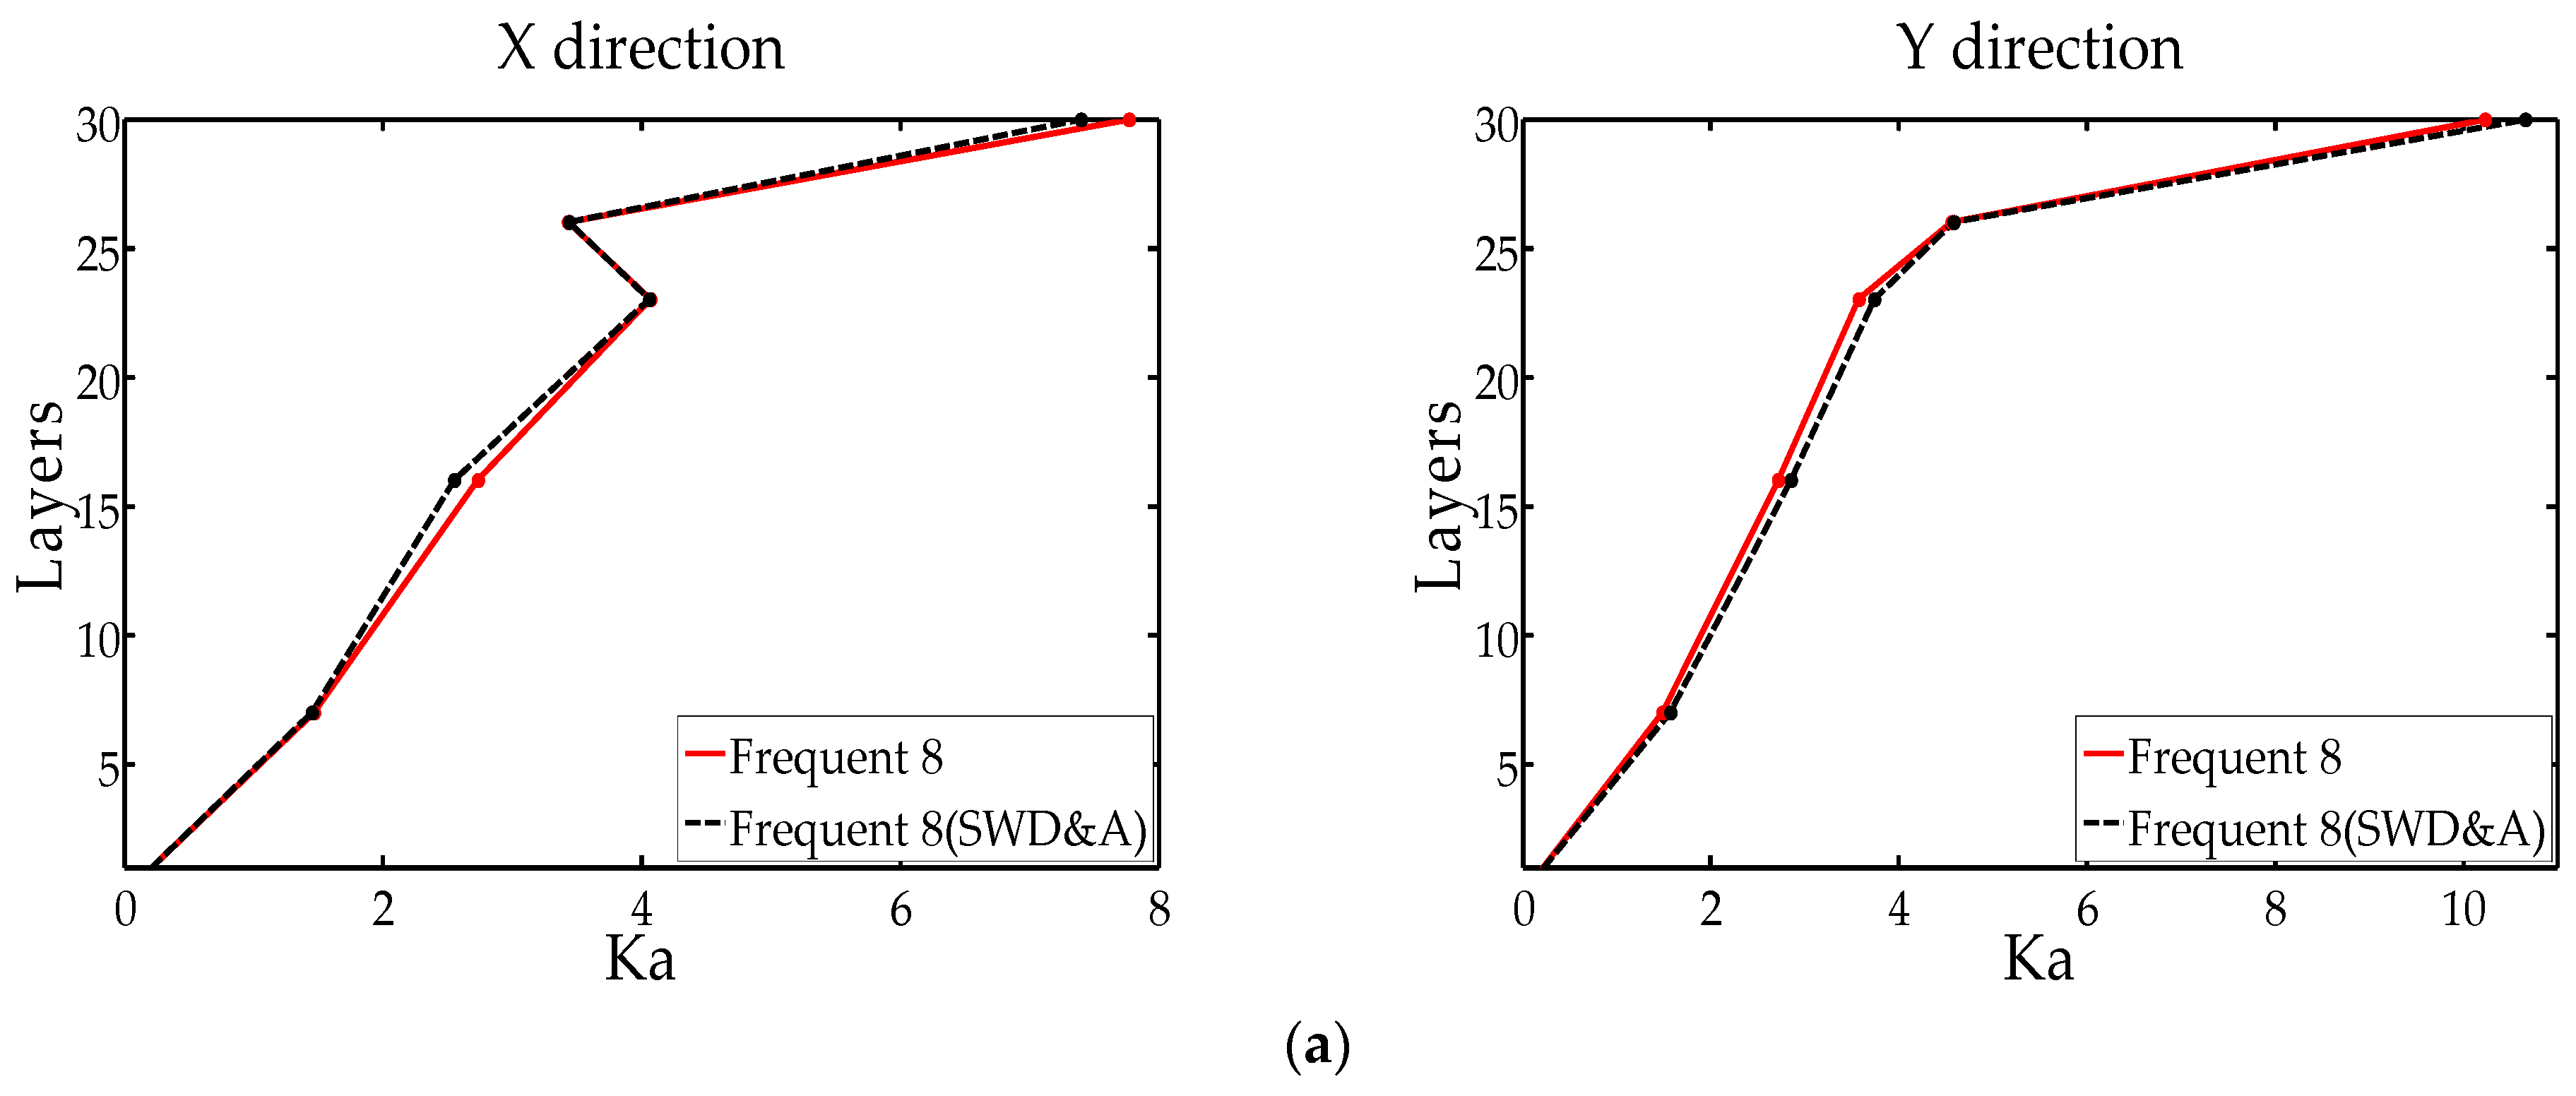
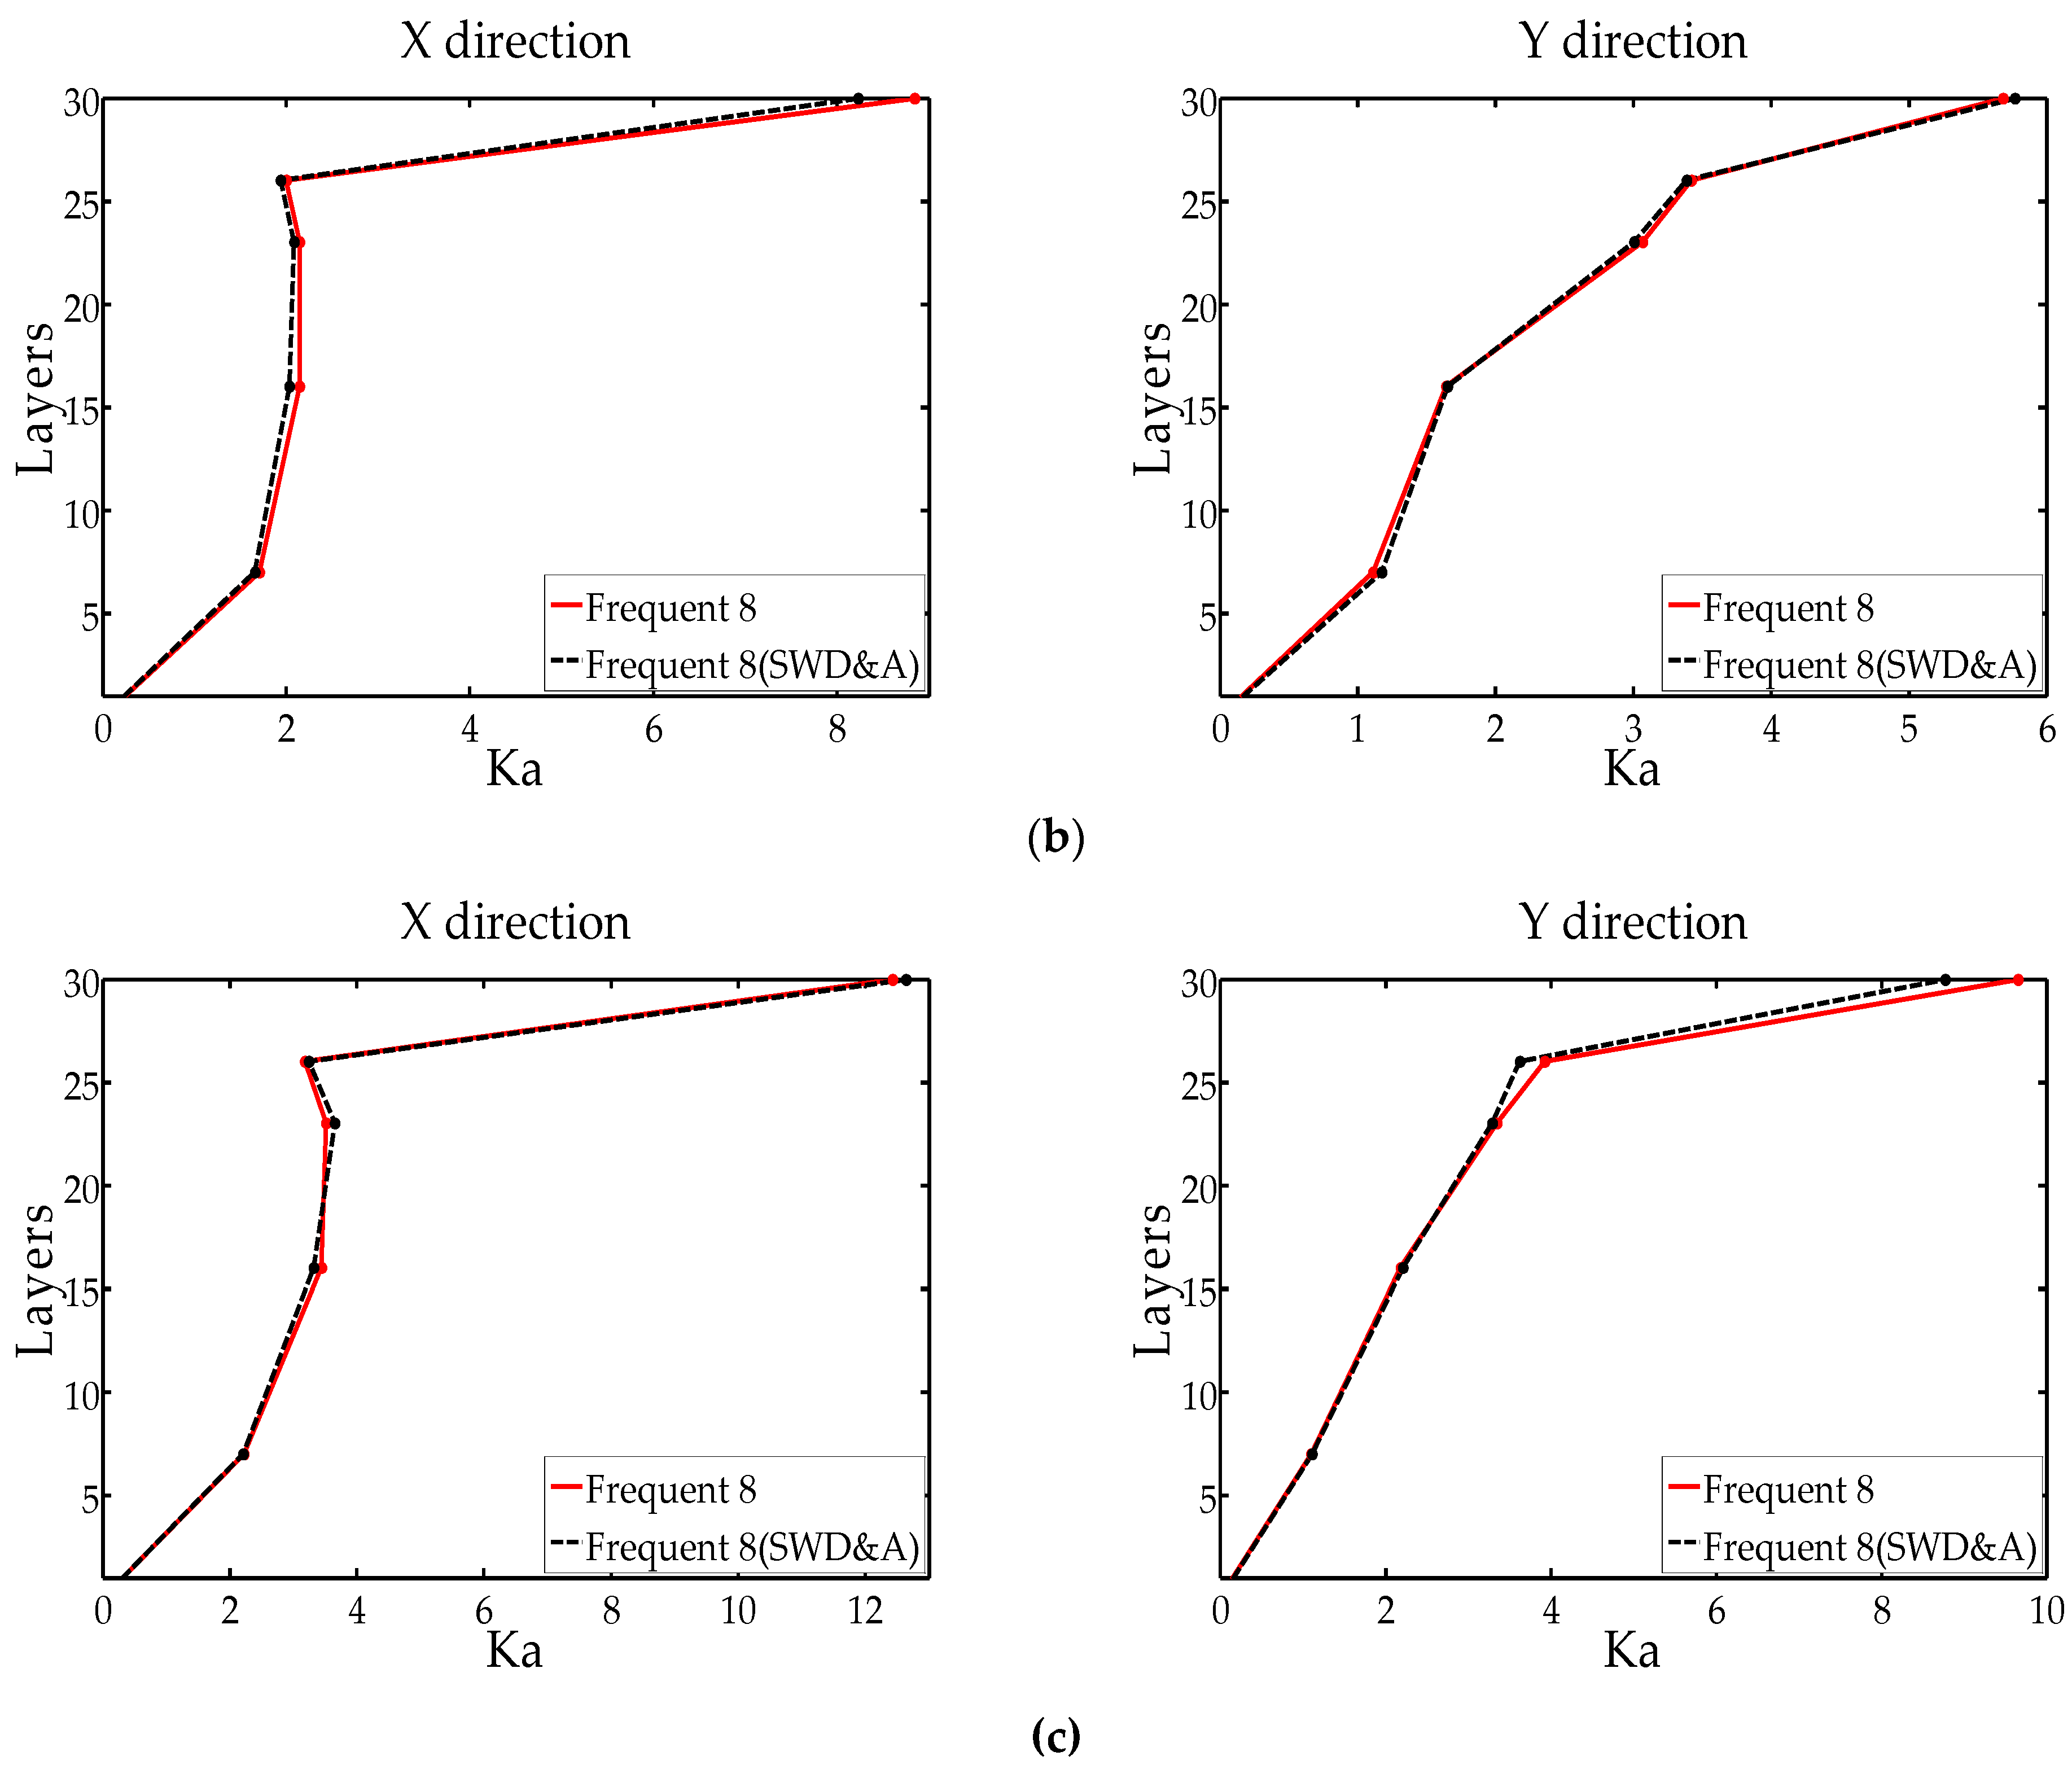
4.3. Acceleration Response

The acceleration response of the model is represented by the peak ratio of the acceleration of each floor to the acceleration of the table (acceleration amplification coefficient Ka). According to the data collected by each acceleration sensor, the change in the acceleration amplification coefficient Ka of the model under an earthquake is shown in Figure 10. Under the action of different seismic waves at the same level, the acceleration amplification coefficients of structures were different due to the differences in the spectral characteristics of seismic waves from different regions. However, the changing trend was basically consistent. The existence of steel truss structures caused sudden changes in the lateral stiffness of the structure along the height, resulting in a significant whip effect on the top structure and significant amplification of the top acceleration. Researchers found no significant changes in the X and Y directions under the action of three seismic waves by comparing the acceleration amplification coefficients of the model before and after the seismic wave delay and amplification. Furthermore, the maximum difference in the acceleration amplification coefficients of each floor was 5.48% (X direction) and 6.85% (Y direction), indicating that the seismic wave delay and amplification had no impact on the acceleration response of the structure.

4.4. Displacement Response

The displacement response of the model was obtained through quadratic integration of the data collected by the acceleration sensor. The maximum lateral displacement curve of the model relative to the table is shown in Figure 11. The result showed that the lateral displacement of the structure gradually increased with the enhancement of seismic action. The lateral displacement curve of the structure was relatively smooth in the shear wall structure, indicating that the lateral stiffness of the shear wall structure was evenly distributed along the height. The structure has been transformed into the steel truss structure since the 26th floor and there has been a significant change in lateral stiffness, resulting in a significant turning point in the curve on this floor. The X-direction floor lateral displacement increased after the seismic wave delay and amplification under the action of the Coalinga wave and the Mongan Hill wave. Meanwhile, the Coalinga wave floor lateral displacement increased by 41.40% at most, appearing on the 26th floor. The lateral displacement of the Mongan Hill wave floor increased by 77.10% at most, appearing on the 23rd floor. Under the action of artificial waves, the lateral displacement of seismic waves in the X direction decreased after amplification, with a maximum reduction of 26.54%, appearing on the 16th floor. For the Y-direction floor side shift, the difference between the data obtained by the three seismic waves before and after the delay and amplification was tiny, with a maximum difference of 9.57%. Since the amplification coefficients of seismic waves in the X and Y directions were basically the same, there were significant differences in seismic wave delay. Therefore, the difference between the X-direction and Y-direction floor lateral displacement changes was caused by the delay effect of seismic waves. In other words, seismic wave delay was dominant in influencing floor lateral displacement. In addition, due to the differences in seismic wave spectrum characteristics across regions, the lateral displacement of the X-direction floor increased and decreased, but the changing trend was consistent.

5. Test Results and Discussion

By analyzing the data collected by sensors installed in various parts of the model, the following main experimental results can be obtained:
  • The three seismic waves achieved the expected delay and amplification effect. Although the delay and amplification effect achieved by each seismic wave were different due to the different spectral characteristics, the differences in values were small. It indicates that the steel frame with viscous dampers have a significant delay and amplification effect on seismic waves;
  • There was no significant change in the acceleration amplification coefficient of the model before and after the seismic wave delay and amplification. It indicates that the delay and amplification of seismic waves has essentially no effect on the acceleration response of the structure;
  • The lateral displacement of the model in the X direction changed significantly before and after the delay and amplification of the seismic wave, while there was no significant change in the lateral displacement of the model in the Y direction. It shows that the delay of seismic waves has a great influence on the displacement response of the structure, while the amplification of seismic waves has little effect.

6. Conclusions

A high-rise steel frame structure with viscous dampers was designed in this paper and corresponding scaled models were made for verification by shaking table tests to solve the problem of simulating traveling wave effects and slope amplification effects when inputting seismic waves in shaking table tests of large-span structures in mountain areas. The following conclusions could be drawn for reference in subsequent shaking table tests and related research by analyzing the test data:
  • It was feasible to add viscous dampers to steel frame structures to amplify seismic waves in a delayed manner. The specific dimensions of steel frame members and the number of parameters of viscous dampers could be determined through finite element analysis and trial calculation based on the expected goals;
  • In the shaking table test, the model made from the original steel frame structure could also delay and amplify the seismic wave after adding a scaled viscous damper and could achieve the effect set in the test plan;
  • The acceleration response of the model under the frequent level eight earthquakes had no significant change before and after the seismic wave delay and amplification. The maximum difference in the acceleration amplification coefficient was 6.85%, indicating that the seismic wave delay and amplification had no impact on the acceleration of the structure;
  • The displacement response of the model in the X-direction under the frequent level eight earthquakes had significantly changed before and after the amplification of the seismic wave delay. The floor lateral displacement has increased by 77.10% at most, and the increase or decrease in the floor lateral displacement caused by the spectral differences of the three seismic waves were different. However, the displacement response in the Y direction had not changed and the floor lateral displacement had increased by 9.57%. From this, it could be judged that the delay effect of seismic waves significantly impacted the displacement response of the structure, while the amplification effect had almost no impact;
  • Limited by experimental conditions with only one model, this shaking table test only compared the dynamic response of the model in the elastic state before and after the seismic wave delay and amplification and did not involve the comparison of the dynamic response of the model in the elastic–plastic state.

Author Contributions

Conceptualization, L.S. and Y.B.; methodology, Z.L.; software, L.S.; validation, Y.B. and Z.L.; formal analysis, L.S.; investigation, L.S.; resources, Y.B.; data curation, Z.L.; writing—original draft preparation, L.S.; writing—review and editing, L.S.; visualization, Z.L.; supervision, Y.B.; project administration, Y.B. All authors have read and agreed to the published version of the manuscript.

Funding

This research received no external funding.

Institutional Review Board Statement

Not applicable.

Informed Consent Statement

Not applicable.

Data Availability Statement

Not applicable.

Conflicts of Interest

The authors declare no conflict of interest.

References

  1. Ko, D.; Lee, H. Shaking table tests on a high-rise RC building model having torsional eccentricity in soft lower storeys. Earthq. Eng. Struct. Dyn. 2006, 35, 1425–1451. [Google Scholar] [CrossRef]
  2. Lu, X.; Zou, Y.; Lu, W.; Zhao, B. Shaking table model test on Shanghai World Financial Center Tower. Earthq. Eng. Struct. Dyn. 2007, 36, 439–457. [Google Scholar] [CrossRef]
  3. Lu, X.; Chen, L.; Zhou, Y.; Huang, Z. Shaking table model tests on a complex high-rise building with two towers of different height connected by trusses. Struct. Design Tall Spec. Build. 2009, 18, 765–788. [Google Scholar] [CrossRef]
  4. Xu, Z.; Xu, P.; Xiao, C. A study on the seismic performance of steel-reinforced concrete frame-concrete core wall high-rise mixed structure by large-scale shaking table tests and numerical simulations. Earthq. Eng. Struct. Dyn. 2013, 42, 1951–1969. [Google Scholar] [CrossRef]
  5. Chen, S.; Ge, K.; Xue, W.; Lin, Y.; Lin, G. Shaking table model test and numerical analysis of a long-span cantilevered structure. Struct. Design Tall Spec. Build. 2018, 27, 1478. [Google Scholar] [CrossRef]
  6. Guo, W.; Zhai, Z.; Wang, H.; Liu, Q.; Xu, K.; Yu, Z. Shaking table test and numerical analysis of an asymmetrical twin-tower super high-rise building connected with long-span steel truss. Struct. Design Tall Spec. Build. 2019, 28, 1630. [Google Scholar] [CrossRef]
  7. Léger, P.; Idé, I.M.; Paultre, P. Multiple-support seismic analysis of large structures. Comput. Struct. 1990, 36, 1153–1158. [Google Scholar] [CrossRef]
  8. Heredia-Zavoni, E.; Leyva, A. Torsional response of symmetric buildings to incoherent and phase-delayed earthquake ground motion. Earthq. Eng. Struct. Dyn. 2003, 32, 1021–1038. [Google Scholar] [CrossRef]
  9. Meng, Q.; Yin, X. The Study on 3D Seismic Pounding of the High-Pier Bridge Under Strong Earthquake. In Proceedings of the Sixth China-Japan-US Trilateral Symposium on Lifeline Earthquake Engineering, Chengdu, China, 28 May–1 June 2013; pp. 377–384. [Google Scholar] [CrossRef]
  10. Yan, K.; Wang, L.; Jiang, H.; Zhu, J. Traveling Wave Effect Analysis of Long-Span Suspension Cable Pipeline Aerial Crossing Structure Based on Capacity to Demand Ratio. In Proceedings of the Seventh China-Japan-US Trilateral Symposium on Lifeline Earthquake Engineering, Shanghai, China, 1–4 June 2016; pp. 345–351. [Google Scholar] [CrossRef]
  11. Yu, X.; Wang, C.; Jiang, H. Influence Analysis of Traveling Wave Effect on Rail Interaction of Long-Span Suspension Bridge. Appl. Sci. 2022, 12, 12368. [Google Scholar] [CrossRef]
  12. Wang, G.; Ba, F.; Miao, Y.; Zhao, J. Design of multi-array shaking table tests under uniform and non-uniform earthquake excitations. Soil Dyn. Earthq. Eng. 2022, 153, 107–114. [Google Scholar] [CrossRef]
  13. Gao, C.; Yuan, X. Development of the shaking table and array system technology in China. Adv. Civ. Eng. 2019, 2019, 8167684. [Google Scholar] [CrossRef]
  14. Chen, Y.; Zhang, Y.; Yan, W.; Li, Y. Scaled dynamic model design and shaking table test of viaduct. J. Vib. Meas. Diagn. 2014, 34, 321–329+400. [Google Scholar] [CrossRef]
  15. He, L.; Shrestha, B.; Hao, H.; Bi, K.; Ren, W. Experimental and three-dimensional finite element method studies on pounding responses of bridge structures subjected to spatially varying ground motions. Adv. Struct. Eng. 2017, 20, 105–124. [Google Scholar] [CrossRef]
  16. Du, W.; Wang, G. Ground motion selection for seismic slope displacement analysis using a generalized intensity measure distribution method. Earthq. Eng. Struct. Dyn. 2018, 47, 1352–1359. [Google Scholar] [CrossRef]
  17. Song, J.; Rodriguez-Marek, A.; Feng, T.; Ji, J. A generalized seismic sliding model of slopes with multiple slip surfaces. Earthq. Eng. Struct. Dyn. 2021, 50, 2595–2612. [Google Scholar] [CrossRef]
  18. Guo, L. Study on the Influence of Multi-Point Excitation Traveling Wave Effect on Jiuxiang Diehong Ladder Project. Master’s Thesis, Kunming University of Science and Technology, Kunming, China, March 2021. [Google Scholar]
  19. Shabani, M.; Shamsi, M.; Ghanbari, A. Dynamic response of three-dimensional midrise buildings adjacent to slope under seismic excitation in the direction perpendicular to the slope. Int. J. Geomech. 2021, 21, 11. [Google Scholar] [CrossRef]
  20. Qi, S.; He, J.; Zhan, Z. A single surface slope effects on seismic response based on shaking table test and numerical simulation. Eng. Geol. 2022, 306, 106762. [Google Scholar] [CrossRef]
  21. Xiao, W.; Liao, J.; Zhang, L. Shaking table test on seismic dynamic responses of isolated mountains. China Earthq. Eng. J. 2022, 40, 582–590. [Google Scholar]
  22. Fan, G.; Zhang, J.; Wu, J.; Yan, K. Dynamic Response and Dynamic Failure Mode of a Weak Intercalated Rock Slope Using a Shaking Table. Rock Mech. Rock Eng. 2016, 49, 3243–3256. [Google Scholar] [CrossRef]
  23. GB 18306-2015; Seismic Ground Motion Parameter Zonation Map of China. Seismological Press: Beijing, China, 2015.
  24. GB 50011-2010; Code for Seismic Design of Buildings. 2016 ed. Architecture and Industry Press: Beijing, China, 2016.
  25. Harris, H.; Sabnis, G. Structural Modeling and Experimental Techniques, 2nd ed.; CRC Press: Boca Raton, FL, USA, 1999. [Google Scholar]
Figure 1. A large-span structure in mountain area.
Applsci 13 06728 g001
Figure 2. Layout plan of the shear wall structure: (a) 1–6 layers of base and (b) 7–25 floors.
Applsci 13 06728 g002
Figure 3. Layout of the shear wall structure: (a) 26 floor plan and (b) elevation.
Applsci 13 06728 g003aApplsci 13 06728 g003b
Figure 4. Perspective view of the structure.
Applsci 13 06728 g004
Figure 5. Structural supports. The red box represents a group of supports at the same elevation.
Applsci 13 06728 g005
Figure 6. Steel frame structure and original structure.
Applsci 13 06728 g006
Figure 7. Model production process: (a) reinforcement cage binding of shear wall structure; (b) welding of steel truss structure; (c) concrete pouring of shear wall structure; and (d) model production completed.
Applsci 13 06728 g007
Figure 8. Installation of viscous dampers: (a) scaled viscous damper and (b) steel frame with viscous dampers.
Applsci 13 06728 g008
Figure 9. Seismic wave time history curve: (a) Coalinga wave; (b) Morgan Hill wave; and (c) artificial wave.
Applsci 13 06728 g009aApplsci 13 06728 g009b
Figure 10. Model acceleration response: (a) Coalinga wave; (b) Morgan Hill wave; and (c) artificial wave.
Applsci 13 06728 g010aApplsci 13 06728 g010b
Figure 11. Model displacement response: (a) Coalinga wave; (b) Morgan Hill wave; and (c) artificial wave.
Applsci 13 06728 g011
Table 1. Seismic wave time delay and acceleration amplification.
Seismic WaveTime Delay (s)Acceleration Amplification
AW1-X direction0.361.39
AW1-Y direction0.061.44
AW2-X direction0.511.72
AW2-Y direction0.111.65
AW3-X direction0.451.56
AW3-Y direction0.071.83
AW4-X direction0.431.48
AW4-Y direction0.061.58
AW5-X direction0.381.66
AW5-Y direction0.051.42
Average value in X direction0.431.56
Average value in Y direction0.071.58
Table 2. Main similarity scaling factors.
ParameterRelationScaling Factors
LengthSL0.025
Elastic modulusSE0.2
AccelerationSa1.8
DensitySρ = SE/(SaSL)4.44
StressSσ = SE0.2
MassSm = SρSL30.0000694
Concentrated forceSF = SσSL20.000125
FrequencySf = (Sa/SL)0.58.485281
Table 3. Seismic Loading Cases.
PhaseSeismic WaveInput DirectionInput PGA(g)
White noise/X, Y0.11, 0.11
Frequent 8CoalingaX0.20
Y0.20
Morgan HillX0.20
Y0.20
Artificial waveX0.20
Y0.20
White noise/X, Y0.11, 0.11
Frequent 8
(SWD and A)
CoalingaX0.20
Y0.20
Morgan HillX0.20
Y0.20
Artificial waveX0.20
Y0.20
White noise/X, Y0.11, 0.11
Table 4. Model dynamic characteristics.
Phase Model Order
1st2nd3rd
InitialFrequency (Hz)4.8314.2416.46
Degradation rate///
After frequent 8Frequency (Hz)4.8314.2416.46
Degradation rate///
After frequent 8
(SWD and A)
Frequency (Hz)4.8114.2316.46
Degradation rate0.6%0.1%/
Table 5. Model seismic wave delay and amplification.
Sensor LocationCoalinga WaveMorgan Hill WaveArtificial Wave
XYXYXY
Moment of maximum peak acceleration of seismic waves (s)Top of the shaking table 5.835.605.686.277.285.75
Top of the simulated mountain6.275.716.036.367.615.81
Time Delay(s)0.440.110.350.090.330.06
Maximum peak acceleration of seismic waves (m/s2)Top of the shaking table 2.191.872.131.902.061.85
Top of the simulated mountain3.743.293.912.933.192.99
Acceleration amplification1.711.761.841.541.551.62
Disclaimer/Publisher’s Note: The statements, opinions and data contained in all publications are solely those of the individual author(s) and contributor(s) and not of MDPI and/or the editor(s). MDPI and/or the editor(s) disclaim responsibility for any injury to people or property resulting from any ideas, methods, instructions or products referred to in the content.

