Article

Shaping the Properties of Osmo-Dehydrated Strawberries in Fruit Juice Concentrates

Department of Food Engineering and Process Management, Institute of Food Sciences, Warsaw University of Life Sciences—SGGW, 02-776 Warsaw, Poland
*
Authors to whom correspondence should be addressed.
Appl. Sci. 2023, 13(4), 2728; https://doi.org/10.3390/app13042728
Submission received: 10 January 2023 / Revised: 13 February 2023 / Accepted: 18 February 2023 / Published: 20 February 2023
(This article belongs to the Special Issue Drying Technologies in Food Processing)

Abstract

:

Featured Application

Fruit juice concentrates can be used as an alternative osmotic agent to enrich fruits with naturally occurring sugars as well as bioactive compounds. This has a positive effect on the nutritional value of osmodehydrated fruits compared with samples dehydrated in a sucrose solution. The use of a strawberry or cherry fruit concentrate has a positive effect on the color of osmotically dehydrated strawberries, while chokeberry juice concentrate has a specific strong sensory profile, which is passed to osmodehydrated strawberries.

Abstract

The growing interest in high-quality food leads to looking for new solutions in the production of natural fruit snacks. Osmotic dehydration is one of the processes, which can be used to obtain a minimally processed product as well as to give it specific characteristics. Usually, a sucrose solution is used as an osmotic agent; however, the use of chokeberry, strawberry, or cherry juice concentrates can be beneficial in the process of the osmotic dehydration of fruits. The process of the dehydration of strawberries with the use of fruit juice concentrates (chokeberry, strawberry, or cherry) and a sucrose solution as a standard was carried out at a temperature of 30 °C for 3 h. The kinetics of the processes (weight reduction, water loss, and solid gain) were evaluated as well as physical (water activity, color parameters L*, a*, b*, ΔE, texture with maximum force and compression work, and structure) and chemical properties (dry matter content, total polyphenols content, total anthocyanin content, vitamin C, antioxidant activity with DPPH and ABTS radicals, spectral analysis with FTIR method, sucrose, glucose and fructose content, and thermal decomposition with TG analysis). The use of fruit juice concentrates positively influences the enrichment of the final product with bioactive compounds, such as anthocyanin and vitamin C. Strawberry and chokeberry juice concentrates have proven to be good hypertonic media for increasing the antioxidant activity of dehydrated fruit. Moreover, the use of fruit concentrates has a positive effect on the sugar profile of dehydrated strawberries.

1. Introduction

Strawberries are willingly eaten due to their characteristic aroma, taste, and low energy value (about 32 kcal/100 g) and are rich in bioactive compounds, such as polyphenols [1,2], as well as micronutrients, such as potassium, phosphorus, magnesium, iron, zinc, calcium, manganese, and dietary fiber. The nutritional and health aspects of strawberry fruits are related to the presence of polyphenol compounds. These compounds, especially the anthocyanins present in the predominant amount in strawberries, and vitamin C, create the antioxidant potential of these fruits [1,3]. Bojarska et al. [4] showed that the total content of phenolic compounds in terms of gallic acid equivalents (GAE) ranged from 5300 mg GAE/100 g d.m. in strawberries of Kent and Kama cultivars to over 8000 mg GAE/100 g d.m. in Polka and Elsanta cultivars. Furthermore, the content of anthocyanins ranged from 29.5 in fruits of the Kent variety to 79.3 mg/100 g d.m. in fruits of the Honeoye cultivar, while the antioxidant activity was in the range of 44.8 to 62.9%, depending on the cultivar. In addition, the studied strawberries contained condensed tannins ranging from 977.2 in Kent varieties to 2356.4 mg/100 g d.m. in fruits of the Honeoye cultivar. These compounds have antiviral, anti-inflammatory, anticancer, and antibacterial effects.
The content of natural biocomponents in processed fruits is influenced by various treatments. Salazar-Orbea et al. [5] showed that different processing techniques and conditions affect the phenolic properties, color, and sensory characteristics of strawberries. In the case of freezing, thermal treatment, and high-pressure processing of strawberries, the mild thermal treatment showed similar patterns for most phenolic groups: an increase in proanthocyanidins, no change in ellagic acid conjugates, and a major decrease in flavonols and anthocyanins. Based on the available scientific literature, Langston et al. [6] presented their views and knowledge on the conditions for retaining polyphenols. The retention and stability of polyphenols depend on the pH and the presence of other compounds, e.g., those capable of forming colored and colorless derivatives with anthocyanins and substances such as oxygen or metal ions that catalyze oxidation processes and accelerate irreversible degradation processes.
Osmotic dehydration is used to remove water in the direction of food preservation and also to modify the chemical composition and sensory properties. Multidirectional mass exchange is used. After immersing the material in a highly concentrated osmotic solution, cell sap flows from the fruit tissue into this solution, e.g., a stream of water and some substances dissolved in it (organic acids, reducing sugars, dyes, vitamins, and aromas). Efforts are made to limit the loss of these substances. Moreover, the components of the osmotic solution penetrate the dehydrated material, which can eliminate the losses of natural components of the dehydrated material and even increase their content through enrichment with the use of appropriate osmotic media [7,8]. Therefore, the selection of process conditions, in particular the type of osmotic substance, is extremely important in shaping the properties of dehydrated products, both nutritional value and sensory quality.
Sucrose is a very useful and popular substance used for the osmotic dehydration of fruits. However, the need to limit its consumption in the daily diet is the reason for the search for other osmotic substances. Piasecka et al. [9] demonstrated the possibility of replacing 50% of sucrose with fructooligosaccharides with prebiotic activity, which resulted in a reduction of over 22% of the energy value of sugars contained in dehydrated currants and cherries. Attempts have been made to use polyalcohols, e.g., xylitol, maltitol, and erythritol [10]. Another sucrose substitute is isomaltulose, called palatinose, which is a reducing disaccharide found naturally in honey and sugarcane juice. The taste of this compound is similar to sucrose but has a lower sweetness (42%) [11]. Kaur et al. [12] compiled examples of studies using unconventional natural sweeteners such as honey, jaggery, coconut sugar, stevia, and beet molasses as osmotic agents. Many studies [7,8,13,14,15,16] have shown the beneficial use of concentrated fruit or vegetable juices as osmoactive media for osmotic dehydration and at the same time enrichment of plant materials. Concentrates with a soluble solid content (SSC) of about 70% are obtained from fresh or frozen fruit or vegetables without the addition of chemical preservatives. Juices (concentrates) contain sugars, mainly fructose and glucose, but also other native substances with different molecular sizes.
Mass transfer during osmotic dehydration is highly dependent on the type of dehydrating medium, temperature, and time. Increasing the temperature increases the mass transfer rate. However, too high a temperature may cause unfavorable changes in the dehydrated material related to a decrease in the content of components sensitive to temperature increase. When optimizing the process conditions, the principle that the dewatering time is shortened at high temperatures is applied. More often, the dehydration temperature is moderate, typically in the range of 40–50 °C [6,10]. Among the many benefits presented by Chavan [17], the possibility of using a mild heat treatment conducive to preserving color and taste deserves attention, because the product has favorable organoleptic properties. Furthermore, various techniques are also used for osmotic dehydration to increase the efficiency of mass transfer by partially damaging the structure of the material, for example, the use of a pulsed electric field [18], ultrasound [19], reduced pressure [20], or microwave [13].
The aim of the study was to check the suitability of concentrated fruit juices as osmotic agents that could replace sucrose as a more attractive osmotic solution. In addition, the use of fruit juice concentrates was intended to increase the nutritional value and naturalness of the product, which can be offered as a snack with high nutritional and health-promoting values. The research hypothesis assumes that the use of fruit concentrates during the osmotic dehydration of strawberries will have a positive effect on shaping the properties of osmodehydrated strawberries, including the content of bioactive compounds.

2. Materials and Methods

2.1. Materials

The research material was strawberry fruits of the Vivara variety, which were bought from an organic farm. The material was cut into 5 mm slices, then subjected to the process of osmotic dehydration with the use of concentrated fruit juices from cherry, strawberry (producer Białuty, Poland), and chokeberry (producer Gomar, Pinczów, Poland).

2.2. Osmotic Dehydration Process

The osmotic dehydration of strawberries was carried out in three 50% concentrates: strawberry, chokeberry, and cherry. The characteristics of the used osmotic solutions are presented in Table 1. The control sample consisted of fruits dehydrated in a 50% sucrose solution. Dehydration kinetics were conducted at 30 °C for 3 h (parameters chosen on the preliminary studies). The mass rate of material to the osmotic solution was 1:4. The VSLB18 water bath (VWR International, Radnor, PA, USA) with a shaking amplitude of 4 was used for the osmotic process. The experiment was performed in duplicate. The analysis of the kinetics of osmotic dehydration was carried out on the basis of weight reduction (%), water loss WL (g/g initial dry matter i.d.m.), and solid gain increase SG (g/g i.d.m.) [10].

2.3. Physical Analyses

2.3.1. Dry Matter Content

The dry matter content (DM) of strawberries was analyzed on fresh strawberries and after the osmotic dehydration process. The measurement was made using the dryer method in accordance with AOAC 920.15, 2002 [21]. The crushed material was weighed with an accuracy of 0.0001 g into glass weighing bottles and dried in a laboratory drier (SLW 115 dryer, Pol-Eko, Wodzisław Śląski, Poland) at 70 °C to a constant weight. The percentage of dry substance was calculated from the difference in weight before and after the process. The assay was carried out in 4 replicates for each material.

2.3.2. Water Activity

Water activity (aw) was measured using an Aqualab 4 TE (Decagon, Pullman, WA, USA) at 25 °C [22]. Water activity was measured in triplicate.

2.3.3. Color

The color measurement was carried out by reflection using a CR-5 colorimeter (Konica Minolta Bench-top, Japan). Color component values were recorded in the CIE L* a* b* system [23]. A standard D65 light source, 2° observer, and 3 mm measuring diameter were used. The proper tests were preceded by calibration using a white and black reference plate. Furthermore, the total color difference was calculated on the basis of the L*, a*, and b* parameters in comparison to fresh material. The test was performed in at least 10 replicates for each sample.

2.3.4. Texture Analysis

Texture measurement was carried out on the basis of a compression test performed using the TA-XT2i Texture Analyzer (Stable Micro System, UK) device at room temperature 20 ± 2 °C [24]. The compressive force was recorded using the Texture Export computer program (for Windows). The strawberries were compressed at a constant speed of 20 mm/min until a 25% deformation of their initial height was obtained. The maximum force (Fmax) and compressive work of the dehydrated samples were determined. The test was performed in at least 10 replicates for each sample.

2.3.5. Structure (Scanning Electron Microscopy (SEM))

The dried material was glued to a metal table and sputtered with a 5 mm layer of gold (Leica EM ACE200; Leica Mikrosysteme GmbH, Vienna, Austria). The cross-section observations were carried out using a Phenom XL (Thermo Fisher Scientific, Waltham, MA, USA) scanning electron microscope under an accelerating voltage of 10 kV and a chamber pressure of 60 Pa. At least 4 photos were taken for the section and at least 6 photos of the surface of each sample using 200× magnification.

2.4. Chemical Analyses

2.4.1. Extract Preparation

The dried material was ground in an analytical mill (IKA A11 basic; IKA-Werke GmbH, Staufen, Germany). A 0.3 g of the sample was extracted with 10 mL of a mixture of 80% ethyl alcohol and 0.1 M hydrochloric acid (85:15, v/v). The process was carried out in the dark at 20 °C for 12 h on a shaker (Multi Reax, Heidolph Instruments, Schwabac, Germany). The solution was centrifuged for 2 min at 4350 rpm in a laboratory centrifuge (MegaStar 600, VWR). Two extracts were made for each sample.

2.4.2. Total Polyphenol Content (TPC)

Total polyphenol content was determined using a plate reader (Multiskan Sky, Thermo Electron Co., Waltham, MA, USA). A 10 µL of sample extract, 10 µL of distilled water, and 40 µL of Folin Ciocalteu reagent (diluted 5-fold) were mixed in the well [25]. After 3 min, 250 µL supersaturated sodium carbonate was added. The mixtures were incubated at 25 °C for 1 h. The quantitative content of total polyphenols was determined by measuring the absorbance of the reaction mixture at a wavelength of 750 nm and using a calibration curve prepared for chlorogenic acid (0–100 ug/mL). The analysis was performed in duplicate.

2.4.3. Total Anthocyanins Content (TAC)

The differential pH method was used to determine the content of anthocyanin monomers in the samples [26]. A total of 30 µL of sample extract and 135 µL of buffer (pH1: 0.025 M potassium chloride and pH 4.5: 0.4 M sodium acetate) were mixed in the reaction well. The mixture was incubated at 25 °C for 20 min and then absorbances were measured at 510 and 700 nm. The result was expressed in mg cyanide 3-glucoside per 1 g d.m. The analysis was performed in duplicate.

2.4.4. Vitamin C

The vitamin C was measured with the ultra-performance liquid chromatography. The H-Class UPLC system with a PAD detector (Waters, Milford, MA, USA) was used to determine the content of ascorbic acid [1]. A total of 0.05 g of the ground material was extracted with 10 mL cooled solution (3% meta-phosphoric acid, 8% acetic acid, 1 mM EDTA) for 10 min and centrifuged (4350 rpm, 5 °C, 5 min). The supernatant was passed through a syringe filter (0.2 um, GHP Acrodisc, Pall Corporation, Port Washington, NY, USA) and, after 2-fold dilution with the eluent, was analyzed. Separation was carried out on a Waters HSS T3 column (100 mm × 2.1 mm, 1.8 μm) for 5 min at 35 °C with a mobile phase flow rate of 0.25 mL/min (0.1% formic acid in Milli-Q water). The quantitative content of ascorbic acid was determined by analyzing the spectrum at 245 nm and using the calibration curve for the L(-) ascorbic acid standard.

2.4.5. Antioxidant Activity (AA)

The antioxidant activity of the dried material was determined using ABTS and DPPH solutions of free radicals [1]. The working solutions were diluted with 80% ethyl alcohol to obtain an absorbance in the range of 0.680–0.720 at 734 nm (ABTS) and 515 nm (DPPH). A total of 10 µL of the sample extract and 250 µL of the radical working solution were mixed in a 96-well plate and incubated at 25 °C. After 6 min for ABTS and 30 min for DPPH, the absorbance of the solutions was measured. The degree of radical scavenging was determined. The results were expressed in mg of Trolox per g dry substance of the sample.

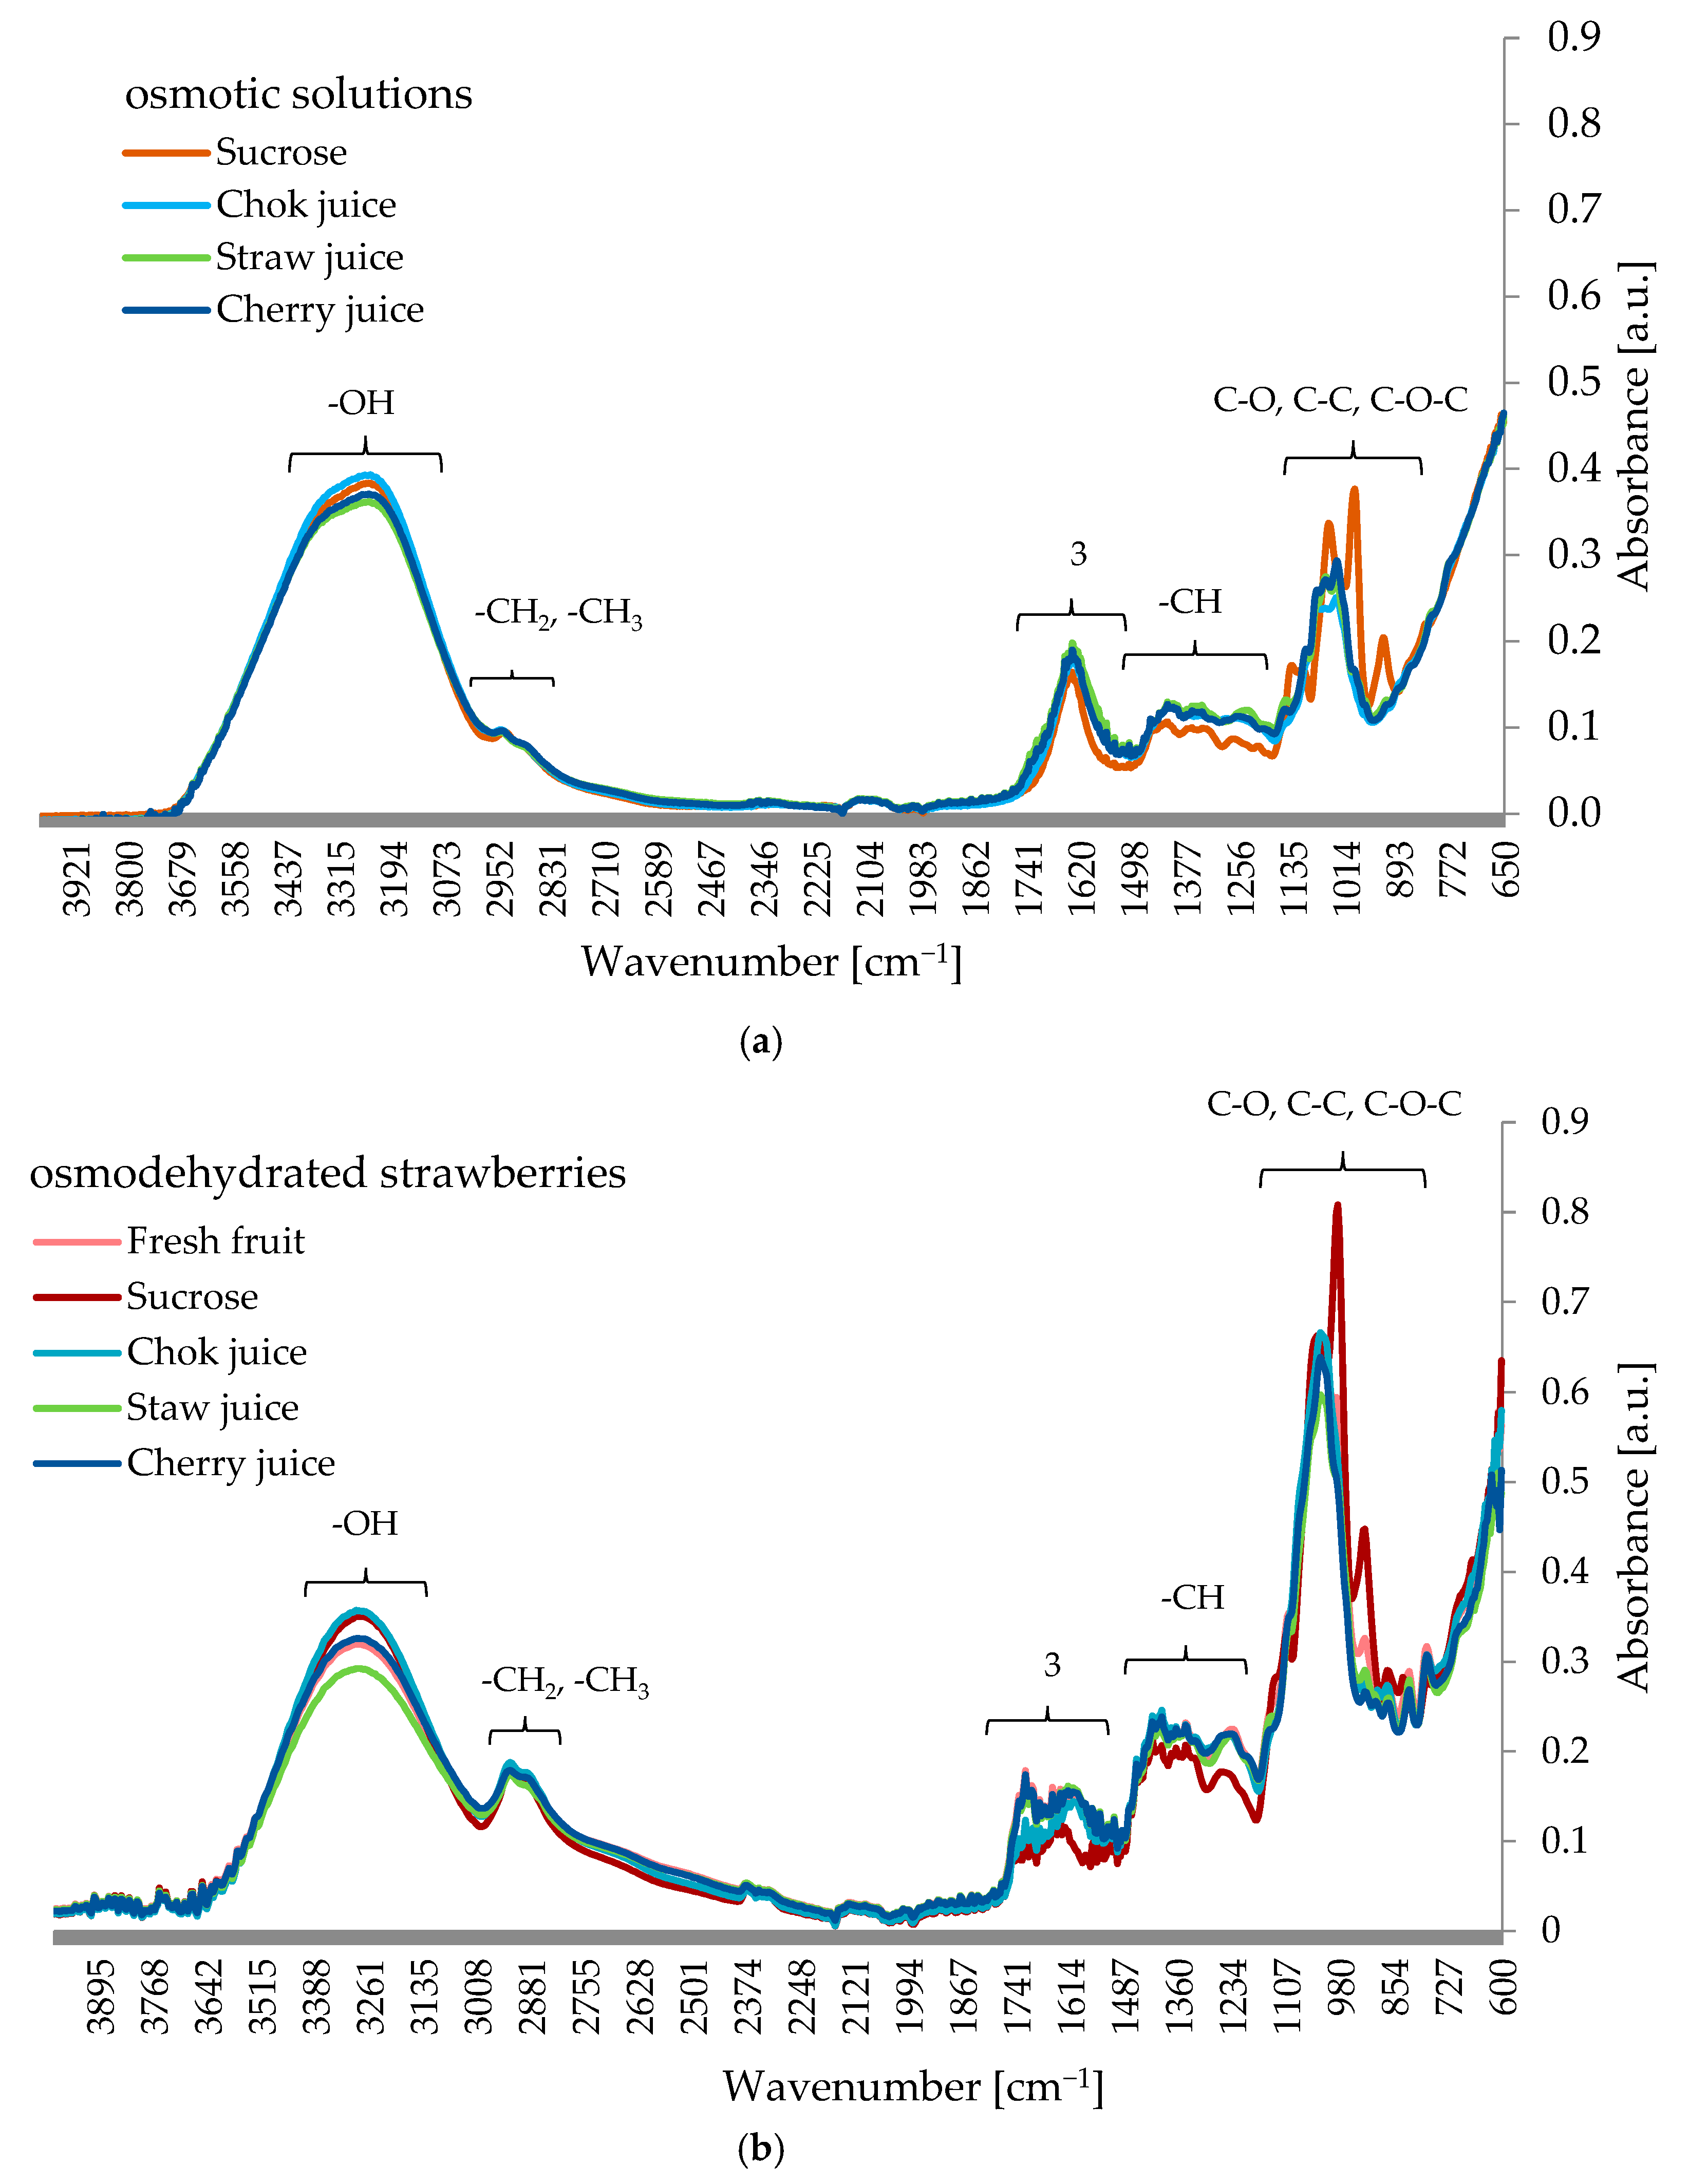
2.4.6. Fourier Transform Infrared Spectroscopy (FTIR)

Infrared spectra of the dried samples were collected using a Cary 630 spectrometer (Agilent Technologies Inc., Santa Clara, CA, USA) with a diamond ATR. The analysis was carried out in the wavelength range of 650–4000 cm−1, with a resolution of 4 cm−1, with 32 scans per sample [27]. A background spectrum was collected before each sample scan. Spectrum processing was performed using MicroLab PC software (Agilent Technologies Inc., Santa Clara, CA, USA). The analyses were performed in triplicate.

2.4.7. Sugar Content

Sugar content was determined using a high-performance liquid chromatograph with a refractive index (RI) detector (Waters, Milford, MA, USA). The separation was carried out on a Sugar-Pak I column thermostated at 90 °C, with a mobile phase flow (Milli-Q water) of 0.6 mL/min [1]. The homogenized material (ca. 0.3 g) was diluted with 10 mL of water (resistivity 18.2 MΩ·cm) at 80 C and extracted at 25 °C for 4 h. The solution was centrifuged (4350 rpm, 5 min), filtered through a syringe filter (Millex-FG, 0.20 μm, 25 mm, hydrophobic PTFE- Millipore, Milford, MA, USA), and 1 µL was injected into the system. The quantitative content of analytes was determined on the basis of calibration curves prepared for sucrose, glucose, fructose, and maltitol standard solutions. The analyses were performed in duplicate.

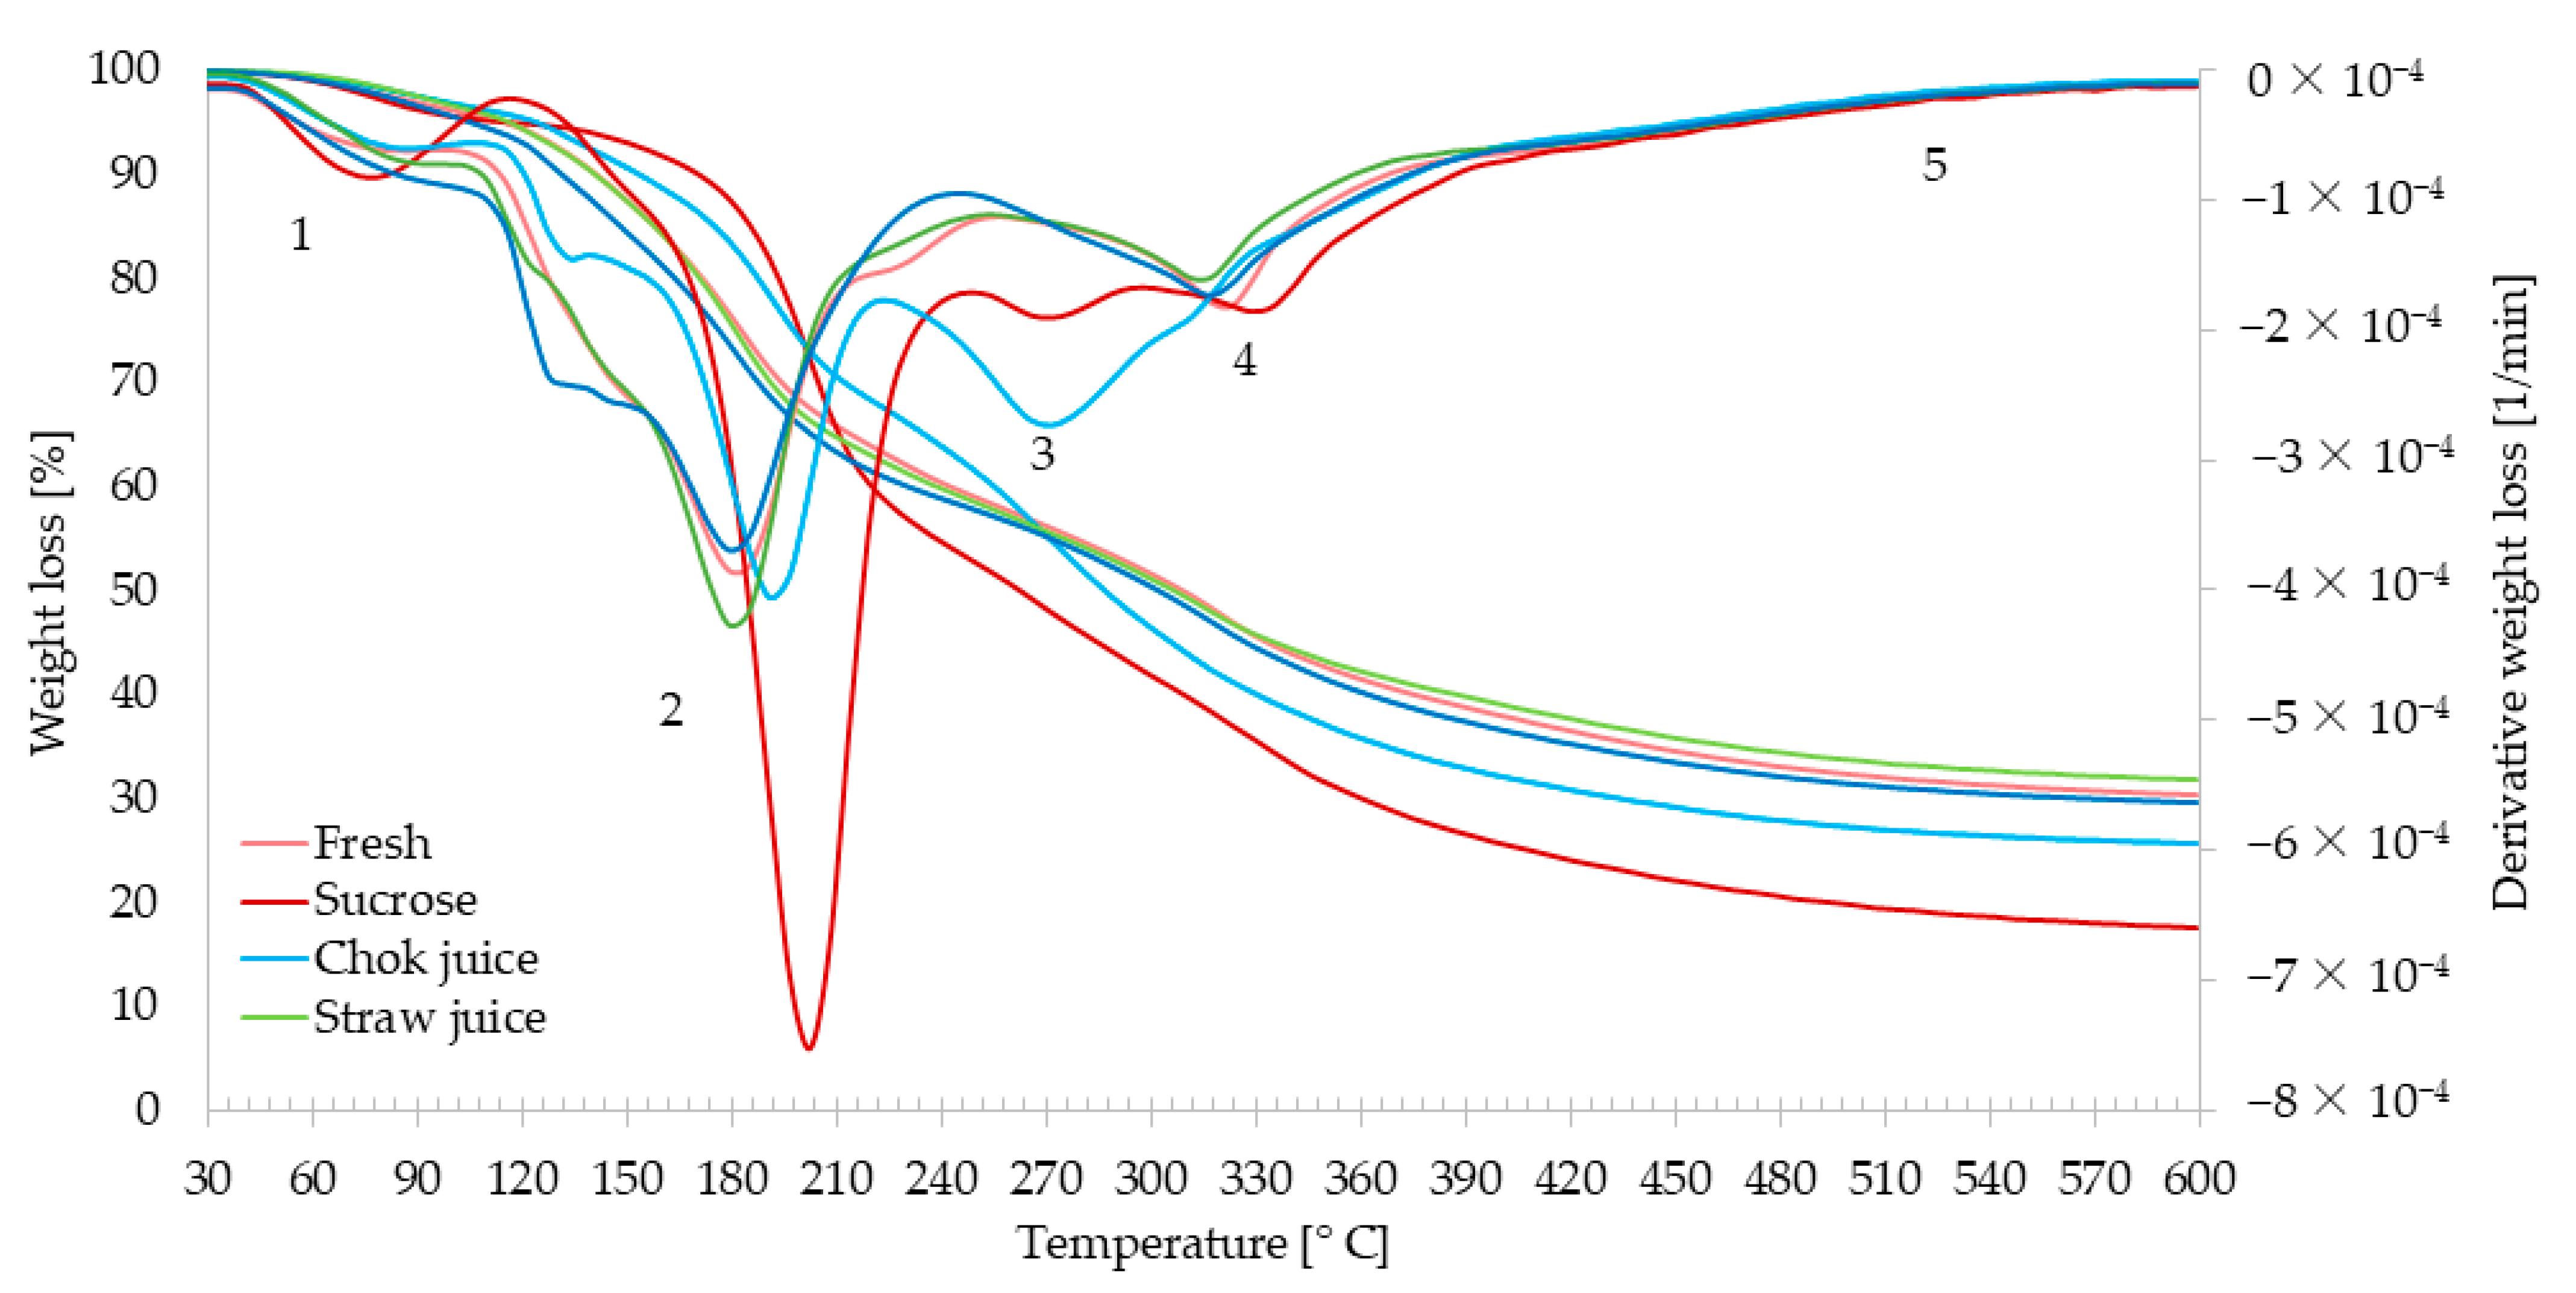
2.4.8. Thermogravimetry Analysis (TGA)

The thermal stability of the materials was tested using a TGA/DSC 3+ thermogravimeter (Mettler Toledo, Greifensee, Switzerland) [27]. To 70 uL of alumina crucibles, approx. 5 mg of crushed dried material was weighed and heated at 30–600 °C (10 °C/min, with nitrogen flow of 50 mL/min). The thermal weight loss curves and derivative thermal gravity curves were analyzed using STAR software. Two measurements were performed for each sample.

2.5. Statistical Analysis

Statistica 13 software (TIBCO company software, Palo Alto, CA, USA) was used for statistical analysis. A one-way analysis of variance (ANOVA), as well as the homogenous groups with the use of Tukey’s HSD test, was conducted. Additionally, the two-factor ANOVA was determined to evaluate the effect of time of osmotic dehydration and osmotic agent on the strawberry quality. The significance level was set at α = 0.05. Principal component analysis (PCA) was performed to determine the relationship between mass transfer and physicochemical indices. The following properties after 3 h of osmotic dehydration in different osmotic agents were taken into account: WR, WL, SG, DM, aw, color parameters L*, a*, b*, ΔE, Fmax, compression work, TPC, TAC, vitamin C, antioxidant activity with DPPH and ABTS radicals, as well as sucrose, glucose, and fructose content.

3. Results and Discussion

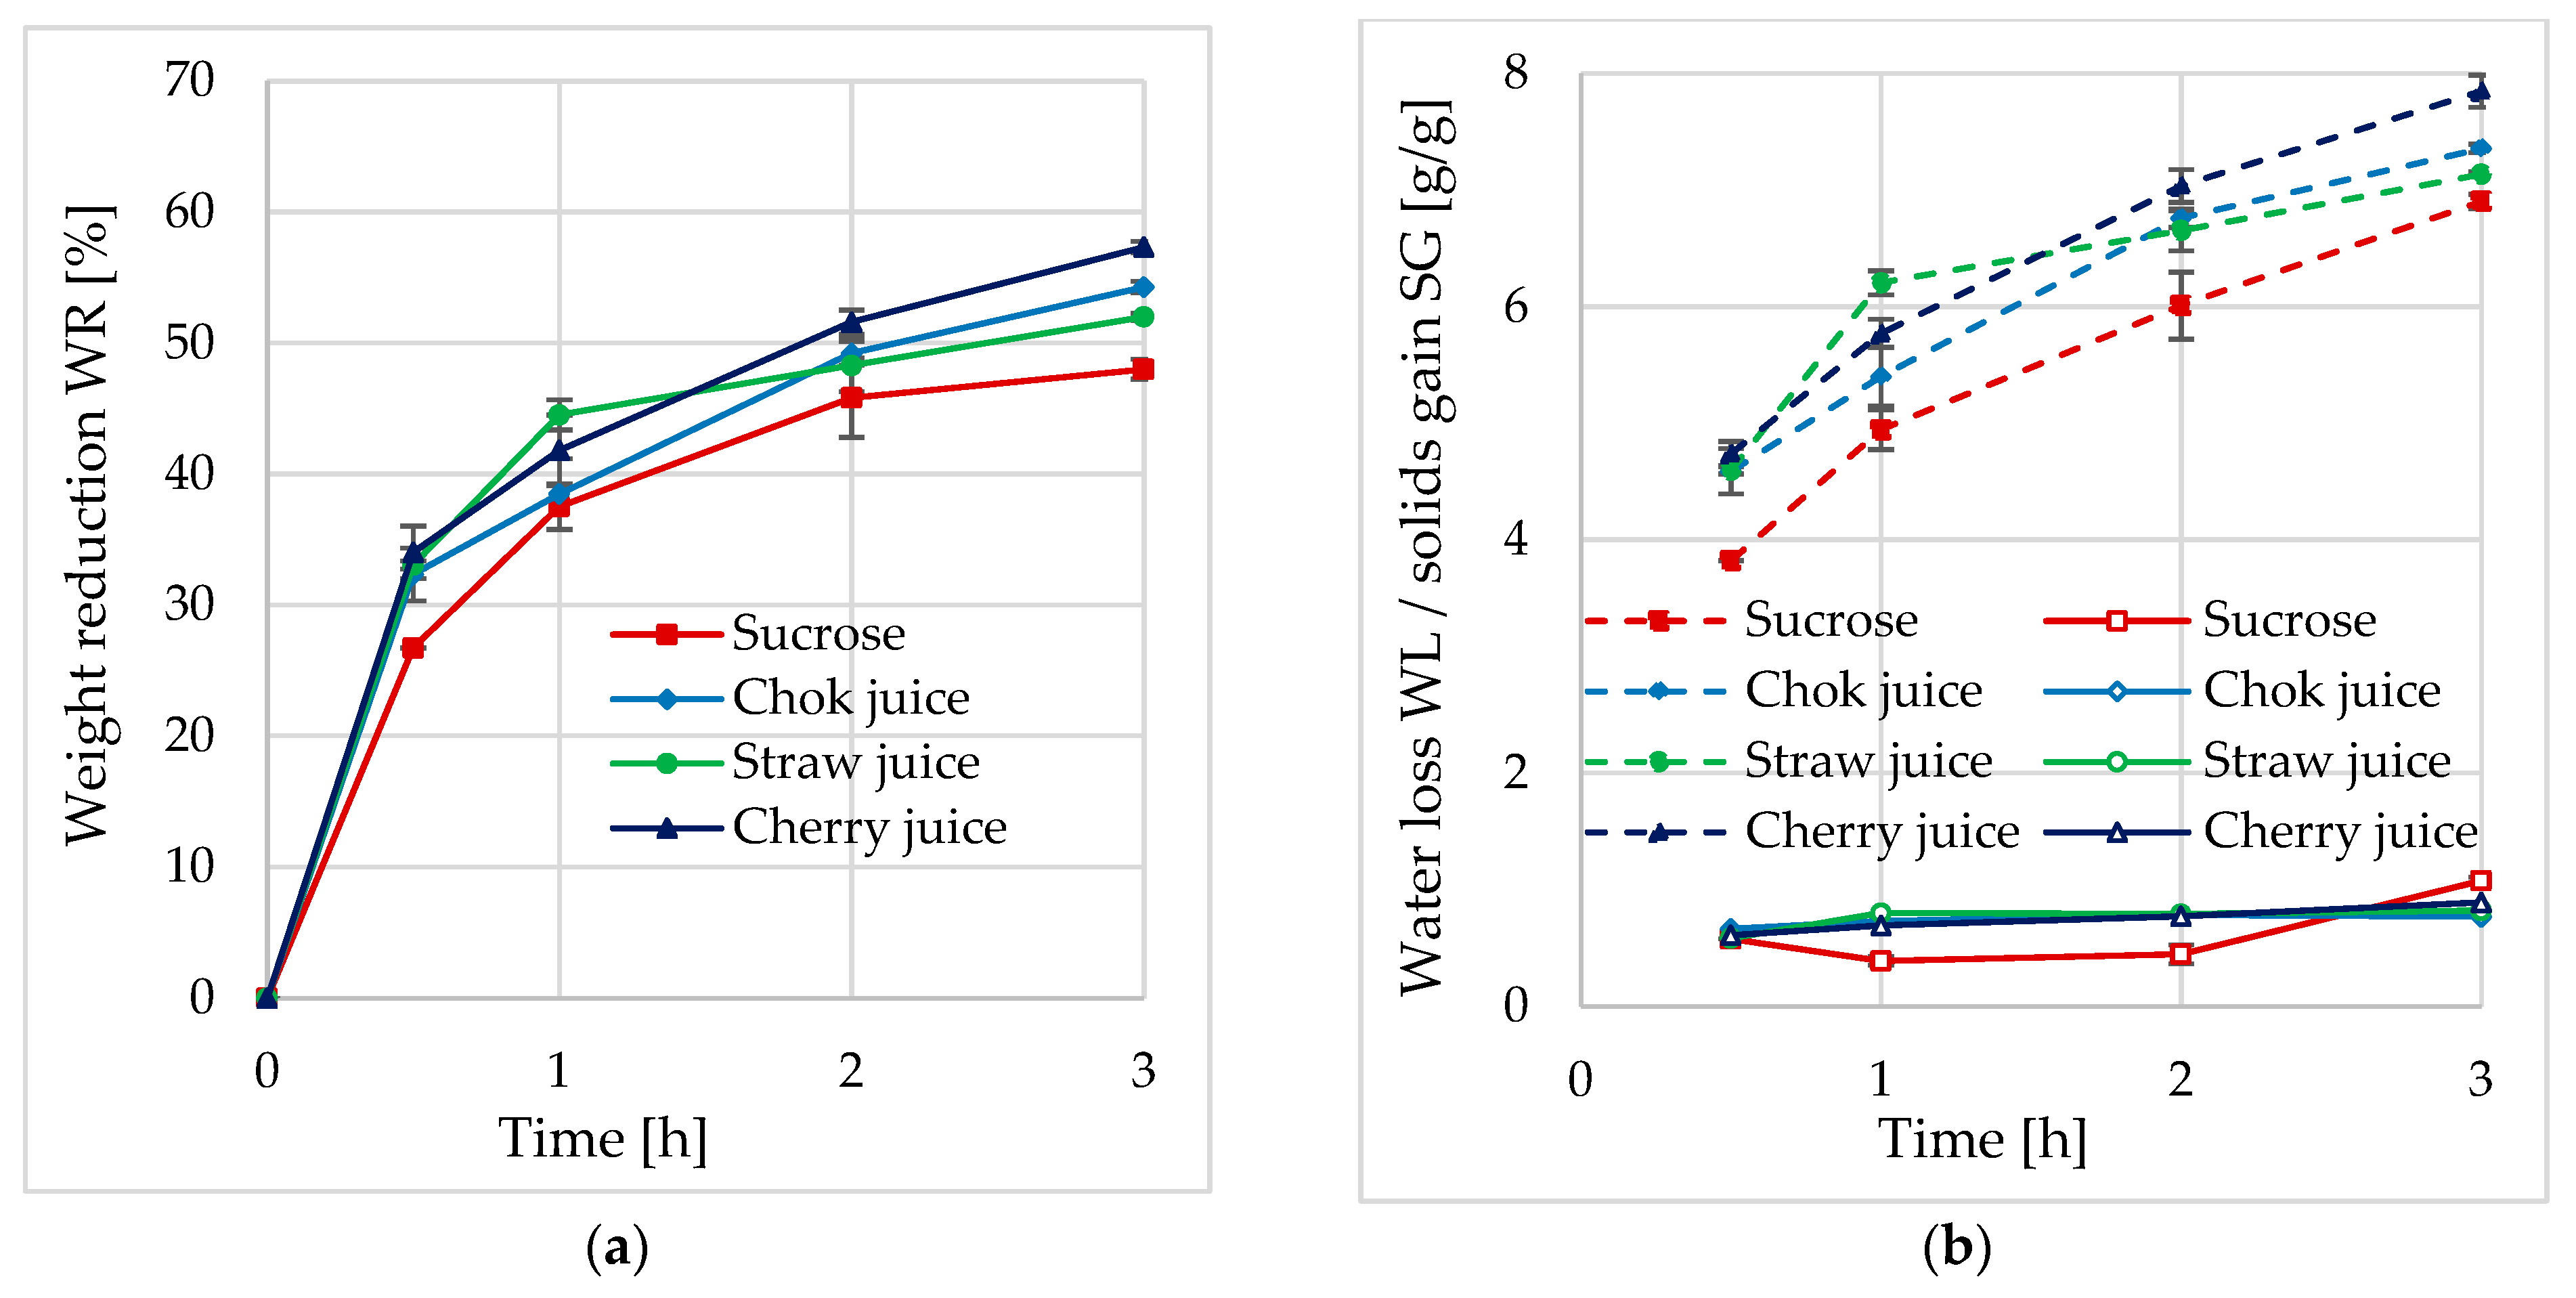
3.1. The Influence of Fruit Concentrates on the Kinetics of the Strawberry Osmotic Dehydration Process

During osmotic dehydration, water from the food matrix passes into the hypertonic solution and solutes present in the solution flow into the food matrix. This is due to the difference in osmotic pressure between the food tissue and the osmotic solution. The mass transfer rate depends on many factors, among which is the type of osmotic agent [13,28].
Mass transfer parameters in terms of weight reduction (WR), water loss (WL), and solid gain (SG) are reported in Figure 1. A statistically significant effect of the type of osmotic agent was found only on the WR and WL of dehydrated strawberries. Moreover, both of these parameters, as well as SG, were significantly dependent on the dehydration time (p < 0.05). The highest rate of weight reduction, water loss, and solid gain were at the initial stage of the process, regardless of the type of hypertonic solution. The longer the osmotic dehydration was, the bigger the mass transfer was observed. However, in all cases, the mass transfer decreased after 30 min, which was caused by a decreasing osmotic pressure difference between the dehydrated tissue and the surrounding solution. A similar tendency was observed during the osmotic dehydration of apples in grape juice, apple juice, and cranberry juice as described by Wang et al. [29]. At the end of the process, strawberries osmodehydrated in a sucrose solution were characterized by the lowest values of both WR and WL. These values were significantly smaller than in the cases of the use of chokeberry or cherry juices. Each of the juice concentrates contains many substances with different molecular sizes that can increase the osmotic pressure that determines water loss but can also increase solid gain in dehydrated fruit tissue. For example, according to Jurendić and Ščetar [30], unconcentrated chokeberry juice, containing 11–17% dry matter, contains 110–143 g/L of sugar, including glucose, fructose, and sorbitol, approximately 32–40, 30–39, and 48–64 g, respectively/L. Other ingredients include polyphenols 4.7–9.0 g/L, fiber 3.0 g/L, as well as minerals 5.0 g/L, proteins 2 g/L, and fat <1 g/L. Lech et al. [7] presented a detailed composition of polyphenolic compounds in chokeberry juice used as an osmotic agent, the total content of which was about 2919.4 mg/100 g d.m. Among the identified compounds were the highest content of polymeric procyanidins (1857.4 mg/100 g d.m.), as well as phenolic acids, such as chlorogenic (400.1 mg/100 g d.m.), neochlorogenic (251.2 mg/100 g d.m.), and many other flavonoid compounds, as indicated.
Although there was no significant effect of the type of osmotic agent on the solid gain of strawberries, it was observed that, compared with the sucrose solution, the values of this index were slightly higher when using juice concentrates. Due to the content of many components of different molecular weights contained in the juice concentrates, these osmotic agents showed a higher osmotic potential than the sucrose solution. Although all osmotic agents had the same concentration, the water activity of the concentrates was in the range of 0.90–0.91; that of sucrose was 0.95 (Table 1). In addition to the particle size of the osmotic agent components, the viscosity may determine the differences in the penetration of osmotic substances into the food material. Juice concentrates may contain ingredients that increase this effect, e.g., pectins. The higher the viscosity, the higher the adhesive forces to maintain adsorbed solids on the surface and inner capillaries of the strawberry tissue. Such an effect may affect the mass transfer resistance during osmotic dehydration. In the literature studies, a varied effect of chokeberry juice concentrate on solid gain was found. Cano-Lamadrid et al. [31], during the osmotic dehydration of pomegranate arils in different combinations and ratios of concentrated pomegranate, chokeberry, and apple juices, observed the lowest value of solid gain in samples osmodehydrated in chokeberry juice concentrate. The authors attributed this result to the fact that the large particle size characterizes chokeberry juice. It may affect the accumulation of solids near the surface, compaction of the surface layers, and increase mass transfer resistance. On the contrary, another research showed that the addition of a chokeberry concentrate to a sucrose solution caused a slight increase in SG in strawberries. According to the authors, it might be a result of the penetration of substances lower than the sucrose molecular weight, which naturally occurs in chokeberry juice, into the fruits [32]. Other results showed that a lower pH of the solution might quicken the removal of water, altering the characteristics of fruits and vegetables and causing changes in their texture [33].

3.2. The Impact of Fruit Concentrates on the Physical Properties

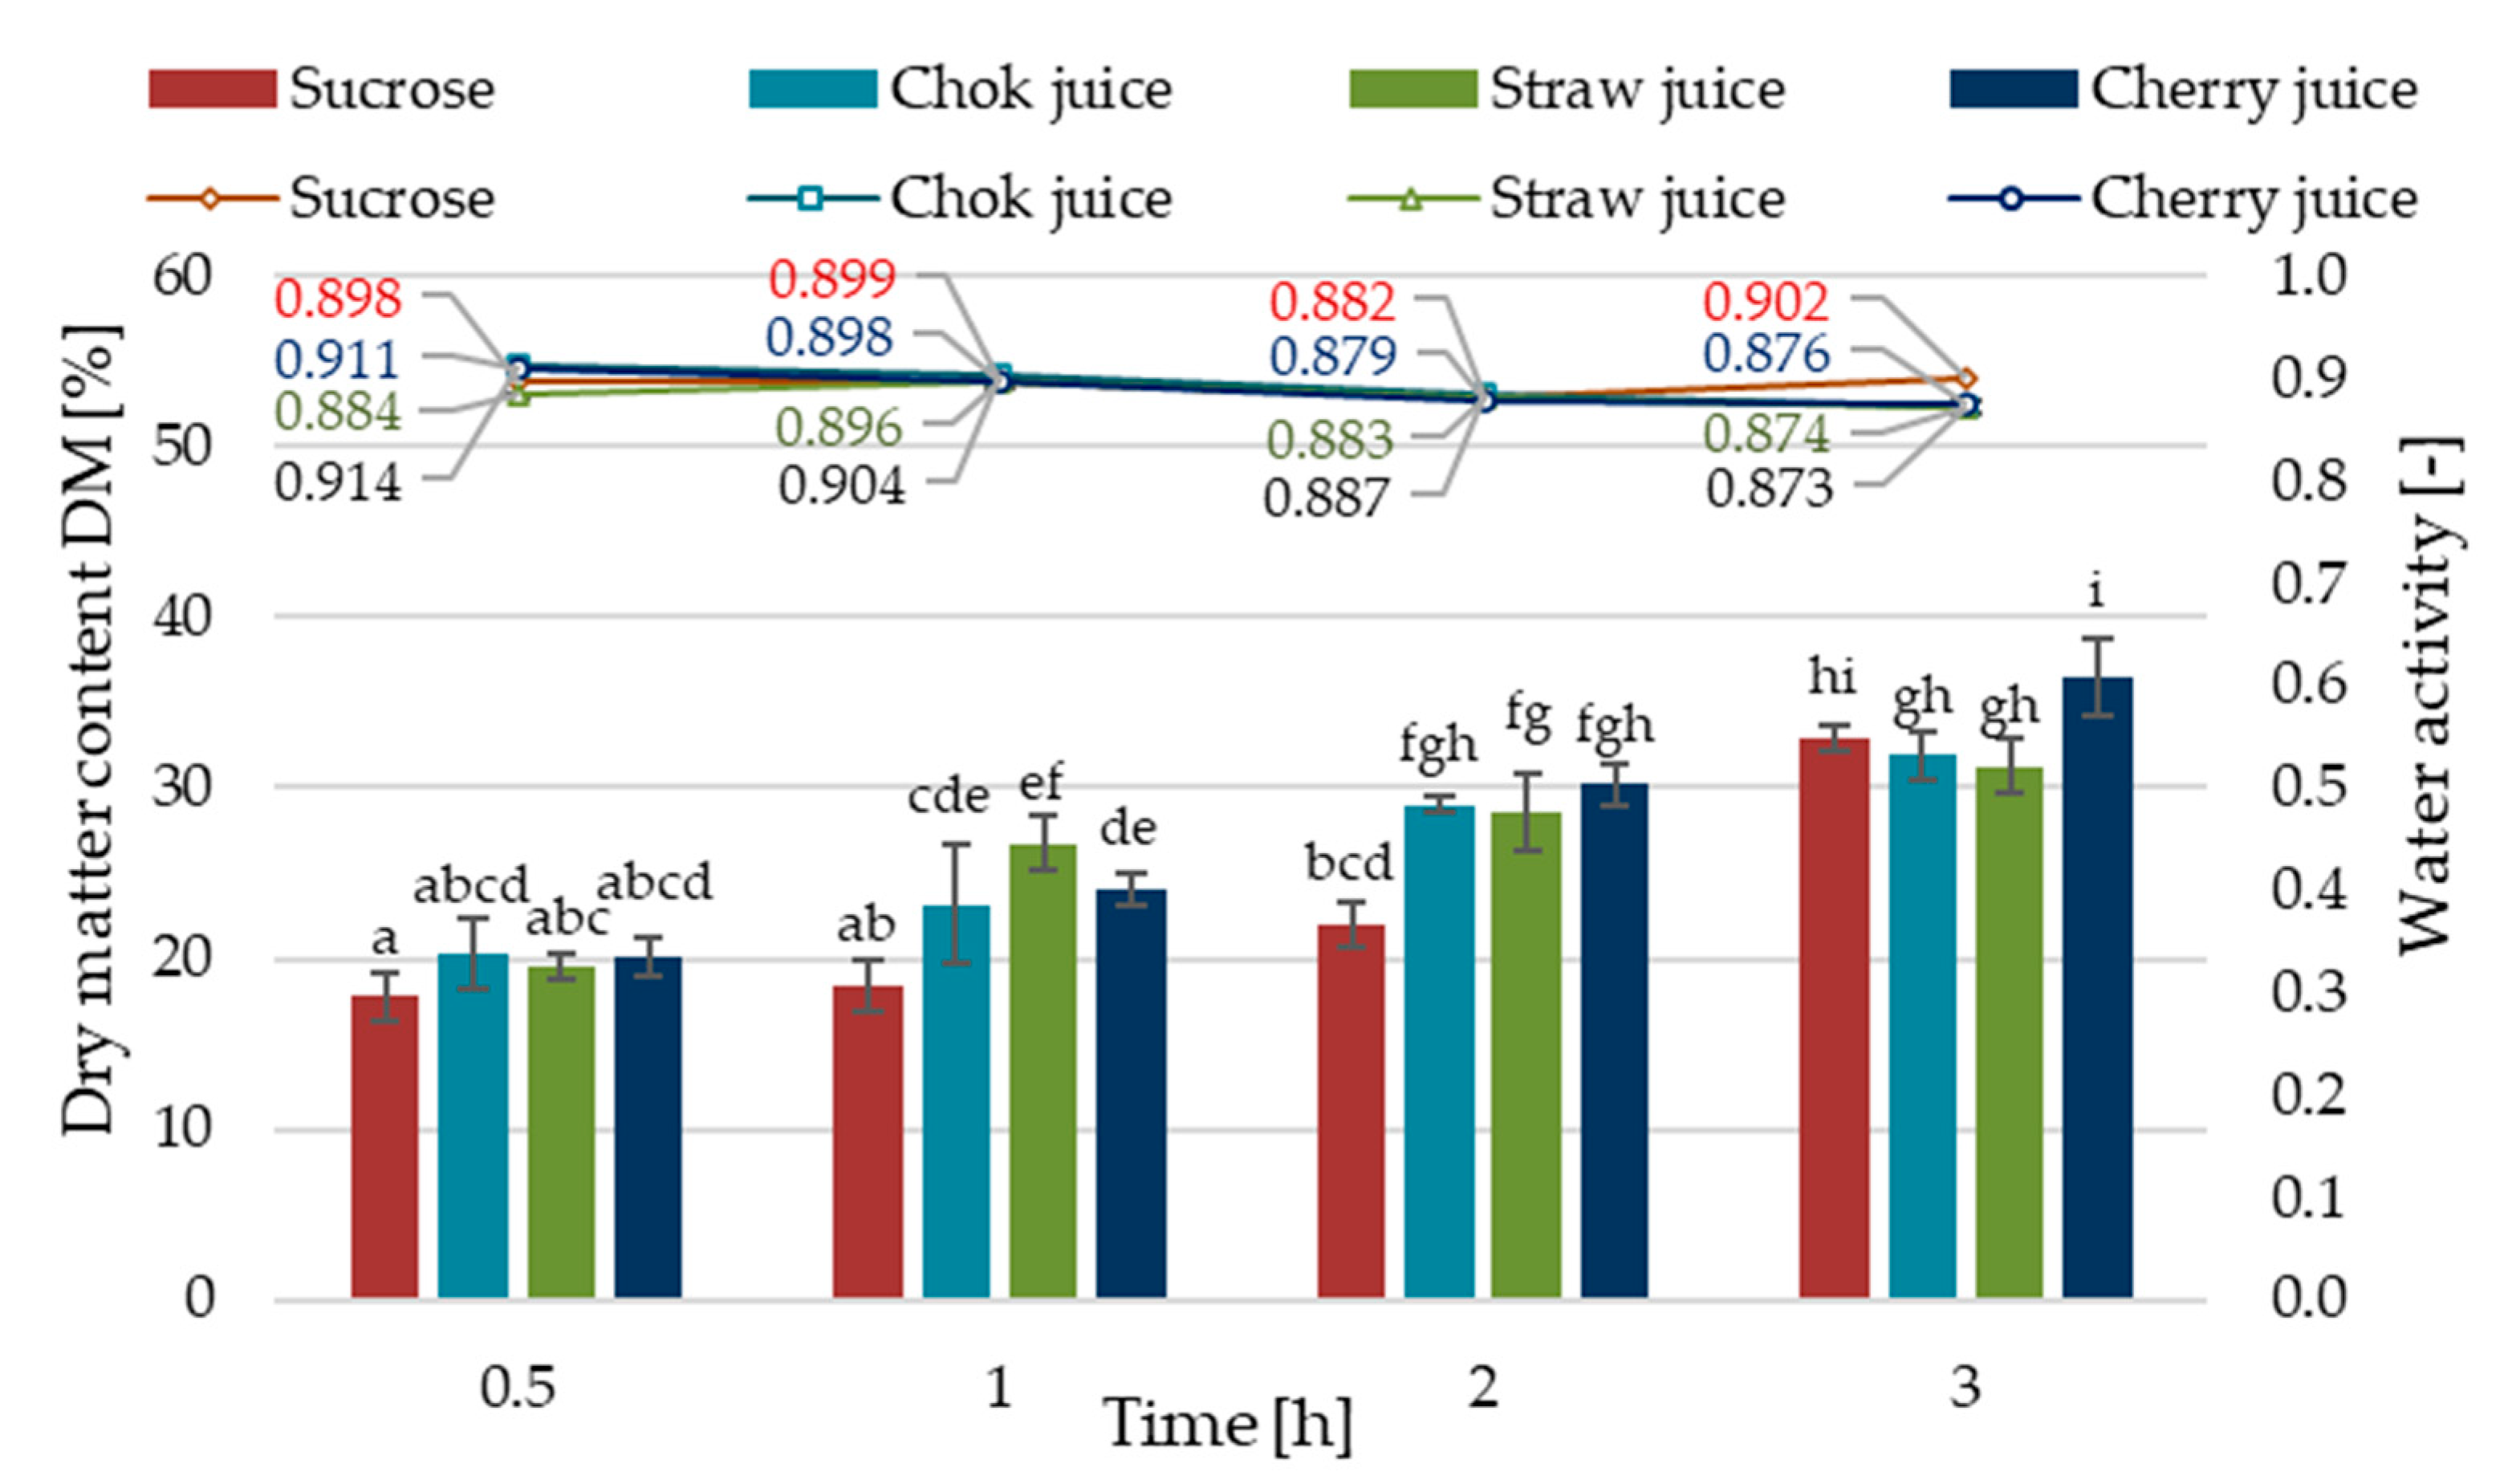
3.2.1. The Impact of Fruit Concentrates on the Dry Matter Content, Water Activity, and Color of Osmotically Dehydrated Strawberries

The dry matter content in fresh strawberries was 8.2 ± 0.05% and, as a result of osmotic dehydration for 0.5 h, it increased twice. After 3 h of osmotic dehydration, it increased to 31.3–36.5%, depending on the type of osmotic agent (Figure 2). Thus, after 3 h of the osmotic dehydration process, the water content was in the range of 63.5–68.7%. A similar effect was observed in sour cherry subjected to osmotic dehydration in concentrated apple juice and a mixture of apple and sour cherry juices [15]. The highest values were found in strawberries dehydrated in cherry juice concentrate. Compared with traditional sucrose, the use of juice concentrates increased the dehydration effect of strawberries by 10–46%, omitting the dry matter of fruits dehydrated for 3 h in chokeberry and strawberry juice concentrates, with values similar to those obtained in the sucrose solution. A longer dehydration time increased the content of dry matter, regardless of the type of osmotic agent, as a result of the mass transfer [34].
Water activity is a parameter related to moisture content [7]. The water activity of fresh strawberries was 0.954 ± 0.08. Irrespective of the used osmotic substance, it decreased along with the longer dehydration time (Figure 2). Statistical analysis showed that the time of the osmotic dehydration has a significant effect on this parameter (p < 0.05). Significant differences in the water activity of osmotically dehydrated strawberries were observed between the initial (0.5 h) and the final time of osmotic dehydration (3 h). However, there was no significant effect of the osmotic agent on the level of water activity in dehydrated strawberries (p > 0.05). The highest decrease in water activity to 0.873 was obtained in strawberries dehydrated in a cherry concentrate after 3 h of dehydration. The water activity of strawberries at this level protects them against the development of pathogenic microorganisms but does not ensure full microbiological stability. According to Moraga et al. [35], a slight decrease in high water activity causes a significant reduction in the relative rate of all growth reactions and microbial destruction. However, further processing is required to assure the longer stability of the product, e.g., drying [36,37].
The color of food is one of the factors that determine the choice and willingness to consume a product. As it has been shown in many publications, during various treatments, transport, and storage, the color changes [23,38], therefore the selection of an osmotic agent is of particular importance in shaping the properties of osmotically dehydrated fruits.
Fresh strawberries at the stage of consumption maturity were characterized by L*, a*, and b* color parameters at the levels of 33.8 ± 3.9, 24.1 ± 3.8, and 19.7 ± 4.5, respectively (Table 2).
The highest color lightness L* was found in strawberries dehydrated in a sucrose solution for 3 h, obtaining a value of 47.3 ± 4.5. The lightness of the color of these fruits was much higher compared with the color of the raw material. This is due to the high color brightness of the sucrose solution (99.63) compared with the concentrates (0.41–9.57) used as osmotic agents (Table 1). Generally, it is obvious that the color will change due to the colored juice concentrates [14,29]. Additionally, the lower pH of the osmotic solutions (Table 1) might influence the compounds responsible for the color (e.g., anthocyanin), whose stability is dependent on the pH value [39]. As the pH increases, the anthocyanin color lightens. However, the presence of components that are copigments can help retain and partially stabilize the color [40]. Strawberries dehydrated in juice concentrates had a darker color compared with those dehydrated in a sucrose solution. Fruits dehydrated in a strawberry juice concentrate were characterized by color lightness similar to or higher (32.3–37.2) than the color of the raw material. Strawberries kept in a chokeberry concentrate, rich in intense dark red anthocyanins, obtained the lowest value of the L* parameter (19.8–23.1). This is related to the penetration of colored substances contained in fruit concentrates into the fruit [14]. Significant changes in the color of pomegranate seeds were observed after osmotic dehydration in bitter orange juice, apple juice, and grape juice [8]. The value of the a* parameter decreased in strawberries dehydrated in a solution of sucrose and chokeberry concentrate in comparison with the color of the raw material. On the other hand, the use of strawberry and cherry concentrates increased the share of red color and the use of a strawberry concentrate also increased the share of yellow color in comparison with the color of the fresh fruit. The lowest values of parameters a* and b* were observed in the color of strawberries dehydrated in a chokeberry concentrate solution. This is due to the values of the parameters a* and b* of the color of the strawberry concentrate, approximately 42.23 and 15.75, respectively, compared with the cherry concentrate (10.82 and 1.71) and the chokeberry juice concentrate with the value a* 0.09 and b* −0.96 (Table 1). The type of osmotic agent had a significant impact on the absolute color difference (Table 2). Lower values were found with the use of a sucrose solution and with the use of a strawberry concentrate. All color differences were significant and perceptible to the human eye [23]. For instance, apples dehydrated in beetroot and apple–beetroot juice concentrates were characterized by a higher total color difference than apples subjected to an apple juice concentrate and a sucrose solution [41]. However, choosing different fruit concentrates characterized by intensive color can give an interesting color to the fruit or vegetable snack [29]. The relatively low pH (approx. 3.30–3.85) of fruit juice concentrates (Table 1) and the content of various classes of polyphenolic compounds are responsible for the color of juices and, by penetrating them into dehydrated tissue, a new color can be added to the product or its natural color can be enhanced. Some sources allowing to characterize fruits, juices, or their concentrates have been quoted above. The content of colored substances in the juices of strawberries [3,4], chokeberries [7,13,14], and cherry [42] is their concentrated amount present in the fruit. In the study by Altuntas et al. [42], sour cherry juice with 13.5° Brix and pH 3.19 contained about 3.3 mg/L of vitamin C and 207.0–3.3 mg/L of anthocyanin compound characterized color parameters L*, a*, and b* at the levels of 1.17, 3.84, and 0.86, respectively.

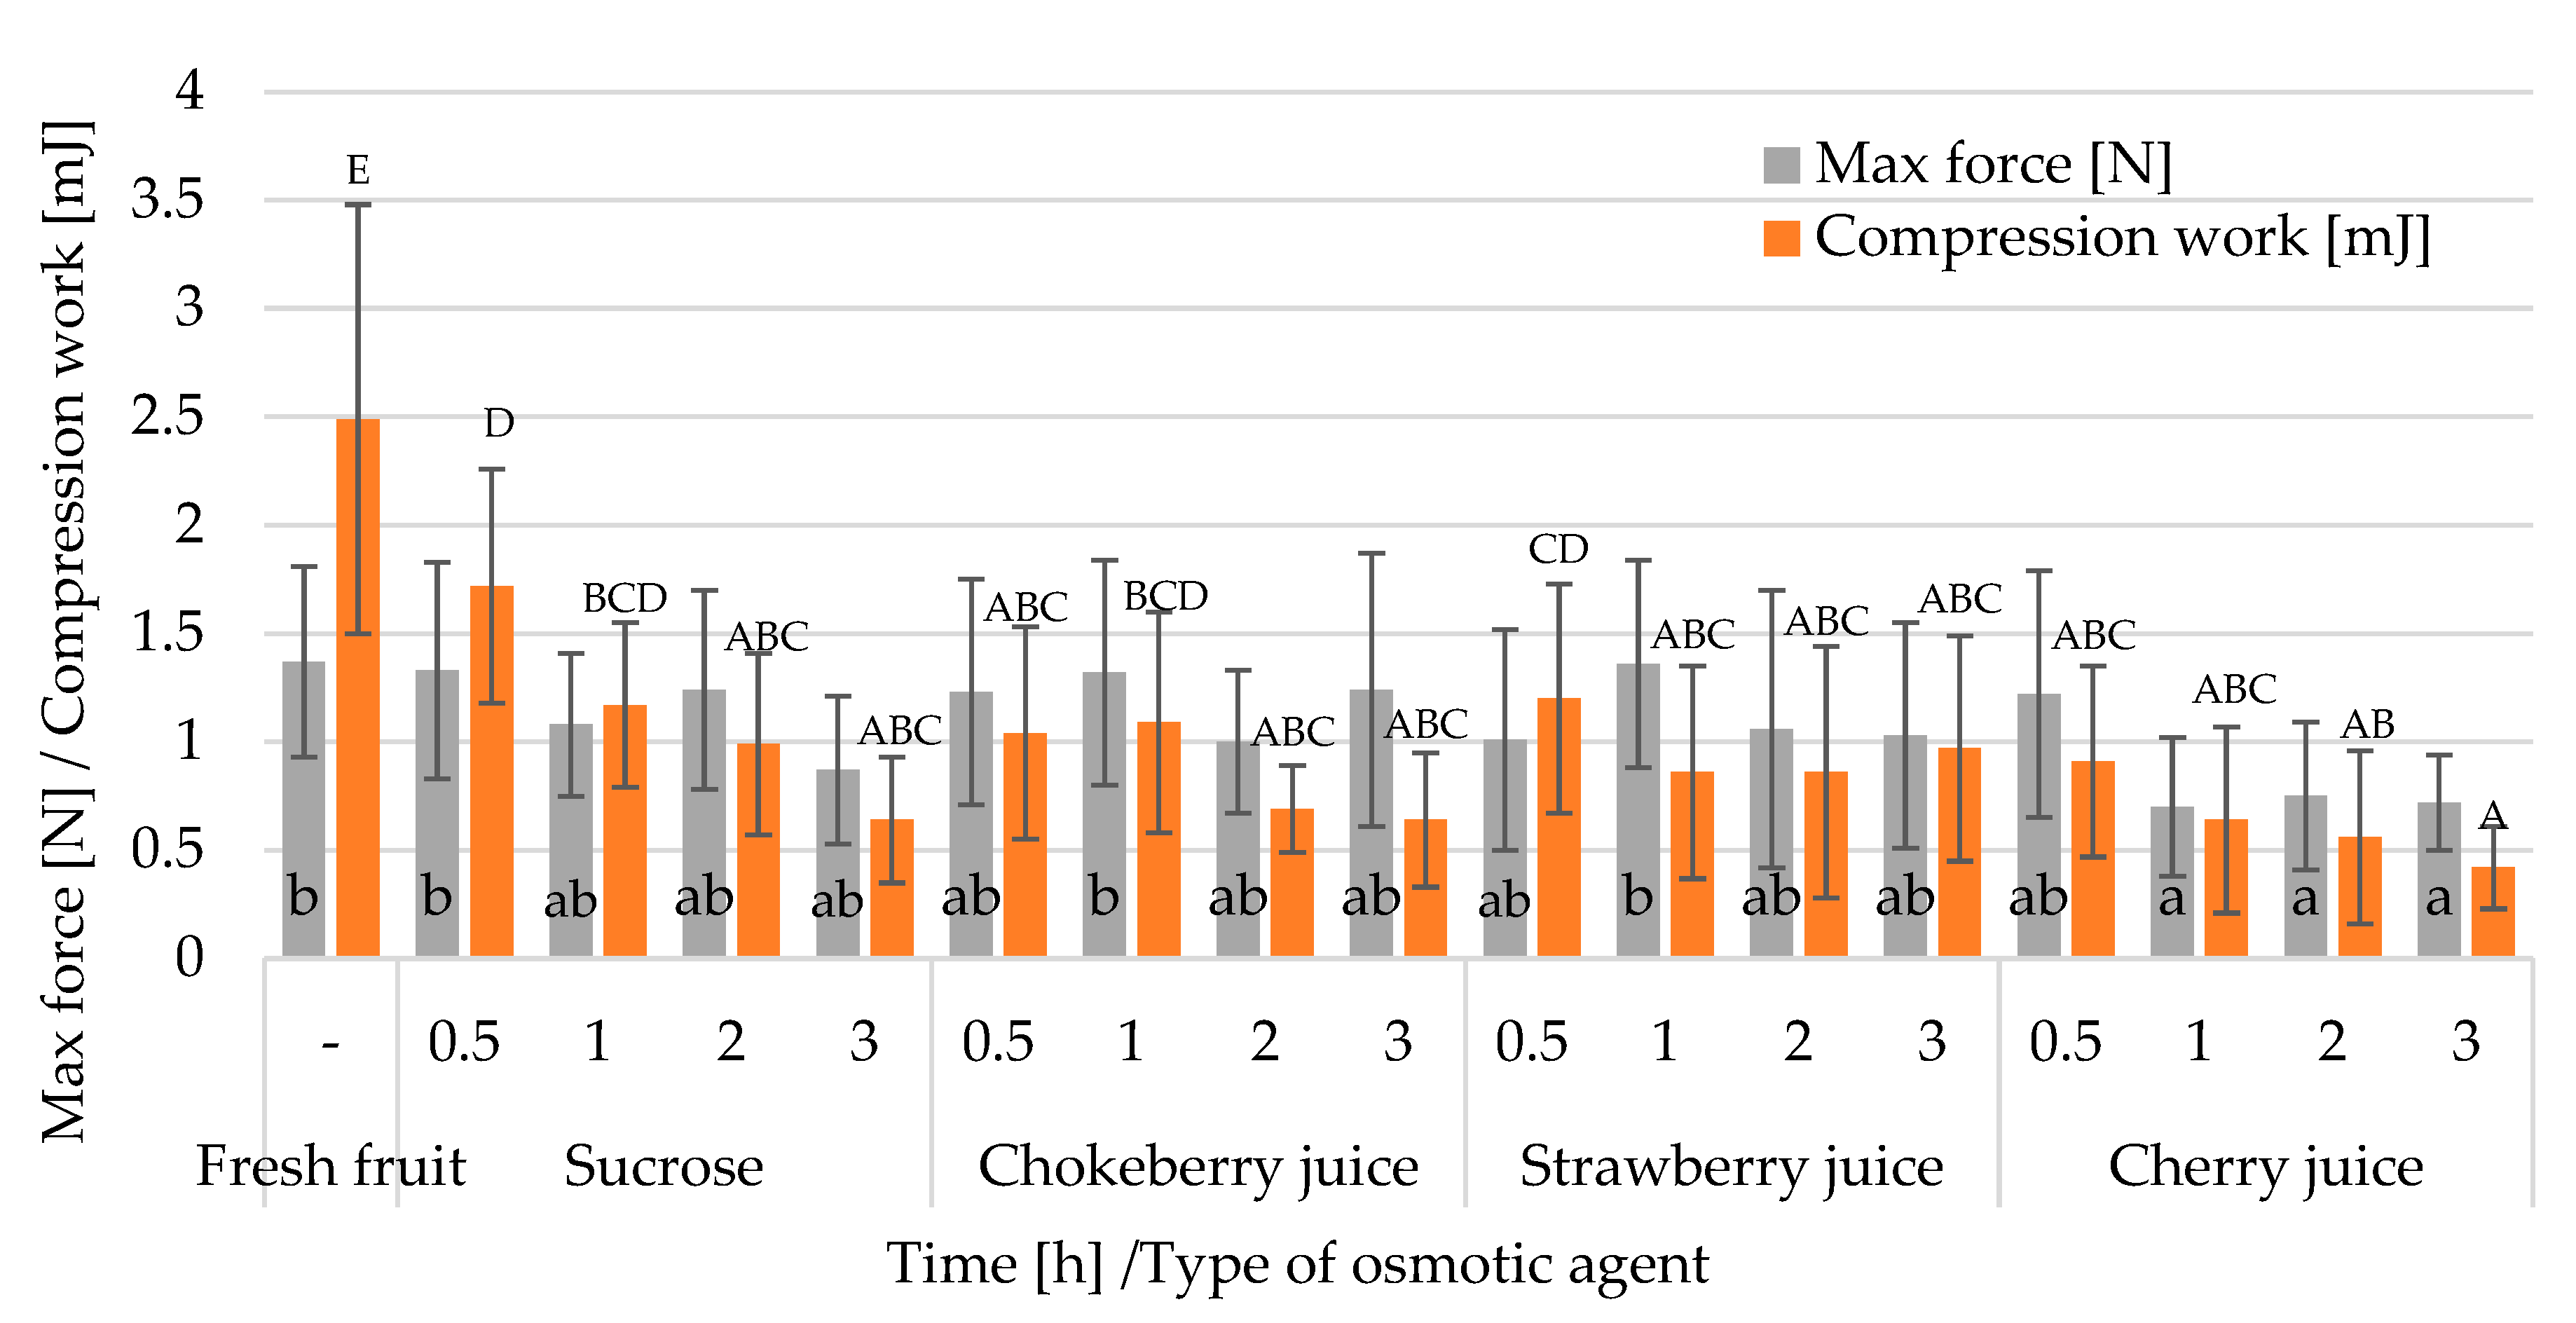
3.2.2. The Impact of Fruit Concentrates on Changes in the Texture and Structure of Osmotically Dehydrated Strawberries

Food texture is another of the parameters characterizing food products that determines their quality. It is described as a combination of product characteristics that the consumer can perceive through visual, auditory, and tactile receptors [23]. The deformation test of fresh and osmotically dehydrated strawberries was carried out on the basis of the compression test. The work that was needed to deform the fresh fruit slice was about 2.49 mJ, while the maximum force corresponding to the hardness of the fruit was about 1.37 N (Figure 3). Osmotic dehydration of strawberries in sucrose and juice concentrates resulted in a statistically significant decrease in both of these indicators, especially after a longer processing time. This is the result of the osmotic mass exchange, which causes a partial disturbance of the natural semi-permeability of the tissue and its destruction, mainly in the surface layer of dehydrated fruit. Strawberries dehydrated in a cherry concentrate, after 3 h of the process, were characterized by the lowest value of compression work, obtaining the result of 0.42 mJ. On the other hand, the highest (1.72 mJ) and closest to the value of compression work needed to deform fresh strawberries was found in strawberries dehydrated in a sucrose solution for 0.5 h. The research by Gamboa-Santos [43] showed that, due to the concentration and penetration of osmotic substances in osmotically dehydrated strawberries, there was a decrease in elasticity and an increase in the hardness of the samples. It was found that the changes in the texture could also result from the formation of the surface saturation of the samples with the components of the osmotic agent. As a result, firmness decreased to 3 h of osmotic dehydration but cohesiveness increased, while adhesiveness and elasticity remained at a constant level.
The decrease in the maximum compressive force of osmotically dehydrated strawberries confirmed the softening of the fruit [44] and depended on the type of osmotic agent. The lowest value of the maximum compressive force was found in strawberries dehydrated in a cherry juice concentrate for 1 h (Figure 3). However, the values of this indicator in the remaining samples, including the raw material, did not differ significantly and constituted the second homogeneous group.
Changes in the texture of osmotically dehydrated strawberries can be observed using images taken with the scanning electron microscope (Figure 4).
According to Gamboa-Santos [43], osmotic dehydration by immersion in a sucrose solution of 60° Bx at 40 °C for 4 h causes changes in texture due to the effect of changes in the water content on the pectin and cellulosic components of fruit tissues. The thin cell walls of strawberry tissue may promote damage to the cell texture and the intercellular space. Osmodehydrated samples may have detached cell walls and a damaged mid-lamella as a result of cell plasmolysis and shrinkage [45]. Changes in the shape and volume of cells and intercellular spaces are visible. This is due to the deformation and folding of the surface. It was found that the type of osmotic agent caused changes in the structure of dehydrated strawberries, which became looser in relation to fruits not subjected to dehydration. There was an increase in the volume of internal spaces when the tissue of non-dehydrated strawberries was more compact. In addition, as a result of the saturation of strawberries with sugars and other components of osmotic agents, cell walls thickened. The most damaged structure is characterized by strawberries dehydrated in a cherry juice concentrate, which may be attributed to the greatest effect of removing water from strawberries (WL and WL/SG), as well as the chemical composition of the juice and low pH (approx. 3.2–3.3) of cherry juice (Table 1) [42,46,47]. Prinzivalli et al. [48] showed the effect of extending the osmotic dehydration time of strawberries in a sucrose solution on greater changes in texture. They found that after just 1 h of the process, there was a gradual separation and disintegration of the tissue, loss of the shape of the cell walls, and turgor.

3.3. The Impact of Fruit Concentrates on the Chemical Properties

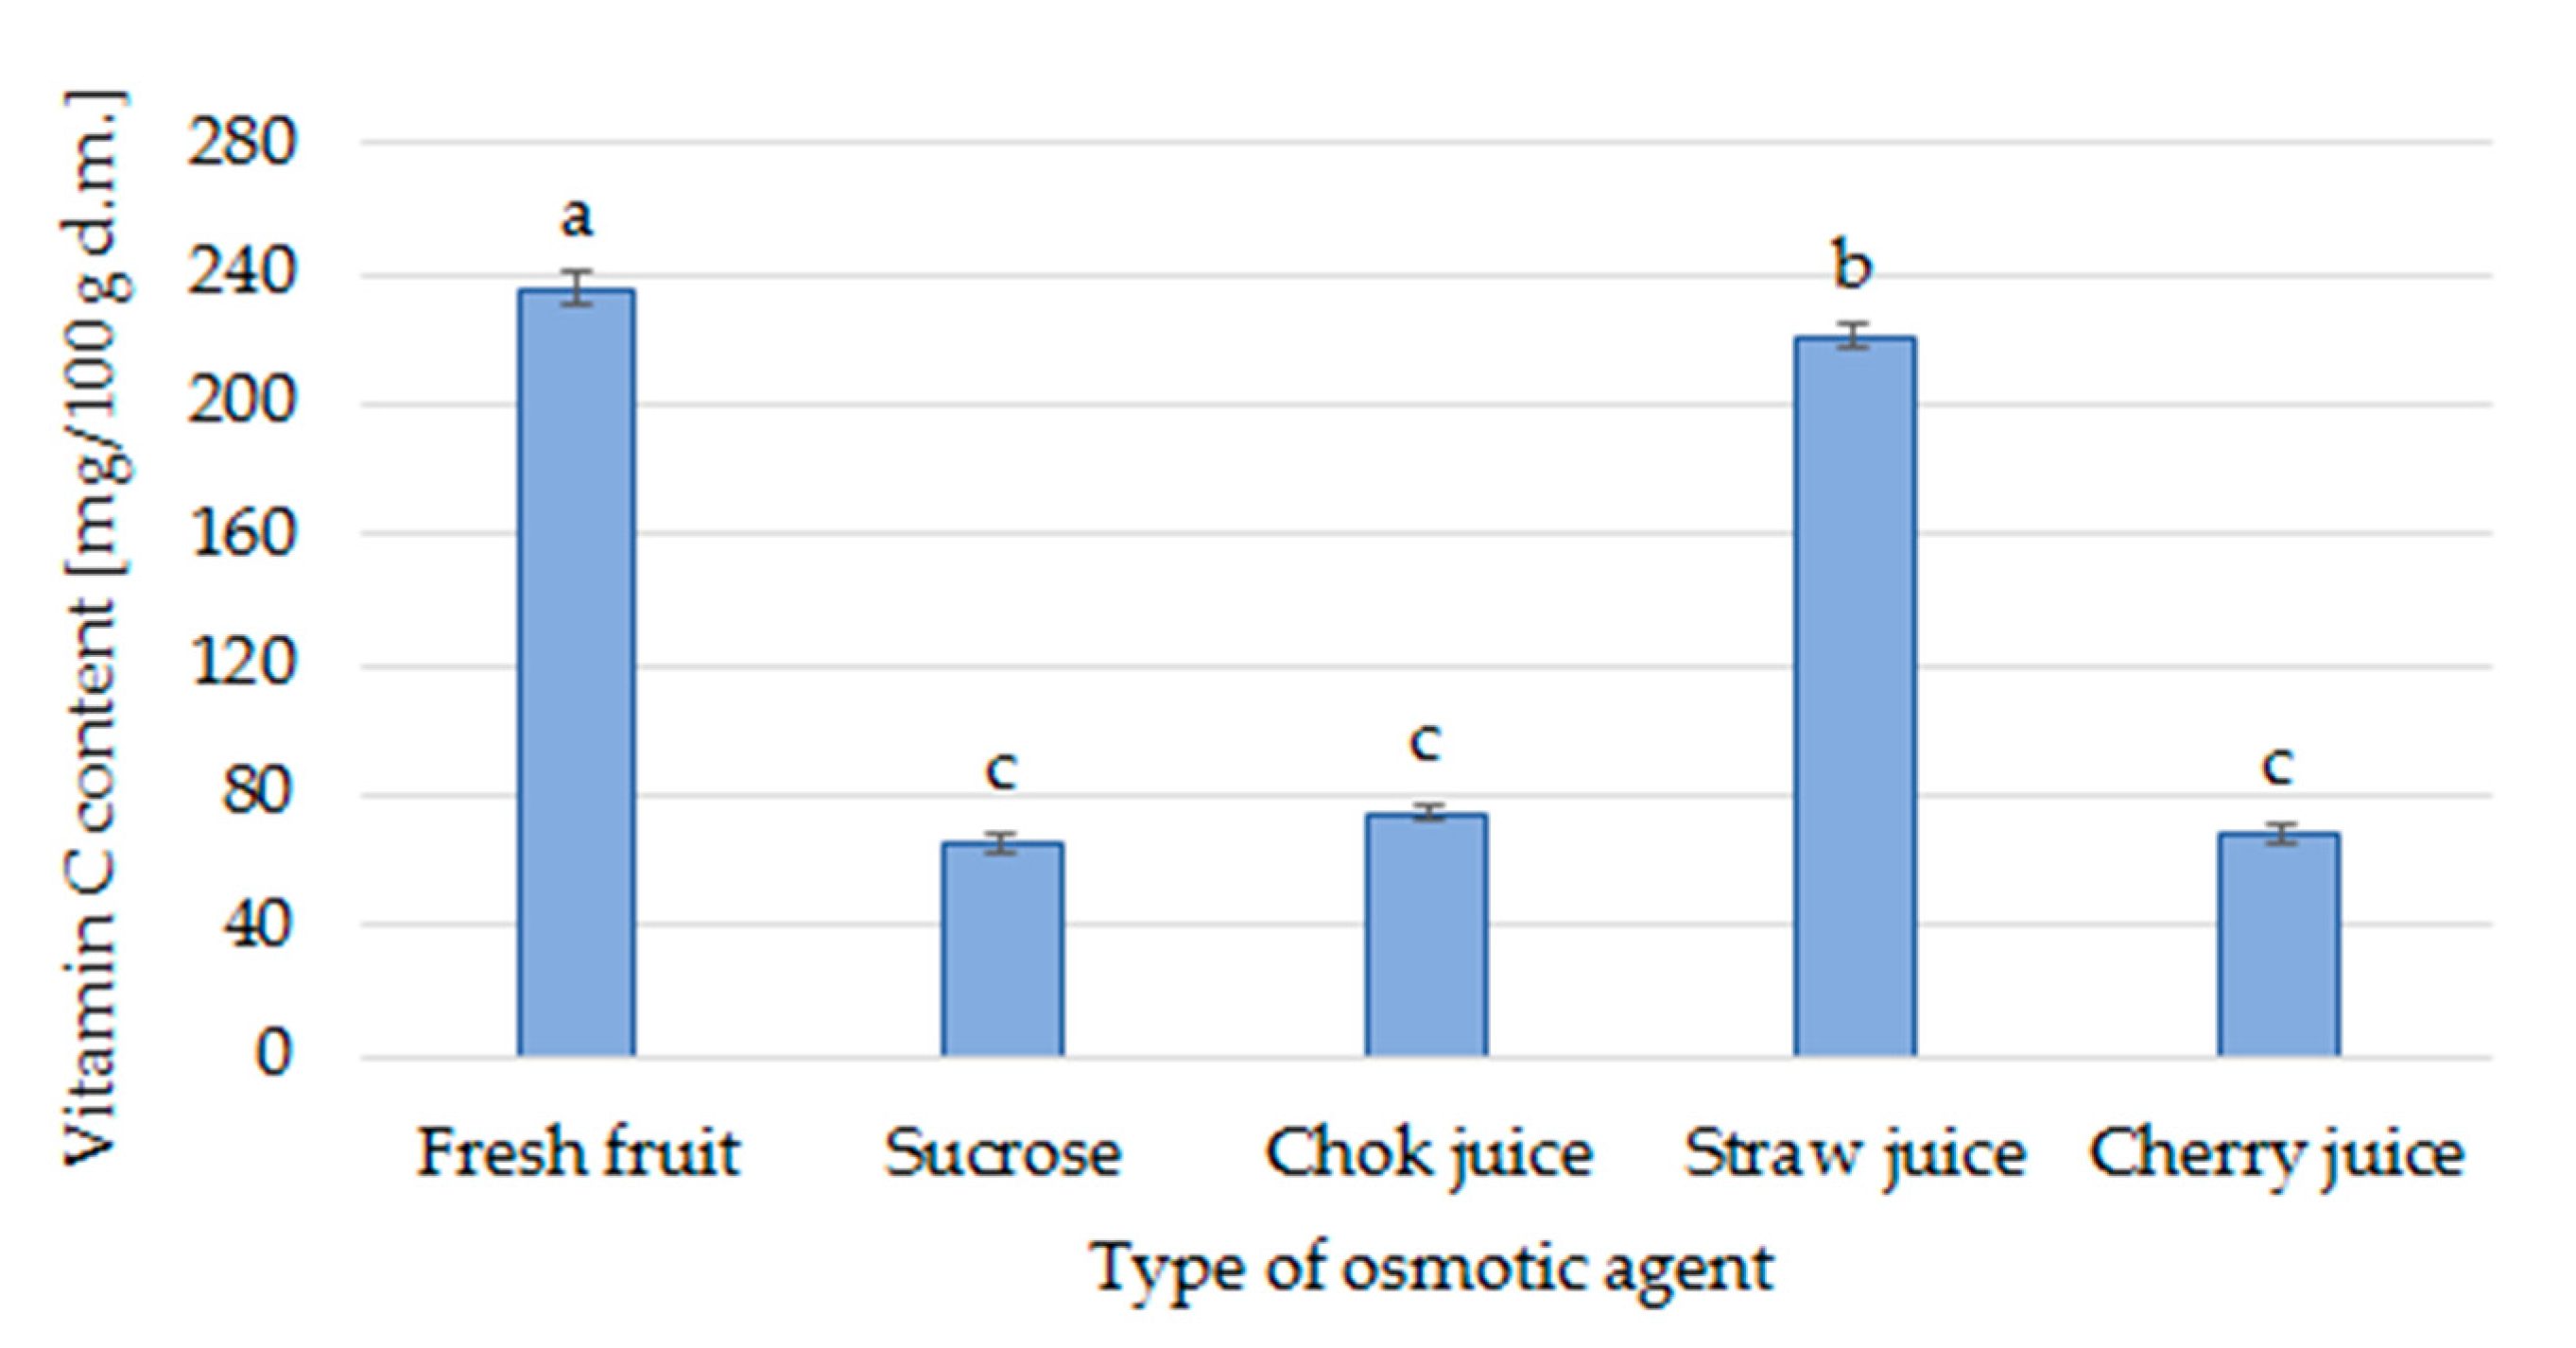
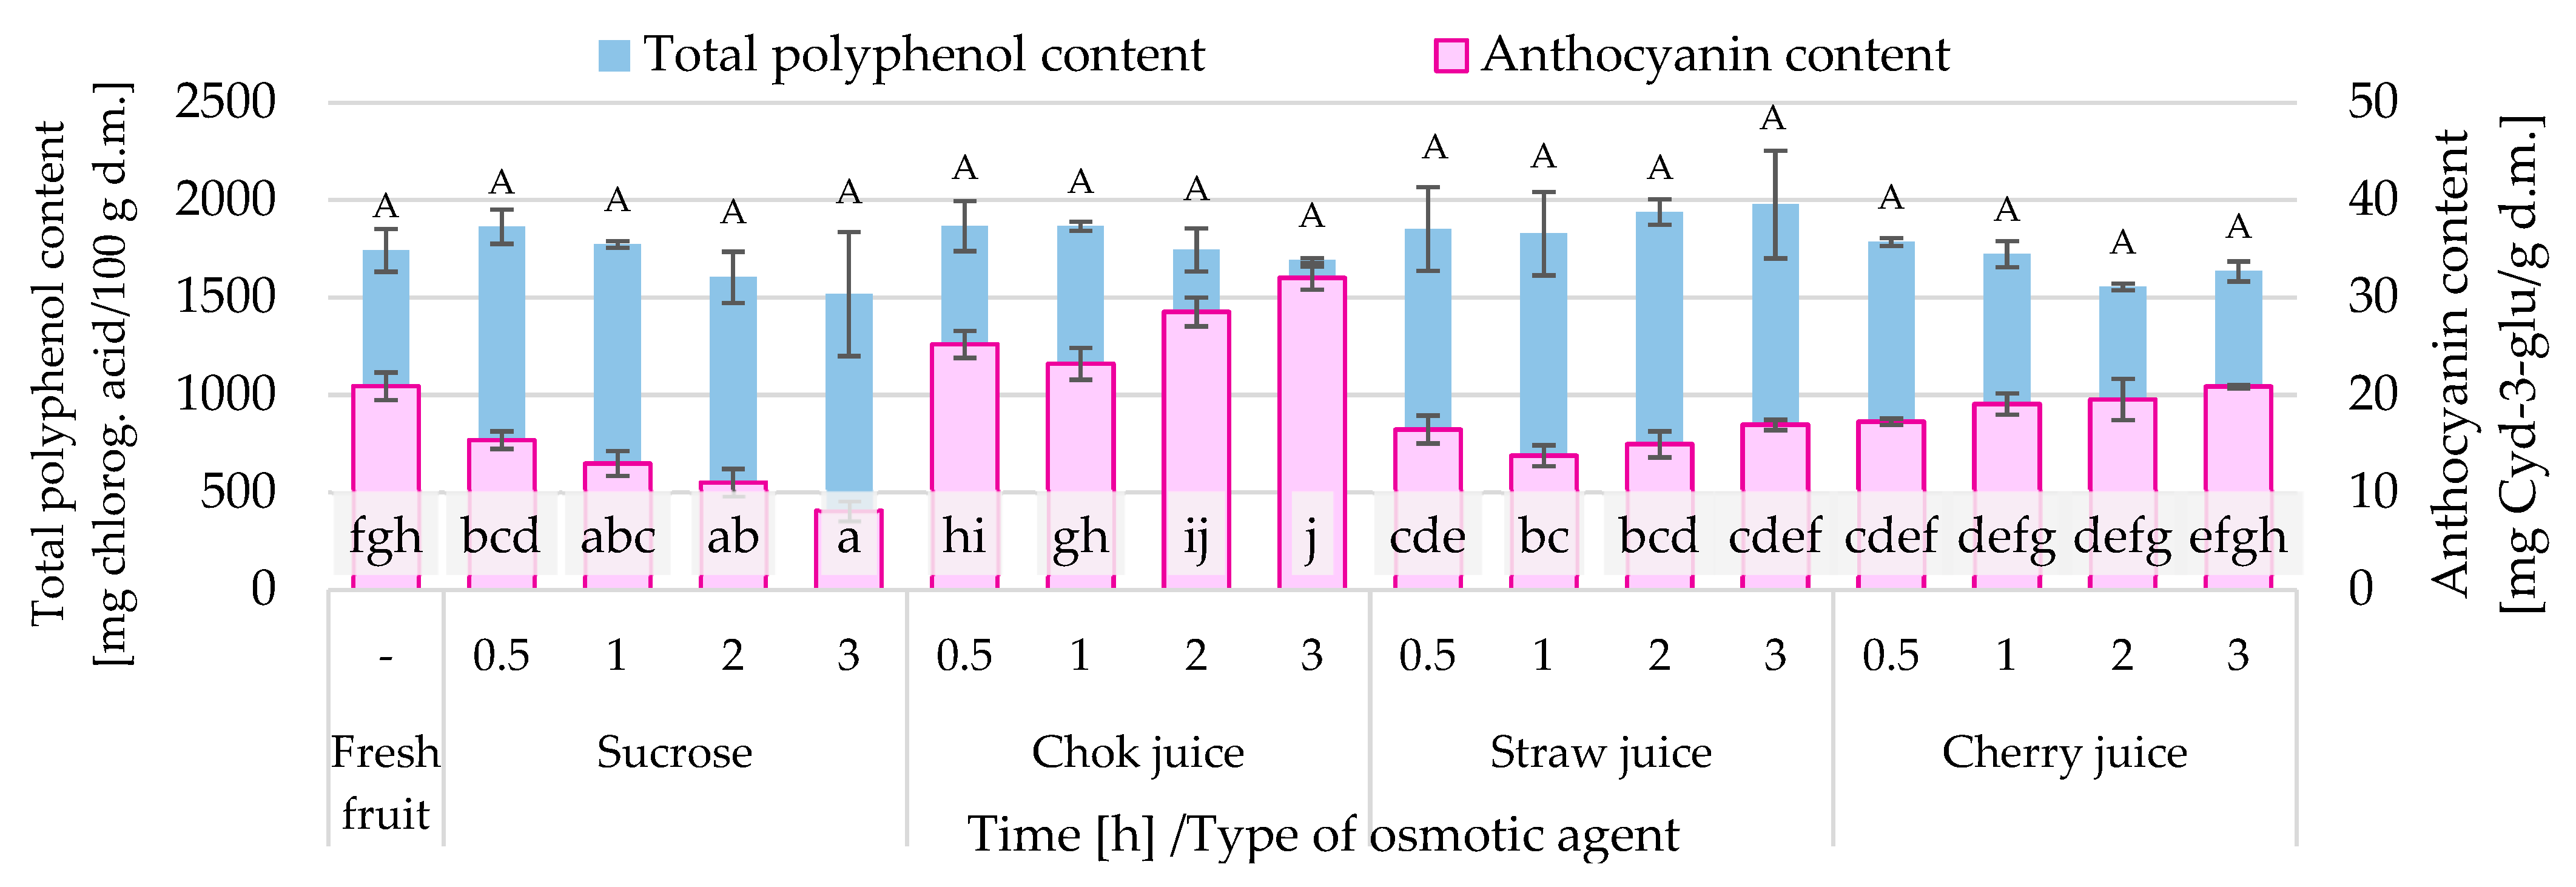
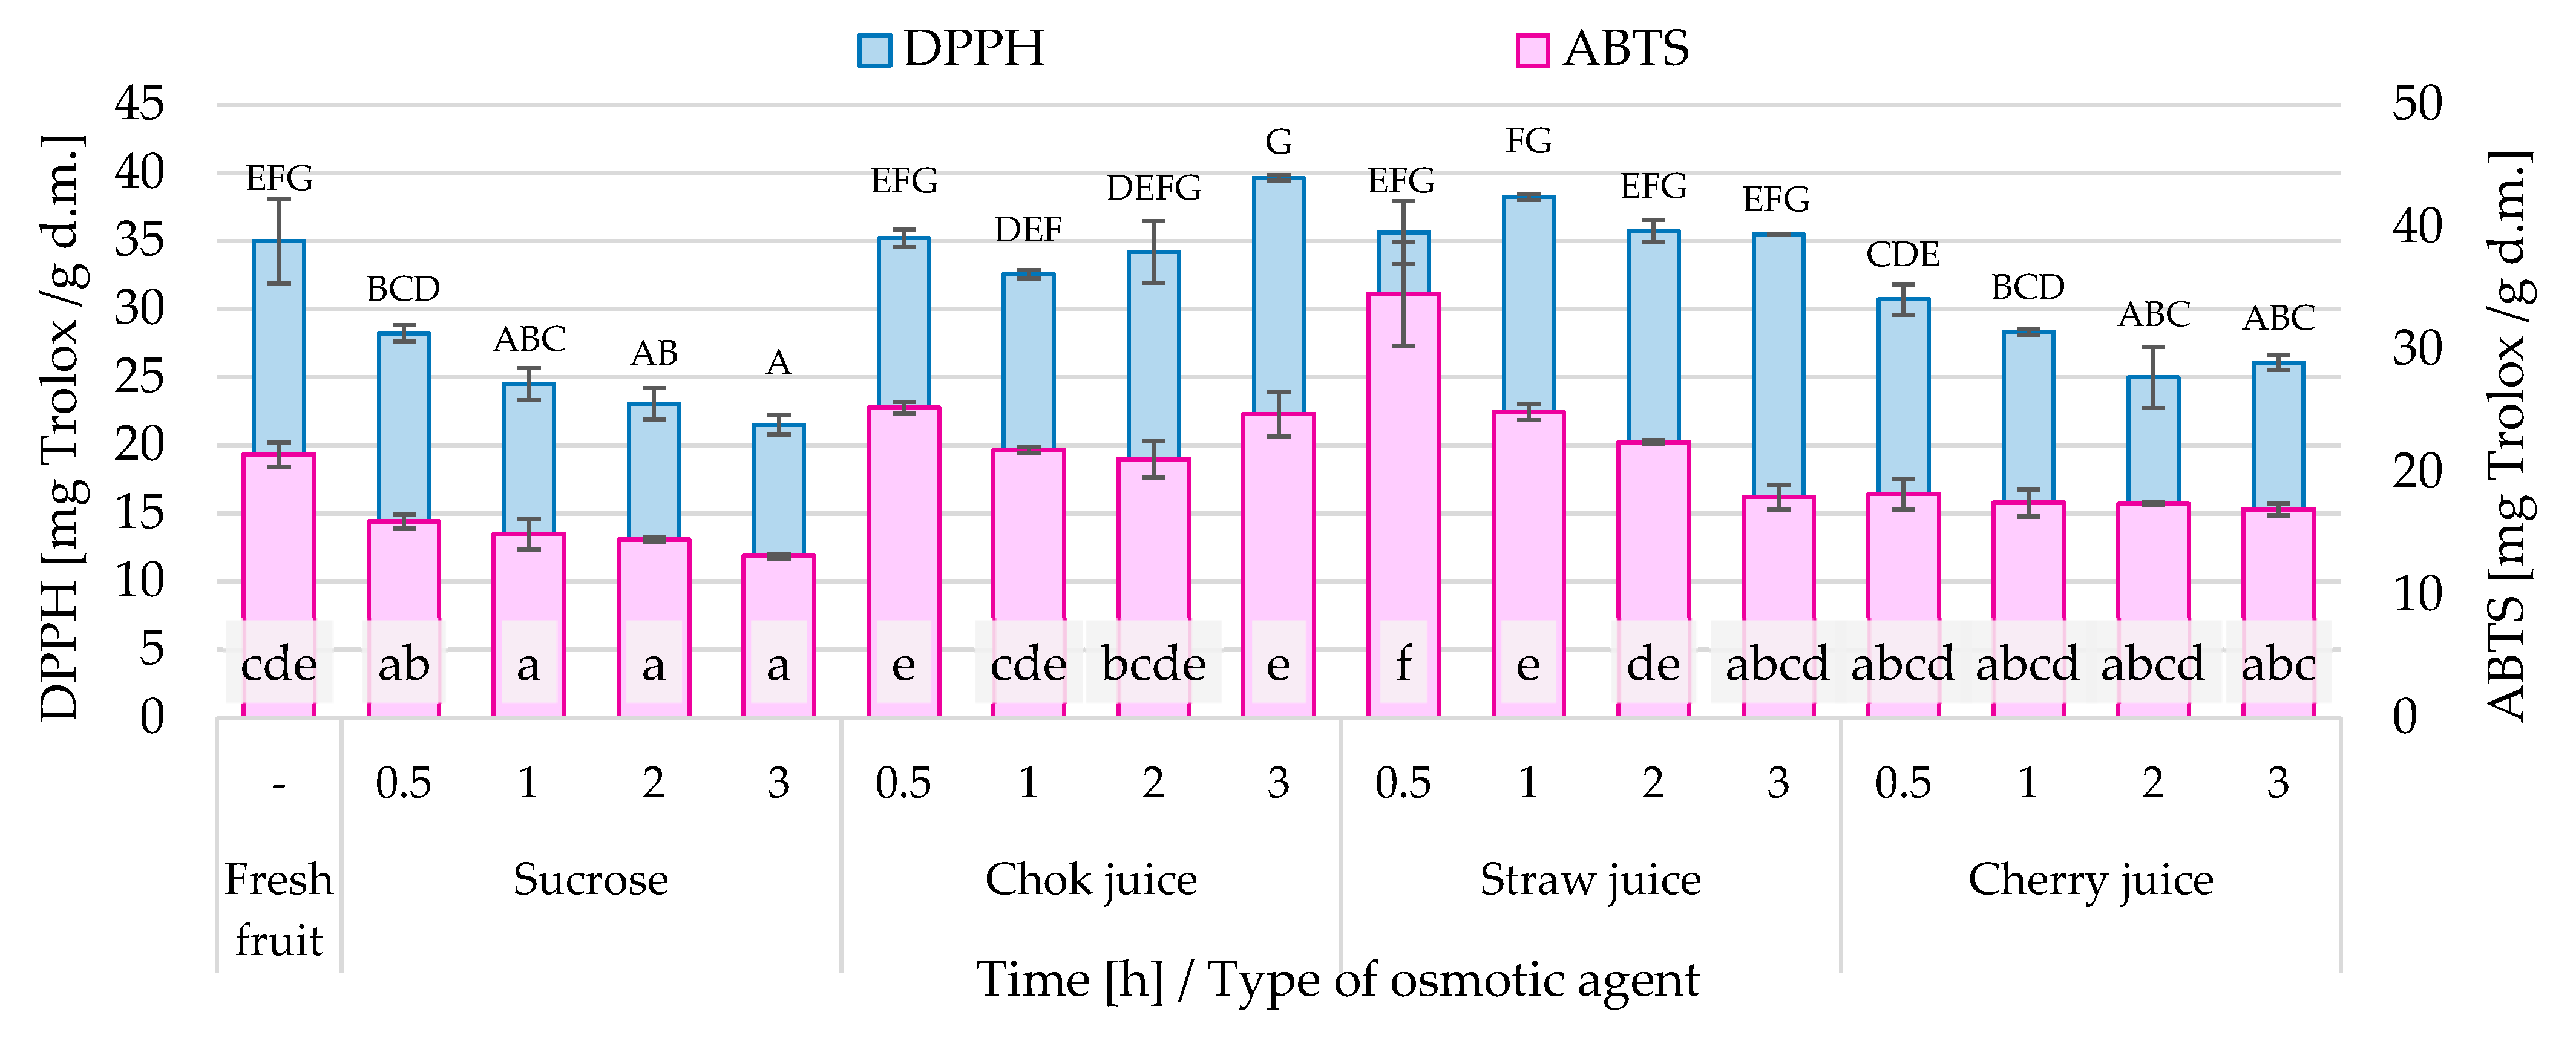
3.3.1. The Influence of Fruit Concentrates on the Bioactive Compounds in Osmotically Dehydrated Strawberries

Vitamin C was evaluated with ultra-performance liquid chromatography. In the fresh strawberries, vitamin C content is equal to 235.8 ± 5.7 mg/100 g d.m. (Figure 5). Due to the high thermolability and solubility, the vitamin C content in 3 h dehydrated fruit was significantly lower compared with the raw material. Statistical analysis showed that the content of ascorbic acid in fresh strawberries was statistically higher than in samples subjected to osmotic dehydration. The highest value of vitamin C was found in fruits dehydrated in the strawberry juice concentrate solution (220.48 ± 3.62 mg/100 g d.m.), while the lowest (65.60 ± 3.03 mg/100 g d.m.) was found in strawberries dehydrated in a sucrose solution, as expected. The statistical analysis showed a significant difference in the content of ascorbic acid between strawberries dehydrated in the strawberry juice concentrate solution and solutions of chokeberry, cherries, and sucrose. During the osmotic dehydration, mass transfer occurs and bioactive compounds contained in the juice concentrate solution penetrate the tissue of the raw material. On the other hand, the raw material loses its valuable substances as a result of leaching into the osmotic solution. Strawberry is rich in vitamin C [1], therefore the material dehydrated in the strawberry concentrate solution recorded the highest content of this vitamin. The low content of vitamin C in the strawberries dehydrated in the sucrose solution and juice concentrates, in this case, chokeberry and cherries, results from the low or lack of content of these compounds in them. The literature data show that chokeberry fruits contain about 2.4 mg/100 g of fresh fruit [36], cherries 62.4 mg/100 g of fresh weight (f.w.), and strawberries 90.1 mg/100 g f.w. [3]. Juice concentrates probably contained vitamin C in proportion to these amounts; therefore, in dehydrated strawberries, high content was found only with the use of a strawberry juice concentrate. The content of total polyphenols in chokeberry fruits is about 2919.4 mg/100 g d.m. [7], in cherry fruit about 314.4 mg/100 g f.w. [3], which may correspond to about 3000 mg/100 g d.m., and in strawberries (our research) about 1743 mg of chlorogenic acid/100 g d.m.
The total content of polyphenols in fresh strawberries was about 1743 mg of chlorogenic acid/100 g d.m. (Figure 6). The content of polyphenols in osmotically dehydrated fruits differed significantly depending on the type of osmotic agent used (p < 0.05). However, there was no effect of dehydration time on the value of this index (p > 0.05). Nevertheless, Lech et al. [7] noticed that, with a longer time of osmotic dehydration in chokeberry juice for carrot and zucchini, changes were statistically significant only for zucchini. The use of a sucrose solution and cherry concentrates resulted in a decrease in polyphenol content by about 6%. On the other hand, osmotic dehydration of strawberries in chokeberry and strawberry juice concentrate increased the content of these compounds by about 1 and 10%, respectively. However, all these changes were not statistically significant, so it can be noticed only as a trend.
Anthocyanins give fruits their color from blue to purple and red to orange. They have a positive (pro-healthy) effect on the functioning of the body, but, due to the action of oxygen, light, temperature, and other factors, they are degraded [30]. Thus, new ways of preserving or enriching them are needed. Fresh strawberries were characterized by the content of anthocyanins at the level of 20.9 mg Cyd-3-glu/g d.m. Statistical analysis showed a significant effect of the type of osmotic agent (p < 0.05) and no effect of the processing time (p > 0.05) on the content of these compounds in osmotically dehydrated strawberries (Figure 6). In strawberries osmotically dehydrated in a chokeberry juice concentrate, their content significantly increased to about 32.9 mg Cyd-3-glu/g d.m. Additionally, when sour cherry was subjected to osmotic dehydration in an apple juice concentrate mixed with a sour cherry juice concentrate it resulted in a higher content of anthocyanin than the samples dehydrated in a sucrose or apple juice concentrate. This was connected with the cherry juice uptake during the osmotic dehydration process [15]. In the case of strawberries dehydrated in a sucrose solution, the content of anthocyanins decreased by half (49%). The use of strawberry juice concentrate reduced these losses to about 27% and the use of cherry juice concentrate reduced these losses to about 5%. Chokeberry fruit, therefore also juice concentrate, is a rich source of anthocyanins [49]. Using a chokeberry juice concentrate for the osmotic dehydration of strawberries may be particularly beneficial for producing the so-called soft snacks with reduced moisture IMF (intermediate moisture food) and health-promoting features.
Figure 7 presents the effect of the type of osmotic agent on the antioxidant activity of osmodehydrated strawberries. The ABTS test gave a lower antioxidant capacity than the DPPH test. According to Minutti-López Sierra [50], the ABTS radical measured the antioxidant capacity of hydrophilic and lipophilic compounds and the DPPH of hydrophobic compounds. Statistical analysis showed a significant effect of the type of osmotic agent (p < 0.05) and no effect of dehydration time (p > 0.05) on the radical scavenging activity for DPPH and ABTS radicals. Since the DPPH and ABTS values were varied and, depending on the osmotic agent used, they increased, decreased, or were constant in the range of 0.5–3 h of dehydration, their average values over this time range were compared. Strawberries subjected to a sucrose solution and a cherry juice concentrate were characterized by, respectively, 24.4–34.2% and 19.4–33.7% lower values of antioxidant activity than fresh strawberries. However, for strawberries dehydrated in chokeberry and strawberry juice concentrates the values of both indicators were found to be 1.3–5% higher. Similar effects were observed for carrots and zucchini [7] and for apples [13], where the increase of antioxidant activity was observed with the increasing time of osmotic dehydration in chokeberry juice.
The FTIR spectra of the solutions (Figure 8a), as well as samples after osmotic dehydration (Figure 8b), were conducted in order to compare changes in the chemical structure of strawberries dehydrated in different osmotic agents. As can be seen from Figure 8, the osmotic solutions, as well as strawberries dehydrated in sucrose and juice concentrates, were characterized by the similar vibrational modes of molecules in the samples, allowing for the identification of functional groups and chemical compositions. In the case of the osmotic solutions, the lower absorbance of the vibration (Figure 8a) was observed in comparison with strawberries subjected to the osmotic dehydration in those solutions (Figure 8b).
Differences between the samples were observed mainly in the area between the wavenumber range of 1800–600 cm−1 and in the area of the C-H and O-H groups at 3500–2800 cm−1 [51]. In the first range of spectral wavenumbers (4000–3600 cm−1), vibrations associated with water molecules were visible. Then, in the region of 3600–3000 cm−1, a wide peak was noted, typical for the vibrations of the hydroxyl group, which may be derived from alcohols, phenols, or carboxylic acids [52]. The characteristic band around 2950–2750 cm−1 corresponded to the presence of vibrations of alkyl groups -CH2 and -CH3. Absorbance peaks in the range of 1450–1300 cm−1 also indicated the presence of alkanes in the strawberries dehydrated in different osmotic agents. Stretching vibrations around the area of 1750–1650 cm−1 indicated the presence of a carbonyl group. Spectra in this range of wavenumbers were characteristic of aldehydes, esters, and aromatic acids. In this range, a decrease in absorbance intensity was observed, especially for strawberries osmotically dehydrated in a sucrose solution. Spectral regions 1150–900 cm−1 were represented by C-O, C-C, and C-O-C bonds, e.g., by various groups of saccharides such as glucose, sucrose, and fructose [27]. The highest absorbance intensity was recorded for strawberries osmotically dehydrated with a sucrose solution. The last spectral region (below 900 cm−1) provided information about conformational changes of the tested raw material, in which each organic compound exhibited unique molecular vibrations [53].

3.3.2. The Impact of Fruit Concentrates on the Sugar Content in Osmotically Dehydrated Strawberries
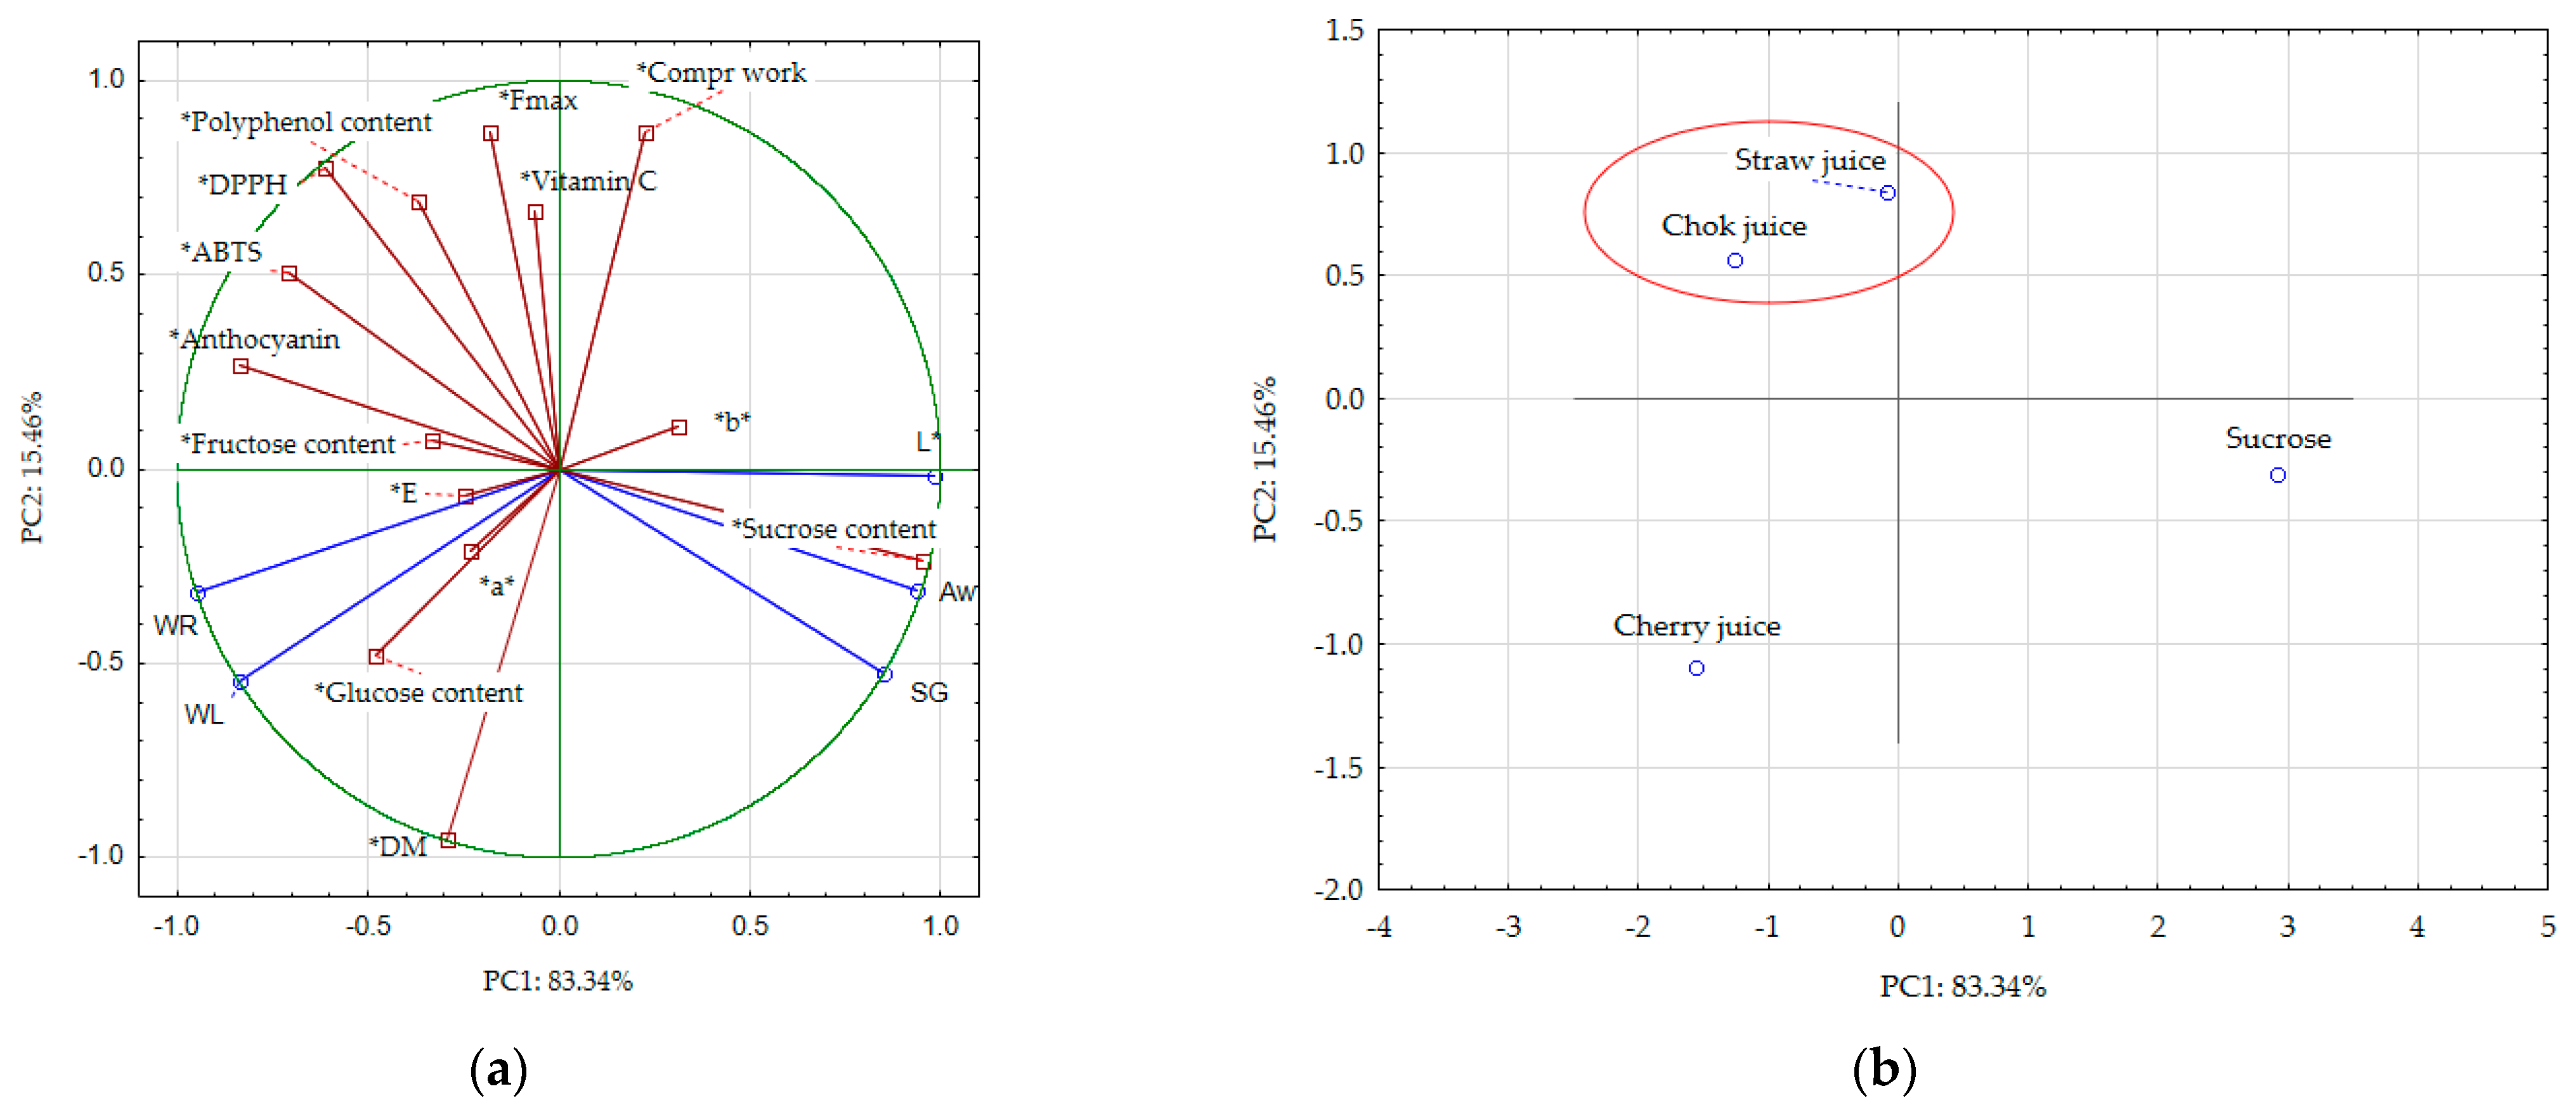
The fresh strawberries were characterized by the sucrose content at the level of 1.3 ± 0.04 g/100 g d.m., glucose 29.5 ± 1.81 g/100 g d.m., and fructose 33.8 ± 1.51% g/100 g d.m. Figure 9 shows the content of individual sugars in osmotically dehydrated strawberries after 3 h. Based on these data, significant differences in sugar content as a result of the dehydration process were observed. As a result of the dehydration of strawberries with sucrose solution, the level of sucrose content increased to 36.7 ± 1.6 g/100 g d.m. However, in the case of fruit juice concentrate solutions, the sucrose content was reduced compared with fresh strawberries. These observations may result from the leaching of sucrose from the strawberry tissue, in the case of fruit juice concentrates, resulting in its lower content. On the other hand, the increase in the sucrose content is caused by the saturation of the raw material with a sucrose solution and, as a result, an increase in its content. A similar effect was observed by Konopacka et al. in sour cherry dehydrated in an apple juice concentrate and a mixture of apple and cherry juice concentrates [15]. Strawberries osmotically dehydrated in strawberry and cherry juice concentrates were characterized by an increase in the content of glucose and fructose. Additionally, Wang et al. [29] noticed a higher content of glucose and fructose in apple slices after osmotic dehydration in apple, grape, and cranberry juice concentrates. Furthermore, strawberries dehydrated in sucrose and chokeberry solutions recorded a decrease in these sugars. The fructose content was significantly higher in strawberries dehydrated in the strawberry juice concentrate solution. These differences can be explained by the different molar masses of the used osmotic solutions. Those with lower molar masses allow for an increased diffusion of the substance into the tissue of the raw material. The result is an increased sugar content [54]. Statistical analysis showed significant differences in glucose content between the strawberry dehydrated in the cherry juice concentrate solution and the other strawberry samples.
Figure 10 shows the thermograms of fresh and osmotic dehydrated strawberries. The presented thermogravimetric curves show that the mass of the raw material decreased with the increase in temperature. All samples showed three phases of thermal decomposition. The first phase is from ambient temperature to 100 °C and is related to the evaporation of moisture [51]. In this stage, the total weight loss was from 3.1 to 4.4%. The second stage was recorded in the temperature range of 100–220 °C, where two small peaks were observed from 105–165 °C and 151–197 °C and a high peak was observed in the range of 170–212 °C [55]. The first two peaks are from fructose and glucose, while those degraded in the temperature range of 170–212 °C is sucrose. The mass loss was the highest for strawberries dehydrated in a sucrose solution. There was a noted mass loss from 28.6% for strawberries dehydrated in a chokeberry juice concentrate to 35.6% for material dehydrated in a sucrose solution. This is in agreement with the results presented in Figure 9. Next, the phase from 220–450 °C is observed, where the material is lost from 27.2 to 38% of its initial weight. In these temperatures, decomposition of the polysaccharides such as hemicellulose, cellulose, and lignin occurs [27]. The highest peak in this phase is observed for the chokeberry juice concentrate, where the mass loss was the highest and equal to 39.2%. The last phase was from 450 to 600 °C, where the mass loss was from 3.5 to 4.6%, where lignocellulose is further decomposed [27,55].

3.4. PCA Results

In order to determine differences and similarities (correlations) [14] between the analyzed dehydrated fruits in terms of the type of osmotic agent and mass exchange indices (water loss, solid gain, weight reduction, dry matter content) and physical properties assessed in terms of compression force and work, as well as composition (the content of total polyphenols, anthocyanins, ascorbic acid, and sugars, as well as antioxidant activity), a major component analysis with classification (PCA) for strawberries dehydrated for 3 h was performed (Figure 11a). The main components (PC1 and PC2) explain 98.5% of the variability in the properties of dehydrated fruit.
Weight reduction was strongly (r2 = 0.97, data not shown) positively correlated with fruit water loss, while relatively low solid gain values had no effect on these indicators (Figure 11a), which confirms that water migration from the samples to the surroundings was predominately mass flux during osmotic dehydration. The water activity of dehydrated strawberries was strongly correlated with solid gain and sucrose content (r2 = 0.96 and 0.99). Such results are very interesting when comparing them with previously mentioned results, despite the fact that water loss dominated solid gain and the uptake of solids participated in the creation of water activity value as well. It was shown that the compressive force Fmax and the compressive work correlated negatively with dry matter content (r2 = −0.81 and −0.85, respectively). Although osmotically dehydrated products are not hard and crunchy, appropriate softness is desirable in them and the changes in their mechanical properties may be mainly related to changes in the tissue structure caused by osmotic dehydration. Lower dry matter content could be associated with smaller changes in structure, a lower solid gain, greater firmness, and higher values of mechanical properties. DPPH and ABTS indices were strongly positively correlated with the content of anthocyanins (r2 = 0.80 and 0.93), while DPPH also correlated with the content of total polyphenol content (r2 = 0.66) and both negatively correlated with solid gain (r2 = −0.89 and −0.93). The negative correlation between solid gain and antioxidant activity shows that the role of osmotic agents represents a protective role rather than being a source (per se) of biological compounds. It was also interesting that the total polyphenol content was strongly correlated with the vitamin C content (r2 = 0.94) of the dehydrated strawberries.
Among the color parameters, color lightness L* was positively correlated with solid gain (r2 = 0.85) and sucrose content and negatively correlated with mass and water loss (r2 = −0.80 and 0.92) and anthocyanin content (r2 = −0.91). The increased content of anthocyanins in the chokeberry juice concentrate caused the greatest darkening and color changes in dehydrated strawberries (Figure 11a, Table 2, Figure 6). The color parameter a* correlated with glucose and fructose content (r2 = 0.90 and 0.95) and b* correlated with vitamin C and fructose content (r2 = 0.75 and 0.79). The color parameters a*, b*, and ΔE and the fructose content had the least influence on the PCA (the shortest lines in the PCA diagram) and did not correlate significantly (p < 0.05) with any of the factors. This explains that the color of all samples, although varied depending on the type of osmotic agent, did not significantly depend on the mass exchange and physicochemical indices.
The use of osmotic dehydration in various osmotic media allowed to divide the obtained data, as in Figure 11b. The type of osmotic solution was an important factor in data clustering.

4. Conclusions

The use of fruit juice concentrates as osmotic agents affects the formation of the physicochemical properties of strawberries. With great advantage, such agents can replace the commonly used sucrose solution.
The use of juice concentrates resulted in a higher mass exchange effect (by 3.4–25.5%) compared with the sucrose solution. The higher weight reduction of dehydrated fruits resulted from higher water losses and only slightly higher solid gains. There was no effect of the type of osmotic agent on the water activity of dehydrated strawberries. A longer time of osmotic dehydration caused a significant decrease in this indicator. The highest decrease of water activity to 0.873 was obtained in strawberries dehydrated in a cherry concentrate for 3 h. These fruits showed the highest dry matter content (36.5 ± 2.2%). However, further processing such as drying is required to assure the longer stability of the product.
Fruit concentrates are a good osmotic agent for shaping the color and texture of osmotically dehydrated strawberries, as well as preserving or increasing the content of compounds with antioxidant properties, especially concentrates of chokeberry and strawberry juices. Compared with fresh strawberries, osmotically dehydrated strawberries showed a high content of polyphenols (1632–1915 chlorogenic acid/100 g d.m.). The use of chokeberry juice concentrate enriched dehydrated strawberries in anthocyanins; the strawberry juice concentrate had a positive effect on the content of vitamin C.
The use of fruit juice concentrates for osmotic dehydration of strawberries has a positive effect on the sugar profile by reducing the sucrose content in favor of naturally occurring sugars, mainly glucose and fructose, in fruit concentrates.

Author Contributions

Conceptualization, M.N., A.W. and D.W.-R.; methodology, M.N. and K.R.; software, A.W.; validation, K.R. and M.N.; formal analysis, M.T. and H.K.; investigation, K.R., M.T., A.W. and M.N.; resources, D.W.-R.; data curation, H.K.; writing—original draft preparation, H.K., M.N., M.T., K.R., A.W. and D.W.-R.; writing—review and editing, H.K., M.N., A.W. and D.W.-R.; visualization, H.K., M.T. and M.N.; supervision, M.N., A.W. and D.W.-R.; project administration, M.N.; funding acquisition, M.N. All authors have read and agreed to the published version of the manuscript.

Funding

This research was funded by transnational funding bodies, partners of the H2020 ERANETs SUSFOOD2 and CORE Organic Cofunds, under the Joint SUSFOOD2/CORE Organic Call 2019 (MILDSUSFRUIT) as well as National Centre for Research and Development (POLAND, decision DWM/SF-CO/31/2021). This research was performed by using research equipment purchased as part of the “Food and Nutrition Centre—modernisation of the WULS campus to create a Food and Nutrition Research and Development Centre (CŻiŻ)” co-financed by the European Union from the European Regional Development Fund under the Regional Operational Programme of the Mazowieckie Voivodeship for 2014–2020 (Project No. RPMA.01.01.00-14-8276/17).

Institutional Review Board Statement

Not applicable.

Informed Consent Statement

Not applicable.

Data Availability Statement

The data presented in this study are available on request from the corresponding author.

Conflicts of Interest

The authors declare no conflict of interest.

References

  1. Wiktor, A.; Chadzynska, M.; Rybak, K.; Dadan, M.; Witrowa-Rajchert, D.; Nowacka, M. The Influence of Polyols on the Process Kinetics and Bioactive Substance Content in Osmotic Dehydrated Organic Strawberries. Molecules 2022, 27, 1376. [Google Scholar] [CrossRef] [PubMed]
  2. Avalos-Llano, K.R.; Martín-Belloso, O.; Soliva-Fortuny, R. Effect of pulsed light treatments on quality and antioxidant properties of fresh-cut strawberries. Food Chem. 2018, 264, 393–400. [Google Scholar] [CrossRef] [PubMed]
  3. De Souza, V.R.; Pereira, P.A.P.; Da Silva, T.L.T.; De Oliveira Lima, L.C.; Pio, R.; Queiroz, F. Determination of the bioactive compounds, antioxidant activity and chemical composition of Brazilian blackberry, red raspberry, strawberry, blueberry and sweet cherry fruits. Food Chem. 2014, 156, 362–368. [Google Scholar] [CrossRef] [Green Version]
  4. Bojarska, J.E.; Czaplicki, S.; Zarecka, K.; Zadernowski, R. Phenolic compounds in fruit of selected varieties of strawberry. ŻYWNOŚĆ. Nauk. Technol. Jakość 2006, 13, 20–27. (In Polish) [Google Scholar]
  5. Salazar-Orbea, G.; García-Villalba, R.; Bernal, M.; Hernández, A.; Tomás-Barberán, F.; Sánchez-Siles, L. Stability of phenolic compounds in apple and strawberry: Effect of different processing techniques in industrial set up. Food Chem. 2023, 401, 134099. [Google Scholar] [CrossRef]
  6. Langston, F.M.A.; Nash, G.R.; Bows, J.R. The retention and bioavailability of phytochemicals in the manufacturing of baked snacks. Crit. Rev. Food Sci. Nutr. 2021, 1–37. [Google Scholar] [CrossRef] [PubMed]
  7. Lech, K.; Michalska, A.; Wojdylo, A.; Nowicka, P.; Figiel, A. The influence of the osmotic dehydration process on physicochemical properties of osmotic solution. Molecules 2017, 22, 2246. [Google Scholar] [CrossRef] [PubMed] [Green Version]
  8. Sebii, H.; Bouaziz, M.A.; Sghaier, K.; Danthine, S.; Blecker, C.; Besbes, S.; Attia, H.; Bchir, B. The Effect of Selected Fruit (Apple, Bitter Orange and Grape) Juice Concentrates Used as Osmotic Agents on the Osmotic-Dehydration Kinetics and Physico-Chemical Properties of Pomegranate Seeds. Seeds 2022, 1, 198–209. [Google Scholar] [CrossRef]
  9. Piasecka, E.; Klewicki, R. Osmotic dehydration of fruits in solutions containing fructoooligosaccharides. Zywn. Technol. Jakosc 2009, 2, 138–153. (In Polish) [Google Scholar]
  10. Kowalska, H.; Woźniak, Ł.; Masiarz, E.; Stelmach, A.; Salamon, A.; Kowalska, J.; Piotrowski, D.; Marzec, A. The impact of using polyols as osmotic agents on mass exchange during osmotic dehydration and their content in osmodehydrated and dried apples. Dry. Technol. 2020, 38, 1620–1631. [Google Scholar] [CrossRef]
  11. Peinado, I.; Rosa, E.; Heredia, A.; Escriche, I.; Andrés, A. Influence of processing on the volatile profile of strawberry spreads made with isomaltulose. Food Chem. 2013, 138, 621–629. [Google Scholar] [CrossRef] [PubMed] [Green Version]
  12. Kaur, D.; Singh, M.; Zalpouri, R.; Singh, I. Osmotic dehydration of fruits using unconventional natural sweeteners and non-thermal-assisted technologies: A review. J. Food Process. Preserv. 2022, e16890. [Google Scholar] [CrossRef]
  13. Masztalerz, K.; Lech, K.; Wojdyło, A.; Nowicka, P.; Michalska-Ciechanowska, A.; Figiel, A. The impact of the osmotic dehydration process and its parameters on the mass transfer and quality of dried apples. Dry. Technol. 2021, 39, 1074–1086. [Google Scholar] [CrossRef]
  14. Samborska, K.; Eliasson, L.; Marzec, A.; Kowalska, J.; Piotrowski, D.; Lenart, A.; Kowalska, H. The effect of adding berry fruit juice concentrates and by-product extract to sugar solution on osmotic dehydration and sensory properties of apples. J. Food Sci. Technol. 2019, 56, 1927–1938. [Google Scholar] [CrossRef] [Green Version]
  15. Konopacka, D.; Jesionkowska, K.; Mieszczakowska-Frąc, M.; Plocharski, W. The usefulness of natural concentrated fruit juices as osmotic agents for osmo-dehydrated dried fruit production. J. Fruit Ornam. Plant Res. 2008, 16, 275–284. [Google Scholar]
  16. Lech, K.; Figiel, A.; Michalska, A.; Wojdylo, A.; Nowicka, P. The effect of selected fruit juice concentrates used as osmotic agents on the drying kinetics and chemical properties of vacuum-microwave drying of pumpkin. J. Food Qual. 2020, 2018, 7293932. [Google Scholar] [CrossRef]
  17. Chavan, U.D.; Amarowicz, R. Osmotic Dehydration Process for Preservation of Fruits and Vegetables. J. Food Res. 2012, 1, 202–209. [Google Scholar] [CrossRef] [Green Version]
  18. Mannozzi, C.; Tylewicz, U.; Tappi, S.; Rosa, M.D.; Rocculi, P.; Romani, S. The influence of different pre-treatments on the quality and nutritional characteristics in dried undersized yellow Kiwifruit. Appl. Sci. 2020, 10, 8432. [Google Scholar] [CrossRef]
  19. Fan, K.; Zhang, M.; Bhandari, B. Osmotic-ultrasound dehydration pretreatment improves moisture adsorption isotherms and water state of microwave-assisted vacuum fried purple-fleshed sweet potato slices. Food Bioprod. Process. 2019, 115, 154–164. [Google Scholar] [CrossRef]
  20. Alizehi, M.H.; Niakousari, M.; Fazaeli, M.; Iraji, M. Modeling of vacuum- and ultrasound-assisted osmodehydration of carrot cubes followed by combined infrared and spouted bed drying using artificial neural network and regression models. J. Food Process. Eng. 2020, 43, e13563. [Google Scholar] [CrossRef]
  21. Mannozzi, C.; Cecchini, J.P.; Tylewicz, U.; Siroli, L.; Patrignani, F.; Lanciotti, R.; Rocculi, P.; Dalla Rosa, M.; Romani, S. Study on the efficacy of edible coatings on quality of blueberry fruits during shelf-life. LWT 2017, 85, 440–444. [Google Scholar] [CrossRef]
  22. Mendonça, K.; Correa, J.; Junqueira, J.; Angelis-Pereira, M.; Cirillo, M. Mass Transfer Kinetics of the Osmotic Dehydration of Yacon Slices with Polyols. J. Food Process. Preserv. 2017, 41, e12983. [Google Scholar] [CrossRef]
  23. Fijalkowska, A.; Nowacka, M.; Witrowa-Rajchert, D. The physical, optical and reconstitution properties of apples subjected to ultrasound before drying. Ital. J. Food Sci. 2017, 29, 343–356. [Google Scholar]
  24. Nowacka, M.; Tylewicz, U.; Romani, S.; Dalla Rosa, M.; Witrowa-Rajchert, D. Influence of Ultrasound-Assisted Osmotic Dehydration on the Main Quality Parameters of Kiwifruit; Elsevier Ltd.: Amsterdam, The Netherlands, 2017; Volume 41, ISBN 0547338120. [Google Scholar]
  25. Bochnak-Niedźwiecka, J.; Szymanowska, U.; Świeca, M. The Protein-Rich Powdered Beverages Stabilized with Flax Seeds Gum—Antioxidant and Antiproliferative Properties of the Potentially Bioaccessible Fraction. Appl. Sci. 2022, 12, 7159. [Google Scholar] [CrossRef]
  26. Farias, C.A.; Moraes, D.P.; Neuenfeldt, N.H.; Zabot, G.L.; Emanuelli, T.; Barin, J.S.; Ballus, C.A.; Barcia, M.T. Microwave hydrodiffusion and gravity model with a unique hydration strategy for exhaustive extraction of anthocyanins from strawberries and raspberries. Food Chem. 2022, 383, 132446. [Google Scholar] [CrossRef]
  27. Rybak, K.; Wiktor, A.; Kaveh, M.; Dadan, M.; Witrowa-Rajchert, D.; Nowacka, M. Effect of Thermal and Non-Thermal Technologies on Kinetics and the Main Quality Parameters of Red Bell Pepper Dried with Convective and Microwave–Convective Methods. Molecules 2022, 27, 2164. [Google Scholar] [CrossRef]
  28. González-Pérez, J.E.; Ramírez-Corona, N.; López-Malo, A. Mass Transfer During Osmotic Dehydration of Fruits and Vegetables: Process Factors and Non-Thermal Methods; Springer: New York, NY, USA, 2021; ISBN 0123456789. [Google Scholar]
  29. Wang, X.; Kahraman, O.; Feng, H. Impact of Osmotic Dehydration with/without Vacuum Pretreatment on Apple Slices Fortified with Hypertonic Fruit Juices. Food Bioprocess Technol. 2022, 15, 1588–1602. [Google Scholar] [CrossRef]
  30. Jurendić, T.; Ščetar, M. Aronia melanocarpa products and by-products for health and nutrition: A review. Antioxidants 2021, 10, 1052. [Google Scholar] [CrossRef]
  31. Cano-Lamadrid, M.; Lech, K.; Michalska, A.; Wasilewska, M.; Figiel, A.; Wojdyło, A.; Carbonell-Barrachina, Á.A. Influence of osmotic dehydration pre-treatment and combined drying method on physico-chemical and sensory properties of pomegranate arils, cultivar Mollar de Elche. Food Chem. 2017, 232, 306–315. [Google Scholar] [CrossRef]
  32. Kowalska, H.; Marzec, A.; Kowalska, J.; Trych, U.; Masiarz, E.; Lenart, A. The Use of a Hybrid Drying Method with Pre-Osmotic Treatment in Strawberry Bio-Snack Technology. Int. J. Food Eng. 2020, 16, 1–14. [Google Scholar] [CrossRef]
  33. Ramya, V.; Jain, N.K. A Review on Osmotic Dehydration of Fruits and Vegetables: An Integrated Approach. J. Food Process. Eng. 2017, 40, e12440. [Google Scholar] [CrossRef]
  34. Rząca, M.; Witrowa-Rajchert, D.; Tylewicz, U.; Rosa, M.D. Mass exchange in osmotic dehydration process of Kiwi fruits. Zywn. Nauk. Technol. Jakosc 2009, 6, 140–149. (In Polish) [Google Scholar]
  35. Moraga, M.J.; Moraga, G.; Martínez-Navarrete, N. Effect of the re-use of the osmotic solution on the stability of osmodehydro-refrigerated grapefruit. LWT—Food Sci. Technol. 2011, 44, 35–41. [Google Scholar] [CrossRef]
  36. Kowalska, J.; Kowalska, H.; Marzec, A.; Brzeziński, T.; Samborska, K.; Lenart, A. Dried strawberries as a high nutritional value fruit snack. Food Sci. Biotechnol. 2018, 27, 799–807. [Google Scholar] [CrossRef] [Green Version]
  37. Sakooei-Vayghan, R.; Peighambardoust, S.H.; Hesari, J.; Soltanzadeh, M.; Peressini, D. Properties of dried apricots pretreated by ultrasound-assisted osmotic dehydration and application of active coatings. Food Technol. Biotechnol. 2020, 58, 249–259. [Google Scholar] [CrossRef] [PubMed]
  38. Castelló, M.L.; Fito, P.J.; Chiralt, A. Changes in respiration rate and physical properties of strawberries due to osmotic dehydration and storage. J. Food Eng. 2010, 97, 64–71. [Google Scholar] [CrossRef]
  39. Nowacka, M.; Dadan, M.; Janowicz, M.; Wiktor, A.; Witrowa-Rajchert, D.; Mandal, R.; Pratap-Singh, A.; Janiszewska-Turak, E. Effect of nonthermal treatments on selected natural food pigments and color changes in plant material. Compr. Rev. Food Sci. Food Saf. 2021, 20, 5097–5144. [Google Scholar] [CrossRef]
  40. Andrés-Bello, A.; Barreto-Palacios, V.; García-Segovia, P.; Mir-Bel, J.; Martínez-Monzó, J. Effect of pH on Color and Texture of Food Products. Food Eng. Rev. 2013, 5, 158–170. [Google Scholar] [CrossRef]
  41. Kowalska, H.; Kowalska, J.; Masiarz, E.; Maziarz, S.; Pochitskaya, I. The use of apple and beetroot juices to osmotic dehydration of apples. Postępy Tech. Przetwórstwa Spożywczego 2020, 1, 51–57. [Google Scholar]
  42. Altuntas, J.; Evrendilek, G.A.; Sangun, M.K.; Zhang, H.Q. Effects of pulsed electric field processing on the quality and microbial inactivation of sour cherry juice. Int. J. Food Sci. Technol. 2010, 45, 899–905. [Google Scholar] [CrossRef]
  43. Gamboa-Santos, J.; Vasco, M.F.; Campañone, L. Diffusional analysis and textural properties of coated strawberries during osmotic dehydration treatment. J. Berry Res. 2021, 11, 151–169. [Google Scholar] [CrossRef]
  44. Barragán-Iglesias, J.; Rodríguez-Ramírez, J.; Sablani, S.S.; Méndez-Lagunas, L.L. Texture analysis of dried papaya (Carica papaya L., cv. Maradol) pretreated with calcium and osmotic dehydration. Dry. Technol. 2019, 37, 906–919. [Google Scholar] [CrossRef]
  45. Kowalska, H.; Marzec, A.; Domian, E.; Kowalska, J.; Ciurzyńska, A.; Galus, S. Edible coatings as osmotic dehydration pretreatment in nutrient-enhanced fruit or vegetable snacks development: A review. Compr. Rev. Food Sci. Food Saf. 2021, 20, 5641–5674. [Google Scholar] [CrossRef] [PubMed]
  46. Han, Y.; Linton, R.H. Fate of Escherichia coli O157:H7 and Listeria monocytogenes in strawberry juice and acidified media at different pH values and temperatures. J. Food Prot. 2004, 67, 2443–2449. [Google Scholar] [CrossRef] [PubMed]
  47. Bermúdez-Soto, M.J.; Tomás-Barberán, F.A.; García-Conesa, M.T. Stability of polyphenols in chokeberry (Aronia melanocarpa) subjected to in vitro gastric and pancreatic digestion. Food Chem. 2007, 102, 865–874. [Google Scholar] [CrossRef]
  48. Prinzivalli, C.; Brambilla, A.; Maffi, D.; Lo Scalzo, R.; Torreggiani, D. Effect of osmosis time on structure, texture and pectic composition of strawberry tissue. Eur. Food Res. Technol. 2006, 224, 119–127. [Google Scholar] [CrossRef]
  49. Benvenuti, S.; Pellati, F.; Melegari, M.; Bertelli, D. Polyphenols, anthocyanins, ascorbic acid, and radical scavenging activity of Rubus, Ribes, and Aronia. J. Food Sci. 2004, 69, 164–169. [Google Scholar] [CrossRef]
  50. Minutti-López Sierra, P.; Gallardo-Velázquez, T.; Osorio-Revilla, G.; Meza-Márquez, O.G. Chemical composition and antioxidant capacity in strawberry cultivars (Fragaria x ananassa Duch.) by FT-MIR spectroscopy and chemometrics. CYTA—J. Food 2019, 17, 724–732. [Google Scholar] [CrossRef] [Green Version]
  51. Jankovic, B.; Marinovic-Cincovic, M.; Jankovic, M. TG-DTA-FTIR analysis and isoconversional reaction profiles for thermal and thermo-oxidative degradation processes in black chokeberry (Aroniamelanocarpa). Chem. Pap. 2016, 70, 1094–1105. [Google Scholar] [CrossRef]
  52. Lam, S.S.; Liew, R.K.; Lim, X.Y.; Ani, F.N.; Jusoh, A. Fruit waste as feedstock for recovery by pyrolysis technique. Int. Biodeterior. Biodegrad. 2016, 113, 325–333. [Google Scholar] [CrossRef]
  53. Przybył, K.; Koszela, K.; Adamski, F.; Samborska, K. Analysis to Detect Polysaccharide in Raspberry Powders. Sensors 2021, 21, 5823. [Google Scholar] [CrossRef] [PubMed]
  54. Bialik, M.; Wiktor, A.; Latocha, P.; Gondek, E. Mass transfer in osmotic dehydration of kiwiberry: Experimental and mathematical modelling studies. Molecules 2018, 23, 1236. [Google Scholar] [CrossRef] [PubMed]
  55. Zlatanović, S.; Ostojić, S.; Micić, D.; Rankov, S.; Dodevska, M.; Vukosavljević, P.; Gorjanović, S. Thermal behaviour and degradation kinetics of apple pomace flours. Thermochim. Acta 2019, 673, 17–25. [Google Scholar] [CrossRef]
Figure 1. Effect of the type of osmotic agent (fruit concentrates) on the mass exchange kinetics of osmodehydrated strawberries: (a) weight reduction, (b) water loss (dashed lines), and solid gain (regular lines).
Applsci 13 02728 g001
Figure 2. Effect of the type of osmotic agent (sucrose and fruit concentrates) on the dry matter content and water activity of osmodehydrated strawberries. Different letters above columns show the statistical difference (p < 0.05).
Applsci 13 02728 g002
Figure 3. Effect of the type of osmotic agent (sucrose and fruit concentrates) on the mechanical properties of osmodehydrated strawberries. Different letters (small letters are for max force, capital letters are for compression work) above columns show the statistical difference (p < 0.05).
Applsci 13 02728 g003
Figure 4. Microstructure (200× magnification) of fresh strawberries osmotically dehydrated for 3 h in solutions of sucrose, chokeberry (chok juice), strawberry (straw juice), and cherry juice concentrates.
Applsci 13 02728 g004
Figure 5. Effect of the type of osmotic agent (sucrose and fruit concentrates) on the vitamin C content in osmodehydrated strawberries. Different letters above columns show the statistical difference (p < 0.05).
Applsci 13 02728 g005
Figure 6. Effect of the type of osmotic agent (sucrose and fruit concentrates) on the total polyphenol content and anthocyanin content in osmodehydrated strawberries. Different letters (small letters are for anthocyanin content, capital letters are for total polyphenol content) above columns show the statistical difference (p < 0.05).
Applsci 13 02728 g006
Figure 7. Effect of the type of osmotic agent (sucrose and fruit concentrates) on the antioxidant activity of osmodehydrated strawberries. Different letters (small letters are for antioxidant activity according to ABTS radical, capital letters are for antioxidant activity according to DPPH radical) above columns show the statistical difference (p < 0.05).
Applsci 13 02728 g007
Figure 8. Fourier transform infrared (FTIR) spectra of the solutions (a) and strawberries after osmotic dehydration (b) conducted in a different type of osmotic agent (sucrose and fruit concentrates).
Applsci 13 02728 g008
Figure 9. Effect of the type of osmotic agent (sucrose and fruit concentrates) on the sugar content of osmodehydrated strawberries. Different letters above columns show the statistical difference (p < 0.05).
Applsci 13 02728 g009
Figure 10. Effect of the type of osmotic agent (sucrose and fruit concentrates) on the sugar content in osmodehydrated strawberries.
Applsci 13 02728 g010
Figure 11. PCA analysis: (a) PCA loading plot of two principal components, (b) score plot presenting analyzed samples in term of PC1 vs. PC2. Markings: DM—dry matter content, WL—water loss, SG—solid gain, Aw—water activity; L*, a*, b*, ΔE—color parameters. Red lines indicate active data included in the PCA analysis, blue lines - additional data. The red line on (b) concerns the separation of a group of data with a similar effect of osmotic agent on the examined physicochemical indicators.
Applsci 13 02728 g011
Table 1. Characteristics of osmotic agents.
Osmotic AgentpH [-]Water Activity [-]Color Parameters
L*a*b*
Sucrose solution8.04 ± 0.01 a0.95 ± 0.01 a99.63 ± 0.01 a−0.22 ± 0.01 a1.44 ± 0.01 c
Juice concentratesChokeberry3.85 ± 0.01 b0.91 ± 0.00 b0.41 ± 0.04 d0.09 ± 0.01 b−0.96 ± 0.09 d
Strawberry3.30 ± 0.01 c0.90 ± 0.00 b9.57 ± 0.01 b42.23 ± 0.08 d15.75 ± 0.11 a
Cherry3.33 ± 0.04 c0.90 ± 0.00 b1.66 ± 0.07 c10.82 ± 0.22 c1.71 ± 0.15 b
Different letters in columns show the statistical difference (p < 0.05).
Table 2. Comparison of color parameters and the absolute color difference of osmotic dehydrated strawberries.
Osmotic Agent Osmo-Dehydration Time (h) Color ParametersΔE
L*a*b*
Fresh fruit-33.79 ± 3.8524.14 ± 3.8319.68± 4.51-
Sucrose0.537.48 ± 2.11 fg21.95 ± 3.63 cd15.49 ± 2.74 d7.43 ± 11.87 ab
138.97 ± 4.33 g21.28 ± 3.57 bcd15.45 ± 2.35 d8.73 ± 3.31 ab
235.86 ± 3.69 efg20.92 ± 3.75 abc16.32 ± 3.79 de7.54 ± 2.67 ab
347.33 ± 4.53 h18.73 ± 4.37 abc14.22 ± 2.59 cd16.12 ± 5.15 cd
Chokeberry Juice0.519.74 ± 3.60 a21.05 ± 5.83 bcd7.30 ± 3.08 ab20.11 ± 2.67 de
123.08 ± 2.42 abc26.79 ± 4.02 de9.88 ± 2.56 bc15.43 ± 20.40 cd
220.94 ± 2.60 ab14.78 ± 5.42 ab3.75 ± 2.08 a23.01 ± 3.84 e
321.01 ± 1.36 ab13.30 ± 4.68 a3.14 ± 1.68 a23.90 ± 2.78 e
Strawberry Juice0.535.47 ± 4.15 efg27.34 ± 3.05 de23.26 ± 3.20 f6.76 ± 3.81 a
137.21 ± 2.77 fg32.37 ± 3.34 e25.68 ± 3.62 f11.08 ± 4.84 abc
232.27 ± 2.33 de32.71 ± 4.64 e20.81 ± 4.10 ef9.92 ± 4.46 ab
332.84 ± 2.21 ef31.91 ± 3.93 e22.63 ± 4.50 f9.40 ± 4.48 ab
Cherry Juice0.525.15 ± 2.49 bc31.77 ± 2.13 e16.12 ± 2.98 de12.63 ± 1.99 bc
127.38 ± 2.40 cd32.19 ± 3.94 e14.94 ± 3.40 cd12.44 ± 1.73 bc
227.52 ± 1.55 cd29.44 ± 2.06 e11.76 ± 1.69 bcd11.75 ± 0.83 abc
323.06 ± 3.76 ab30.66 ± 6.05 e12.83 ± 4.20 cd16.02 ± 3.14 cd
Different letters in columns show the statistical difference (p < 0.05).
Disclaimer/Publisher’s Note: The statements, opinions and data contained in all publications are solely those of the individual author(s) and contributor(s) and not of MDPI and/or the editor(s). MDPI and/or the editor(s) disclaim responsibility for any injury to people or property resulting from any ideas, methods, instructions or products referred to in the content.

