
Digitalization Trend and Its Influence on the Development of the Operational Process in Production Companies


Abstract
:1. Introduction
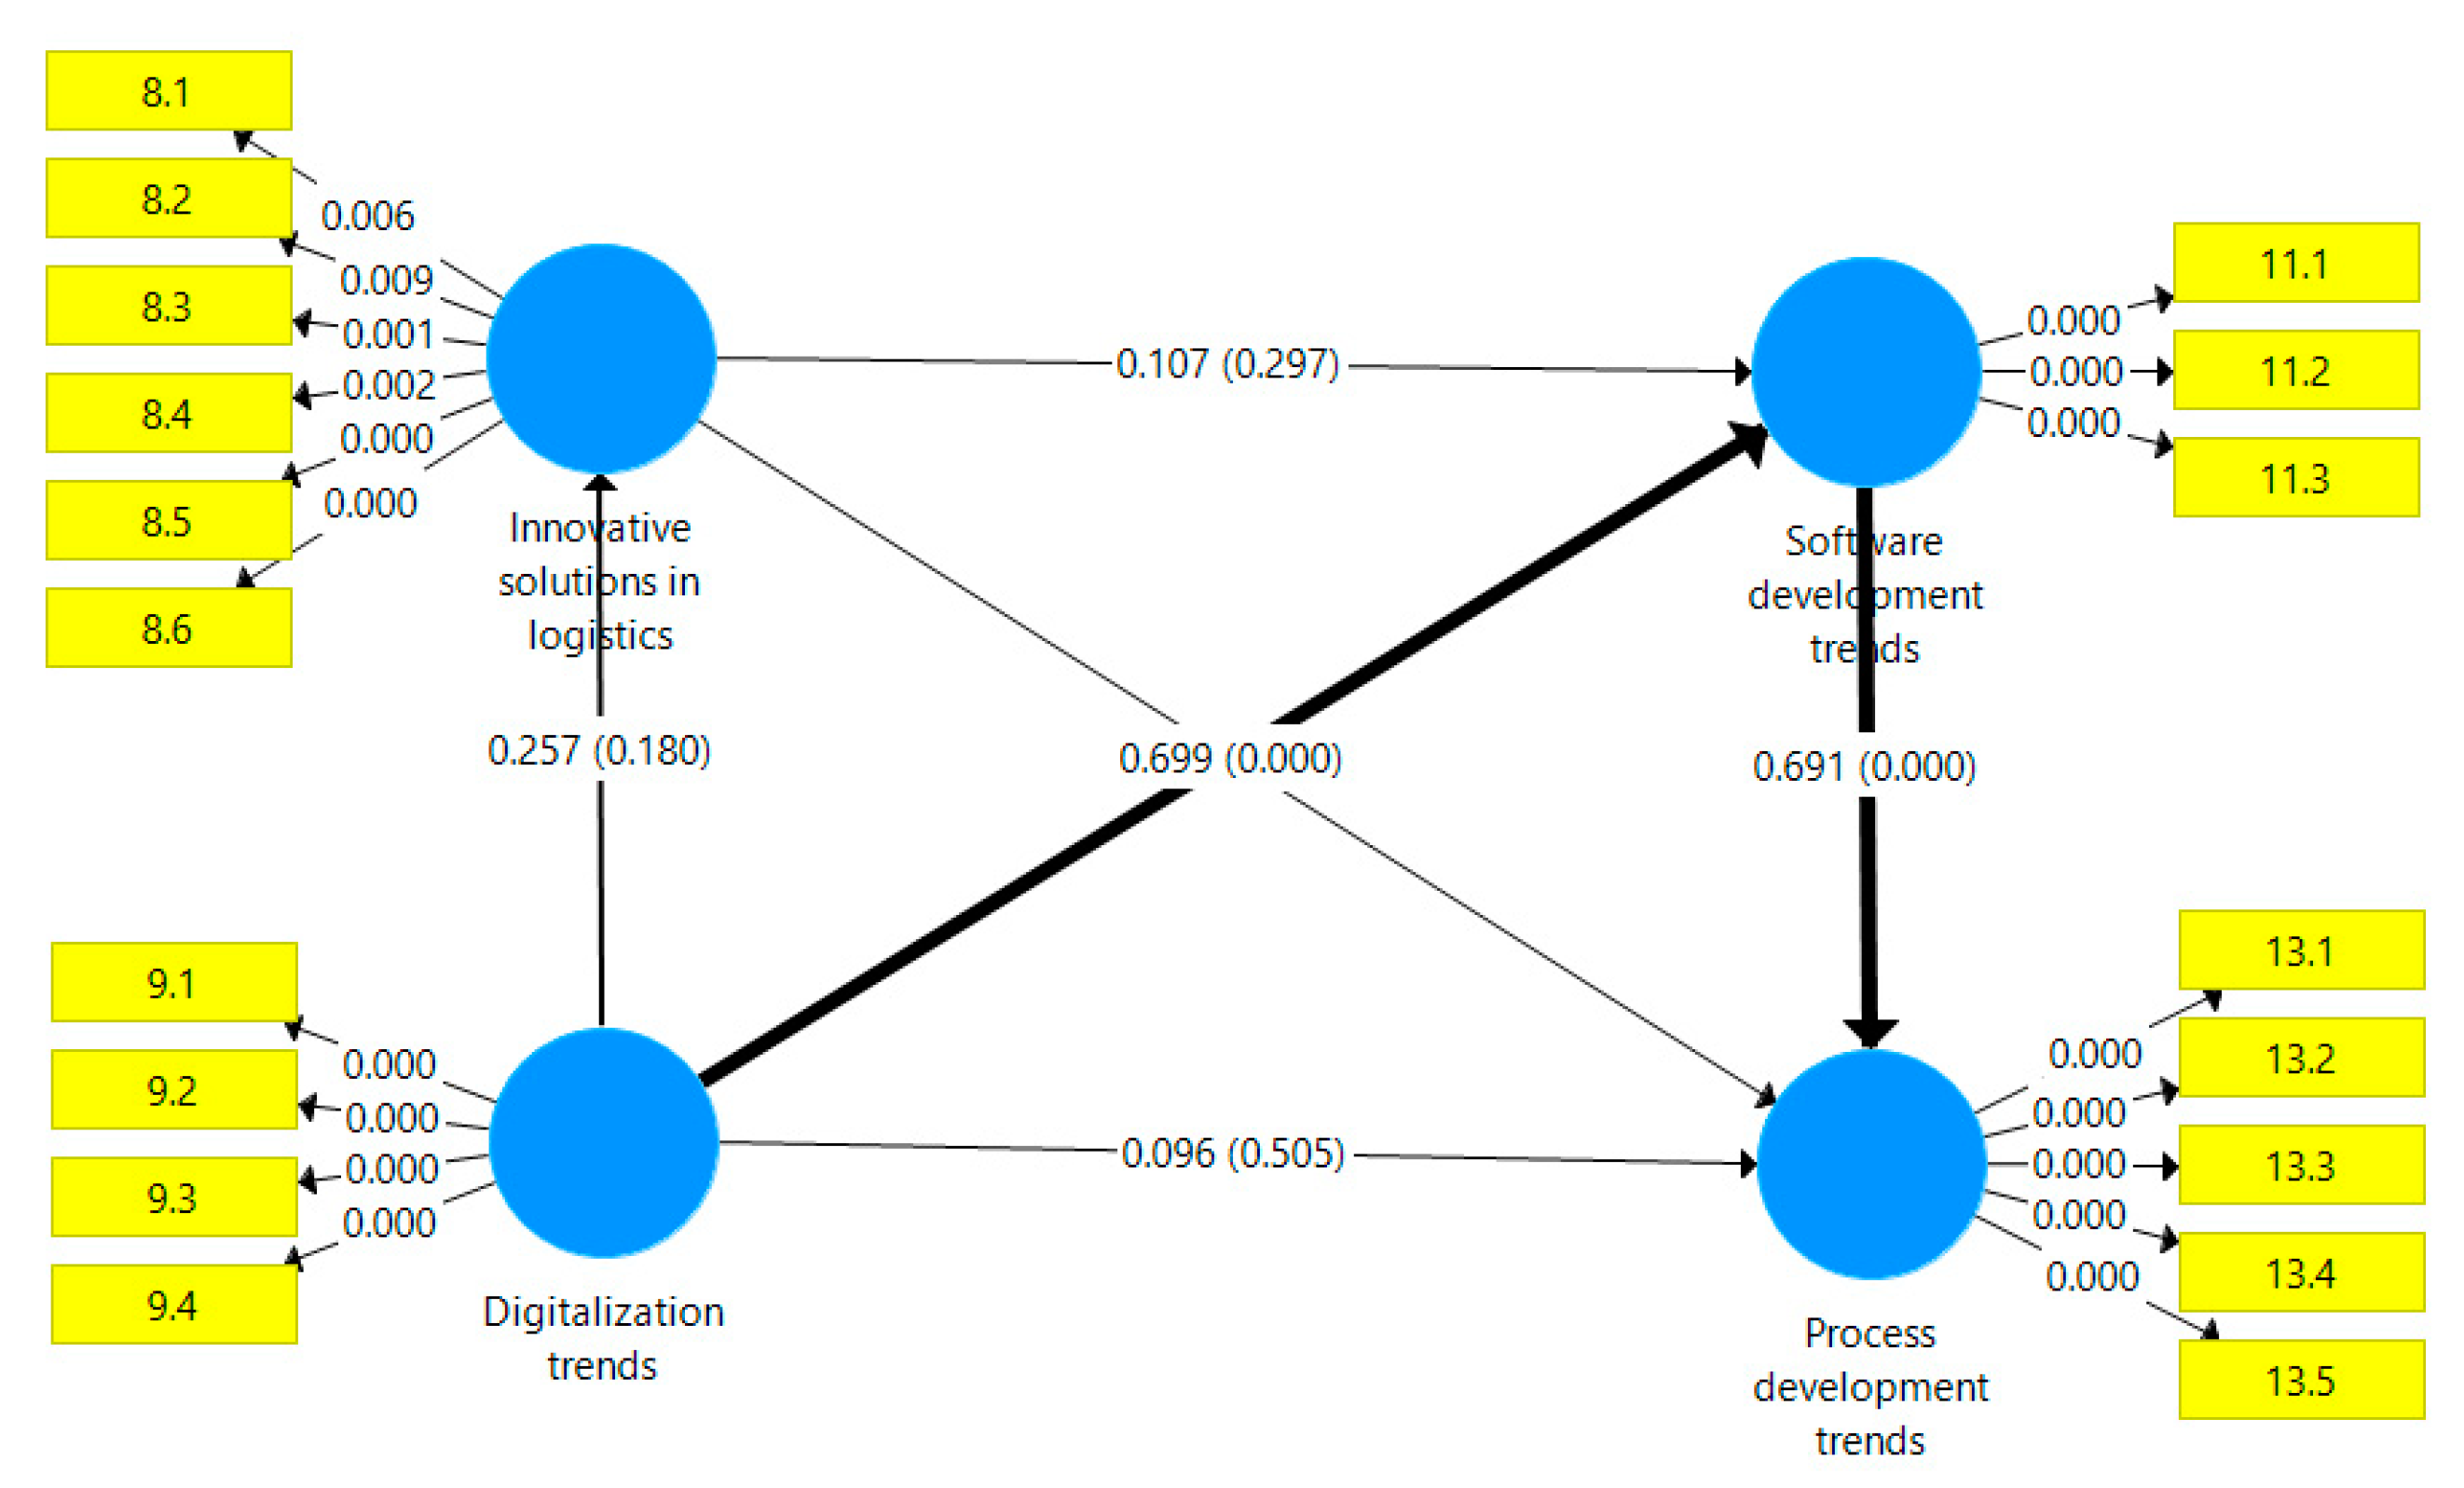
- based on PLS path modeling in order to verify a H1 hypothesis;
- aiming to explore the relationship between digitalization, software, and process, using group comparisons to verify the H2 hypothesis.
2. Literature Review
- Blockchain DLT solutions,
- Intelligent Transport Systems (ITS),
- Robotic Processes Automation (RPA),
- IoT,
- Big Data Analytics,
- Cloud and APIs.
- Digitalization (perspective 1 year+), including:
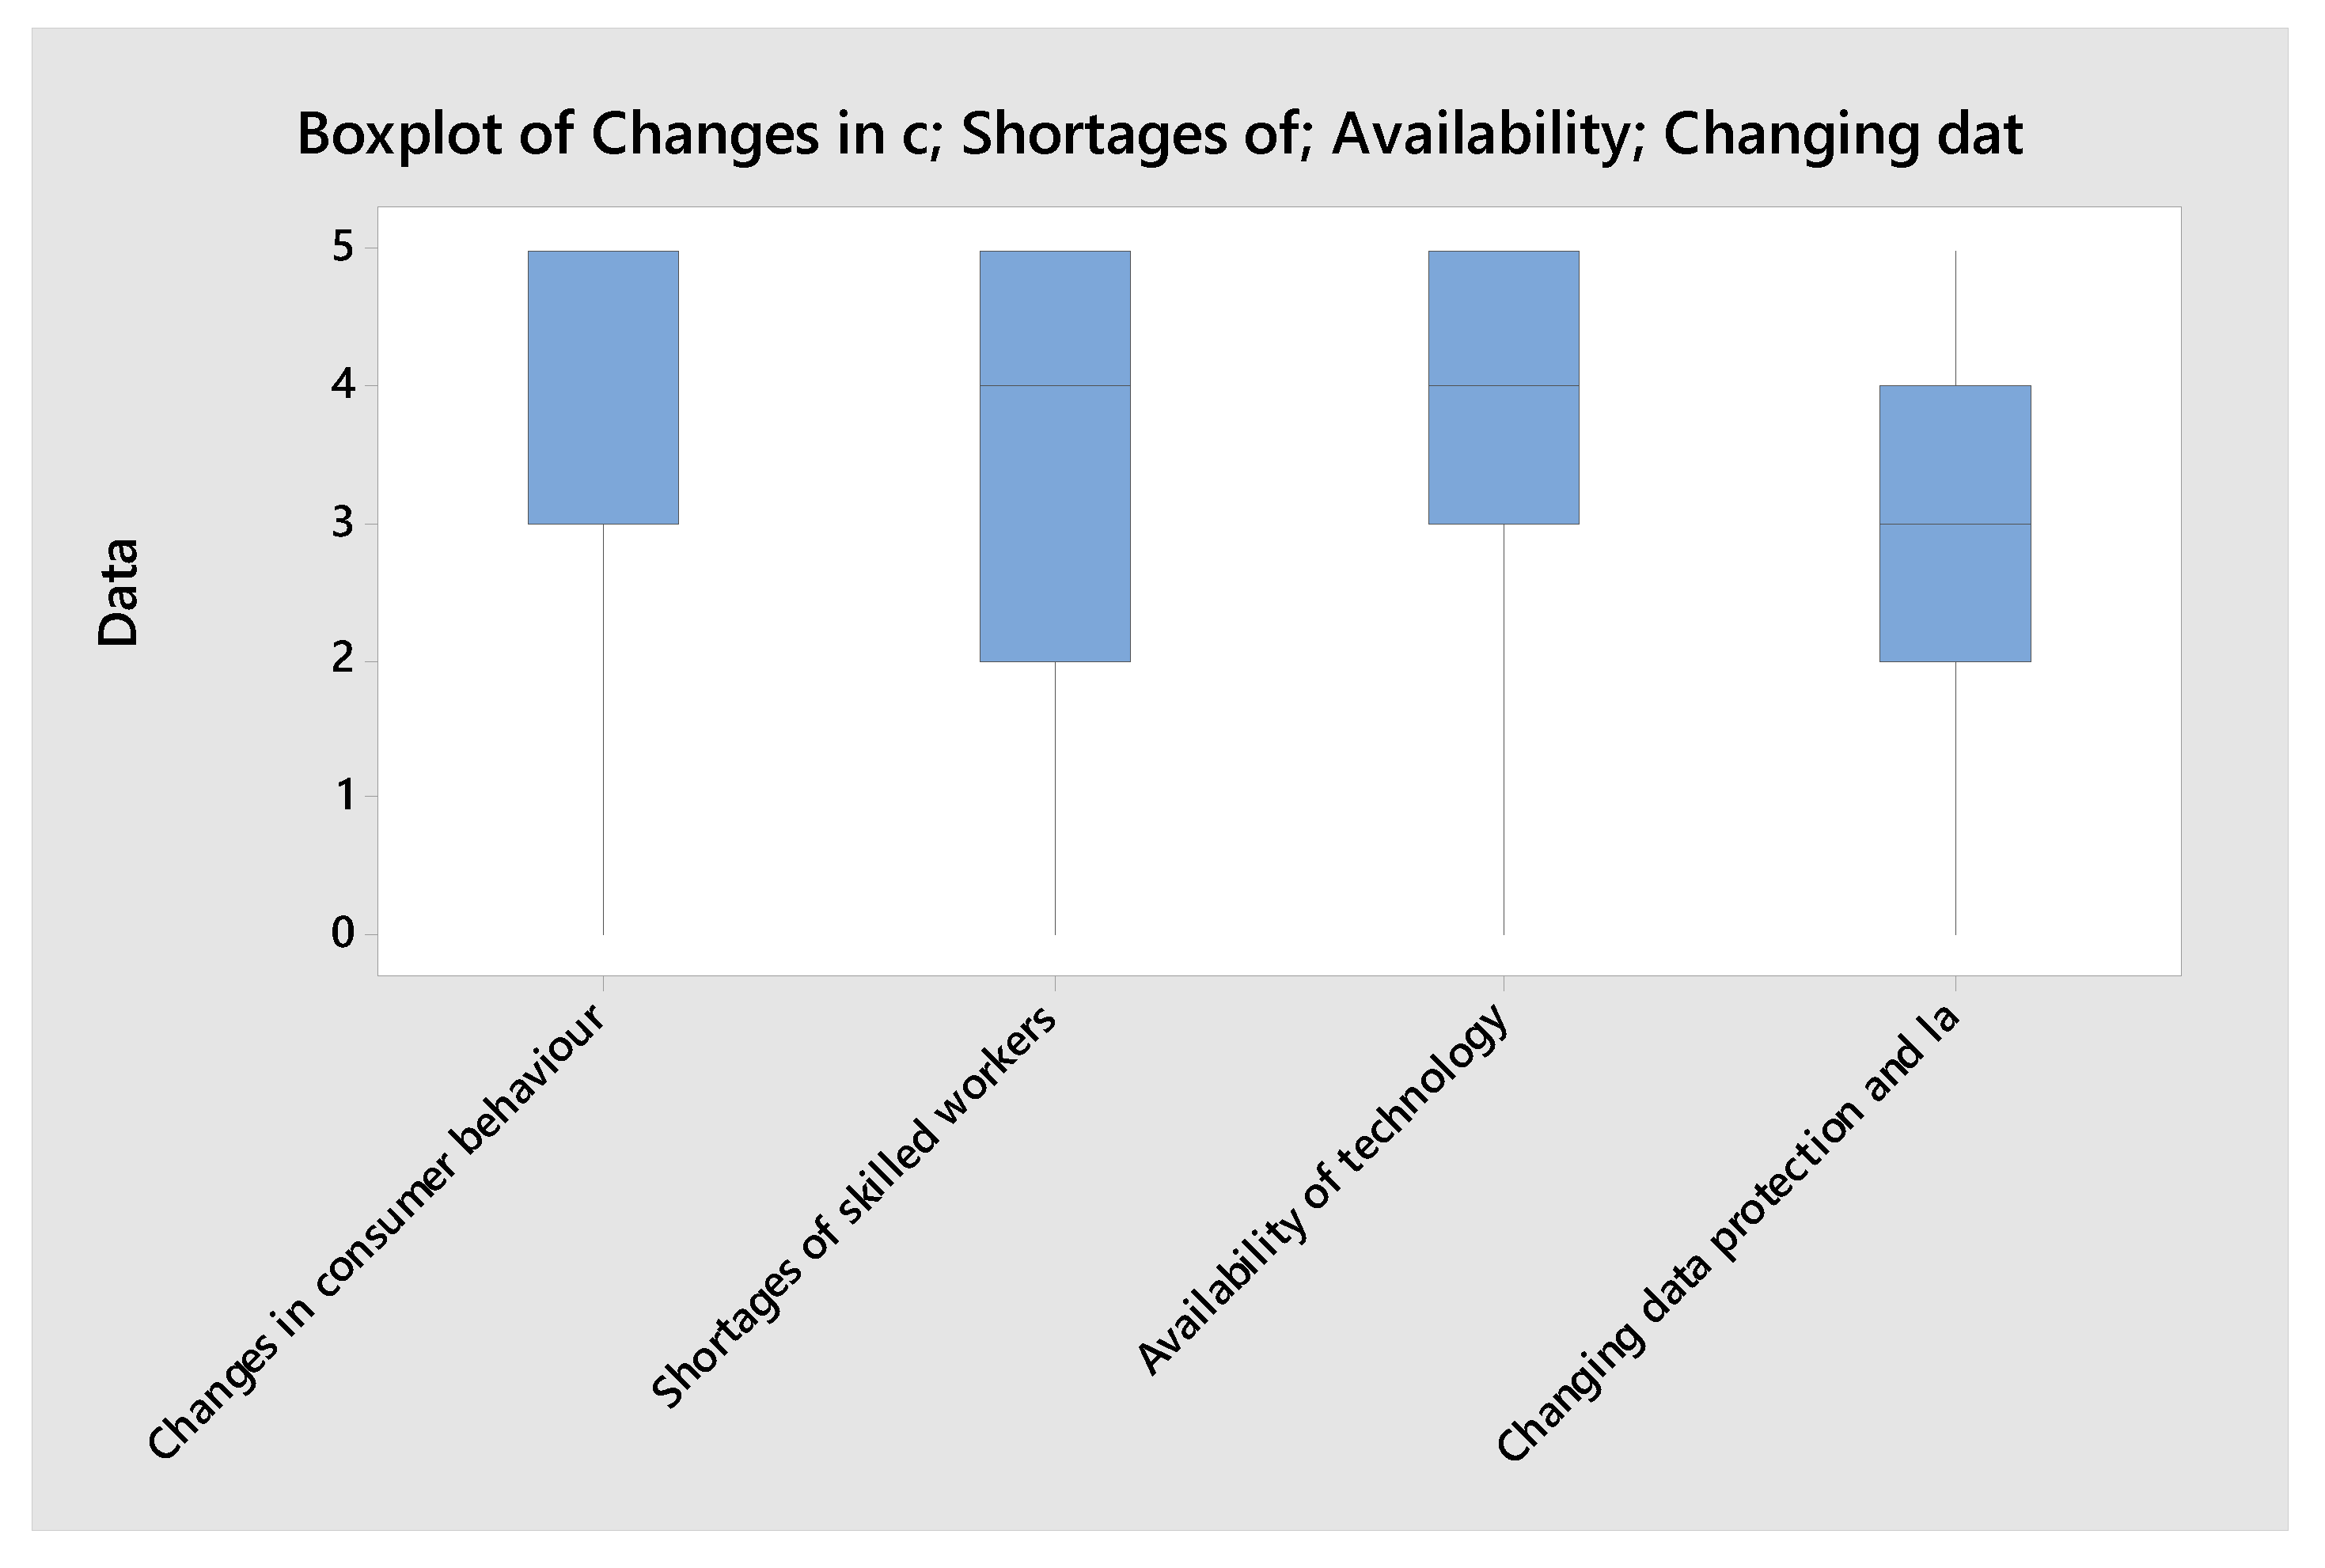
- Changes in consumer behavior,
- Shortages of skilled workers,
- Availability of technology,
- Changing data protection and labor regulations.
- Software-driven process changes (perspective +3 years), including:
- Evolution of base technologies (AI, IoT, Big Data, Blockchain),
- Data protection,
- Pressure on business efficiency.
- Process development trends (perspective +5-years), including:
- Development of technology supporting transport,
- Fuel price fluctuations,
- Development of electromobility,
- Focus on sustainable development,
- Change of legal regulations concerning the labor market.
3. Materials and Methods
- Confidence level—95%,
- Maximum error—15%,
- Population (number of manufacturing companies in Poland)—over 312,000.
- Fraction size—unknown—0.5.
- Innovative solutions in logistics,
- Digitalization trends,
- Software development trends,
- Process development trends.
4. Results
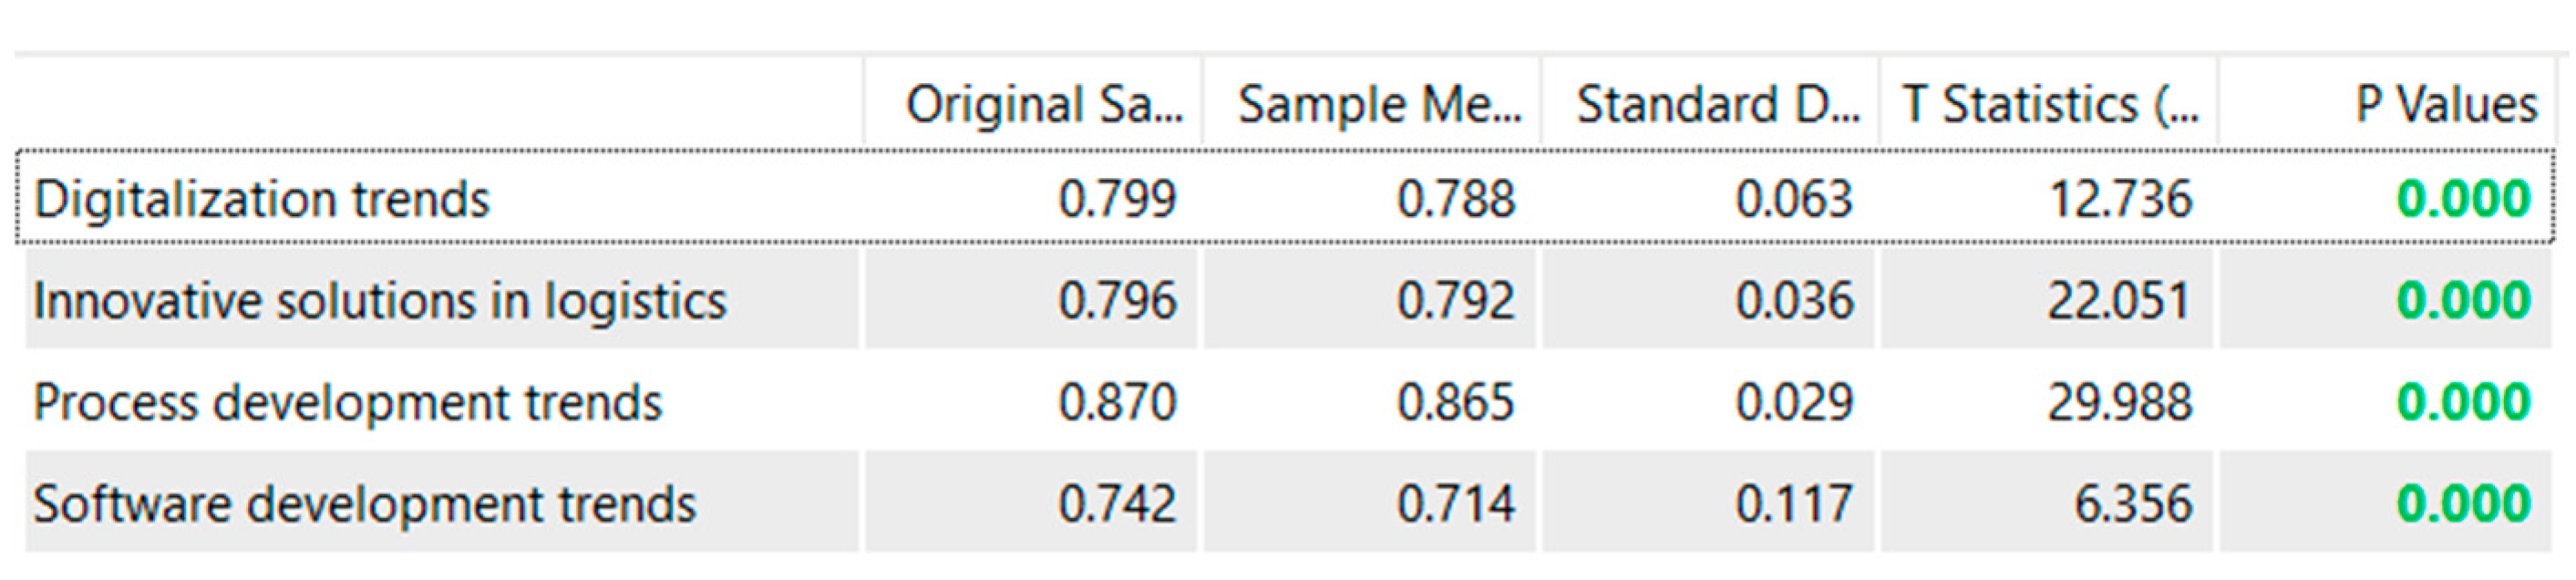
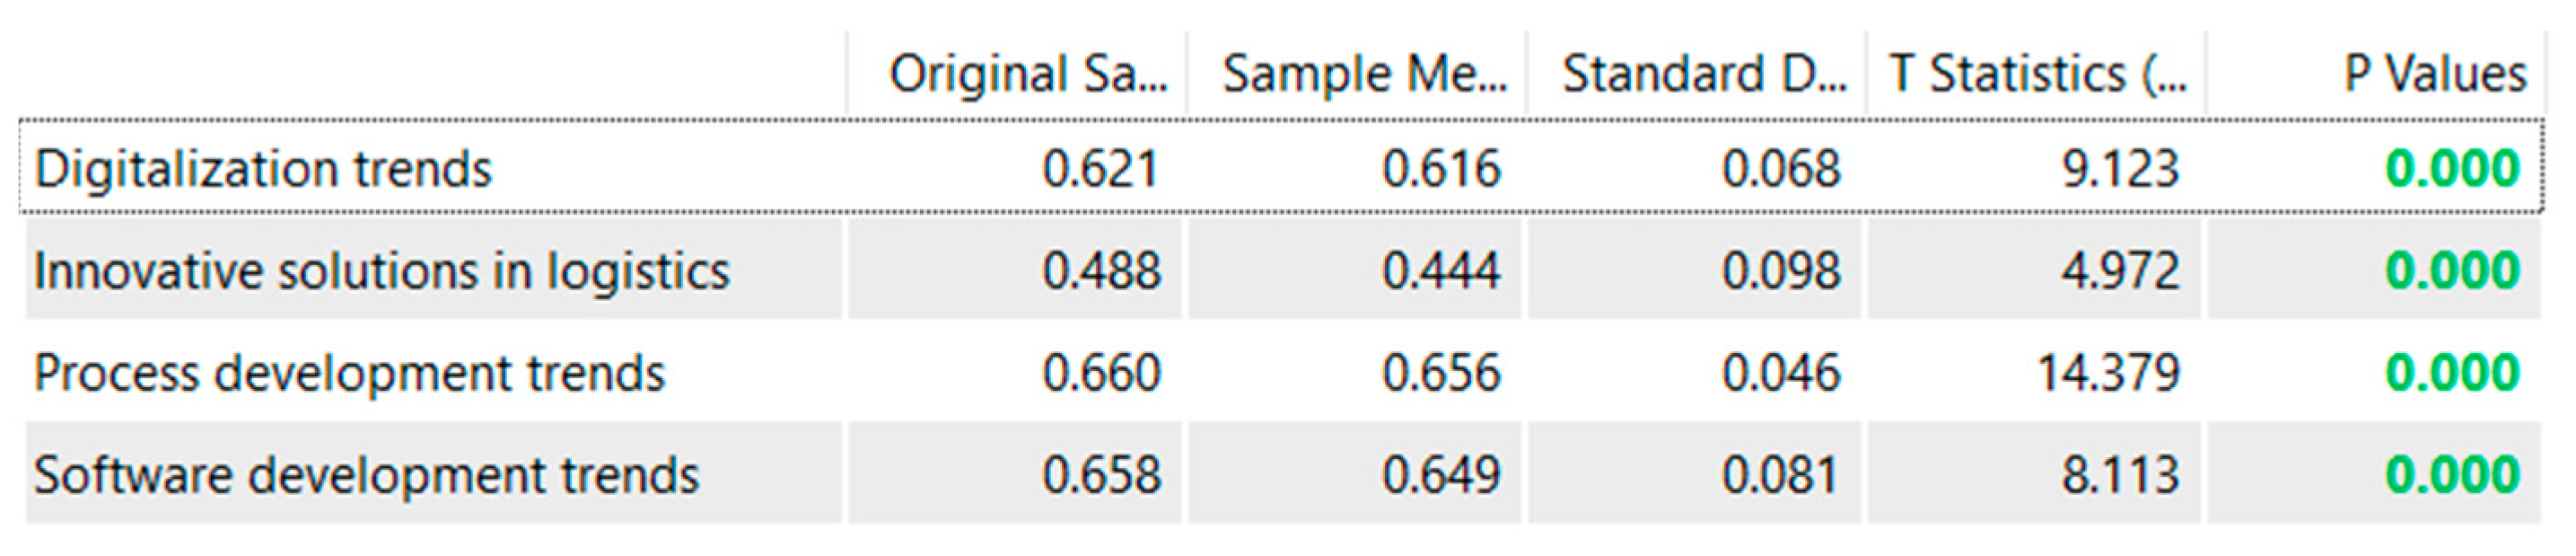
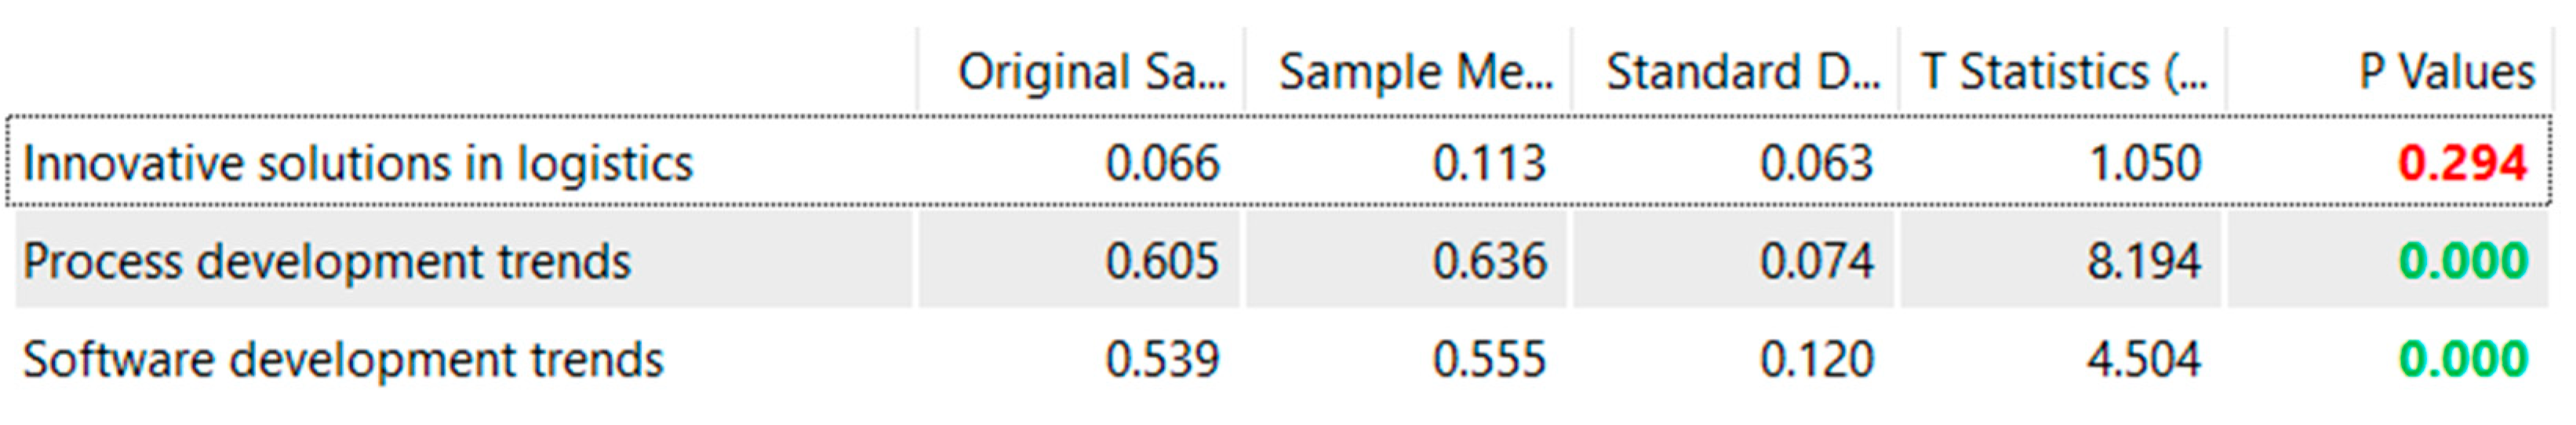
4.1. Stage 1
- Digitalization trends,
- Software development trends.
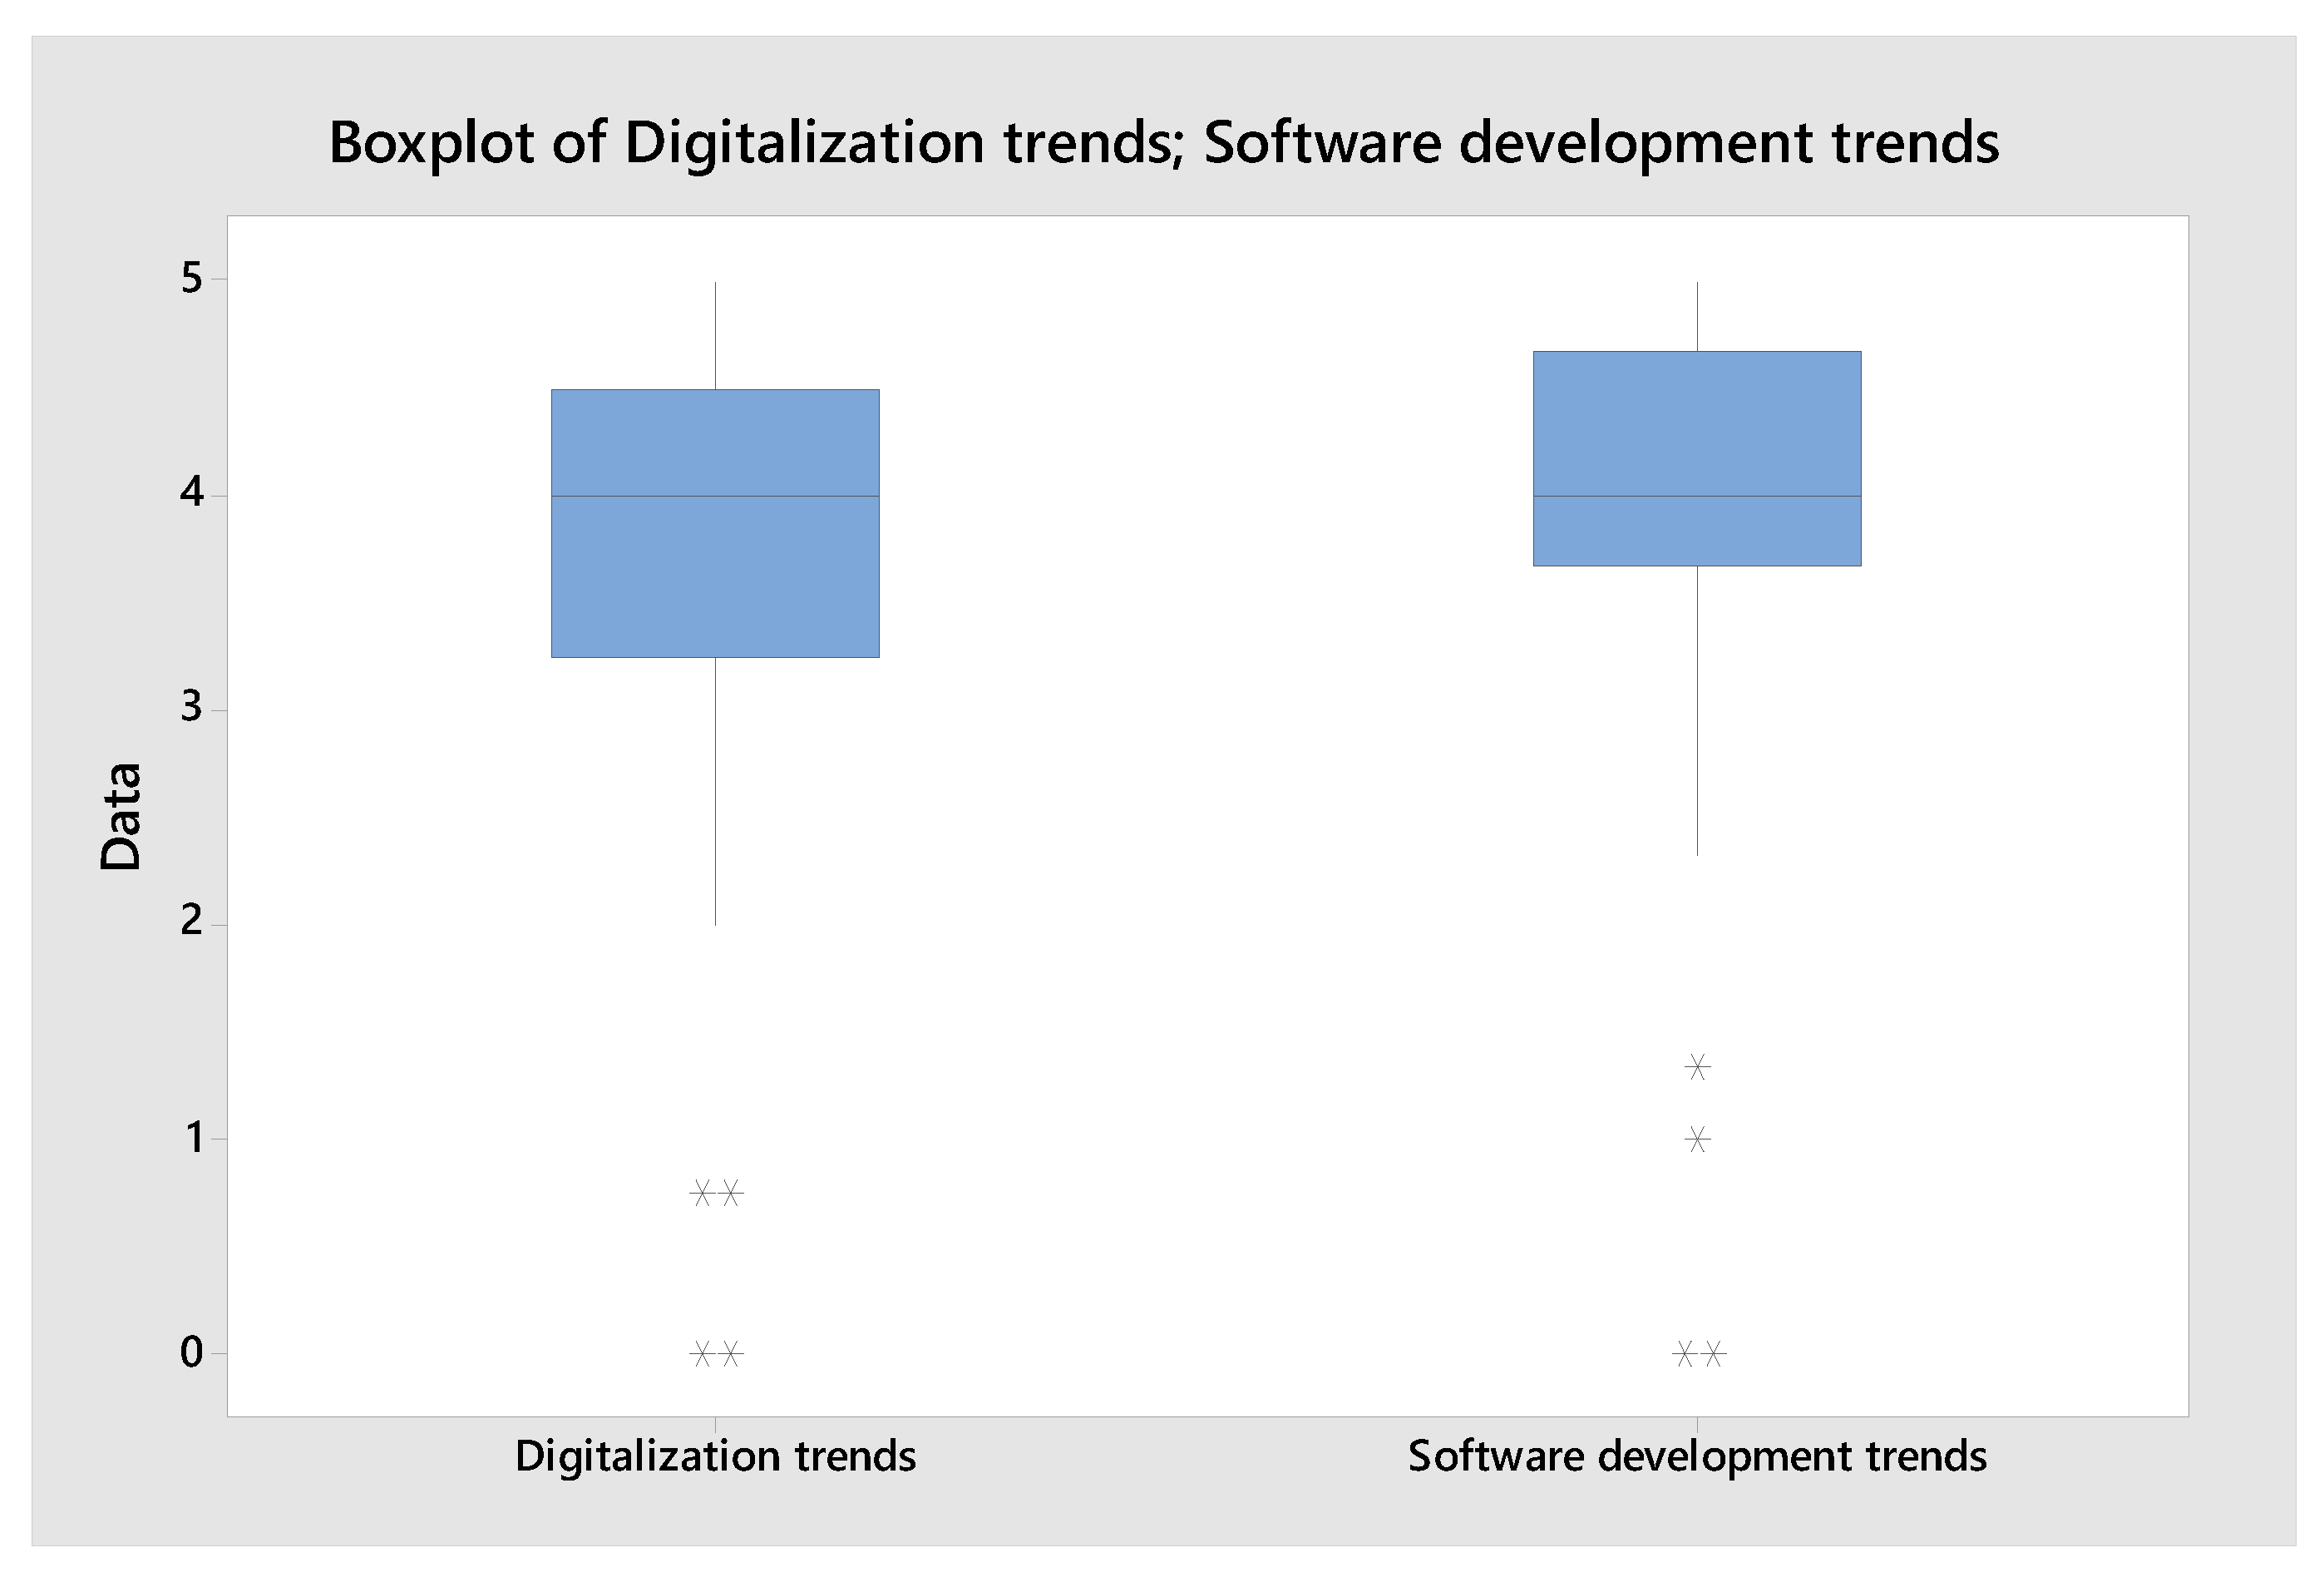
4.2. Stage 2
- p-value ≤ α: The differences between some of the medians are statistically significant.
- p-value > α: The differences between the medians are not statistically significant.
4.3. Stage 3
5. Discussion
6. Conclusions
- A1: Identification of trends affecting the development of operational processes of production companies—digitalization trends and software development trends affect the development of operational processes.
- A2: Identification of the characteristics of manufacturing enterprises that affect the absorption and implementation of digital solutions into operational processes—these characteristics are the type of the company and the age of the company.
- A3: Identification of specific solutions affecting the development of operational processes of production enterprises—the solutions particularly affecting the development of operational processes in manufacturing enterprises are trends related to shortages of skilled workers, changes in consumer behavior, and changing data protection and labor regulations.
Author Contributions
Funding
Institutional Review Board Statement
Informed Consent Statement
Data Availability Statement
Acknowledgments
Conflicts of Interest
References
- Domanski, R.; Kolinski, A. Assessment of the Level of Information Integration in CRM Systems for SMEs for the needs of omnichannel retailing. Bus. Logist. Mod. Manag. 2020, 20, 197–214. [Google Scholar]
- Schniederjans, D.G.; Curado, C.; Khalajhedayati, M. Supply chain digitisation trends: An integration of knowledge management. Int. J. Prod. Econ. 2020, 220, 107439. [Google Scholar] [CrossRef]
- Ageron, B.; Bentahar, O.; Gunasekaran, A. Digital supply chain: Challenges and future directions. Supply Chain. Forum Int. J. 2020, 21, 133–138. [Google Scholar] [CrossRef]
- Queiroz, M.M.; Pereira, S.C.F.; Telles, R.; Machado, M.C. Industry 4.0 and digital supply chain capabilities: A framework for understanding digitalisation challenges and opportunities. Benchmarking Int. J. 2021, 28, 1761–1782. [Google Scholar] [CrossRef]
- Gupta, H.; Yadav, A.K.; Kusi-Sarpong, S.; Khan, S.A.; Sharma, S.C. Strategies to overcome barriers to innovative digitalisation technologies for supply chain logistics resilience during pandemic. Technol. Soc. 2022, 69, 101970. [Google Scholar] [CrossRef]
- Cudzilo, M.; Kolinski, A. Digitalization model of information and documents flows in goods movement processes in supply chains-determinants of implementation and measurement efficiency. Bus. Logist. Mod. Manag. 2022, 22, 91–102. [Google Scholar]
- Kolinski, A.; Nowak, P.; Cudzilo, M. Review Of Intelligent Solutions To Optimise Logistics Processes And Improve Efficiency. Bus. Logist. Mod. Manag. 2021, 21, 327–349. [Google Scholar]
- Domanski, R.; Adamczak, M.; Cyplik, P. Physical internet (PI): A systematic literature review. LogForum 2018, 14, 7–19. [Google Scholar] [CrossRef]
- Custodio, L.; Machado, R. Flexible automated warehouse: A literature review and an innovative framework. Int. J. Adv. Manuf. Technol. 2020, 106, 533–558. [Google Scholar] [CrossRef]
- Batarlienė, N.; Meleniakas, M. Claims Solutions Using a Blockchain System in International Logistics. Sustainability 2021, 13, 3710. [Google Scholar] [CrossRef]
- Nilsson, F.; Göransson, M. Critical factors for the realization of sustainable supply chain innovations-model development based on a systematic literature review. J. Clean. Prod. 2021, 296, 126471. [Google Scholar] [CrossRef]
- Cyplik, P.; Oleskow-Szlapka, J.; Tobola, A.; Adamczak, M. Building a model for assessing the maturity of polish enterprises in terms of logistics 4.0 assumptions. Bus. Logist. Mod. Manag. 2019, 19, 105–120. [Google Scholar]
- Araújo, A.F.; Varela, M.L.; Gomes, M.S.; Barreto, R.C.; Trojanowska, J. Development of an intelligent and automated system for lean industrial production, adding maximum productivity and efficiency in the production process. In Advances in Manufacturing; Springer: Cham, Switzerland, 2018; pp. 131–140. [Google Scholar] [CrossRef]
- Klavsuts, I. Simulation Models for Management Solutions when Implementing Innovative Technologies. In SHS Web of Conferences; EDP Sciences: Paris, France, 2020; Volume 80, p. 01020. [Google Scholar]
- Ulrich, K. DHL Open Innovation: Program for the Development, Deployment and Promotion of Intelligent solutions in Logistics. In Strategies and Communications for Innovations; Springer: Berlin/Heidelberg, Germany, 2011; pp. 305–317. [Google Scholar] [CrossRef]
- Kostrzewski, M.; Kosacka-Olejnik, M.; Werner-Lewandowska, K. Assessment of innovativeness level for chosen solutions related to Logistics 4.0. Procedia Manuf. 2019, 38, 621–628. [Google Scholar] [CrossRef]
- Stachowiak, A.; Adamczak, M.; Hadas, L.; Domański, R.; Cyplik, P. Knowledge Absorption Capacity as a Factor for Increasing Logistics 4.0 Maturity. Appl. Sci. 2019, 9, 5365. [Google Scholar] [CrossRef] [Green Version]
- Witzel, O.; Wilm, S.; Karimanzira, D.; Baganz, D. Controlling and regulation of integrated aquaponic production systems–An approach for a management execution system (MES). Inf. Process. Agric. 2019, 6, 326–334. [Google Scholar] [CrossRef]
- Pan, S.; Trentesaux, D.; McFarlane, D.; Montreuil, B.; Ballot, E.; Huang, G.Q. Digital interoperability in logistics and supply chain management: State-of-the-art and research avenues towards Physical Internet. Comput. Ind. 2021, 128, 103435. [Google Scholar] [CrossRef]
- Bartelt, M.; Prior, J.; Sinnemann, J.; Kuhlenkötter, B. A template-based approach to support an automated digital production plant engineering. Procedia CIRP 2022, 107, 821–826. [Google Scholar] [CrossRef]
- Golinska-Dawson, P. Towards Circular Economy Transition—Developing the Innovative Sustainable Practices in Logistics Industry. In Logistics Operations and Management for Recycling and Reuse; Springer: Berlin/Heidelberg, Germany, 2020; pp. 3–18. [Google Scholar] [CrossRef]
- Werner-Lewandowska, K.; Golinska-Dawson, P. Sustainable Logistics Management Maturity—The Theoretical Assessment Framework and Empirical Results from Poland. Sustainability 2021, 13, 5102. [Google Scholar] [CrossRef]
- Barczak, A.; Dembińska, I.; Marzantowicz, Ł. Analysis of the risk impact of implementing digital innovations for logistics management. Processes 2019, 7, 815. [Google Scholar] [CrossRef] [Green Version]
- Choi, D.; Song, B. Exploring technological trends in logistics: Topic modeling-based patent analysis. Sustainability 2018, 10, 2810. [Google Scholar] [CrossRef] [Green Version]
- Pagano, A.M.; Liotine, M. Technology in Supply Chain Management and Logistics: Current Practice and Future Applications; Elsevier: Amsterdam, The Netherlands, 2019. [Google Scholar] [CrossRef]
- Rimmer, J.; Kam, B.H. Three disruptive digital trends: Surfing the Digital Wave. In Consumer Logistics; Edward Elgar Publishing: Northampton, MA, USA, 2018. [Google Scholar]
- Merkaš, Z.; Perkov, D.; Noche, B. The significance of blockchain technology in digital transformation of logistics and transportation. Int. J. E Serv. Mob. Appl. (IJESMA) 2020, 12, 1–20. [Google Scholar] [CrossRef]
- Wei, F.; Alias, C.; Noche, B. Applications of digital technologies in sustainable logistics and supply chain management. In Innovative Logistics Services and Sustainable Lifestyles; Springer: Cham, Switzerland, 2019; pp. 235–263. [Google Scholar] [CrossRef]
- Egorov, D.; Levina, A.; Kalyazina, S.; Schuur, P.; Gerrits, B. The challenges of the logistics industry in the era of digital transformation. In Proceedings of the International Conference on Technological Transformation: A New role for Human, Machines and Management, St. Petersburg, Russia, 27–29 May 2020; Springer: Cham, Switzerland; pp. 201–209. [Google Scholar] [CrossRef]
- Cichosz, M.; Wallenburg, C.M.; Knemeyer, A.M. Digital transformation at logistics service providers: Barriers, success factors and leading practices. Int. J. Logist. Manag. 2020, 31, 209–238. [Google Scholar] [CrossRef]
- Balakrishnan, N.; Basu, A. The Exponential Distribution: Theory, Methods, and Applications; Routledge: Oxfordshire, UK, 1996. [Google Scholar] [CrossRef]
- Blanchard, B.S.; Fabrycky, W.J.; Fabrycky, W.J. Systems Engineering and Analysis; Prentice Hall: New York, NY, USA, 1990. [Google Scholar]
- Dunn, S.C.; Seaker, R.F.; Waller, M.A. Latent variables in business logistics research: Scale development and validation. J. Bus. Logist. 1994, 15, 145–172. [Google Scholar]
- Garver, M.S.; Mentzer, J.T. Logistics research methods: Employing structural equation modeling to test for construct validity. J. Bus. Logist. 1999, 20, 33. [Google Scholar]
- Näslund, D. Logistics needs qualitative research–especially action research. Int. J. Phys. Distrib. Logist. Manag. 2002, 32, 321–338. [Google Scholar] [CrossRef]
- Iannoni, A.P.; Morabito, R. A discrete simulation analysis of a logistics supply system. Transp. Res. Part E Logist. Transp. Rev. 2006, 42, 191–210. [Google Scholar] [CrossRef]
- Engblom, J.; Solakivi, T.; Töyli, J.; Ojala, L. Multiple-method analysis of logistics costs. Int. J. Prod. Econ. 2012, 137, 29–35. [Google Scholar] [CrossRef]
- Forza, C. Survey Research in Operations Management: A Process-Based Perspective. Int. J. Oper. Prod. Manag. 2002, 22, 152–194. [Google Scholar] [CrossRef] [Green Version]
- Fiorello, D.; Martino, A.; Zani, L.; Christidis, P.; Elena Navajas-Cawood, E. Mobility data across the EU 28 member states: Results from an extensive CAWI survey. Transp. Res. Procedia 2016, 14, 1104–1113. [Google Scholar] [CrossRef]
- Fowler, F.J.; Magnione, T.W. Standardized Survey Interviewing: Minimizing Interviewer-Related Error; SAGE Publications, Inc.: Newbury Park, CA, USA, 1999. [Google Scholar]
- Hair, J.F.; Hult, G.T.M.; Ringle, C.M.; Sarstedt, M. Primer on Partial Least Squares Structural Equation Modeling (PLS-SEM), 2nd ed.; SAGE Publications: Thousand Oaks, CA, USA, 2017. [Google Scholar]
- Falk, R.F.; Miller, N.B. A Primer for Soft Modeling. University of Akron Press: Akron, OH, USA, 1992. [Google Scholar]
- Boubker, O. The effects of information technologies on automotive supply chain and firm performance. LogForum 2022, 18, 59–73. [Google Scholar] [CrossRef]
- Kaščak, J.; Husár, J.; Knapčíková, L.; Trojanowska, J.; Ivanov, V. Conceptual Use of Augmented Reality in the Maintenance of Manufacturing Facilities. In Advances in Manufacturing III; Springer: Cham, Switzerland, 2022; pp. 241–252. [Google Scholar] [CrossRef]
- Lucato, W.C.; Pacchini, A.P.T.; Facchini, F.; Mummolo, G. Model to evaluate the industry 4.0 readiness degree in industrial companies. Berlin, Germany, 28–30 August 2019; Volume 52, pp. 1808–1813. [Google Scholar] [CrossRef]
- Varela, M.; Madureira, A.; Dantas, J.; Santos, A.; Putnik, G.; Trojanowska, J.; Machado, J. Collaborative paradigm for single-machine scheduling under just-in-time principles: Total holding-tardiness cost problem. Manag. Prod. Eng. Rev. 2018, 9, 90–103. [Google Scholar] [CrossRef]


| Supply Chain Digitalization | 2018 | 2019 | 2020 | 2021 | 2022 | Total | |
|---|---|---|---|---|---|---|---|
| Article type | Review articles | 1186 | 1445 | 1830 | 2804 | 3352 | 10,617 |
| Research articles | 19,441 | 21,482 | 25,314 | 29,510 | 33,979 | 129,726 | |
| Subject areas | Engineering | 4247 | 4687 | 5356 | 6095 | 7425 | 27,810 |
| Agricultural and biological sciences | 3645 | 4023 | 4745 | 5428 | 5713 | 23,554 | |
| Environmental science | 3121 | 3527 | 4487 | 5716 | 6368 | 23,219 | |
| Materials science | 2748 | 3220 | 4014 | 4861 | 5618 | 20,461 | |
| Biochemistry, genetics and molecular biology | 2422 | 2621 | 2881 | 3110 | 3360 | 14,394 | |
| Energy | 1927 | 2278 | 2701 | 3299 | 3992 | 14,197 | |
| Medicine and dentistry | 2099 | 2152 | 2374 | 2734 | 3108 | 12,467 | |
| Chemical engineering | 1687 | 1824 | 2399 | 2942 | 3375 | 12,227 | |
| Chemistry | 1731 | 1858 | 2131 | 2409 | 2815 | 10,944 | |
| Social sciences | 1400 | 1562 | 1863 | 2528 | 2732 | 10,085 |
| EDITION 2022 | 2018 | 2019 | 2020 | 2021 | 2022 | |
|---|---|---|---|---|---|---|
| Blockchain in logistics | TOTAL | 43 | 171 | 321 | 639 | 911 |
| Review articles | 10 | 16 | 56 | 89 | 152 | |
| Research articles | 33 | 155 | 265 | 550 | 759 | |
| Intelligent transport systems (ITS) | TOTAL | 2971 | 3526 | 4336 | 5641 | 7195 |
| Review articles | 409 | 438 | 636 | 1049 | 1464 | |
| Research articles | 2562 | 3088 | 3700 | 4592 | 5731 | |
| Robotic processes automation | TOTAL | 2378 | 2779 | 3449 | 3986 | 4759 |
| Review articles | 177 | 260 | 315 | 458 | 620 | |
| Research articles | 2201 | 2519 | 3134 | 3528 | 4139 | |
| IoT in logistics | TOTAL | 319 | 536 | 672 | 946 | 1273 |
| Review articles | 36 | 48 | 95 | 136 | 201 | |
| Research articles | 283 | 488 | 577 | 810 | 1072 | |
| Big data analytics | TOTAL | 13,877 | 15,336 | 17,629 | 20,301 | 22,029 |
| Review articles | 1041 | 1196 | 1484 | 1964 | 2346 | |
| Research articles | 12,836 | 14,140 | 16,145 | 18,337 | 19,683 | |
| Cloud and APIs | TOTAL | 1163 | 1325 | 1545 | 1880 | 2226 |
| Review articles | 98 | 110 | 150 | 172 | 275 | |
| Research articles | 1065 | 1215 | 1395 | 1708 | 1951 |
| Company Characteristic | n | % | |
|---|---|---|---|
| Size of the company | Big | 29 | 43% |
| Medium | 25 | 37% | |
| Small | 10 | 15% | |
| Micro | 4 | 6% | |
| Type of the company | Production company | 30 | 44% |
| Production and trade company | 11 | 16% | |
| Production, trade, and service company | 11 | 16% | |
| Production and service company | 16 | 24% | |
| Range of the company | European | 34 | 50% |
| Global | 30 | 44% | |
| Country | 4 | 6% | |
| Local | 0 | 0% | |
| Age of the company | 1–3 years | 4 | 6% |
| 4–7 years | 6 | 9% | |
| 8–15 years | 4 | 6% | |
| Over 15 years | 54 | 79% | |
| Research Area (Development Trends) | Innovative Solutions in Logistics | Digitalization Trends | Software Development Trends | Process Development Trends |
|---|---|---|---|---|
| Indicators |
|
|
|
|
| Stage | Detailed Research Tasks | Hypotheses | Aim | Methods |
|---|---|---|---|---|
| 1 | Building a structural model Determination of latent variables Model quality analysis Bootstrapping Selection of significant trends | H1: The impact of digitalization on process improvement in production companies is not determined directly, but is modulated by trends in software development. | A1: Identification of trends affecting the development of operational processes of production companies | Partial least squares path modeling (PLS) |
| 2 | Only for significant trends: Data visualization and graphical analysis Normality test Compare by groups Pairwise comparison Selection of significant company characteristics | H2: There are characteristics of the enterprise that affect the absorption of digital solutions and their implementation in operational processes. | A2: Identification of the characteristics of manufacturing enterprises that affect the absorption and implementation of digital solutions into operational processes | Box plot Anderson–Darling normality test Mood’s median test |
| 3 | Only for significant trends and significant company characteristics: Data visualization and graphical analysis Normality test Compare by groups Selection of significant trends indicators | A3: Identification of specific solutions affecting the development of operational processes of production enterprises |
| Digitalization Trends | Software Development Trends | |
|---|---|---|
| Anderson–Darling test p-value | <0.005 * | <0.005 * |
| Digitalization Trends | Software Development Trends | |
|---|---|---|
| Size of a company | 0.246 | 0.176 |
| Type of a company | 0.004 * | 0.058 |
| Range of a company | 0.392 | 0.551 |
| Age of a company | 0.022 * | 0.641 |
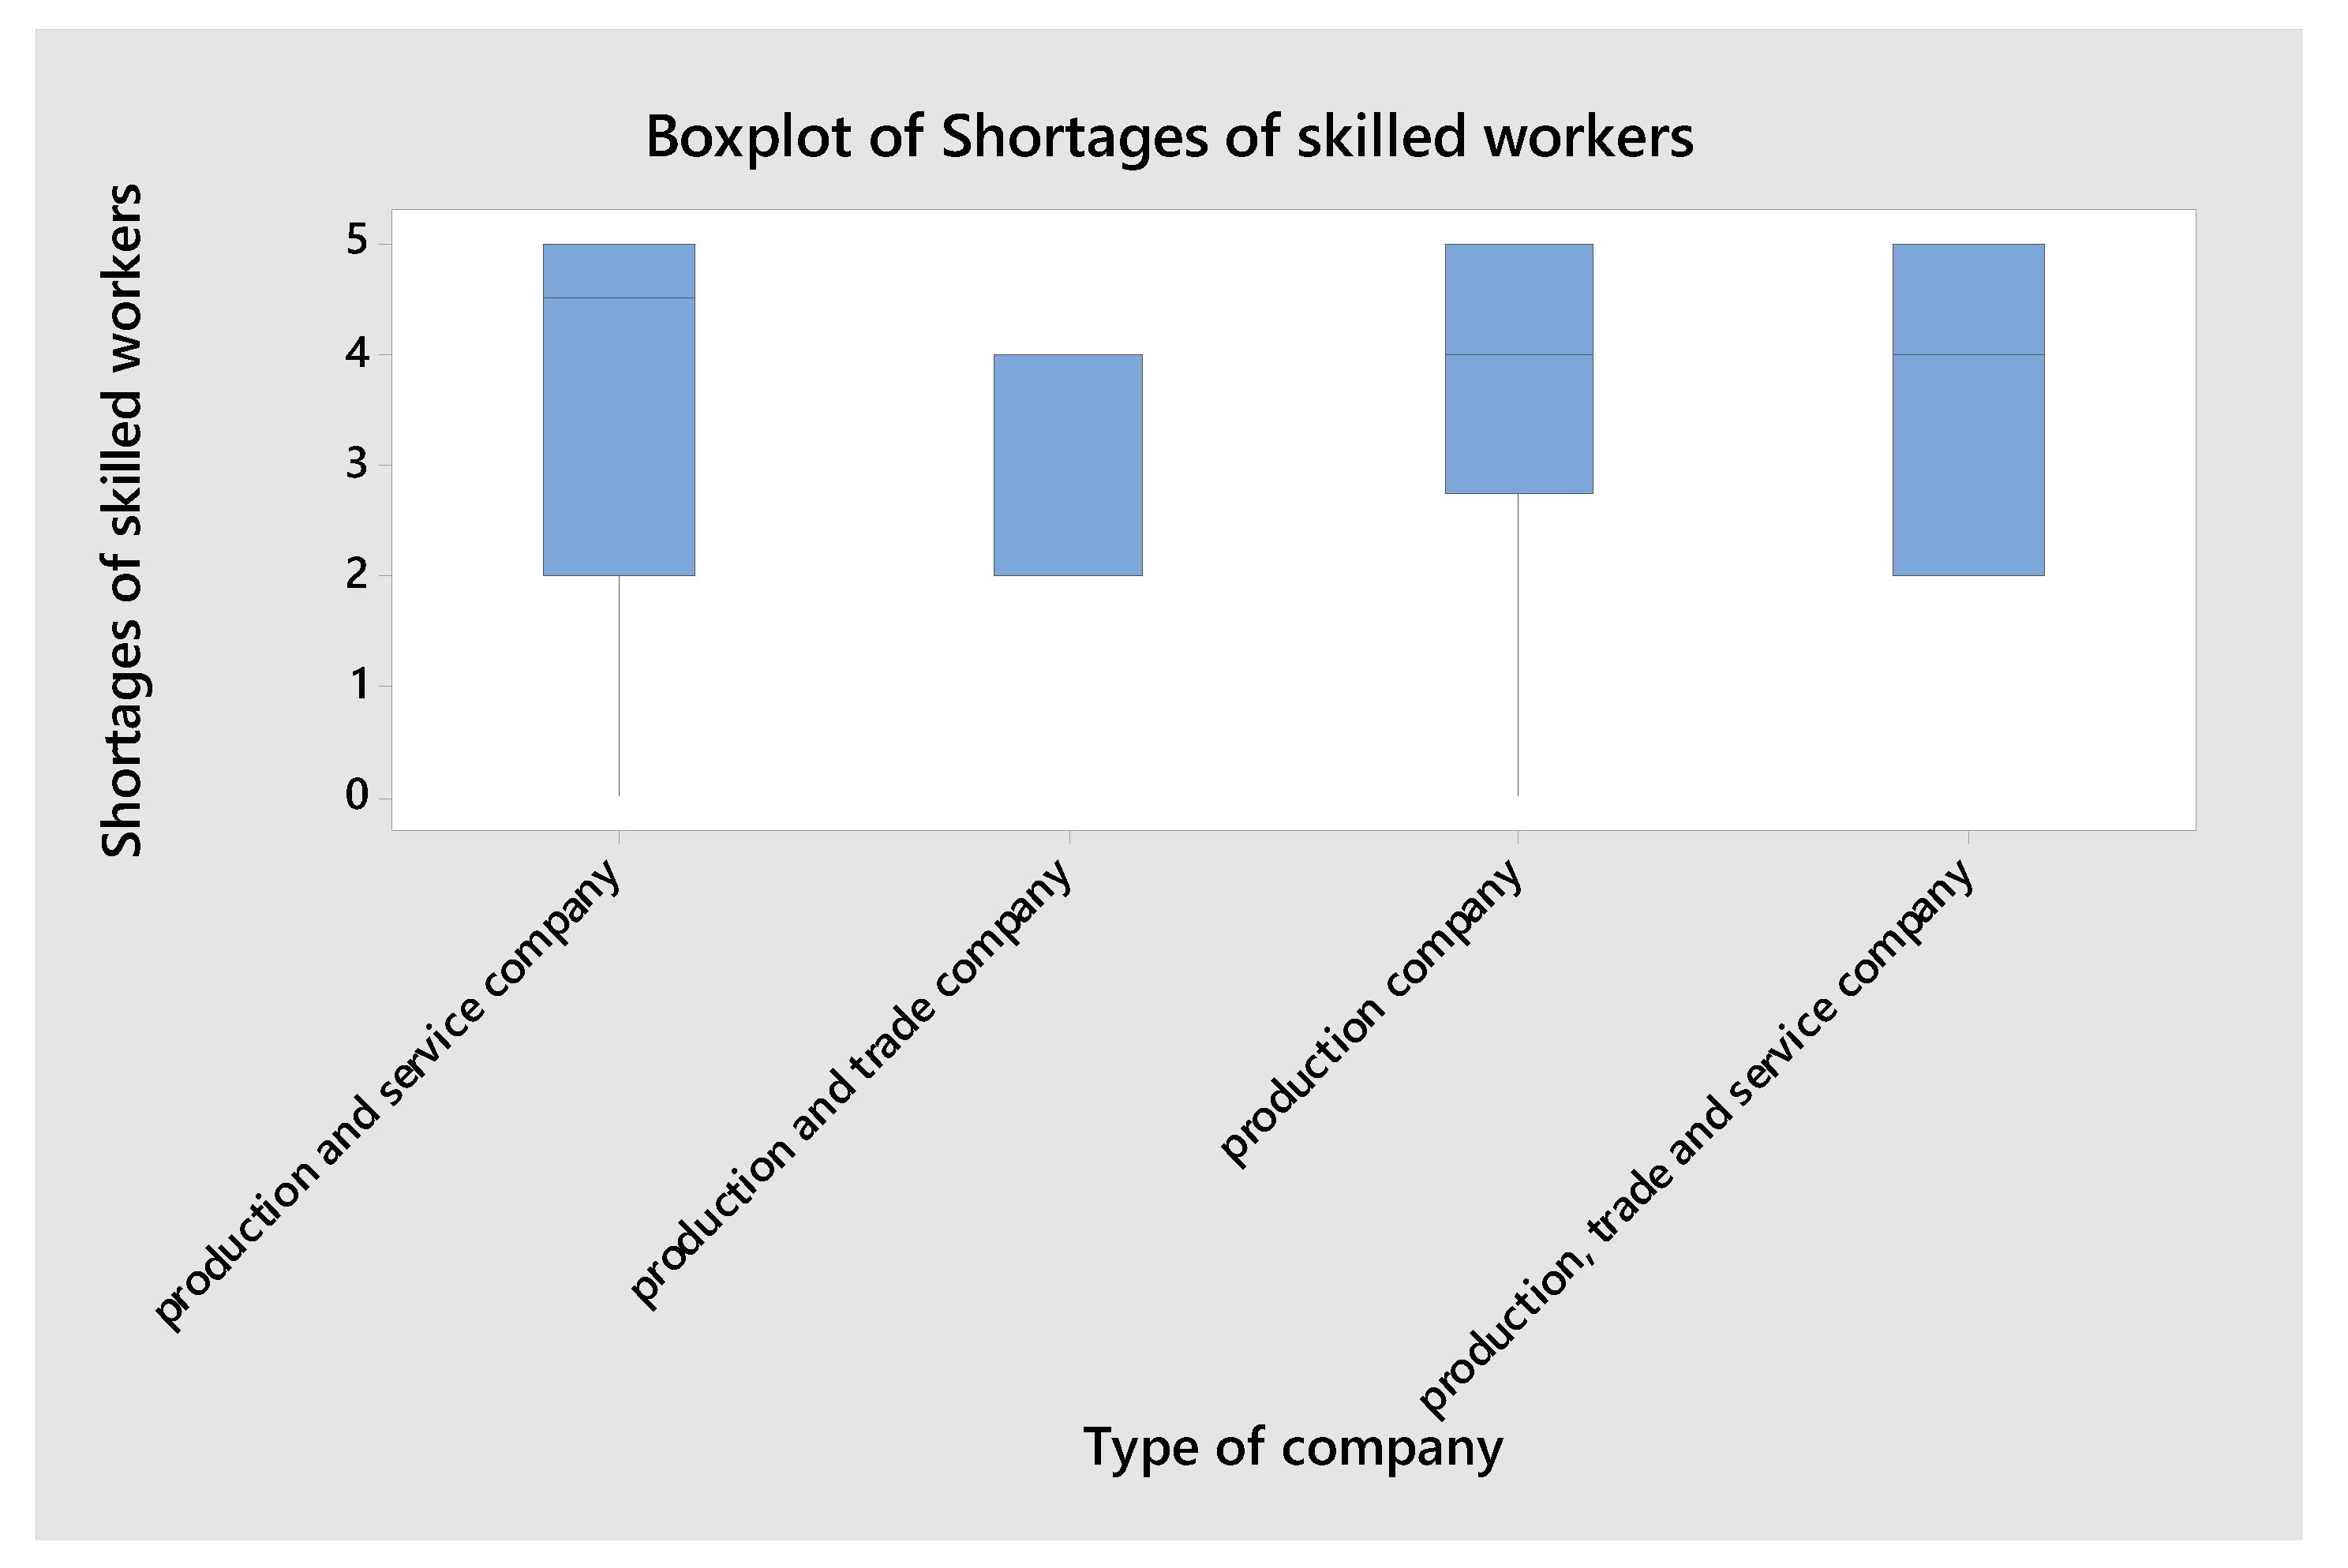
| Type of the Company | Median | N ≤ Overall Median | N > Overall Median | Q3 − Q1 |
|---|---|---|---|---|
| Production and service company | 3.625 | 13 | 3 | 1.6875 |
| Production and trade company | 3.250 | 11 | 0 | 1.2500 |
| Production company | 4.000 | 16 | 14 | 1.5000 |
| Production, trade and service | 4.250 | 4 | 7 | 0.7500 |
| Overall | 4.000 |
| Type of the Company Pairwise Comparison | p-Value Digitalization Trends | |
|---|---|---|
| Production company | Production and trade company | 0.005 |
| Production company | Production, trade and service company | 0.264 |
| Production company | Production and service company | 0.062 |
| Production and trade company | Production, trade and service company | 0.001 * |
| Production and trade company | Production and service company | 0.816 |
| Production, trade and service company | Production and service company | 0.018 * |
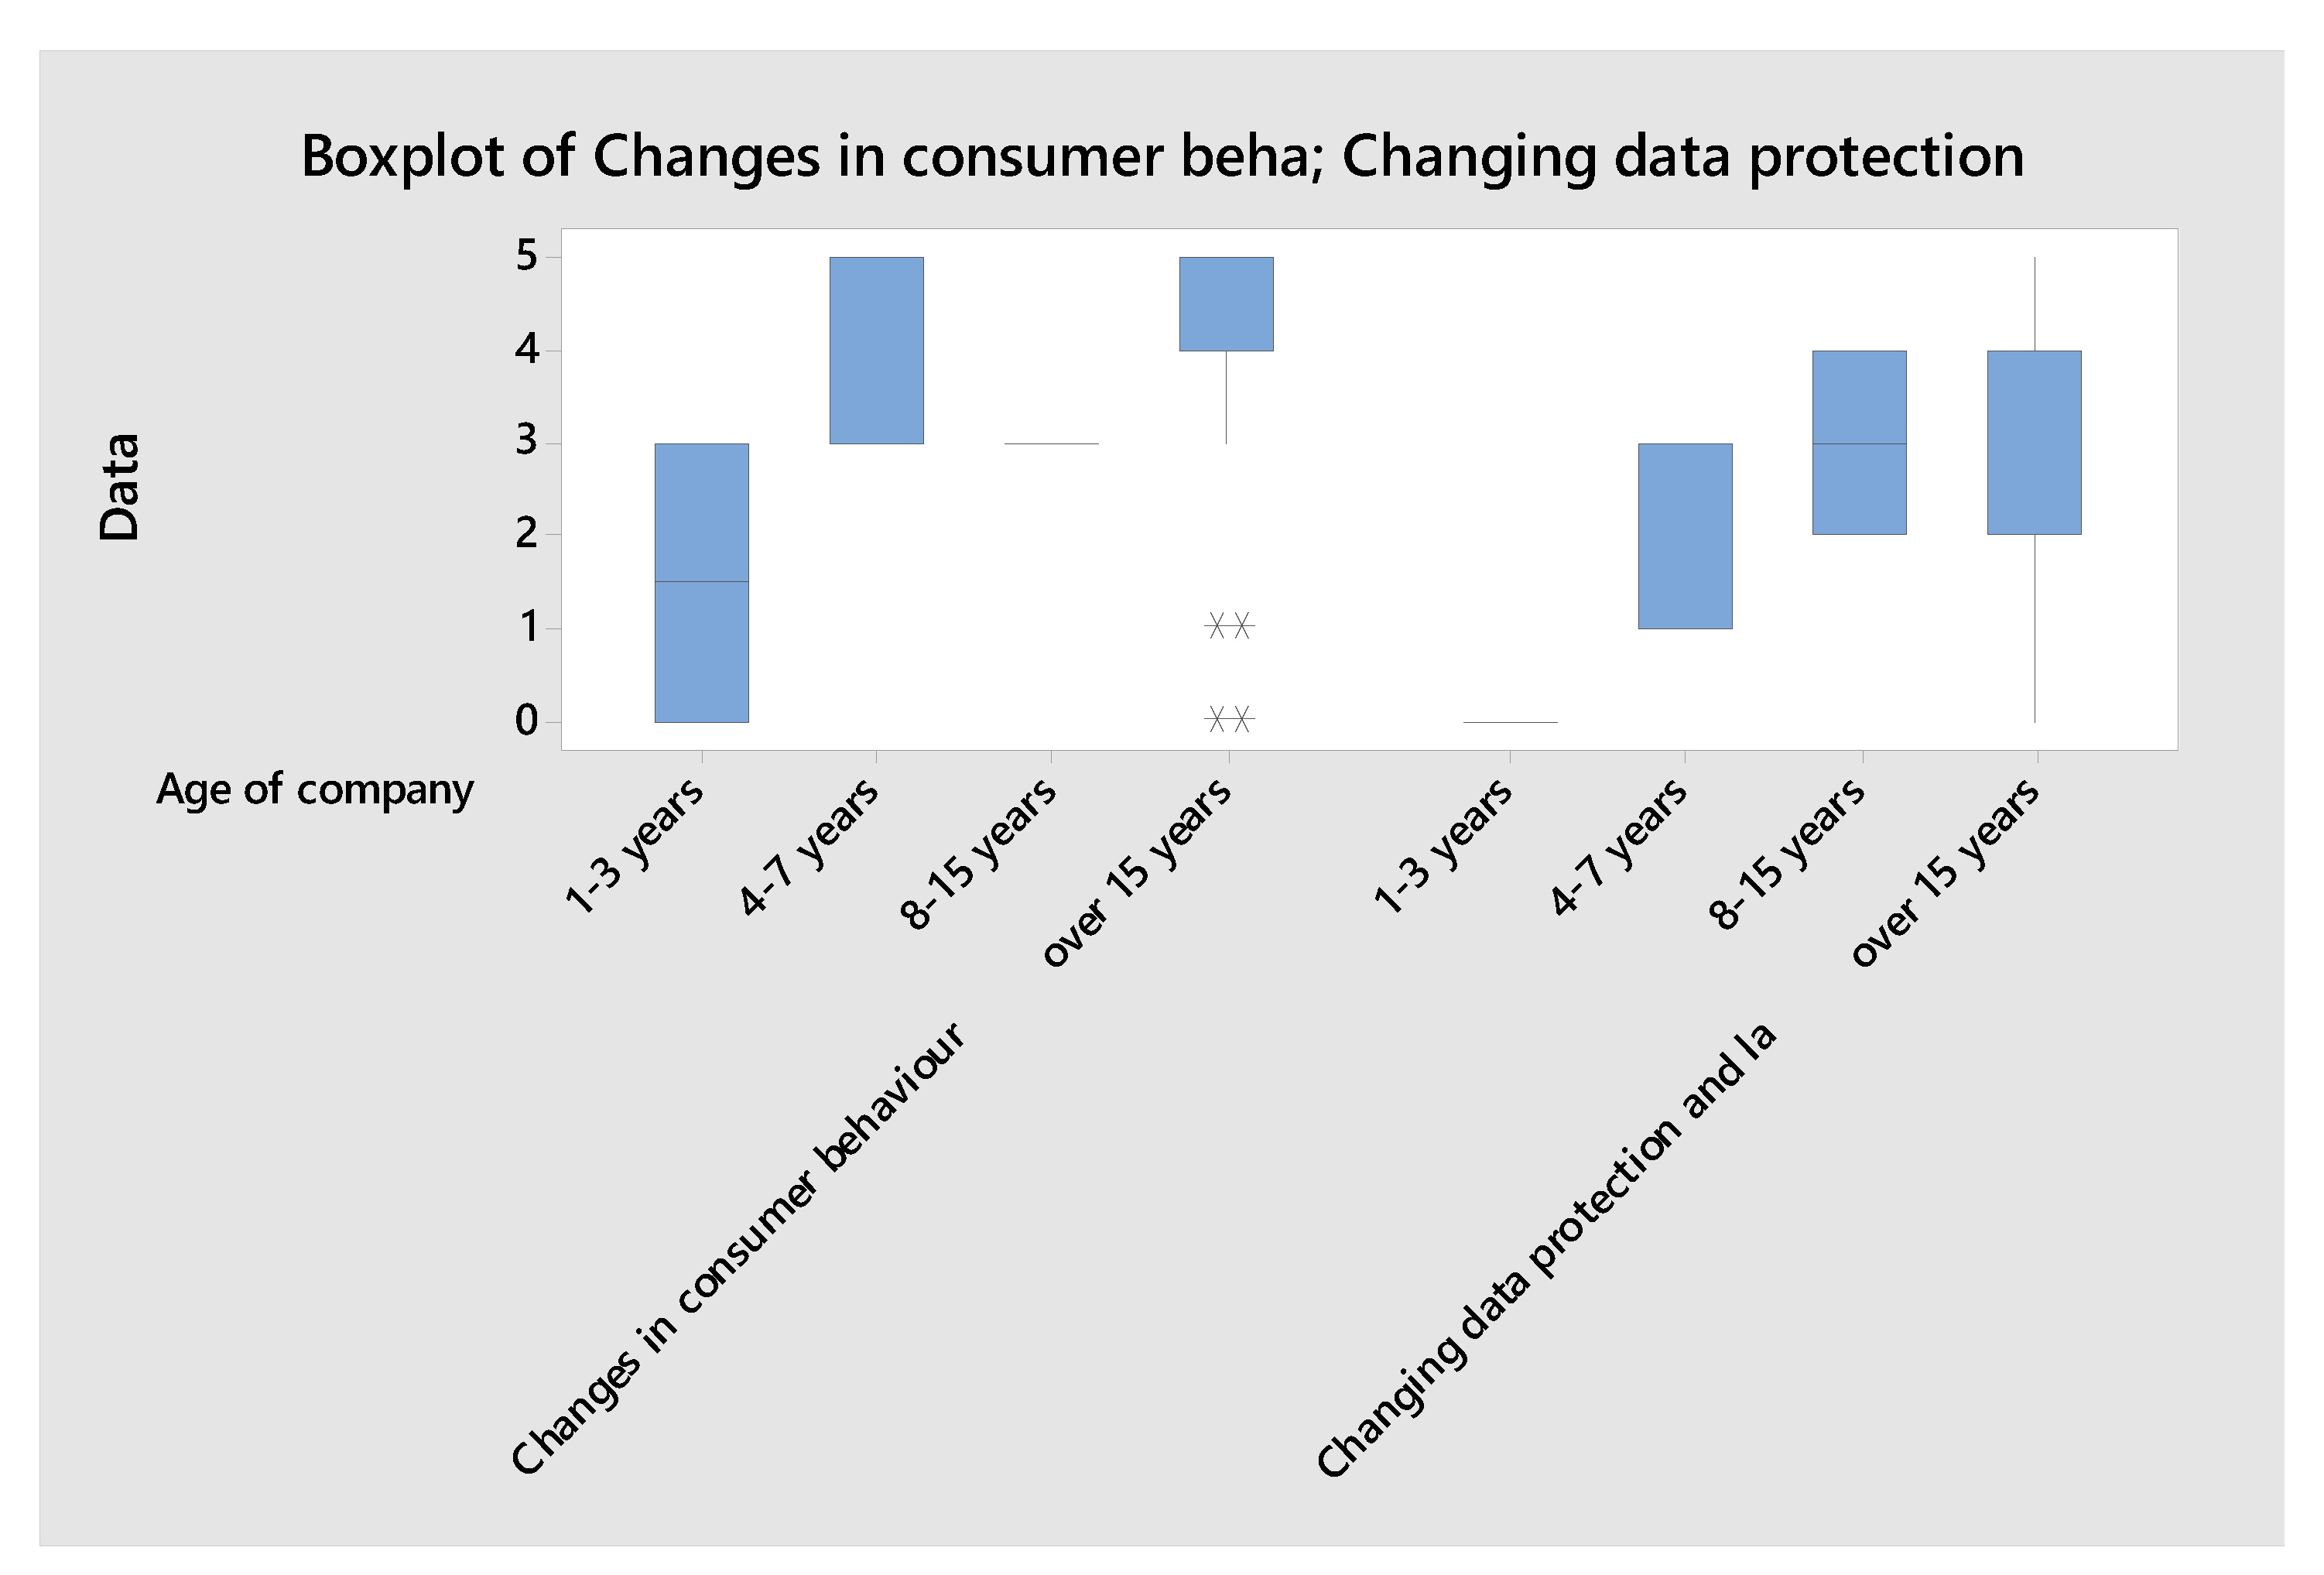
| Age of the Company | Median | N ≤ Overall Median | N > Overall Median | Q3 − Q1 |
|---|---|---|---|---|
| 1–3 years | 1.375 * | 4 | 0 | 1.25 |
| 4–7 years | 4.000 | 6 | 0 | 0.75 |
| 8–15 years | 2.875 * | 4 | 0 | 0.75 |
| Over 15 years | 4.000 | 30 | 24 | 1.50 |
| Overall | 4.000 |
| Age of the Company Pairwise Comparison | p-Value Digitalization Trends | |
|---|---|---|
| 1–3 years | 4–7 years | 0.035 * |
| 1–3 years | 8–15 years | 0.005 * |
| 1–3 years | Over 15 years | 0.082 |
| 4–7 years | 8–15 years | 0.037 * |
| 4–7 years | Over 15 years | 0.035 * |
| 8–15 years | Over 15 years | 0.082 |
| Digitalization Trends | Changes in Consumer Behavior | Shortages of Skilled Workers | Availability of Technology | Changing Data Protection and Labor Regulations |
|---|---|---|---|---|
| p-Value | <0.005 * | <0.005 * | <0.005 * | <0.005 * |
| Digitalization Trends | Changes in Consumer Behavior | Shortages of Skilled Workers | Availability of Technology | Changing Data Protection and Labor Regulations |
|---|---|---|---|---|
| Type of the company p-value | 0.264 | 0.045 * | 0.272 | 0.299 |
| Age of the company p-value | 0.005 * | 0.166 | 0.216 | 0.015 * |
Disclaimer/Publisher’s Note: The statements, opinions and data contained in all publications are solely those of the individual author(s) and contributor(s) and not of MDPI and/or the editor(s). MDPI and/or the editor(s) disclaim responsibility for any injury to people or property resulting from any ideas, methods, instructions or products referred to in the content. |
© 2023 by the authors. Licensee MDPI, Basel, Switzerland. This article is an open access article distributed under the terms and conditions of the Creative Commons Attribution (CC BY) license (https://creativecommons.org/licenses/by/4.0/).
Share and Cite
Adamczak, M.; Kolinski, A.; Trojanowska, J.; Husár, J. Digitalization Trend and Its Influence on the Development of the Operational Process in Production Companies. Appl. Sci. 2023, 13, 1393. https://doi.org/10.3390/app13031393
Adamczak M, Kolinski A, Trojanowska J, Husár J. Digitalization Trend and Its Influence on the Development of the Operational Process in Production Companies. Applied Sciences. 2023; 13(3):1393. https://doi.org/10.3390/app13031393
Chicago/Turabian StyleAdamczak, Michal, Adam Kolinski, Justyna Trojanowska, and Jozef Husár. 2023. "Digitalization Trend and Its Influence on the Development of the Operational Process in Production Companies" Applied Sciences 13, no. 3: 1393. https://doi.org/10.3390/app13031393