1. Introduction
Road-embedded wireless charging systems have the potential to improve the sustainability of the transportation sector by enabling the accelerated uptake of electric vehicles (EVs). They can deliver charge to an EV while it is on the move, dynamically on highways or in a quasi-static scenario such as in taxi ranks or at traffic lights. One technology with the proven ability to deliver charge wirelessly is inductive power Transfer (IPT), which involves the electromagnetic coupling of two coils: the primary, embedded in the road, and the secondary, onboard the EV. Ferrite magnetic cores are typically placed below the primary and above the secondary to shape the magnetic flux, enhance coupling and reduce leakage flux that could pose a danger to pedestrians above. In recent years, substantial research has been conducted to develop the electronics and magnetics of IPT systems for roadways applications for various power ratings and efficiencies [
1,
2,
3,
4].
For IPT technology to be economically viable for EV charging, it is required that primary IPT pads have a robust mechanical design with comparable durability and longevity to that of traditional asphalt roads [
5]. A critical mode of loading experienced by IPT pads is thermal loading. When they are energized with an alternating current, power loss is generated due to the electrical resistance of the litz wire and hysteresis in the magnetic cores. These power losses are converted to heat, which increases the operating temperature of the pad significantly. Temperatures of above 100 °C can be reached [
6,
7]. The increase in temperature induces mechanical stresses in the pad, due to the different coefficients of thermal expansion (CTE) of the materials within [
8]. During the development of these systems, an accurate measurement or numerical prediction of their response to thermal loading is essential to ensuring that they have the required durability and longevity. The measurement and prediction of the structural response of the pad’s ferrite cores is particularly important, as they are a brittle ceramic with a very low failure strain (around 400 με) and a high modulus (around 140 GPa). Ferrite also has a low thermal expansion compared to the surrounding polymeric components, which increases its thermally induced stresses.
Due to the importance of power losses generated within IPT pads, multiple studies have been conducted to experimentally and numerically obtain their thermal response during operation. For temperature prediction, coupled electromagnetic–thermal simulations are typically used, because losses in the coil and ferrite are temperature-dependent [
6,
7,
9,
10,
11]. Amirpour et al. developed and validated finite element-based transient coupled simulations on a ¼-scale double-D (DD) IPT pad energized in a sandbox [
6]. Kim et al. used finite element (FE) simulations to evaluate the steady-state thermal response of the full-scale version of the pad used by Amirpour [
7]. Alsayegh et al. used a similar approach to obtain the transient temperature of the coil of an unpotted circular pad [
9]. Zimmer et al. compared the transient temperatures predicted from one-way and two-way coupled simulations on a secondary pad with a rectangular coil [
10]. While most researchers used the finite element method for thermal simulation, computational fluid dynamics (CFD) have also been used [
11,
12,
13]. Notably, Rasekh et al. used CFD to predict the steady-state temperature of coupled primary and secondary DD pads [
11].
There is very limited research on the structural behaviour of IPT pads. Li et al. developed an experimental methodology and an FE model for investigating the structural response of a ¼-scale DD pad to wheel loading [
14]. The experimental characterization and optimization of the mechanical performance of individual litz wires and ferrite componentry were conducted by Piefke [
15]. Several other studies have used finite element analysis (FEA) to investigate the structural behaviour of IPT roadways with wheel loading; however, they have focused on the response of the pavement surrounding the charging device [
16,
17,
18].
The reviewed literature can broadly be split into two categories: thermal analyses of IPT systems for the determination of operating temperature [
6,
7,
9,
10,
11,
12,
13], and structural analyses of IPT systems when under wheel loading [
14,
15,
16,
17,
18]. There is a clear gap in the literature regarding the structural behaviour of IPT pads due to thermally induced loading. Given this, the objective of this paper is to present an experimental and FEA-based numerical investigation on the thermal–mechanical behaviour of a primary IPT pad. A focus was placed on the thermal–mechanical response of ferrite due to its brittleness, and hence potential for premature failure in service. The experimental results were used to validate the finite element (FE) model.
It was anticipated that it would be difficult to pinpoint sources of any potential deviation between experimentally measured and numerically predicted strains, due to the multiple components and material systems within a road-embedded pad. The most complex components from a modelling perspective are the coil and the surrounding pavement. The coil is both heterogenous and anisotropic, while pavement materials are heterogenous. To ascertain the contribution of the coil and pavement materials to any differences between the experimental and numerical results, three sets of thermal load cases were investigated. First, a pad without a coil was heated to uniform temperatures within an oven. In the second experiment, a complete IPT pad (i.e., with the coil) was suspended inside an environmental chamber (i.e., can freely expand) and energized with an alternating current. In the final experiment, the same pad was embedded in a simulant asphalt material and re-energized to obtain the most realistic thermal-mechanical response. The pad without a coil will subsequently be referred to in this paper to as the ‘partial pad’, while the pad with a coil will be referred to as the ‘complete pad’.
The paper starts with a description of the structure of the double-D (DD) pad, followed by the multi-physics characterization of the materials within. Next, details of the instrumentation of the ferrite cores, manufacturing process of the pad and the calibration of the sensors are presented. The numerical models and corresponding experimental setups are subsequently described. Finally, their results are presented, compared and discussed.
2. Double-D (DD) Inductive Power Transfer Pad
The ¼-scale IPT pad used in this study was adapted from the structural analyses detailed in Li et al. [
19] and is shown in
Figure 1. The length and width of this pad was scaled down to ¼ of that of the 10 kW pad analysed by Kim et al. [
7]. Because the thickness of the ferrites, casing and litz wire could not be scaled down in a uniform manner, the thickness of the ¼-pad was around 60% that of the 10 kW pad. Two litz wires, with a diameter of 4 mm, were wound side-by-side in a bifilar fashion to create a coil in the shape of a double-D (DD). Four rectangular MnZn ferrite cores (100 × 30 × 5 mm) were situated beneath the coil to shape the magnetic flux. The ferrites were CF295 and sourced from Cosmo Ferrites. Beneath the ferrite, is a 3 mm thick aluminium plate to absorb leakage flux below the ferrite. These components were assembled into a 3D printed polyamide 12 (PA2200 from EOS) casing and potted with a thermosetting polyurethane: UR5608 from Electrolube. The potting material encapsulates and fixes the internal componentry within the case, aiding in the conduction of heat away from the system and improving structural integrity. A 4 mm gap was set in between the ferrite and casing, and between the ferrite and aluminium plate, to allow for instrumentation wiring to run in between.
3. Material Characterization
For the finite element analysis of the pad, the Young’s modulus, thermal expansion and thermal conductivity of the materials within the system need to be characterized as a function of temperature. The electrical conductivity and core loss of the litz wire and magnetic core, respectively, also have to be characterized with temperature.
3.1. Ferrite
The modulus of ferrite was measured in 4-point bending, using a procedure based on ASTM C1161 [
20]. Measurements were taken at 21 °C, 60 °C and 100 °C using an Instron 1185 with a mounted environmental chamber (3119-6000 series). The crosshead speed was 1 mm/min, as per the standard. Resistive strain gauges [350 Ω, type FLAD-3-350-11-1LJC-F from Tokyo Measuring Instruments Laboratory (TML), Tokyo, Japan] were used for strain measurement. The average modulus was 138 MPa and had negligible change with temperature. A Poisson’s ratio of 0.25, based on tests conducted by Moinuddin and Ramana Murthy [
21], was used within the numerical modelling.
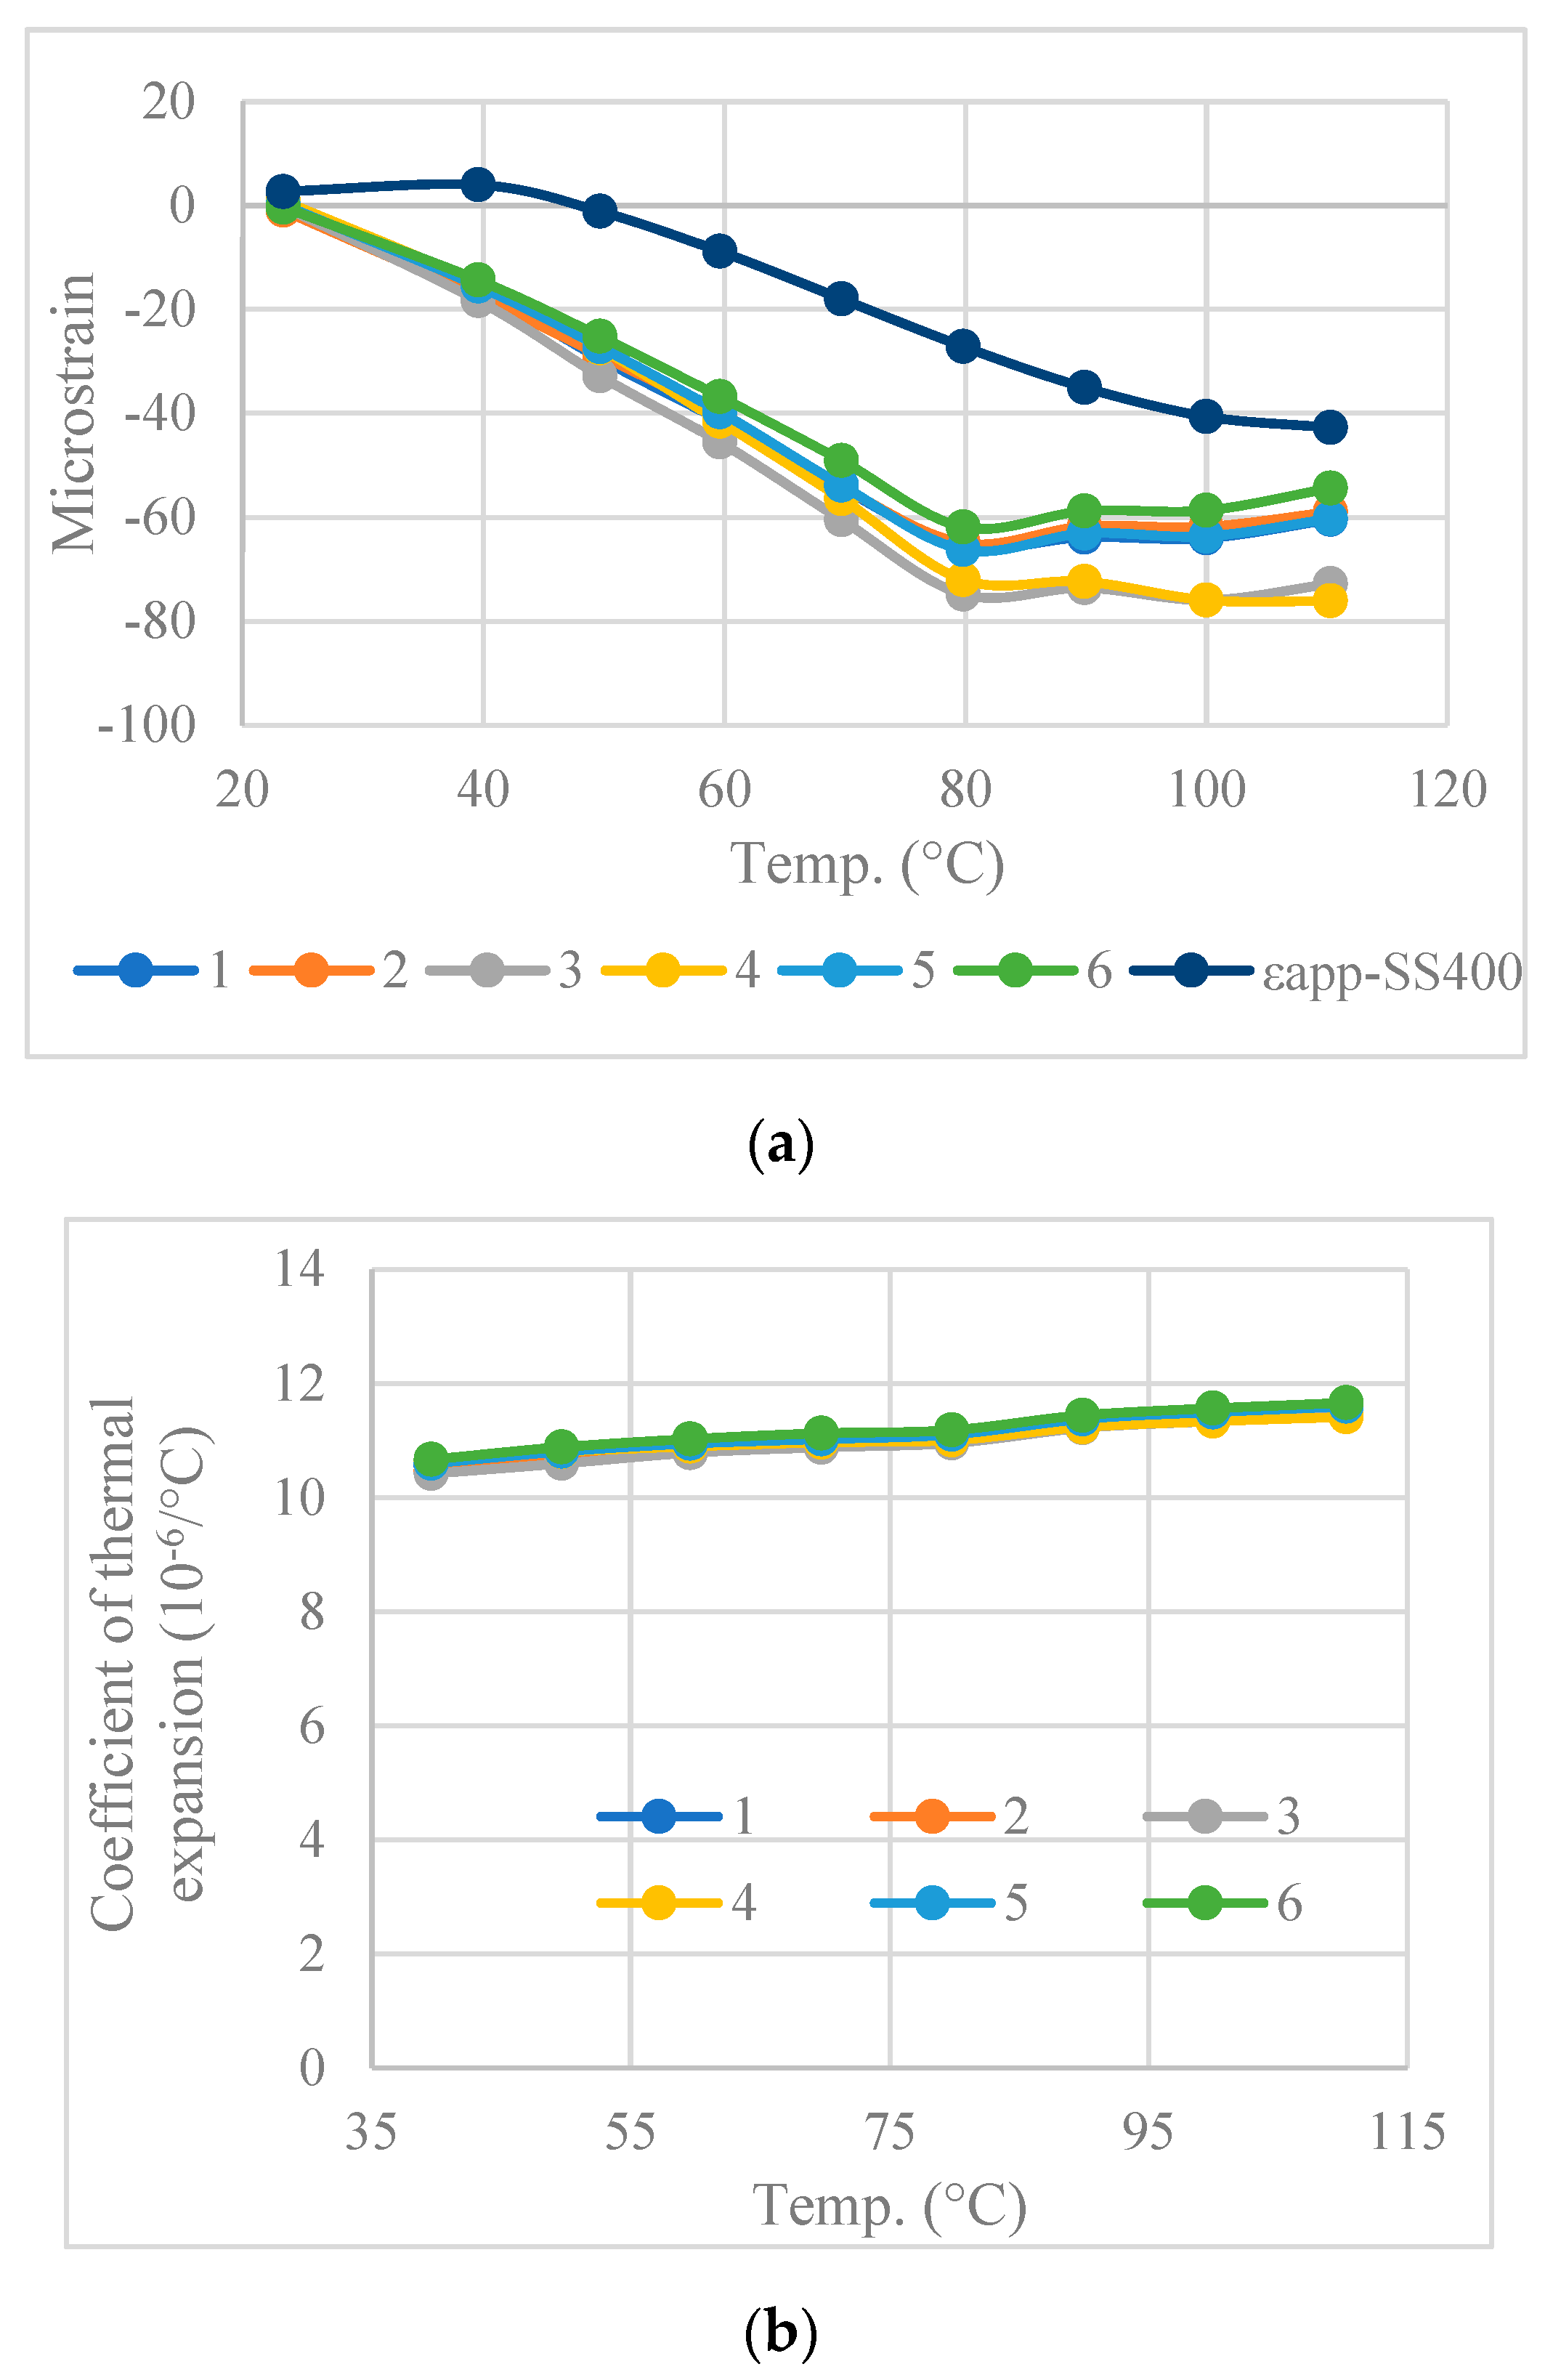
To measure the coefficient of thermal expansion, ferrites, with the strain gauges attached, were placed in an oven and heated to a series of target temperatures in 10 °C increments. At each increment,
, the ferrites were kept at the target temperature for an hour to ensure complete thermal equilibrium. The coefficient of thermal expansion (CTE) of a material (
) can be calculated based on its stress-free output strain (
) at different temperatures and the output strain of a known reference material (
), using Equation (1) [
22]. The apparent strain output data for the reference material [stainless steel (SS 400)], which has a coefficient of thermal expansion (
) of 11.8 × 10
−6/°C, were provided by TML [
23].
The apparent thermal strain, measured on six ferrite samples, is presented in
Figure 2a. The calculated CTE of ferrite, presented in
Figure 2b, was observed to slightly increase with temperature; however, the change was small enough that it was approximated as a temperature constant value of 11 × 10
−6/°C.
The core loss of CF295 ferrite, which varies non-linearly with temperature, magnetic field, and frequency (although in this case, frequency was fixed at 85 kHz), was measured by Kim et al. for the thermal evaluation of a full-scale IPT pad [
7]. The same core loss model has been used in this study. Details of the measurement methodology are given in [
24]. The measured core loss model was implemented in the Ansys Maxwell solver using the Steinmetz equation, given in Equation (2), where
was fixed at 85,000 (the operating frequency of the pad was 85 kHz [
7]).
and
were empirically determined constants which varied with temperature.
A relative magnetic permeability of 200 was taken from datasheets [
25] and was approximated as a constant between the temperatures of 20 °C and 100 °C, based on the modelling approach of [
6,
7]. The thermal conductivity of ferrite was 4.01 W/m·K and was measured using the transient hot wire method with the Mathis TC 30 [
6].
3.2. Potting Polyurethane (UR5608)
The Young’s modulus of UR5608 was measured using a procedure based on ASTM D638 [
26] on Type I dog done specimens. A slow crosshead speed of 0.5 mm/min was used to match the quasi-static nature of thermal loading (described in
Section 1). The tests were conducted between 20 °C and 100 °C, using an Instron 1185 with a mounted environmental chamber. Strain was measured using an extensometer with a gauge length of 50 mm. The resulting stress–strain curves are presented in
Figure 3, showing that the polymer is well approximated as linearly elastic across the entire temperature range. The modulus of UR5608 was also not observed to vary significantly with temperature, at least at a loading rate of 0.5 mm/min. A temperature-independent modulus of 33 MPa was used for the simulations. Poisson’s ratio was measured previously to be 0.48 [
14] and was also approximated to be constant with temperature.
Thermal expansion was measured using a dynamic mechanical analyser (DMA Q800 from T.A. Instruments, New Castle, DE, USA) in ‘film tension’ mode, with a temperature ramp of 1 °C/min. The thermal expansion of the polymer with temperature was very linear and repeatable across three samples. Based on the average slope of the thermal expansion curves, the coefficient of thermal expansion (CTE) of the polymer was determined to be 177 × 10
−6/°C. A thermal conductivity of 0.78 W/m·K was taken from the supplier datasheet [
27].
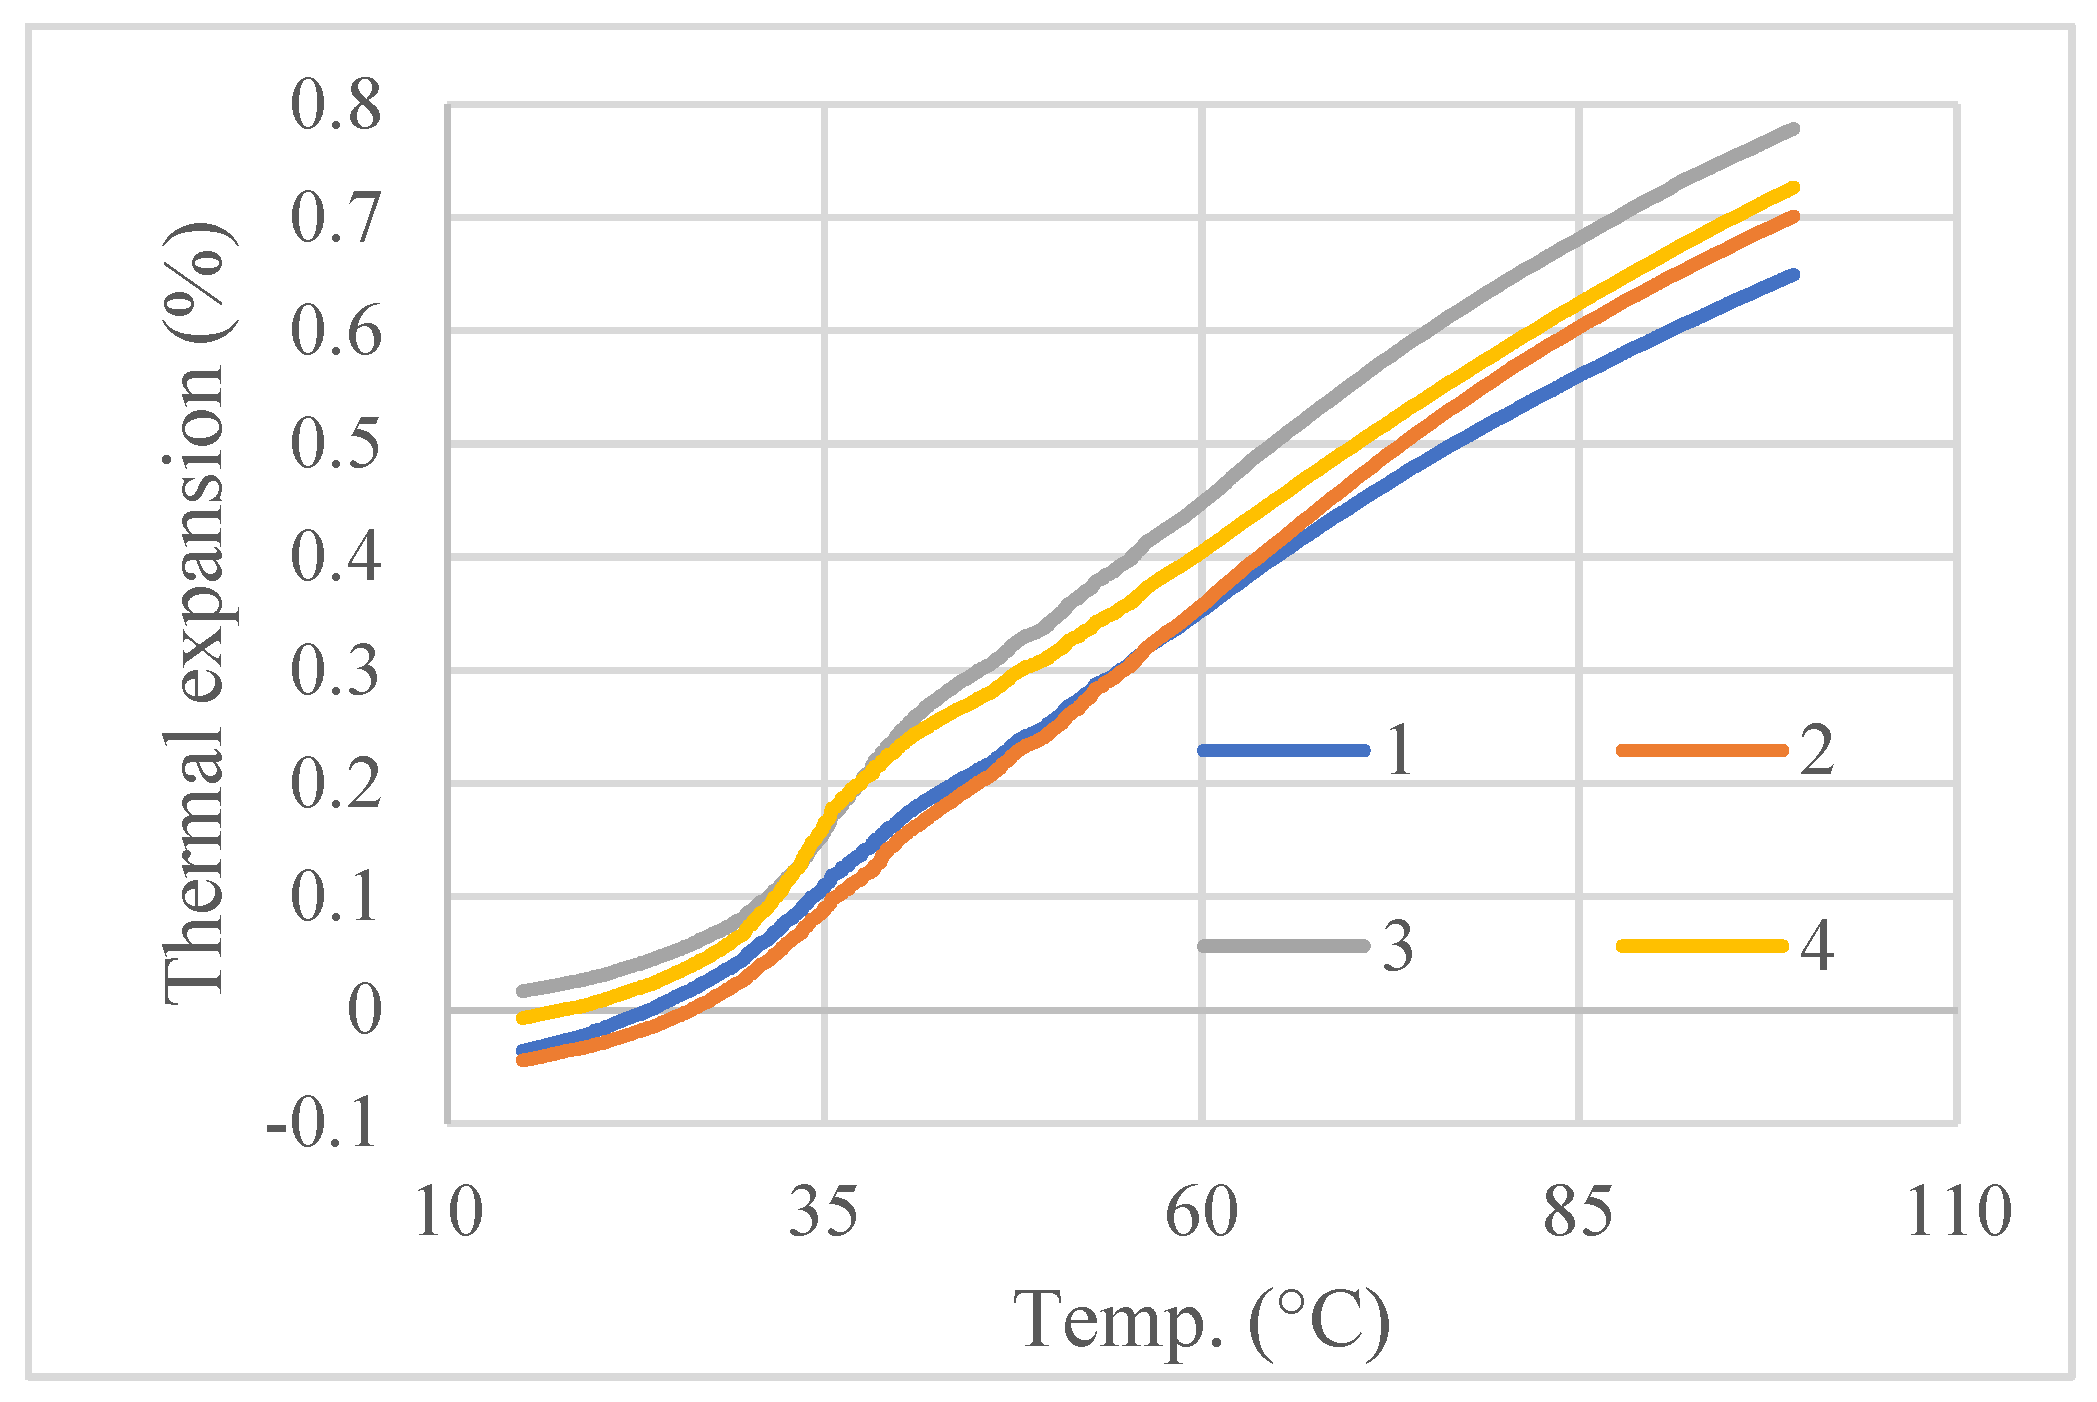
3.3. Polyamide Casing (PA 2200)
Both the coefficient of thermal expansion and the Young’s modulus of the casing material were measured using the DMA Q800. Thermal expansion was measured in ‘film tension’, while the modulus of the 3D printed material was measured in ‘dual-cantilever’ mode. A sinusoidal strain of 0.1% was applied to the specimen at 0.1 Hz.
The thermal expansion of the casing material increased non-linearly with temperature. The thermal expansion of three specimens were fitted to 3rd order polynomials, which were then differentiated to obtain the polymer CTE,
Figure 4a. The temperature dependent modulus of PA2200 is given in
Figure 4b. A thermal conductivity of 0.144 W/m·K was taken from readily available datasheets [
28].
3.4. Litz Wire
To obtain the temperature-dependent electrical conductivity of 4 mm diameter litz wire, the resistance of the coil at 85 kHz was measured at 13 °C and 50 °C, using an LCR meter (Keysight E4980, Keysight, Santa Rosa, CA, USA). Resistance increased from 9.4 mΩ at 13 °C to 10.3 mΩ at 50 °C. Electrical conductivity (
), which is the inverse of resistivity (
), was calculated using Equation (3).
is the total resistance of the coil,
is the length of the coil (2.78 m) and
is the cross-sectional area of the litz wire. Calculating the electrical conductivities of the coil at 13 °C and 50 °C using Equation (3), and assuming a linear decrease with temperature (as for copper [
27]), resulted in Equation (4) for the temperature-dependent electrical conductivity of litz wire.
The equivalent thermal conductivity of the litz wire along its length has been measured to be 159 W/m·K [
6], while an equivalent transverse thermal conductivity of 2.5 W/m·K was used, based on Simpson et al. [
29]. The axial coefficient of thermal expansion was approximated as the thermal expansion of copper, which has a value of around 16.5 × 10
−6/°C between 20 °C and 100 °C [
30]. As an initial estimation, 16.5 × 10
−6/°C was also used for the transverse CTE; however, an FEA-based sensitivity analysis on the effect of axial and transverse litz wire CTE is presented in
Section 10.2. The axial (E
x), transverse (E
y, E
z), and shear moduli (G
x, G
y, G
z) of litz wire were determined by Li et al. [
14] and are given in
Table 1. Due to the temperature stability of copper, the moduli of litz wire were approximated as constant with temperature.
3.5. Aluminium Plate
The Young’s modulus of aluminium was measured using the DMA and was found to decrease slightly from 70 GPa at room temperature to 63 GPa at 100 °C. Thermal conductivity and thermal expansion were taken from readily available datasheets. Thermal conductivity increases from 144 W/m·K to 175 W/m·K between 0 °C and 100 °C [
31], while CTE was approximated as a temperature-independent value of 23.5 × 10
−6/°C [
31,
32].
3.6. Simulant Pavement Material
Embedding the pad inside asphalt is difficult, due to the pressure and heat required to compact and consolidate the material. It is also difficult to compact a sufficiently thick asphalt slab to provide realistic conditions around the pad (the thickness of the material below the pad would be too low) without the additional roading layers underneath (i.e., subbase and subgrade). Taking these factors into consideration, the asphalt was replaced with an aggregate–epoxy composite. ADR 230 epoxy resin from Adhesive Technologies was mixed with a DG7 aggregate mixture, which had a maximum aggregate size of 6.7 mm. Replacing the bitumen binder with epoxy allowed the ‘pavement material’ to be poured around the pad without the use of external pressure. This was analogous to the replacement of asphalt with sand in Amirpour’s thermal experiments [
6].
The compressive modulus of the composite between 21 °C and 100 °C was measured on cast cylindrical specimens with a diameter of 40 mm and a length of 75 mm, using a procedure based on ASTM D695 [
33]. An extensometer with a gauge length of 25 mm was used to measure strain. Specimens were tested at a slow crosshead speed of 0.13 mm/min. The results of the compressive tests are presented in
Figure 5. The stress–strain curves show that the composite can be well approximated as a linearly elastic material over the entire temperature range. The glass transition temperature of the epoxy, however, is around room temperature. This is evidenced by the modulus of the composite dropping greatly from 10,085 MPa at 21 °C to 454 MPa at 40 °C.
The thermal expansion of the composite was measured using the DMA Q800 in film tension mode. Based on the results, shown in
Figure 6, an average CTE of 9.35 × 10
−5/°C was obtained through a linear regression of the four curves. A thermal conductivity of 1.11 W/m·K was measured at 30 °C using the transient hot wire method and the Mathis TC 30.
4. Instrumentation
The ferrites in both the partial and complete pads were instrumented with a combination of resistive strain gauges and fibre Bragg grating (FBG) sensors. FBG sensors are more ideal for IPT applications as they are unaffected by magnetic fields but are typically more expensive than resistive strain gauges [
34]. The usage of both types of sensors in this study provides additional information regarding measurement methodologies for engineers who want to conduct similar thermal–mechanical investigations in the future. The TML resistive gauges were used, with the National Instruments NI-9219 module interfaced with LabVIEW for data acquisition. The FBG sensors used in this study were draw tower gratings (DTG
®s) from FBGS, with a diameter of 195 μm and a grating length of 3 mm. A LUNA Si155 interrogator was used to measure the reflected wavelength of each FBG, and the ENLIGHT sensing analysis software (v 1.18.8) was used to visualize the reflected spectrum and record the peak wavelengths.
The change in Bragg wavelength with strain (
) was found to be linear up until the failure strain of ferrite and is given by Equation (5) [
35]. The sensitivity factor,
, is 8.2 × 10
−7, and
is the strain in microstrains. The change in Bragg wavelength with temperature,
, of an unadhered and unconstrained FBG had minor non-linearity, and thus was calibrated experimentally.
For thermally induced strains, it is impossible to isolate the wavelength shift caused by temperature and mechanical strain using a single FBG sensor, if the temperature is not known prior to the experiment. One method of solving this problem is to install a stress-free FBG close to the stressed FBG for temperature measurement. Once temperature is known, the shift in wavelength from temperature (
) can be subtracted from the total wavelength shift (
) to obtain the shift from thermally induced mechanical strain, as shown in Equation (6). Note that, with this method, the shift in wavelength associated with temperature (
) for ferrite-adhered FBGs must still be known prior to measurement.
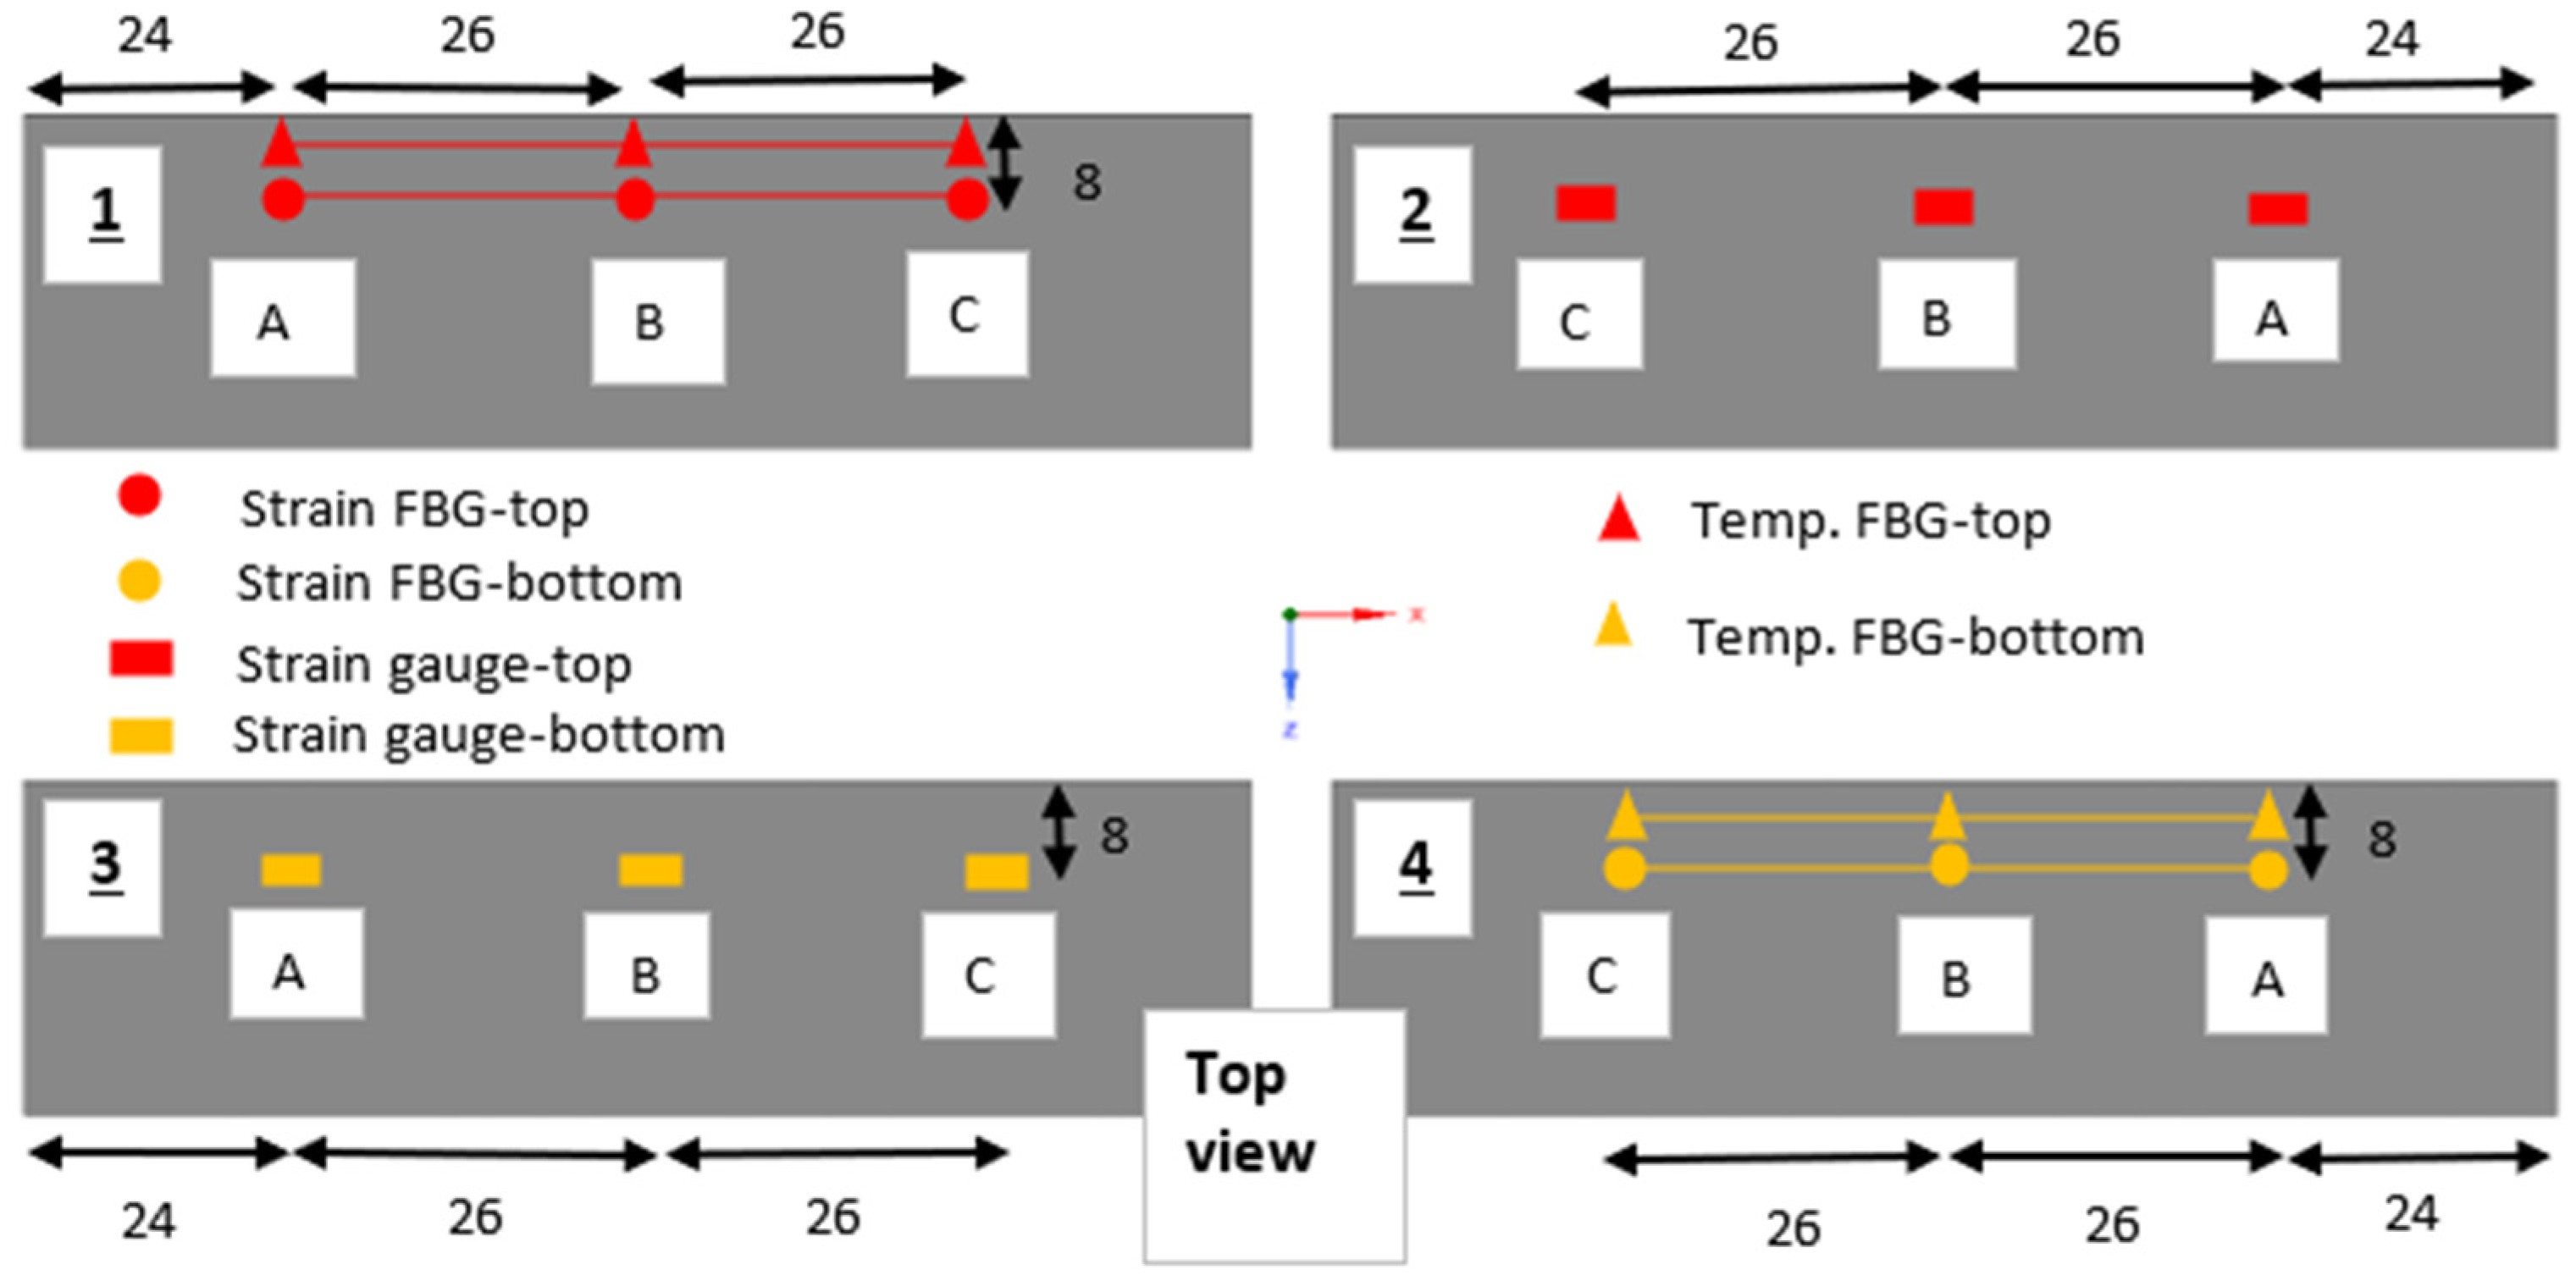
The instrumentation scheme for the ferrite cores of the partial and complete pads is shown in
Figure 7. FBGs were glued onto the ferrite using Loctite HY 4090, while Loctite 401 was used for resistance strain gauges. The lead wires of the strain gauges were twisted together to minimize drift in measurement over the long duration of the thermal experiment. The ferrites were numbered one to four, while the sensor locations on each ferrite were labelled using capital letters ‘A’, ‘B’ and ‘C’, with ‘A’ located closest to the outer edge. Sensors will be referred to by the “Ferrite #” “Location”. For example, ‘2A’ refers to the sensor on Ferrite 2 at Location ‘A’. For the compensation of
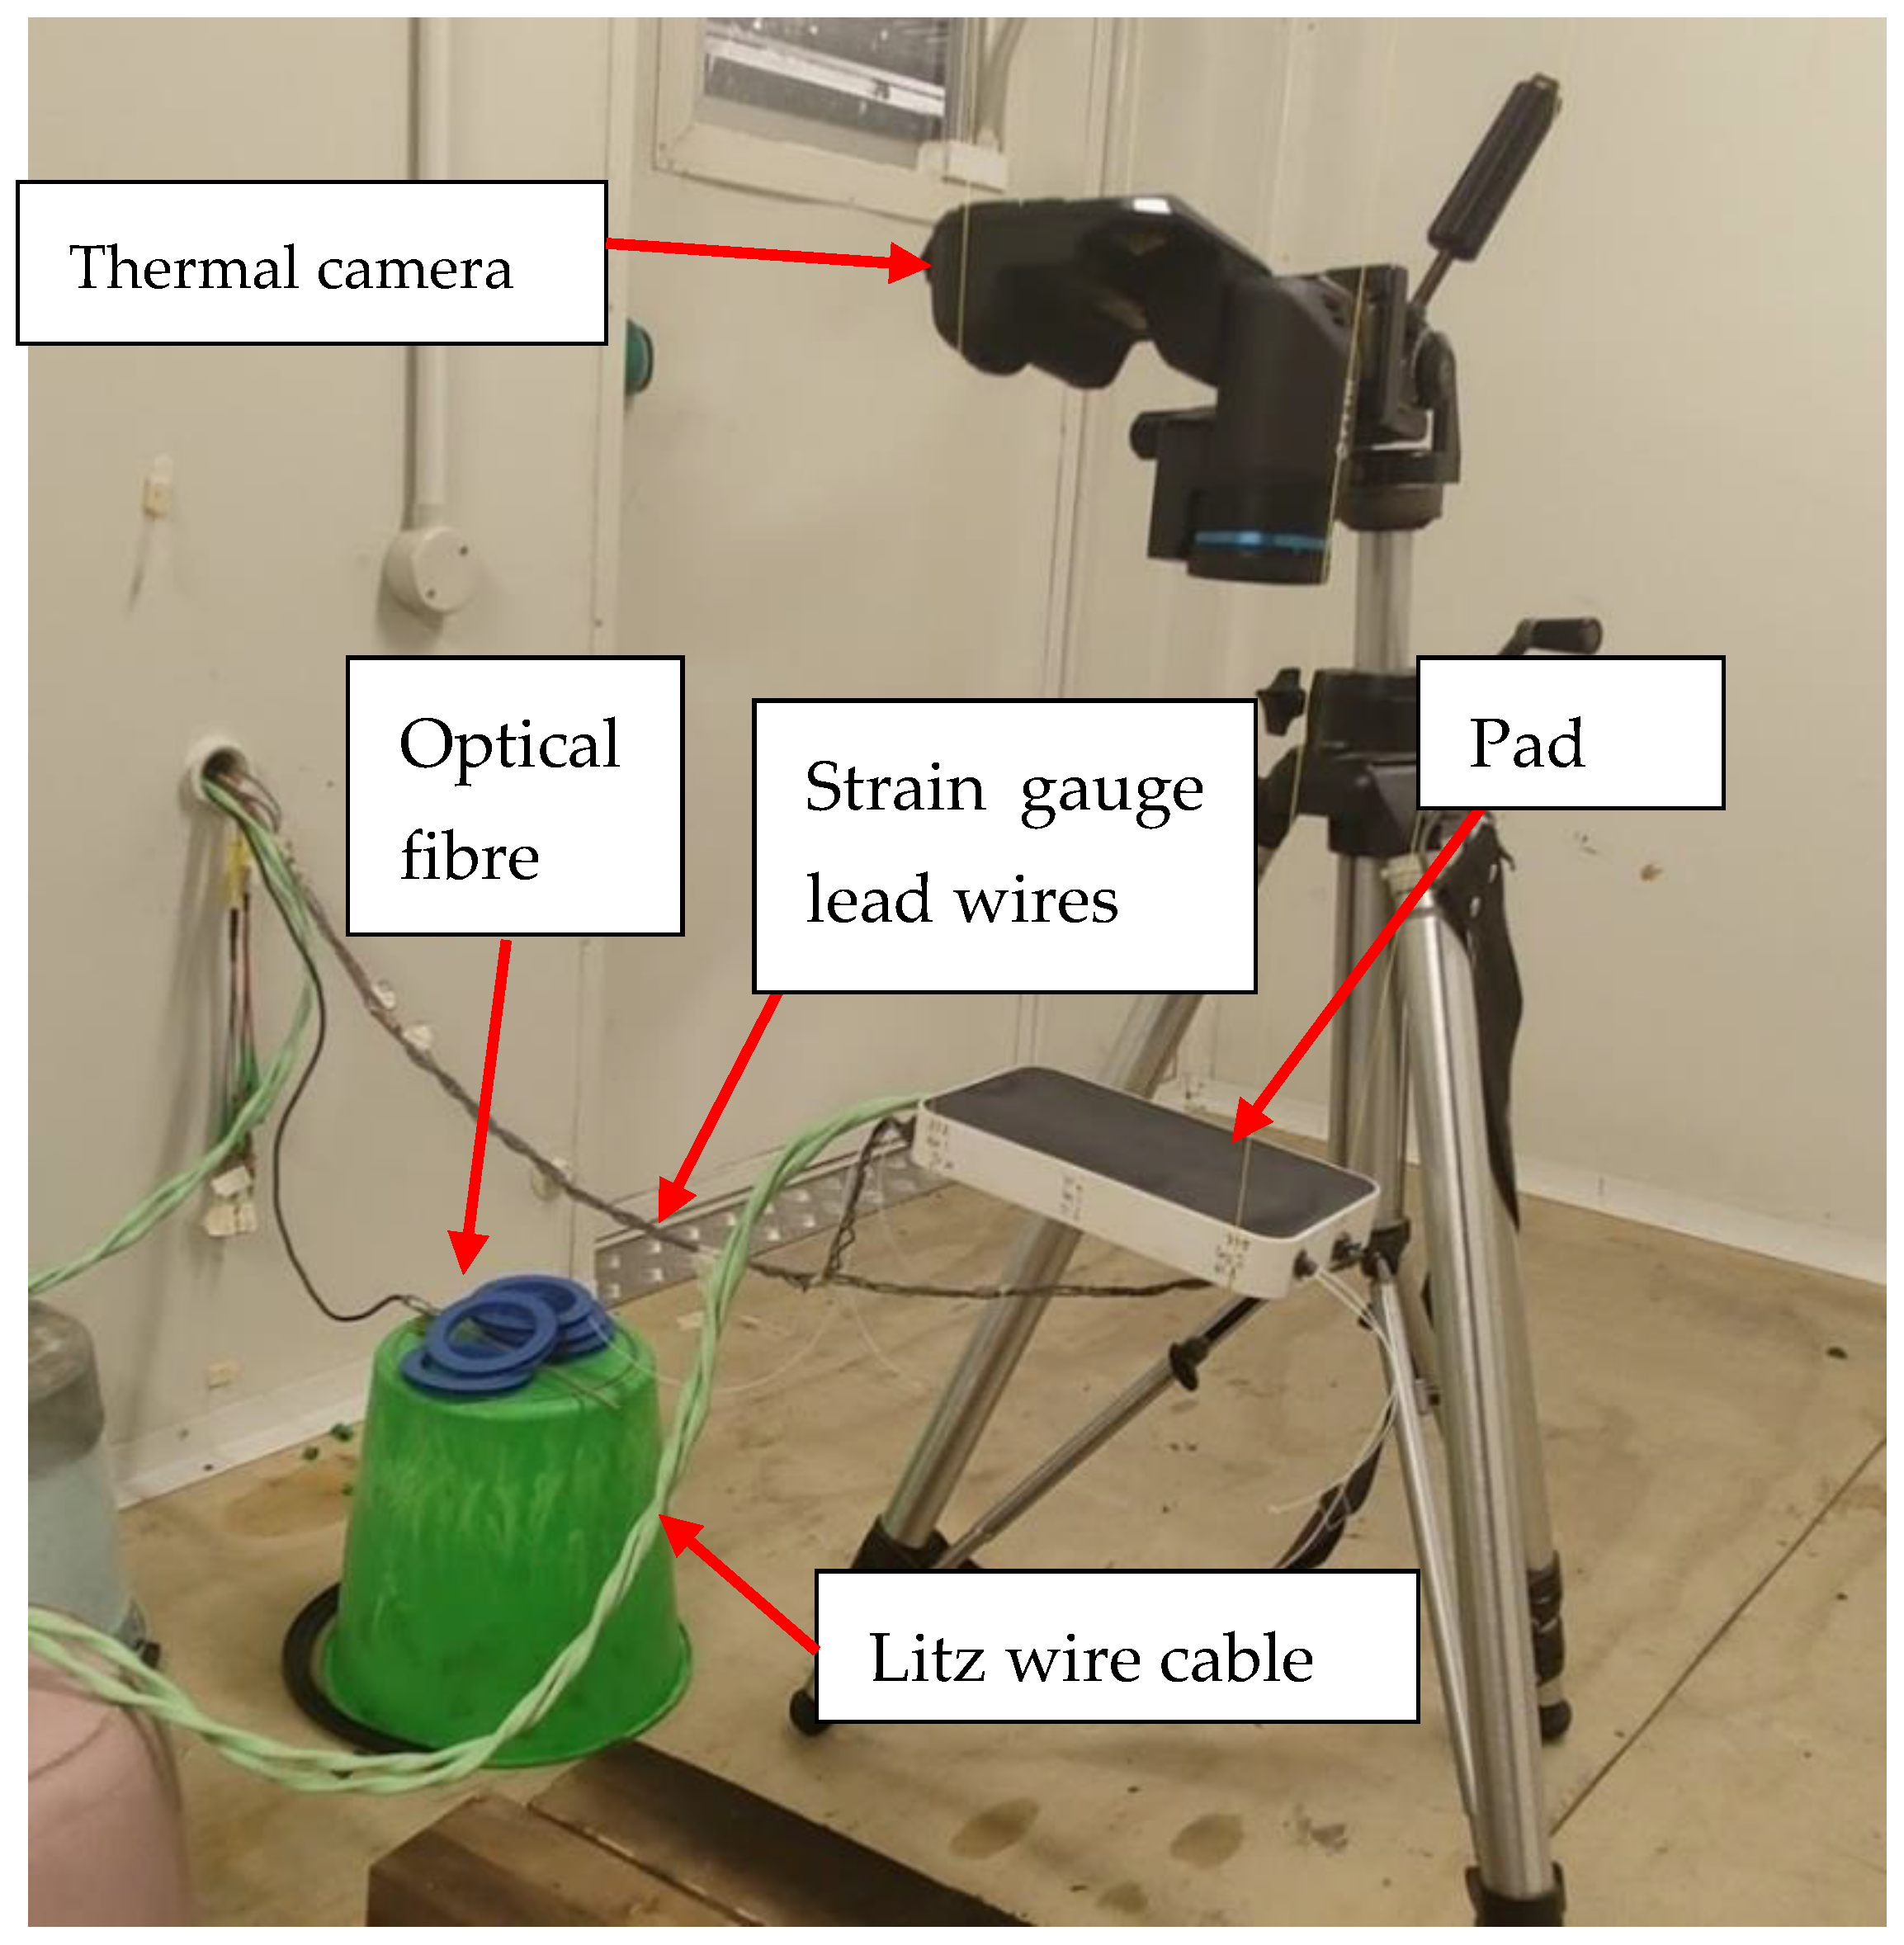
for thermally induced strains, temperature-sensing FBGs were located beside the strain-sensing FBGs on the complete pad. An additional temperature-sensing FBG was placed in the middle of the coil. To isolate the temperature FBGs, they were inserted into a Teflon tube (inner diameter 0.6 mm, outer diameter 1 mm). The temperature on the top surface of the complete pad was also measured using an FLIR T540 thermal camera.
5. Temperature Calibration
After the strain FBGs were glued to the ferrite cores, and before potting, the ferrites were heated in 10 °C increments in an oven. All temperature FBGs were also calibrated before being inserted into the pad. The peak reflected wavelengths recorded at each temperature allowed
to be determined prior to the thermal testing of the pads. A thermometer was placed beside the FBGs in the oven to measure their temperature to within 0.1 °C. Before the calibration was performed, the attached sensors were heated to 5 °C above the maximum calibration temperature for a few hours and cooled down, to relax any residual stresses in the system prior to the calibration [
22].
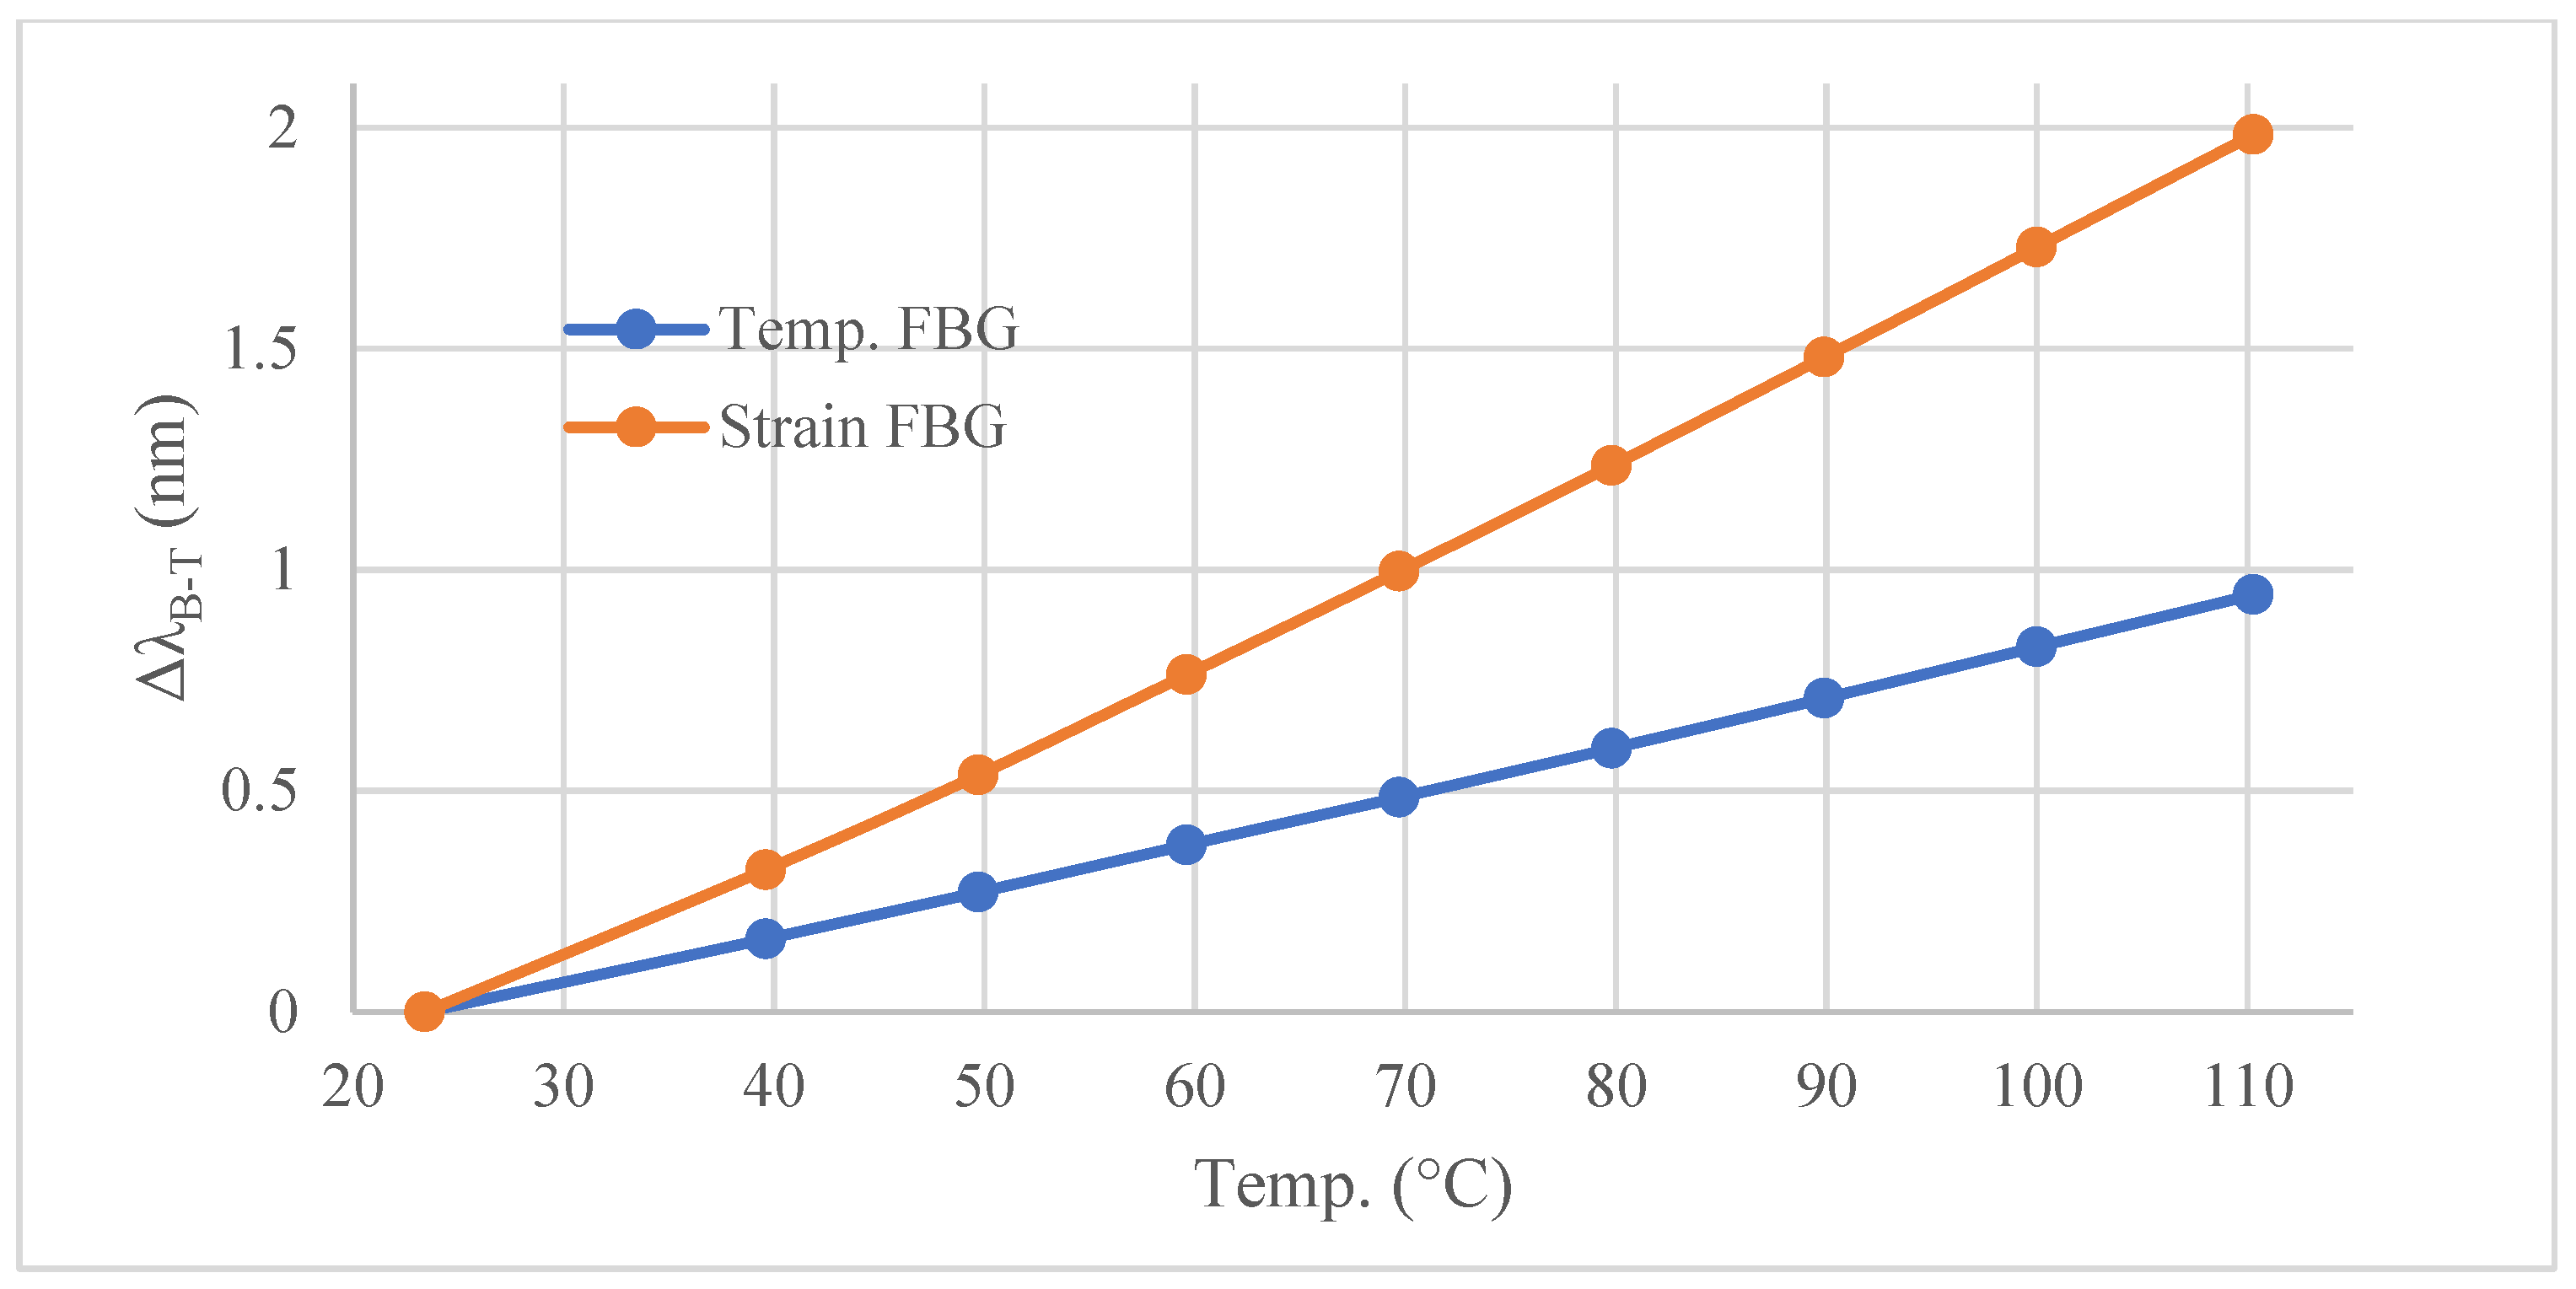
Figure 8 below shows that the typical shift in peak reflected wavelengths as temperature is increased from a room temperature of 23.3 °C to 110 °C.
for strain FBGs was around twice that for temperature FBGs, because the thermal expansion of the optical core is only 0.55 × 10
−6/°C compared to the 11 × 10
−6/°C of ferrite [
36]. An accurate measurement of
is critical for obtaining accurate strains, because
accounts for around 90% of the total wavelength shift,
, during the thermal testing of the pads.
Apparent strain measured by resistive strain gauges due to the stress-free thermal expansion of ferrite was determined using the same method used for the measurement of CTE described in
Section 3.1. This temperature induced apparent strain from each strain gauge was subtracted from the measured strain of the corresponding gauge during the thermal loading of the pad to obtain true mechanical strain on the ferrite.
6. Pad Manufacturing
To manufacture the complete quarter-scale IPT pad, the Bostik N40 Primer was first applied to the internal surfaces of the casing and litz wire to improve bonding between those components and UR5608. The coil was then wound into the top half of the casing. The entry and exit wires running beneath the coil were wrapped with high electrical resistance Kapton tape to eliminate the risk of an electrical short. The bifilar lead wires were twisted together and inserted into heat shrink tubing. After the hole around the exit wires was sealed with butyl tape, the polyurethane resin and hardener were mixed, degassed and poured into the top half of the casing. Once the potting was poured into the pad, it was cured in a pressurized chamber at 500 kPa, to minimize void content and facilitate the flow of resin to small gaps between the casing and litz wire. After potting, lugs were attached to the ends of the cables for connection to the power supply.
Once the top half of the pad was cured, the polyurethane coupling agent was applied to all internal surfaces in the bottom half of the pad. The ferrite cores (with strain gauges and FBG sensors attached) and the aluminium plate were then assembled into the casing. Holes were drilled into either end of the casing for sensor wiring to come out of the pad. Once the holes were sealed using butyl tape, resin was poured into the casing. After the bottom half of the pad was cured inside the pressurized chamber, the top and bottom surfaces were machined flat. The finished pad is shown in
Figure 9. The manufacturing process for the partial pad was identical to that of the complete pad with the exception of the winding of the coil.
After the experiment in which the complete pad was suspended in the environmental chamber and energized, the same pad was then embedded in an epoxy-based pavement simulant material. A top-open enclosure was constructed out of plywood and used as a mould for the pavement simulant, as shown in
Figure 10. The inside of the enclosure was covered with Teflon sheets for easy de-moulding, and grooves were cut in the front and rear panels, for the litz wire cables, FBG fibres and strain gauge lead wires to exit the enclosure. Before pouring the pavement material, the pad was placed upside down in the middle of the enclosure. To protect the FBG fibres from breaking under the weight of the ‘pavement’ material, perforated structures were 3D-printed and placed over the optical fibres and were subsequently embedded into the ‘pavement’. Once the pad was centralized, DG7 aggregates and epoxy were mixed in 3–4 kg batches and poured into the enclosure, until the height of the ‘pavement’ was around 120 mm. After the epoxy was cured, the sides of the wooden enclosure were disassembled, allowing the block to be carefully flipped over to reveal the flush-mounted pad on the other side.
7. Experimental Setup
In the first load case, the partial pad was heated to 35 °C, 50 °C, 65 °C and 80 °C, using the same oven previously used in the temperature calibration of the sensors. It took around 5 h for the pad to reach a steady-state temperature. To check that the pads did not yield or fail, the peak wavelengths and strain gauge readings were examined, to ensure that they returned to their reference values at room temperature.
In the second set of experiments, the complete pad was energized with a 58 A alternating current at 85 kHz, inside an environmental chamber set to 13 °C, 20 °C, 30 °C, 40 °C and 50 °C. A DC power supply, an inverter bridge and a tuning LC circuit were used to convert 60 Hz mains power to 85 kHz. The pad was suspended in mid-air with two strings, hung from the ceiling using magnet hooks. The test setup is shown in
Figure 11. During each test, the chamber was first set to the measured room temperature of 23.3 °C during the calibration of the sensors—this was the reference zero-strain temperature. After the pad was equilibrated at the reference temperature, the chamber was set to the target test temperature, and the pad was energized until the pad temperature reached a steady state (approximately 5 h). The pad was then de-energized, and once again, re-equilibrated at 23.3 °C. Due to large noise in the output of the resistive gauges while the pad was energized, strains from the resistive gauges were actually measured during the thermal unloading stage.
The experimental setup of the embedded pad is shown in
Figure 12. The pavement block was placed on two Styrofoam sheets to approximate a perfectly insulated boundary condition on the bottom surface. Thermal grease was applied between the Styrofoam and the pavement to improve the thermal contact at the interface. The heating and cooling cycle used for the embedded pad was similar to that used for the suspended pad. Due to the large thermal mass of the system, it took around 30 h to reach a steady-state temperature when heating and 30 h when cooling.
8. Finite Element Model
8.1. Geometry and Mesh
The thermal–mechanical analyses of the pad were performed using ANSYS Workbench 2022 R1. The IPT pad was discretized using 257,000 elements, with an element size of 3 mm assigned to all the components. The pavement block for the embedded pad model was discretized using 117,000 hexagonal elements with an initial size of 5 mm. Element sizing was biased along the height of the pavement, such that element length increased to 15 mm at the bottom. The FE mesh of the complete pad and pavement are shown in
Figure 13. Touching components of the pad, and the outer pad surfaces and pavement, were considered perfectly bonded. This was implemented in the FE solver using the Augmented Lagrange Formulation. Normal contact stiffness was set to 7000 N/mm
3, based on Li et al. [
14]. Additional details of the geometry and mesh are also provided in Li et al. [
14]. The geometry and mesh of the partial pad were identical to those of the complete pad, with the exception that the coil and potting were combined into a single potting ‘part’.
8.2. Boundary Conditions and Loads
For the simulation of the energized pad, its non-uniform temperature first had to be determined, using a two-way coupled electromagnetic and thermal simulation. In Maxwell, the coil was energized with a root mean square current of 58 A at 85 kHz, with electrical conductivity and core loss set to their initial values at room temperature. The calculated power loss distribution was then transferred to the thermal simulation to obtain the pad’s temperature field. The temperature field was subsequently transferred back to the electromagnetic simulation to obtain a new power loss, based on the updated temperature of the coil and ferrite, with iteration between the solvers until the temperature converged. Further details of the coupled procedure can be found in [
6,
7]. Once the converged temperature field was determined, it was transferred to the structural simulation for the calculation of thermally induced stresses and strains.
In the thermal simulation, natural convection and radiation were modelled on all surfaces of the suspended pad, and on the top/side surfaces of the pavement block. The bottom surface of the block was approximated as perfectly insulated. Heat flux (
) from the pad and pavement was calculated using Equation (7), where
is the convection coefficient (W/m
2·°C),
is the surface area, and
and
are the surface temperature and ambient temperature, respectively.
is a function of temperature, as well as the thermal conductivity, thermal expansion, kinematic viscosity and Prantl number of air, and was calculated using empirical vertical and horizontal flat plate correlations [
37].
Heat flux due to radiative cooling is given by Equation (8), where
is the Stefan–Boltzmann constant (5.6703 × 10
−8 W/m
2K
4).The emissivity coefficients (
) of the relevant materials were taken to be: 0.85 for UR5608 [
38], 0.95 for PA2200 casing [
39] and 0.85 for the epoxy-based pavement simulant [
40].
9. Results
9.1. Uniform Temperature Tests of the Partial Pad
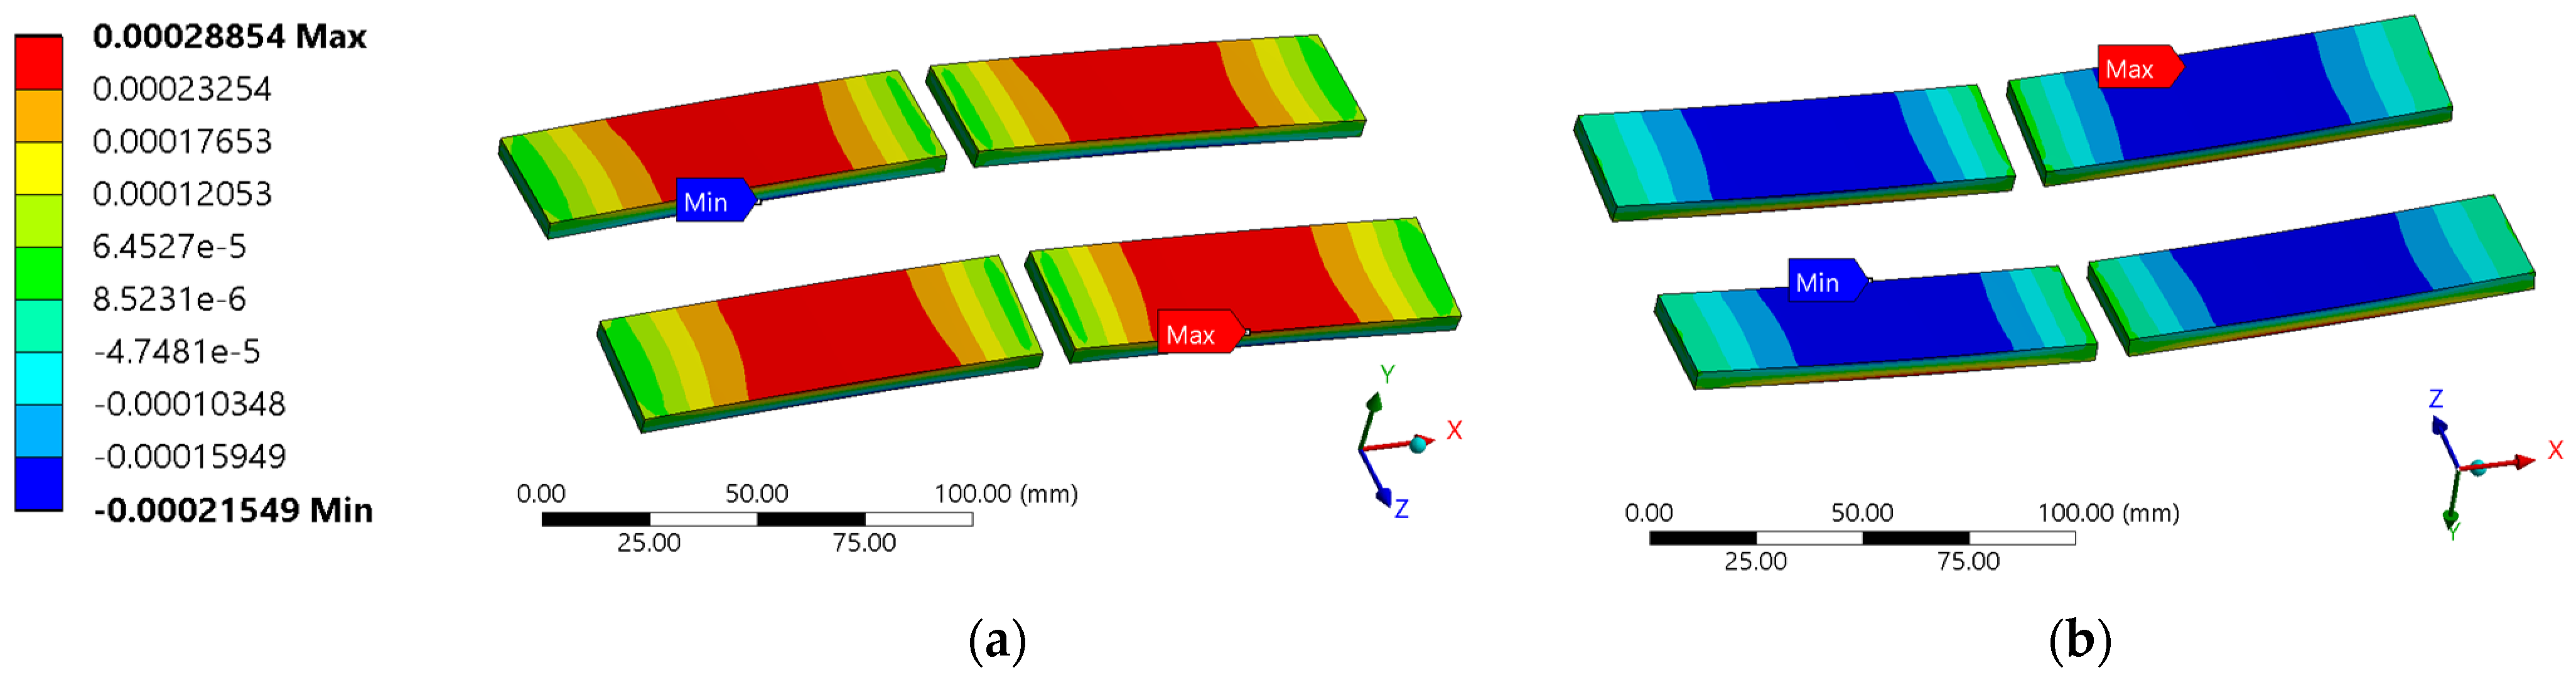
The presence of ferrite, giving a lower thermal expansion at the bottom of the pad, resulted in the pad bowing upwards.
Figure 14 shows the predicted X-strain in the ferrite cores at 80 °C. Due to the bowing, the cores were subject to bending, with maximum strains towards the centre. The top was in tension and the bottom was in compression. Strain distributions were similar in all four cores, due to the pad symmetry. Tension strains were higher than compressive strains by an average of 37% across all sensor locations. The higher thermal expansion of the surrounding material induced a tensile strain on the cores, which was superimposed onto the bending strains. Due to the similar construction of the partial and complete pads, they all exhibited a similar structural response.
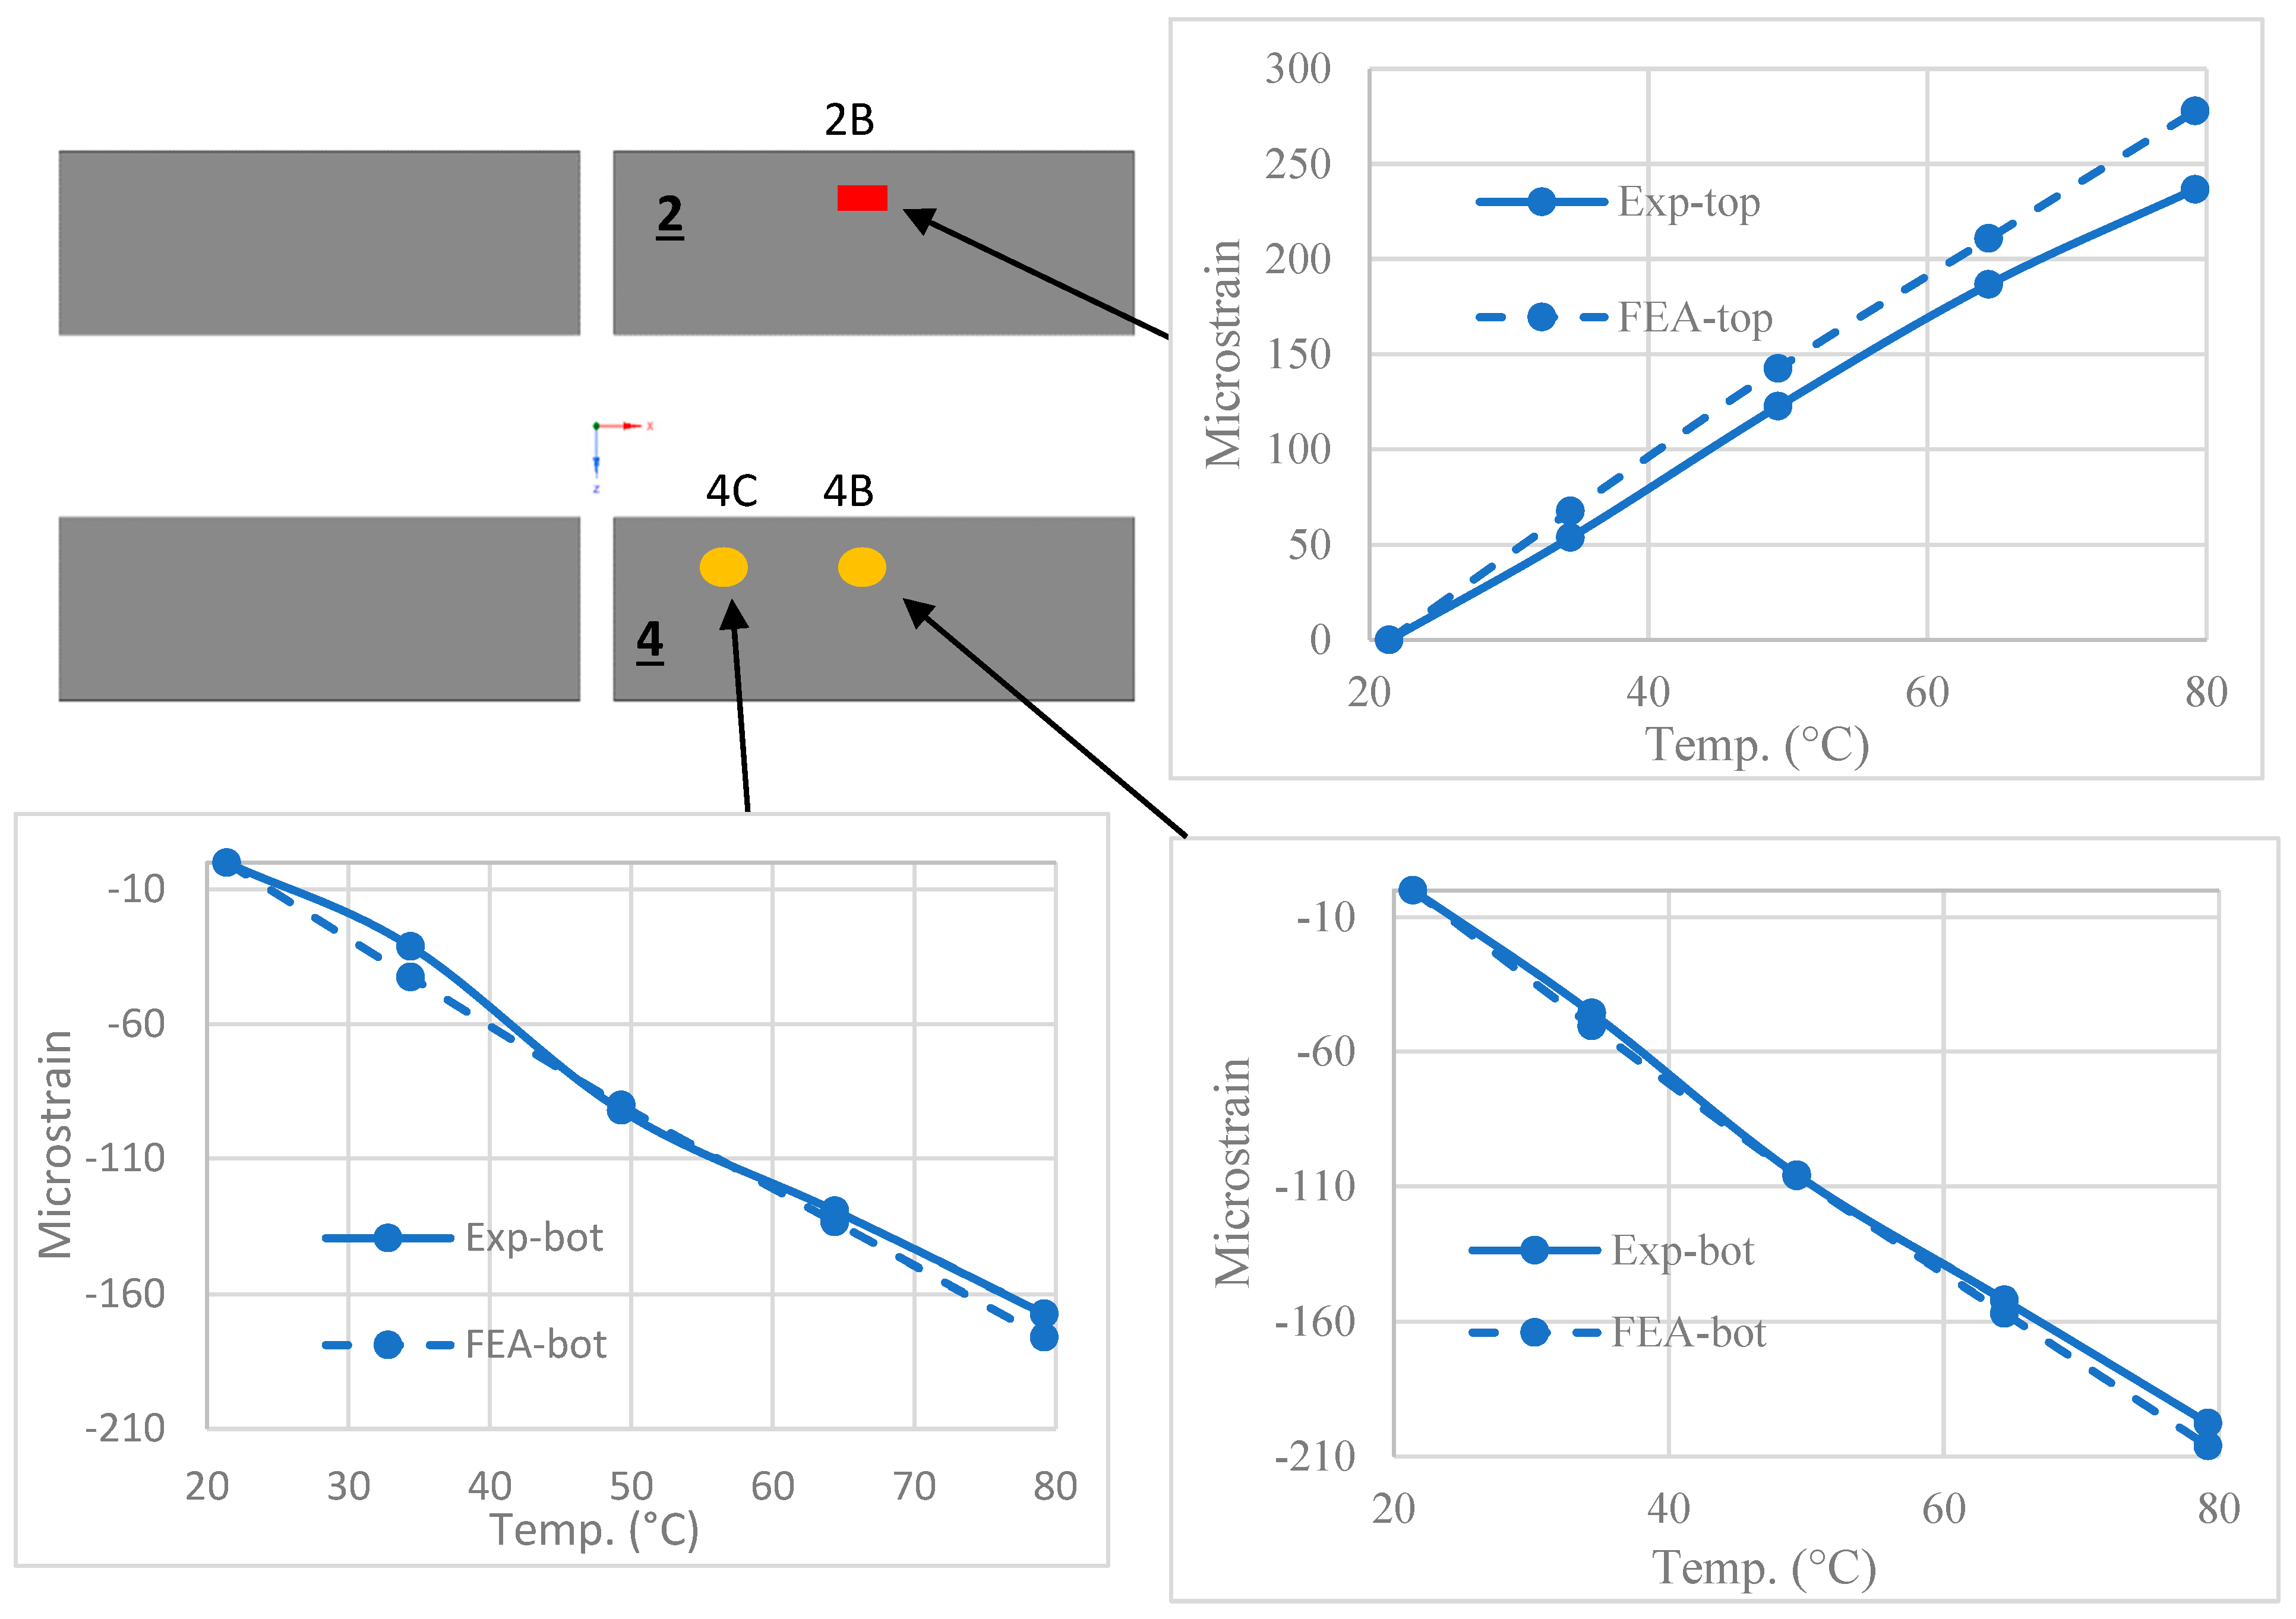
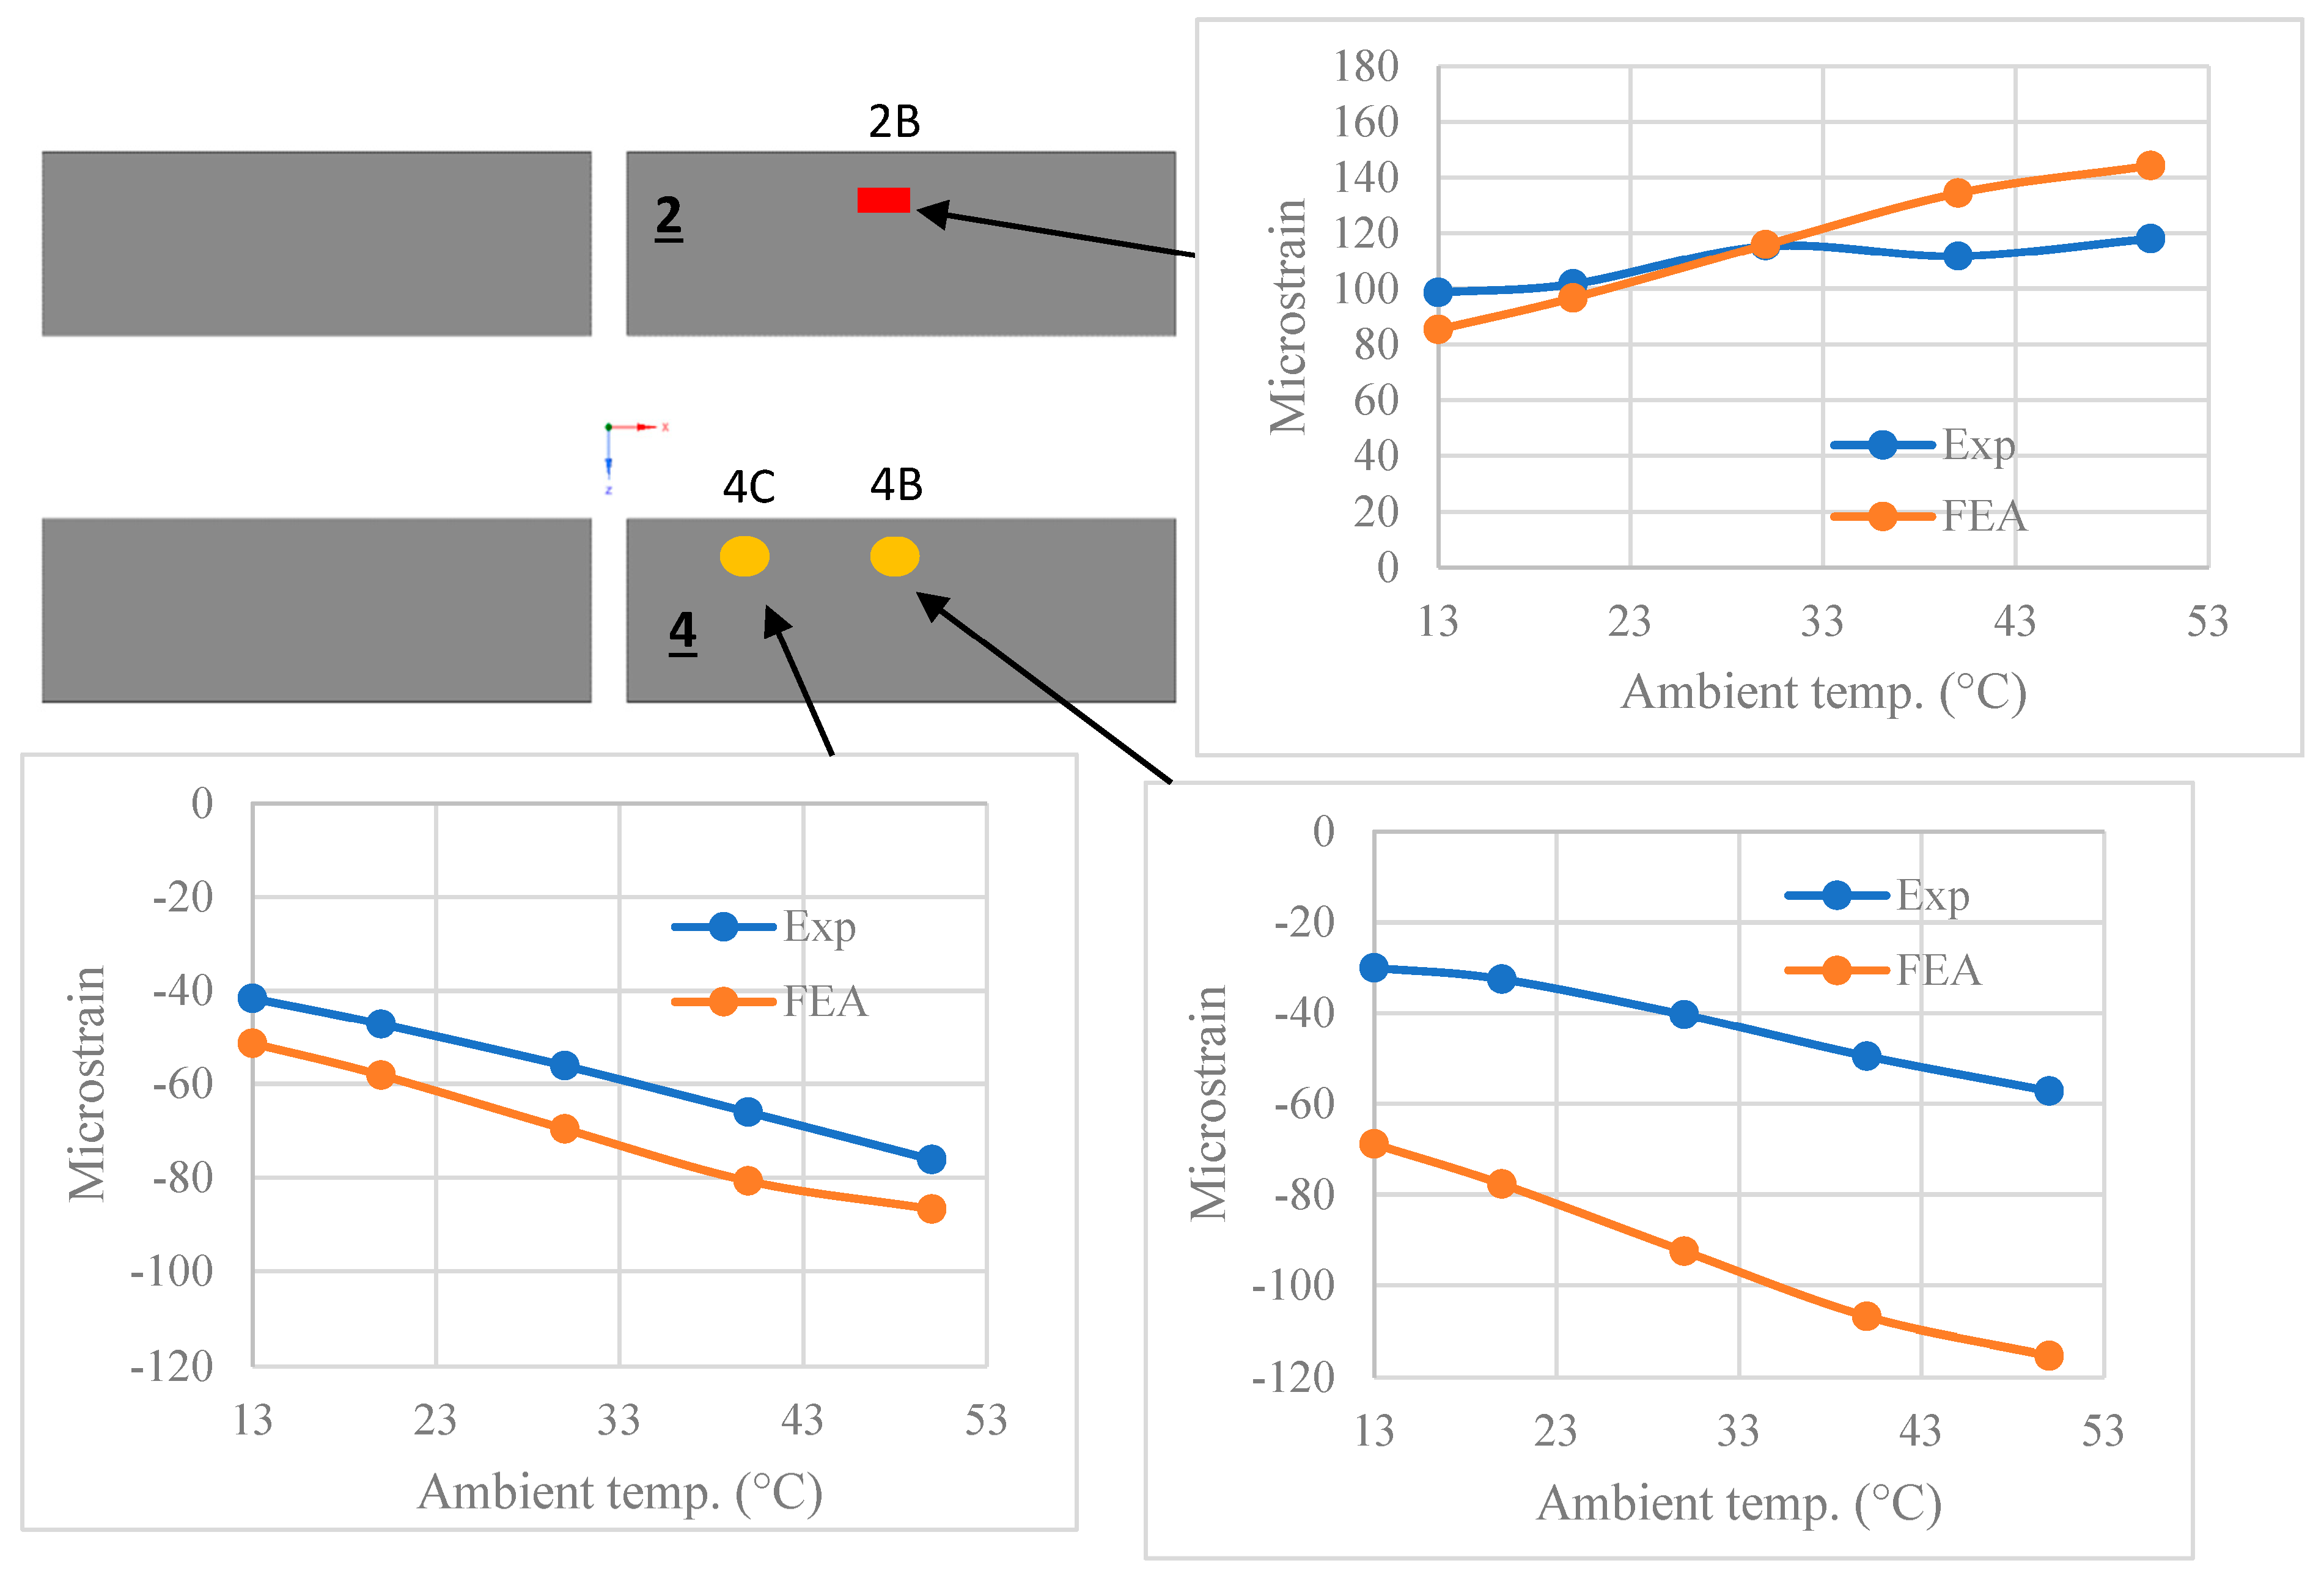
A snapshot of the measured and predicted strains in the partial pad is presented in
Figure 15. For the brevity of the paper, only results at 2B, 4B and 4C are shown; however, they are generally representative of the results across the whole pad because of its symmetry.
Figure 15 shows a very good correlation between the experimental and numerical results. The sign, magnitude and slope of the strain vs. temperature curves are closely matched. Experimental tensile strains were higher than compressive strains, as predicted by FEA. Furthermore, the measured strains were consistently higher in the middle of the ferrite (B) than near the ends (A and C), as was also predicted. Strain was over-predicted by an average of 19% and 8% at 35 °C and 80 °C, respectively. The root mean square error (RMSE) was 10 με and 29 με at 35 °C and 80 °C, respectively.
9.2. Complete Pad Energized in Air
Total losses in the pad increased from 36.6 W at an ambient temperature of 13 °C to 40.5 W at an ambient temperature of 50 °C, due to the increase in electrical resistance of the coil with temperature. Core losses only contributed around 1% to total losses. There was an excellent correlation between the temperature measurements and predictions. At 50 °C ambient, the centre coil temperature and maximum surface temperature were measured to be 99.9 °C and 94.5 °C, respectively, with less than 1% deviation from the numerically predicted values.
The temperatures measured on Ferrite 4 of the energized pad are shown in
Figure 16. As expected, ferrite temperatures were slightly lower than centre coil temperatures, but still increased linearly with ambient temperature. There was minimal variation with position in the ferrite temperatures, as observed also in the measurements. The relatively small variation along the ferrites allowed for an accurate temperature compensation of
, because there would be minimal differences in temperature between the adjacent pairs of the strain and temperature FBGs. Ferrite temperatures were consistently underpredicted, compared to the centre coil and surface temperatures. However, there was still an excellent correlation, with only a deviation of 8% between the experimental and simulation results.
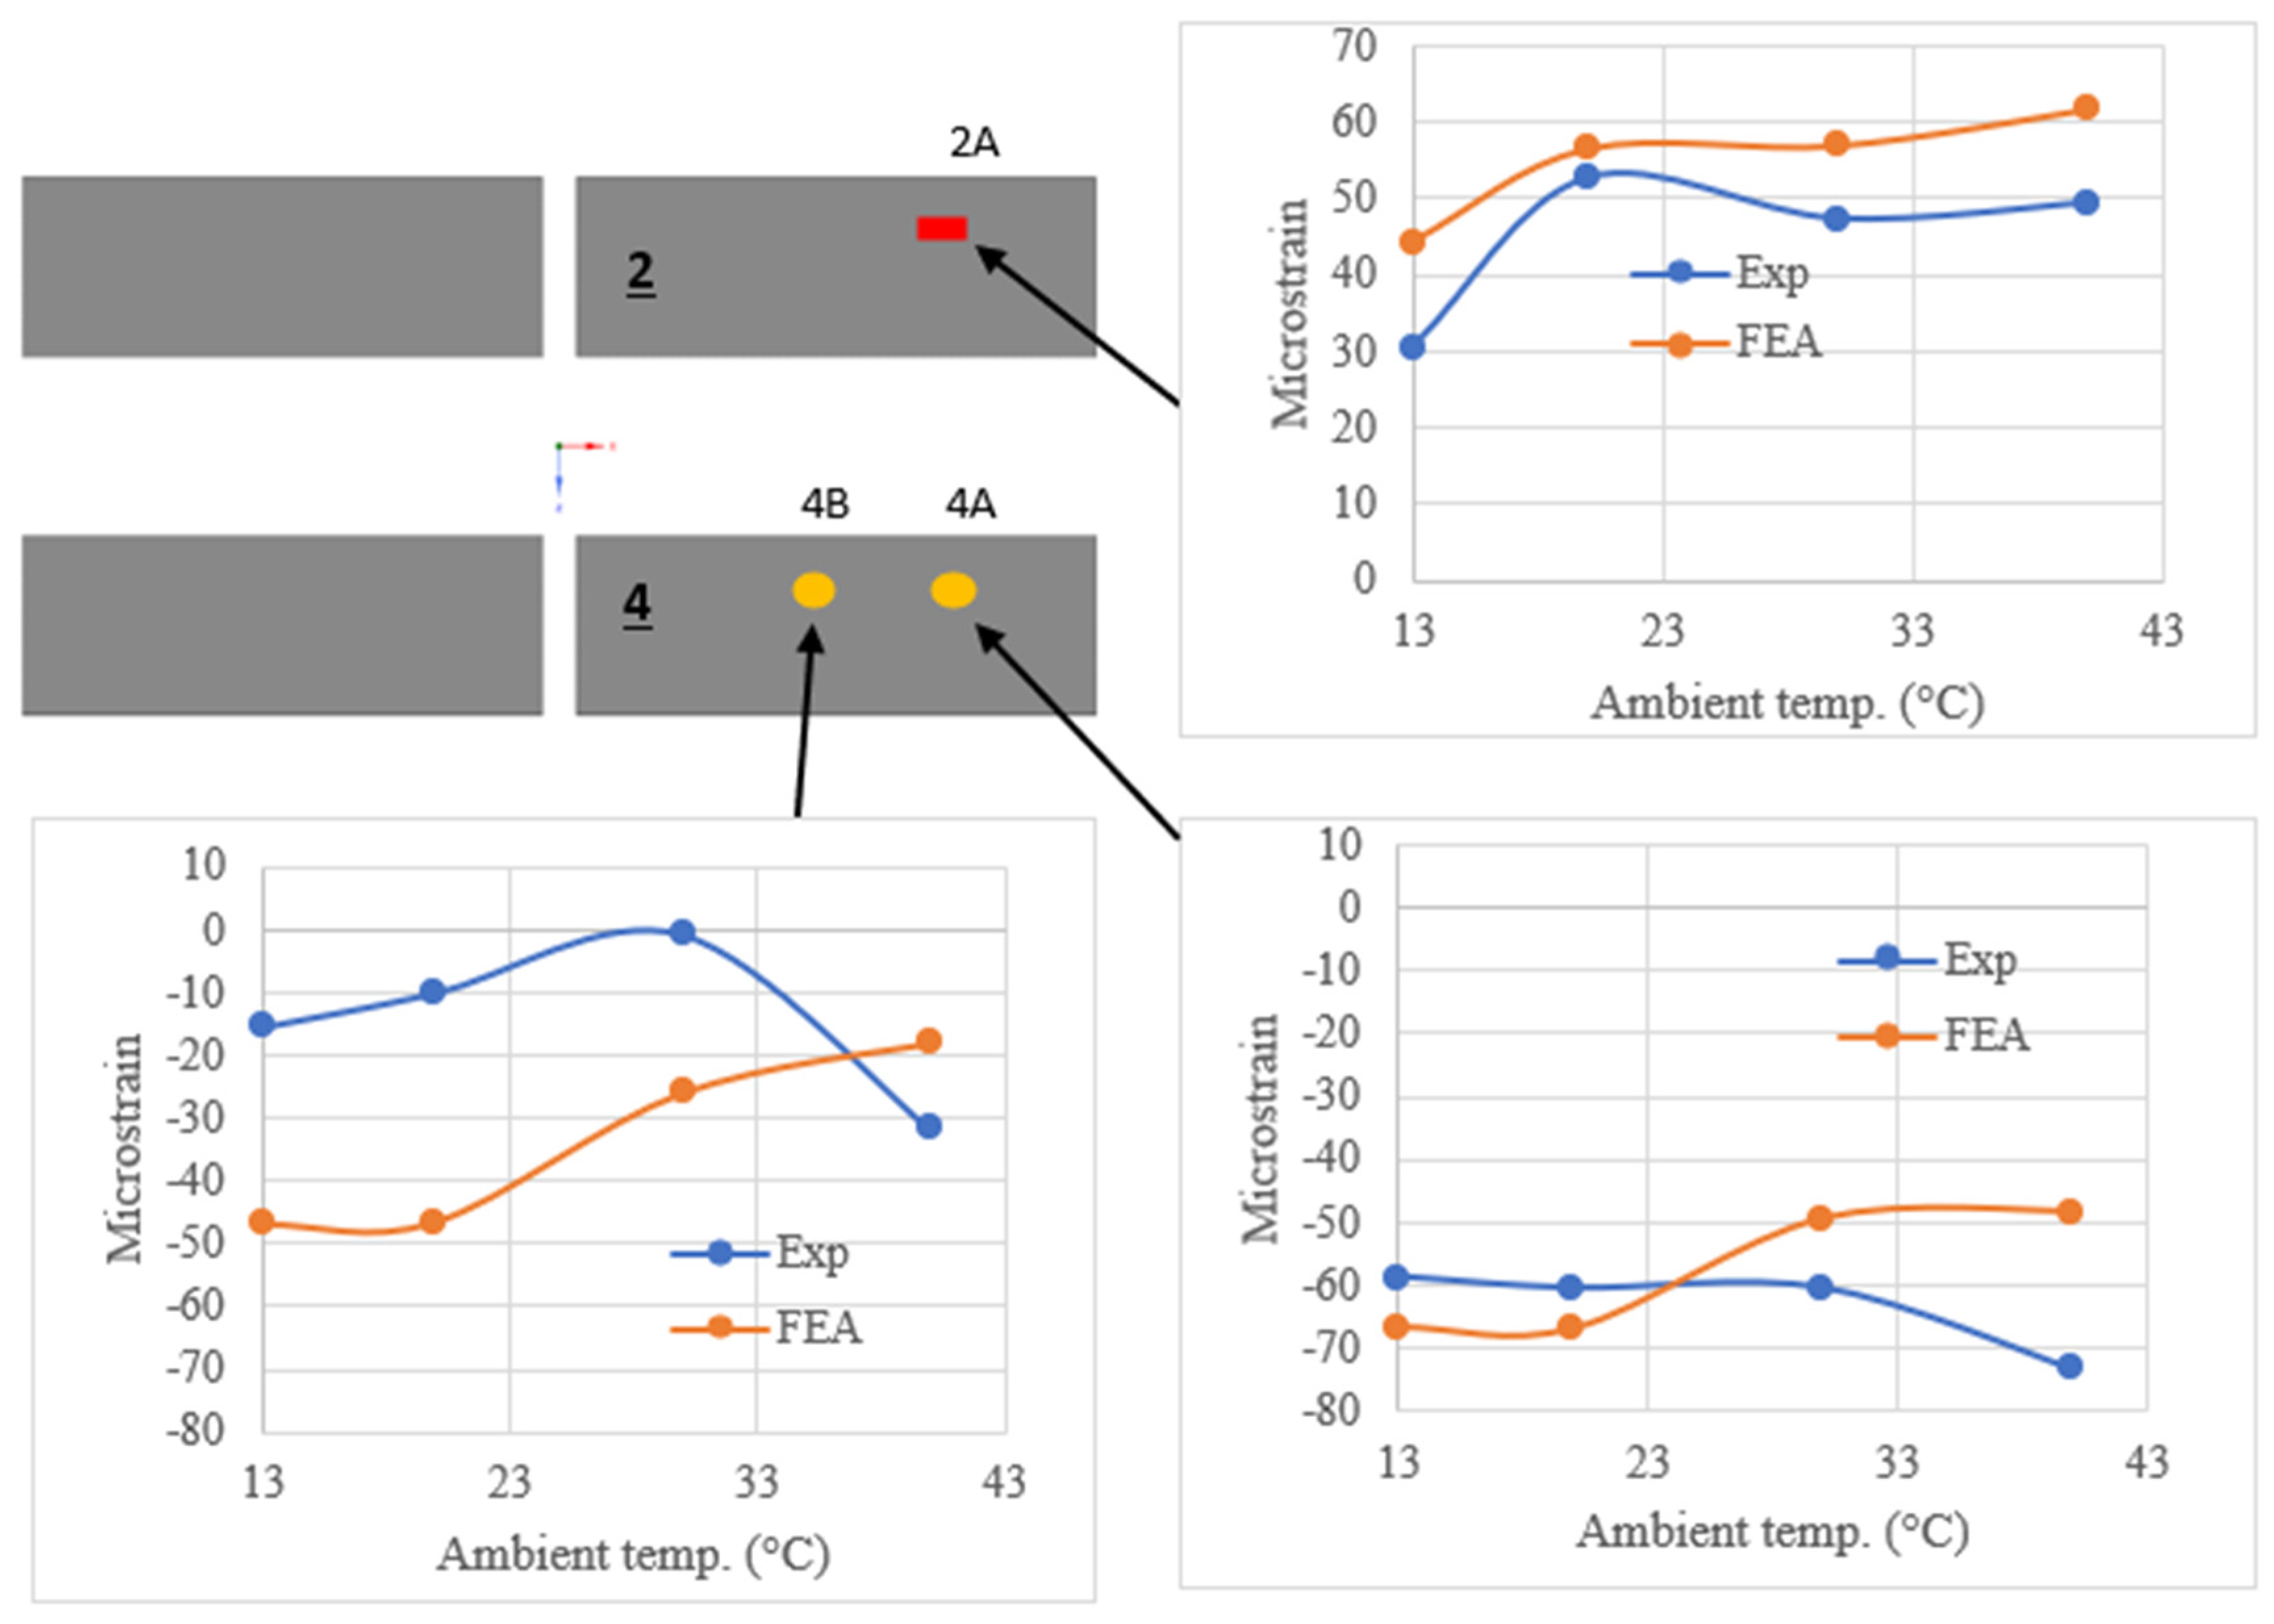
Ferrite strains in the complete pad were lower than those of the partial pad, because the coil has a lower thermal expansion than polyurethane.
Figure 17 shows the measured and predicted strains at 2B, 4B and 4C for the suspended energized pad. Again, a good correlation between the simulations and experiments was obtained, with a roughly linear increase in strain with ambient temperature. Compression was consistently measured on the bottom and tension on top. However, the added complexity of the coil resulted in some larger differences between the measured and predicted strains, compared to those of the partial pad. Simulated strains were higher across most sensor locations, with an average absolute percentage deviation of 30% and 27% at 13 °C ambient and 50 °C ambient, respectively. The RMSE was 24 με and 37 με at 13 °C and 50 °C, respectively. Strains in Ferrite 2 were predicted to increase from Location A to Location C; this was observed in the experiment as well. However, the maximum strain for Ferrite 4 was predicted to be in Location B, but the strain measured at 4B was lower than that of 4C. It is interesting to note that the slope of the strain vs. ambient temperature curve for 4B and 4C was similar in the experiment and simulation. Most of the simulation error appeared to be from an initial offset of measured strain at the lowest ambient temperature—this was most obvious at 4B.
9.3. Complete Pad Energized in Pavement
In general, there was a good correlation between the predicted and measured temperatures in the embedded pad, although the predictions were not as close as for the suspended pad.
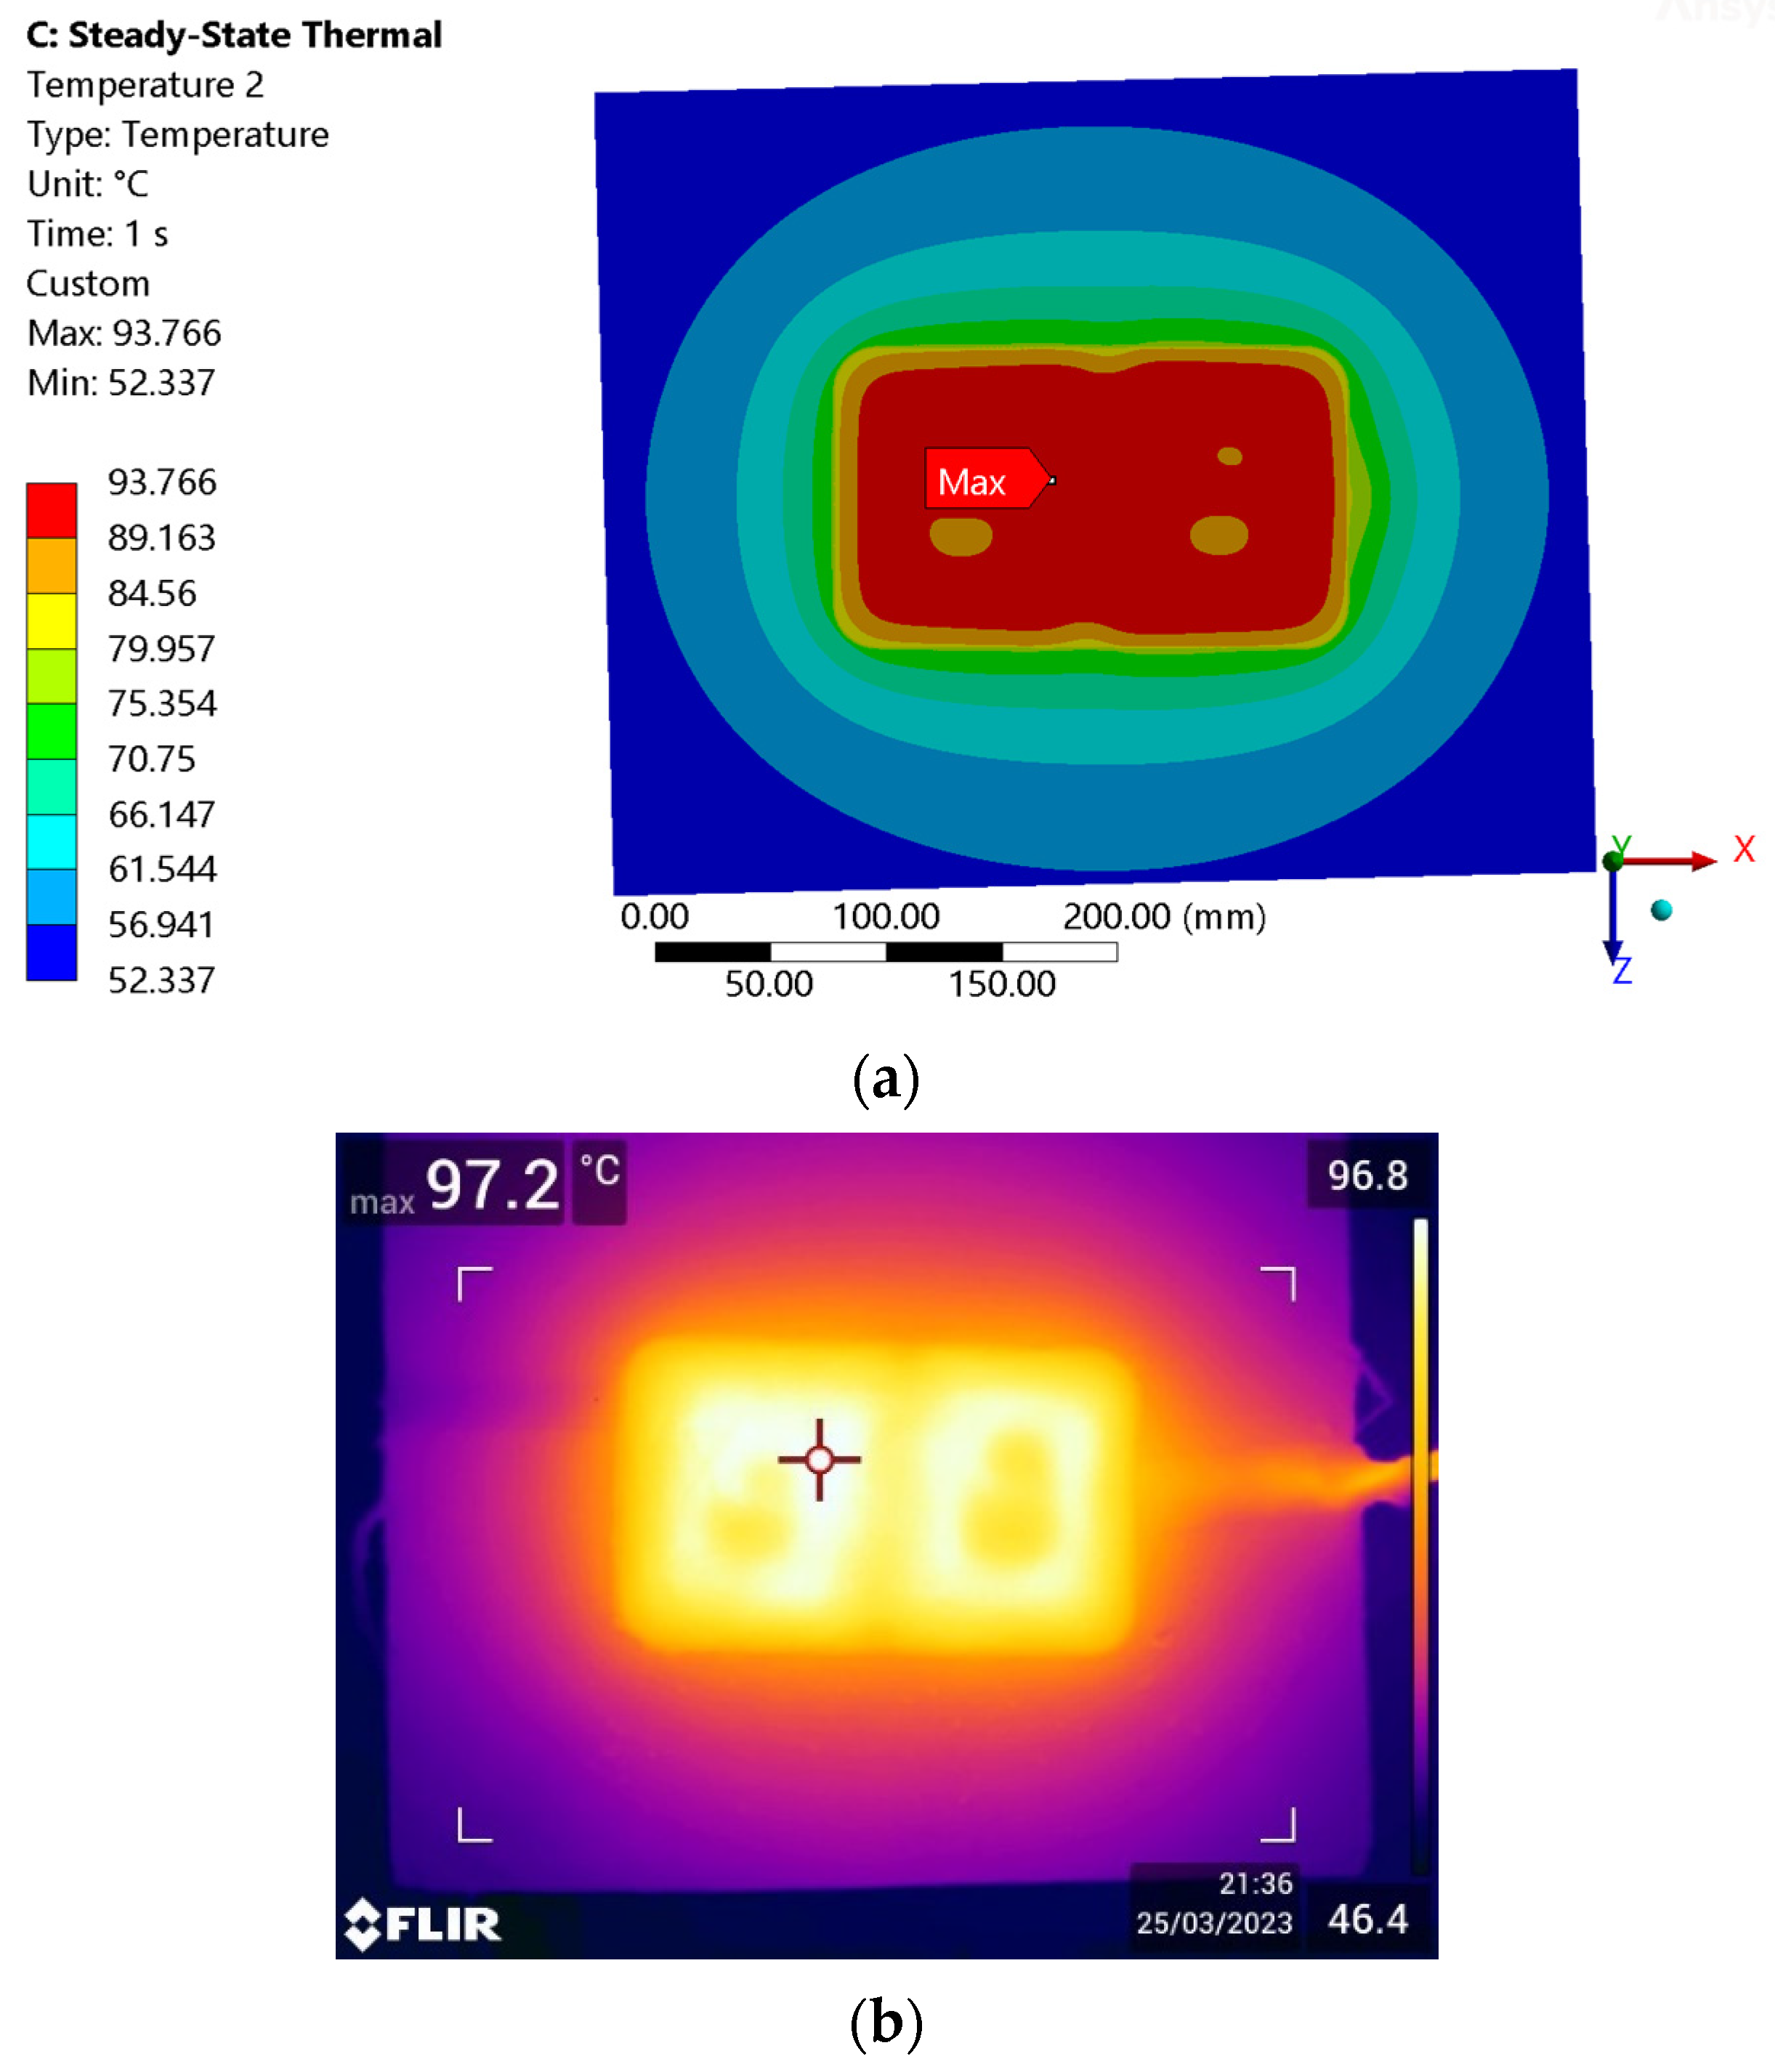
Figure 18 shows the temperature on the top surface of the pavement and the flush mounted pad, with an ambient temperature of 50 °C. The predicted and measured distributions were similar, with the highest temperature on the surface radiating outward in an elliptical manner. The maximum measured and predicted temperatures on the surface differed by 3.7%. There was also a good correlation at the middle of the coil, where temperatures increased linearly. However, the increase in coil temperature with ambient temperature was noticeably higher in the simulations. Because of this, coil temperature was underpredicted by 9% at 13 °C ambient temperature and predicted almost exactly at 50 °C ambient temperature to be 99.8 °C.
The temperatures on Ferrite 4 of the embedded pad are shown in
Figure 19. As with the thermal results on the top surface and the coil, there was higher deviation between the measured and predicted temperatures in the ferrite, compared to those of the suspended pad. The gradient of simulated ferrite temperature with an increasing ambient temperature was also slightly higher than the measured gradient. Hence, the correlation was better at higher temperatures. The average deviation between measured and predicted temperature was 27% at 13 °C ambient temperature and 9% at 50 °C ambient temperature. Despite these larger differences, the 1–2 °C increase in temperature from the outside (Location A) to the inside (Location C) was still observed in both the experiment and simulations.
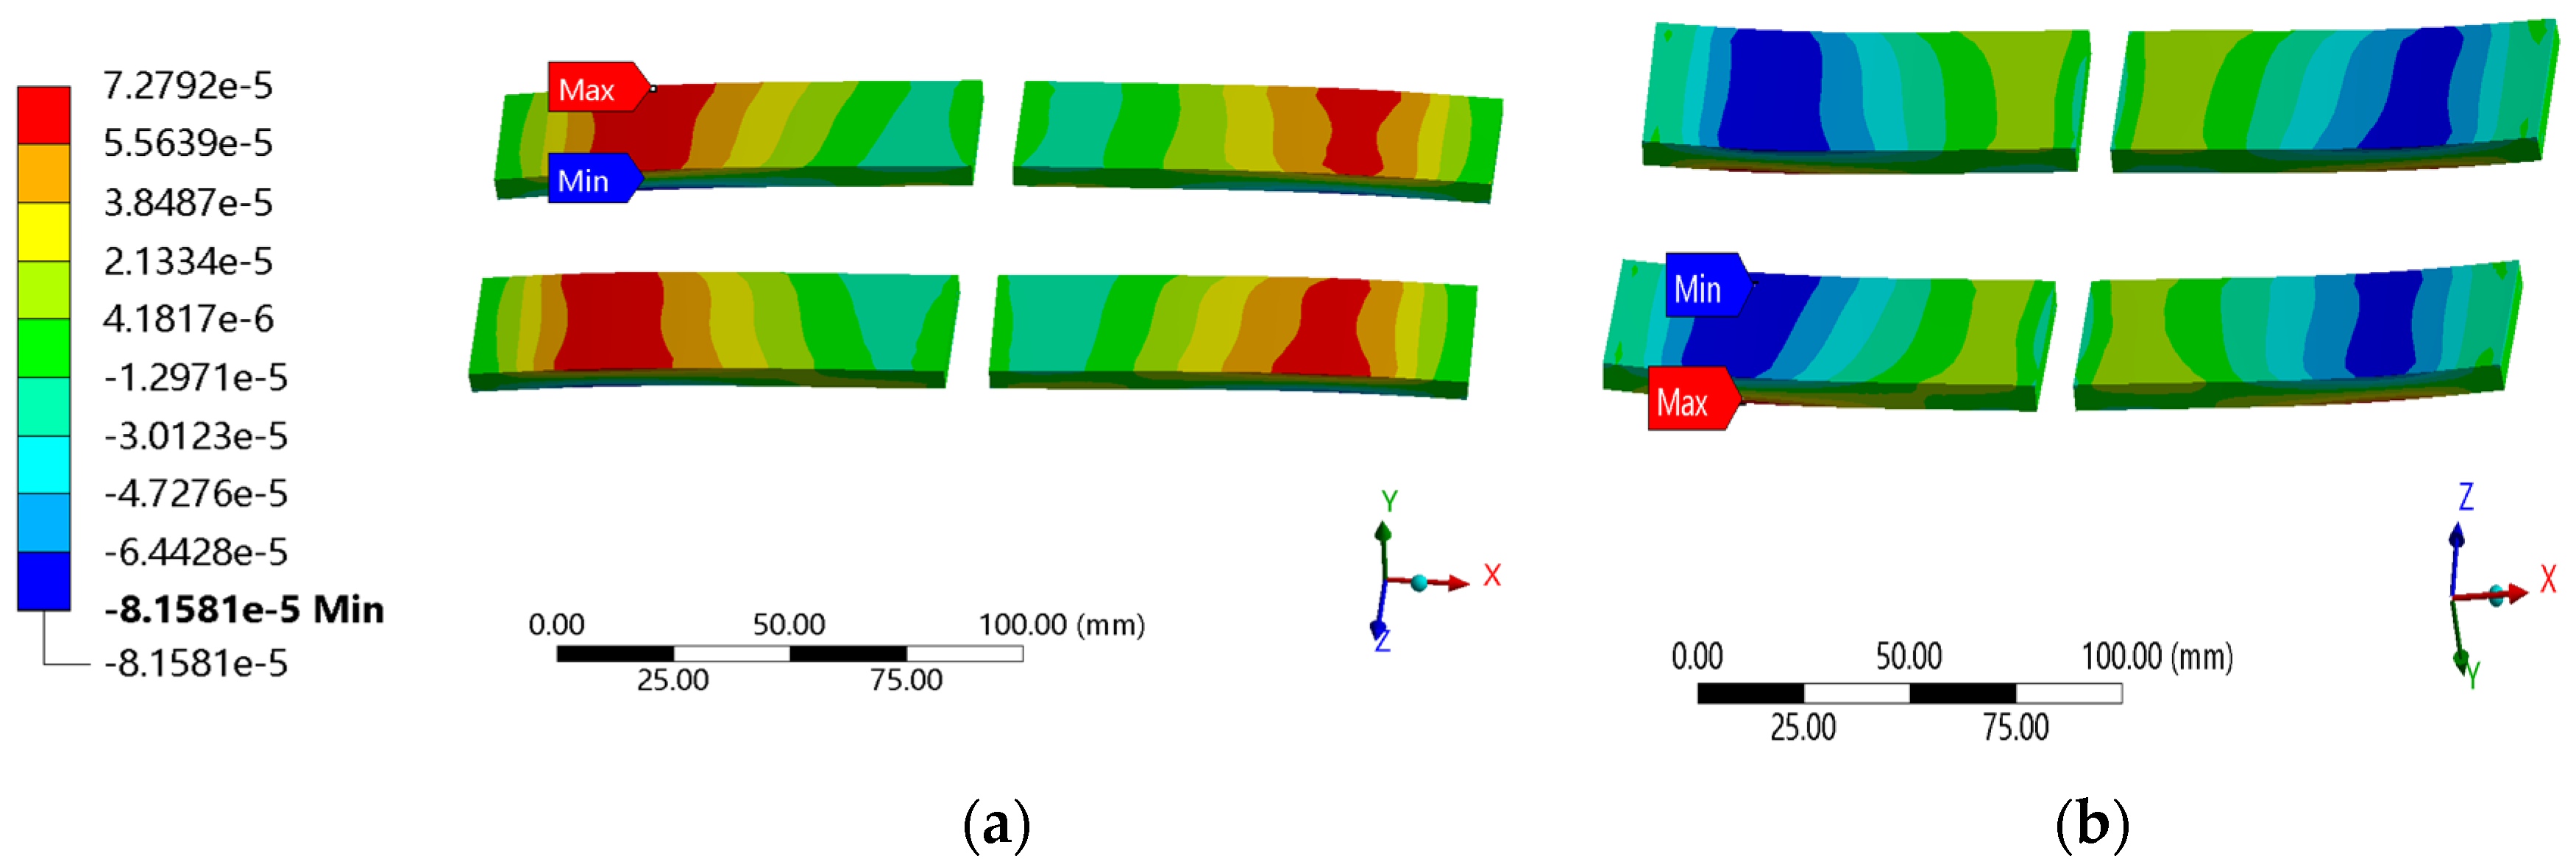
The FE-predicted X-strain distributions on the ferrites in the embedded pad are presented in
Figure 20. It is clear that the distribution of the embedded pad is significantly different to that of the unconstrained pad. Strains were still predominately in tension on top and compression on the bottom; however, because of the lateral constraints imposed by the pavement, the magnitude of the strains were highest closer to the outer edges (i.e., at Sensors 1A–4A).
A snapshot of the predicted and measured strains is presented in
Figure 21. Here, the results at 50 °C ambient temperature were omitted, due to irregularities in the recorded peaks of the FBG sensors, which may have occurred due to de-bonding between the pavement and pad. Looking at just the FEA results, it can be seen that, unlike all previous tests, strains did not increase linearly with temperature. The maximum predicted strains were similar in the embedded and suspended pads at 13 °C ambient temperature but, at 40 °C, the predicted strains of the embedded pad were around 50% lower. This non-linearity was due to the large change in the stiffness of embedment material with temperature, which significantly changed the pad boundary conditions. The presence of the pavement around the pad confined its thermal expansion, and therefore, slightly reduced the average magnitude of strains relative to the suspended condition. In general, there was a reasonable experimental–numerical correlation, in terms of both the change in strains with temperature and the change in strains along the ferrites. At 40 °C ambient temperature, the strain was underpredicted by 20% at 2A and overpredicted by 52% at 4A. The corresponding absolute errors were 12 με and 25 με, respectively. These are low, relative to the failure strain of ferrite, and the lowest out of all the experiments; however, the magnitudes of strain were also the lowest.
10. Discussion
10.1. Insights into Thermal–Mechanical Behaviour of Full-Scale Pads
The thermal–mechanical behaviour of the small-scale IPT pad investigated in this paper can offer valuable insights into the structural response of a full-scale pad to thermal loading. In partial and complete pads, an increase in temperature causes an upwards bow in the pad, because of the higher thermal expansion of the components in the top half of the pad. This overall deformation resulted in a predominantly bending stress on the ferrite, with tensile strains on the top surface and compression on the bottom. The sign of these strains is opposite to wheel induced strains, which are generally compressive on the top surface and tensile on the bottom, as numerically predicted and experimentally measured in Li et al. [
14]. This indicates that strains along the length of the ferrite cores from wheel loading and thermal loading are unlikely to add to each other, in the case of combined loading.
Based on the simulation and experimentation of the embedded pad, thermally induced strains in a full-scale pad are unlikely to increase linearly with temperature, due to the softening of the surrounding pavement. At an ambient temperature of 40 °C, thermally induced strains in the ferrite were still around 50% smaller than strains induced by an equivalent 50 kN wheel load [
14]. This suggests that wheel loading remains the critical load case to be analysed for the durability of the system. However, being well within the same order of magnitude, thermal strains cannot be discounted from the analysis.
10.2. Sources of Deviation between the Experiment and Simulations
Despite the generally good agreement between the experimental and numerical results, minor deviations were observed. The average percentage difference between the experimental and simulated strains is presented in
Table 2. As expected, there is a clear increase in deviation with increasing system complexity. Differences between the simulation and experimental results increased between the partial and complete pads. The increase in the RMSE at 13 °C ambient temperature was the most significant because of the offset of experimental strains on Ferrite 4 of the complete pad at 13 °C ambient temperature. Differences between the experimental and simulated strains increased further with the addition of the embedment material. The RMSE values at 30 °C and 40 °C ambient temperatures were lower than that of the unembedded pad; however, the embedded pad was the only one where the general trend between strain and ambient temperature did not match in the experiment and simulation.
A notable uncertainty in the FE model was the coefficient of thermal expansion (CTE) of the coil. As discussed in
Section 3.4, the coil was assumed to have the isotropic CTE of copper (1.67 × 10
−5/°C). The sensitivity of ferrite strains to this parameter was investigated by simulating the pad using the following transverse and axial CTE: 1.67 × 10
−6/°C, 1.67 × 10
−5/°C (original) and 5.01 × 10
−5/°C. Only one CTE (axial or transverse) was changed at a time. It is clear from the results,
Figure 22, that the numerically obtained strains in the ferrite are not sensitive to the transverse CTE of the coil; however, they are sensitive to axial CTE. This was because of the significant length of the wire: 2.8 m. A CTE of 1.67 × 10
−6/°C results in a much closer match to the experimental results. In the case of an un-infiltrated litz wire, the thermal expansion along its length would be non-linear and thus difficult to predict, especially because of the twisting of the individual wire strands. It is possible that the CTE of certain areas is even lower than that of copper, due to the localized buckling of the individual strands of wire.
From
Section 9.2 and
Section 9.3, it can be seen that the temperature underprediction in the ferrite was around 6 °C for the suspended pad and 7 °C to 10 °C for the embedded pad. The reduced accuracy of temperature and strain prediction after the pad embedment points to variations in the properties of the simulant pavement material. The larger underprediction in ferrite temperature was likely due to voids in the aggregate–epoxy composite, which reduced the composite’s thermal conductivity. Samples used for conductivity measurements did not have visible voids, because they were cast into a small mould which was easily shaken and vibrated by hand to release trapped air. Because the modulus of the pavement material was extremely sensitive to temperature between 20 °C and 60 °C, a large change in the stiffness of the pavement can result from a relatively small temperature error.
Inaccuracies in convection boundary conditions are likely to have contributed to some error in the temperature prediction of the embedded pad. The convection coefficients applied to the model were calculated using horizontal and vertical flat plate correlations, which assume that the plate is at a uniform temperature. This was roughly true for the suspended pad—its top surface varied between 74 °C (at the casing) and 93 °C; however, most of its area was above 85 °C. The flat plate correlations were less accurate for the pavement block. From
Figure 18, the temperature at the top of the pavement block varied from 52 °C to 94 °C. This may be the cause of the slightly gentler increase in the FE-predicted coil temperature versus ambient temperature graph, when compared to the experiments.
11. Conclusions
This paper presented an experimental and a finite element-based numerical methodology for analysing the structural response of IPT pads to thermally induced loading. The mechanical, thermal and mechanical properties of the materials within the pad were characterized at the system’s operating temperature range. A three-phase program was used to investigate the thermal–mechanical behaviour of IPT pads. First, a partial pad was heated to uniform temperatures, followed by the complete pad being energized under two conditions: suspended in air, and then embedded in pavement. Compensation of the stress-free temperature output of resistive strain gauges and FBG sensors allowed mechanical strain to be reliably obtained.
Under thermal loading, the pads experienced an upward bow due to the higher thermal expansion of the top half of the pads compared to the bottom half. This resulted in a bending moment on the ferrites, with tensile strains predicted and measured on the top surface, and compressive strains on the bottom surface. The embedment of the complete pad in pavement reduced ferrite strains due to the constraining boundary conditions around the system, resulting in lower strains compared to those induced through wheel loading.
When the complete pad was suspended in air and energized, there was excellent agreement between the measured and predicted temperatures, with deviation of within 1% for the maximum temperature on the pad surface and the coil, and an 8% deviation in ferrite temperature. There was reasonable agreement between measured and predicted ferrite strains, with an average overprediction of 27% and an RMSE of 37 με at 50 °C ambient. Based on the results of the partial pad, a portion of this error was attributed to uncertainty in the coefficient of thermal expansion along the litz wire. Differences between the FE model and experiment increased after the pad was embedded in pavement; however, RMSE remained small relative to the failure strain of ferrite. An RMSE of 25 με was obtained at 20 °C ambient temperature. The increase in experiment-to-simulation deviation after embedment was mainly attributed to the high sensitivity of the ‘pavement’ modulus to temperature. The experimental and validated finite element modelling approaches which were developed in this study could be applied to full-scale operational IPT pads to assess and improve their mechanical robustness.
Author Contributions
Conceptualization, K.-Y.L.; Methodology, K.-Y.L.; Validation, K.-Y.L.; Formal analysis, K.-Y.L.; Investigation, K.-Y.L.; Data curation, K.-Y.L.; Writing—original draft, K.-Y.L.; Writing—review & editing, T.A., S.B. and P.K.; Visualization, K.-Y.L.; Supervision, T.A., S.B. and P.K.; Funding acquisition, S.B. All authors have read and agreed to the published version of the manuscript.
Funding
This work was carried out with the financial support of the Ministry of Business, Innovation and Employment, New Zealand, under grant number 3714101.
Institutional Review Board Statement
Not applicable.
Informed Consent Statement
Not applicable.
Data Availability Statement
The data presented in this study is available on request from the corresponding author. The data is not publicly available due to privacy.
Conflicts of Interest
The authors declare no conflict of interest.
References
- Covic, G.A.; Boys, J.T. Modern Trends in Inductive Power Transfer for Transportation Applications. IEEE J. Emerg. Sel. Top. Power Electron. 2013, 1, 28–41. [Google Scholar] [CrossRef]
- Cirimele, V.; Diana, M.; Freschi, F.; Mitolo, M. Inductive Power Transfer for Automotive Applications: State-of-the-Art and Future Trends. IEEE Trans. Ind. Appl. 2018, 54, 4069–4079. [Google Scholar] [CrossRef]
- Choi, S.Y.; Gu, B.W.; Jeong, S.Y.; Rim, C.T. Advances in Wireless Power Transfer Systems for Roadway-Powered Electric Vehicles. IEEE J. Emerg. Sel. Top. Power Electron. 2015, 3, 18–36. [Google Scholar] [CrossRef]
- Budhia, M.; Boys, J.T.; Covic, G.A.; Huang, C.Y. Development of a single-sided flux magnetic coupler for electric vehicle IPT charging systems. IEEE Trans. Ind. Electron. 2013, 60, 318–328. [Google Scholar] [CrossRef]
- Chen, F.; Taylor, N.; Kringos, N. Electrification of roads: Opportunities and challenges. Appl. Energy 2015, 150, 109–119. [Google Scholar] [CrossRef]
- Amirpour, M.; Kim, S.; Battley, M.P.; Kelly, P.; Bickerton, S.; Covic, G. Coupled electromagnetic-thermal analysis of roadway inductive power transfer pads within a model pavement. Appl. Therm. Eng. 2021, 189, 116710. [Google Scholar] [CrossRef]
- Kim, S.; Amirpour, M.; Dharmakeerthi, T.; Barsari, V.Z.; Covic, G.; Bickerton, S.; Thrimawithana, D. Thermal Evaluation of an Inductive Power Transfer Pad for Charging Electric Vehicles. IEEE Trans. Ind. Electron. 2021, 0046, 314–322. [Google Scholar] [CrossRef]
- Suhir, E. Predictive analytical thermal stress modeling in electronics and photonics. Appl. Mech. Rev. 2009, 62, 040801. [Google Scholar] [CrossRef]
- Alsayegh, M.; Saifo, M.; Clemens, M.; Schmuelling, B. Magnetic and Thermal Coupled Field Analysis of Wireless Charging Systems for Electric Vehicles. IEEE Trans. Magn. 2019, 55, 1–4. [Google Scholar]
- Zimmer, S.; Helwig, M.; Winkler, A.; Modler, N. One-Way vs. Two-Way Coupled Simulation: Investigation of Thermal Management of Wireless Power Transfer Modules for Electric Vehicles. In 2022 Wireless Power Week (WPW); IEEE Press: New York, NY, USA, 2022; pp. 84–89. [Google Scholar]
- Rasekh, N.; Dabiri, S.; Rasekh, N.; Mirsalim, M.; Bahiraei, M. Thermal analysis and electromagnetic characteristics of three single-sided flux pads for wireless power transfer. J. Clean. Prod. 2020, 243, 118561. [Google Scholar] [CrossRef]
- Hwang, K.; Chun, S.; Yoon, U.; Lee, M.; Ahn, S. Thermal Analysis for Temperature Robust Wireless Power Transfer Systems. In 2013 IEEE Wirel. Power Transfer WPT; IEEE Press: New York, NY, USA, 2013; pp. 52–55. [Google Scholar]
- Wojda, R.; Galigekere, V.P.; Pries, J.; Onar, O. Thermal Analysis of Wireless Power Transfer Coils for Dynamic Wireless Electric Vehicle Charging. In 2020 IEEE Transportation Electrification Conference & Expo (ITEC); IEEE Press: New York, NY, USA, 2020; pp. 835–838. [Google Scholar]
- Li, K.-Y.; Piefke, C.; Allen, T.; Bickerton, S.; Abdoli, H.; Kelly, P. Computational modelling and experimental validation of structural response of ferrite core within road embedded IPT pad under mechanical loading. Structures 2022, 46, 1407–1421. [Google Scholar] [CrossRef]
- Piefke, C.; Bickerton, S.; Kelly, P.; Allen, T. Structural and Thermo-Mechanical Performance of Fragile Components Integrated in IPT Pads for Electric Roadway Applications; University of Auckland: Auckland, New Zealand, 2023. [Google Scholar]
- Chen, F.; Balieu, R.; Córdoba, E.; Kringos, N. Towards an understanding of the structural performance of future electrified roads: A finite element simulation study. Int. J. Pavement Eng. 2019, 20, 204–215. [Google Scholar] [CrossRef]
- Chen, F.; Coronado, C.F.; Balieu, R.; Kringos, N. Structural performance of electrified roads: A computational analysis. J. Clean. Prod. 2018, 195, 1338–1349. [Google Scholar] [CrossRef]
- Ceravolo, R.; Miraglia, G.; Surace, C.; Fragonara, L.Z. A Computational Methodology for Assessing the Time-Dependent Structural Performance of Electric Road Infrastructures. Comput. Civ. Infrastruct. Eng. 2016, 31, 701–716. [Google Scholar] [CrossRef]
- Li, K.-Y.; Piefke, C.; Allen, T.; Bickerton, S.; Kelly, P. Finite-Element Modelling and Experimental Validation Of A Double-D Pad Under Wheel Loading. In 2022 Wireless Power Week (WPW); IEEE Press: New York, NY, USA, 2022; pp. 470–475. [Google Scholar]
- ASTM International. Standard Test Method for Flexural Strength of Advanced Ceramics at Ambient; ASTM International: West Conshohocken, PA, USA, 1996; Volume 94, pp. 1–15. [Google Scholar]
- Moinuddin, M.K.; Murthy, S.R. Elastic behaviour of Mn Zn ferrites. J. Alloys Compd. 1993, 194, 105–107. [Google Scholar] [CrossRef]
- Tech Note TN-513-1: Measurement of Thermal Expansion Coefficient Using Strain Gauges. In Micro-Measurements; Vishay Precision Group: Raleigh, NC, USA, 2010; pp. 119–129.
- Tokyo Measuring Instruments Laboratory Co., Ltd. Strain Gauge Test Data for Gauge Type: FLAB-3-350-11, 3rd ed.; Tokyo Measuring Instruments Laboratory: Tokyo, Japan, 2018. [Google Scholar]
- Kalra, G.R.; Pearce, M.G.S.; Kim, S.; Thrimawithana, D.J.; Covic, G.A. A Power Loss Measurement Technique for Inductive Power Transfer Magnetic Couplers. IEEE J. Emerg. Sel. Top. Ind. Electron. 2020, 1, 113–122. [Google Scholar] [CrossRef]
- Ansys Inc. Ansys Maxwell; ANSYS Inc.: Canonsburg, PA, USA, 2022. [Google Scholar]
- ASTM D638-14; Materials. Standard Test Method for Tensile Properties of Plastics. American Society for Testing and Materials: West Conshohocken, PA, USA, 2014.
- Electrolube. Technical Data Sheet: UR5806 Polyurethane Resin. Available online: https://electrolube.com/product/ur5608tough-high-hardness-polyurethane-resin/ (accessed on 1 January 2019).
- EOS GmbH. Product Information: PA 2200. Available online: https://www.sculpteo.com/static/0.30.0-49/documents/materials/polyamide_PA2200/PA2200_Product_information_03-10_en.pdf (accessed on 1 February 2023).
- Simpson, N.; Wrobel, R.; Mellor, P.H. Estimation of equivalent thermal parameters of impregnated electrical windings. IEEE Trans. Ind. Appl. 2013, 49, 2505–2515. [Google Scholar] [CrossRef]
- Hahn, T.A. Thermal Expansion of Copper from 20 to 800 K—Standard Reference Material 736. J. Appl. Phys. 1970, 41, 5096–5101. [Google Scholar] [CrossRef]
- Ansys Inc. Ansys (Mechanical Application); ANSYS Inc.: Canonsburg, PA, USA, 2022. [Google Scholar]
- Wilson, A.J.C. The thermal expansion of aluminium from 0 to 650 °C. Proc. Phys. Soc. 1941, 53, 235–244. [Google Scholar] [CrossRef]
- ASTM D695; Standard Test Method for Compressive Properties of Rigid Plastics. American Society for Testing and Materials: West Conshohocken, PA, USA, 2015.
- Rao, Y.-J. Fiber Bragg Grating Sensors: Principles and Applications. In Optical Fiber Sensor Technology, 1st ed.; Grattan, K.T.V., Meggitt, B.T., Eds.; Springer: Boston, MA, USA, 1998; pp. 355–379. [Google Scholar]
- FBGS International NV. Draw Tower Gratings (DTG®). Available online: https://fbgs.com/components/draw-tower-gratings-dtgs/ (accessed on 20 October 2021).
- Her, S.-C.; Huang, S.Y. Thermal Strain Measured by Fiber Bragg Grating Sensors. Sens. Mater. 2016, 28, 939–946. [Google Scholar]
- Cengel, Y.; Cimbala, J.; Turner, R. Fundamentals of Thermal-Fluid Sciences (SI Units), 3rd ed.; McGraw Hill: New York, NY, USA, 2008. [Google Scholar]
- Yu, H.; Xu, G.; Shen, X.; Yan, X.; Cheng, C. Low infrared emissivity of polyurethane/Cu composite coatings. Appl. Surf. Sci. 2009, 255, 6077–6081. [Google Scholar] [CrossRef]
- Steiner, F.; Bleicher, F.; Klingenbrunner, M. Emissivity Factor of Thermoplastic Materials for a Robot Bending Process. In Annals of DAAAM & Proceedings; DAAAM International: Vienna, Austria, 2016; pp. 664–670. [Google Scholar]
- Liu, Z.H.; Ban, G.D.; Ye, S.T.; Liu, W.Y.; Liu, N.; Tao, R. Infrared emissivity properties of infrared stealth coatings prepared by water-based technologies. Opt. Mater. Express 2016, 6, 3716. [Google Scholar] [CrossRef]
Figure 1.
Exploded view of double-D (DD) IPT pad. Outer dimensions: 225 × 133 × 31.6 mm.
Figure 1.
Exploded view of double-D (DD) IPT pad. Outer dimensions: 225 × 133 × 31.6 mm.
Figure 2.
(a) Stress-free thermal strain output of six ferrite samples, SS400 (reference) and the lead wire, (b) calculated CTE of ferrite vs. temperature.
Figure 2.
(a) Stress-free thermal strain output of six ferrite samples, SS400 (reference) and the lead wire, (b) calculated CTE of ferrite vs. temperature.
Figure 3.
Tensile stress–strain curve for UR5608 at various temperatures.
Figure 3.
Tensile stress–strain curve for UR5608 at various temperatures.
Figure 4.
(a) CTE and (b) modulus of PA2200. An average of three specimens was used.
Figure 4.
(a) CTE and (b) modulus of PA2200. An average of three specimens was used.
Figure 5.
(a) Stress–strain curve and (b) compressive modulus of the aggregate–epoxy composite at different temperatures.
Figure 5.
(a) Stress–strain curve and (b) compressive modulus of the aggregate–epoxy composite at different temperatures.
Figure 6.
Thermal expansion vs. temperature of the aggregate–epoxy sample.
Figure 6.
Thermal expansion vs. temperature of the aggregate–epoxy sample.
Figure 7.
Schematic of the instrumentation on the ferrites of the pads. Ferrites were numbered 1 to 4, as indicated by the bold underlined numbers. Sensor locations along each ferrite are indicated by letters A, B or C. The side of the ferrite the sensors are on (i.e., top or bottom) is indicated by colour. The type of sensor is indicated by shape.
Figure 8.
Typical wavelength shift (ΔλB-T) of a free FBG and an FBG attached to ferrite due to changes in temperature.
Figure 8.
Typical wavelength shift (ΔλB-T) of a free FBG and an FBG attached to ferrite due to changes in temperature.
Figure 9.
Complete pad, potted and machined flat.
Figure 9.
Complete pad, potted and machined flat.
Figure 10.
Pad placed face-down in the wooden enclosure before the epoxy–aggregate mixture was poured in.
Figure 10.
Pad placed face-down in the wooden enclosure before the epoxy–aggregate mixture was poured in.
Figure 11.
Experimental setup for the energized pad suspended in the environmental chamber.
Figure 11.
Experimental setup for the energized pad suspended in the environmental chamber.
Figure 12.
Experimental setup for the embedded pad energized in the environmental chamber.
Figure 12.
Experimental setup for the embedded pad energized in the environmental chamber.
Figure 13.
Exploded mesh of the Complete Pad embedded in simulant pavement material. Dimensions in mm.
Figure 13.
Exploded mesh of the Complete Pad embedded in simulant pavement material. Dimensions in mm.
Figure 14.
FE-predicted X-strain in the ferrite cores of the partial pad at 80 °C. (a) Top view; (b) bottom view.
Figure 14.
FE-predicted X-strain in the ferrite cores of the partial pad at 80 °C. (a) Top view; (b) bottom view.
Figure 15.
Comparison of FE predicted and measured strains on Ferrite 2 and 4 of the partial pad.
Figure 15.
Comparison of FE predicted and measured strains on Ferrite 2 and 4 of the partial pad.
Figure 16.
Comparison of measured and predicted temperatures on Ferrite 4.
Figure 16.
Comparison of measured and predicted temperatures on Ferrite 4.
Figure 17.
Comparison between measured and predicted strains on Ferrite 2 of the pavement-embedded pad.
Figure 17.
Comparison between measured and predicted strains on Ferrite 2 of the pavement-embedded pad.
Figure 18.
(a) FE-predicted surface temperature of embedded pad inside environment at 50 °C. (b) Temperature measurement, using thermal camera, of the top pavement surface under the same conditions.
Figure 18.
(a) FE-predicted surface temperature of embedded pad inside environment at 50 °C. (b) Temperature measurement, using thermal camera, of the top pavement surface under the same conditions.
Figure 19.
Comparison of measured and predicted temperatures on Ferrite 4 when the pad is embedded.
Figure 19.
Comparison of measured and predicted temperatures on Ferrite 4 when the pad is embedded.
Figure 20.
FE-predicted X-strain distributions on ferrites in the embedded pad at 20 °C ambient temperature. (a) Top view. (b) bottom view.
Figure 20.
FE-predicted X-strain distributions on ferrites in the embedded pad at 20 °C ambient temperature. (a) Top view. (b) bottom view.
Figure 21.
Comparison between measured and predicted strains on Ferrite 1 of the pavement-embedded pad.
Figure 21.
Comparison between measured and predicted strains on Ferrite 1 of the pavement-embedded pad.
Figure 22.
Sensitivity of simulated strain in the ferrite core at 1B to the axial and transverse coefficient of thermal expansion (CTE) of coil. Strain measured at 1B is also shown (dotted line).
Figure 22.
Sensitivity of simulated strain in the ferrite core at 1B to the axial and transverse coefficient of thermal expansion (CTE) of coil. Strain measured at 1B is also shown (dotted line).
Table 1.
Transversely isotropic properties of litz wire (X-direction is along the wire).
Table 1.
Transversely isotropic properties of litz wire (X-direction is along the wire).
| Ex | Ey = Ez | Gxy = Gxz | Gyz | ρxy = ρxz |
|---|
| 9100 MPa | 155 MPa | 42.4 MPa | 41.2 MPa | 0.40 |
Table 2.
Average absolute % difference between the experimental and simulated strains, and the RMSE of the simulations for the partial and complete pads under various thermal loads.
Table 2.
Average absolute % difference between the experimental and simulated strains, and the RMSE of the simulations for the partial and complete pads under various thermal loads.
Partial pad
Pad without wires | Oven temp. | 35 °C | 50 °C | 65 °C | 80 °C |
| Abs % diff | 19% | 5% | 6% | 8% |
| RMSE (με) | 10.4 | 15.0 | 19.5 | 29.8 |
Complete pad
Suspended | Ambient temp. | 20 °C | 30 °C | 40 °C | 50 °C |
| Abs % diff | 27% | 25% | 30% | 27% |
| RMSE (με) | 28.1 | 31.1 | 36.6 | 37.3 |
Complete pad
Embedded | Ambient temp. | 13 °C | 20 °C | 30 °C | 40 °C |
| Abs % diff | 37% | 32% | 46% | 49% |
| RMSE (με) | 20.4 | 21.6 | 16.9 | 17.9 |
| Disclaimer/Publisher’s Note: The statements, opinions and data contained in all publications are solely those of the individual author(s) and contributor(s) and not of MDPI and/or the editor(s). MDPI and/or the editor(s) disclaim responsibility for any injury to people or property resulting from any ideas, methods, instructions or products referred to in the content. |
© 2023 by the authors. Licensee MDPI, Basel, Switzerland. This article is an open access article distributed under the terms and conditions of the Creative Commons Attribution (CC BY) license (https://creativecommons.org/licenses/by/4.0/).


