Article

Numerical Modelling Study of Subsurface Drainage of Permeable Friction Course Considering Road Geometric Designs

by
Thi My Dung Huynh
1,
Van Hiep Huynh
1,
Minh Triet Pham
2,
Kyra Kamille A. Toledo
3 and
Tan Hung Nguyen
4,*
1
Department of Civil Engineering, School of Engineering and Technology, Tra Vinh University, Tra Vinh 87000, Vietnam
2
Akselos S.A., Ho Chi Minh City 700000, Vietnam
3
Faculty of Engineering, University of Santo Tomas, Manila 1008, Philippines
4
Faculty of Civil Engineering, Can Tho University of Technology, Can Tho 900000, Vietnam
*
Author to whom correspondence should be addressed.
Appl. Sci. 2023, 13(22), 12428; https://doi.org/10.3390/app132212428
Submission received: 17 September 2023 / Revised: 21 October 2023 / Accepted: 7 November 2023 / Published: 17 November 2023
(This article belongs to the Special Issue Sustainability in Asphalt Pavement and Road Construction)

Abstract

:
This study aimed to evaluate the subsurface drainage of a permeable friction course (PFC) via two-dimensional finite element analysis. To achieve the scope, PFCs with equivalent water flow paths of length values of 10, 15, 20, and 30 m and slope values of 0.5%, 2%, 4%, 6%, and 8% were modelled based on FEniCS and implemented entirely in Python programing language to extract the time for surface ponding according to a range of rainfall intensities. The results show that when the rainfall intensity and the length of equivalent water flow path of the PFC rose, the time for surface ponding decreased. For instance, with a rainfall intensity of 10 mm/h and a slope of 0.5%, when the length of equivalent water flow path increased by 20 m, the time for surface ponding dropped by 21 min. Moreover, when the slope of the equivalent water flow path and the thickness of the PFC increased, the time for surface ponding increased. For instance, with a rainfall intensity of 10 mm/h, and a PFC with an equivalent length of 10 m, when the slope increased by 16 times, the time for surface ponding increased more than two times. The current study highlights that the thickness of the PFC has the most influence on subsurface drainage. The findings of this study indicate that at high rainfall intensities, the subsurface drainage of a PFC is not sensitive to its geometric design. Further experimental investigations are needed to evaluate and validate the subsurface drainage of a PFC considering permeability, rutting, and environmental factors.

1. Introduction

Several permeable friction courses (PFCs) have been widely used in permeable pavement systems to control rainwater quantity and quality during urbanization [1,2,3]. A PFC is a porous asphalt layer that is laid on the surface layer of a conventional impermeable asphalt pavement [4]. Porous asphalt is an asphalt material that is designed to have a high porosity so that water can infiltrate its pores and drain out vertically, laterally, or both. Hence, a PFC is used as a tool to drain out water and has the potential to reduce the peak flow of pollutants in rainwater [5,6,7].
Literature studies have reported that the properties of porous asphalt material (such as porosity and permeability) have a strong effect on the drainage of a PFC. In addition, the geometric design of the pavement, such as the longitudinal slope (Sy), cross slope (Sx), length (L), width (W), and thickness (T), also has remarkable drainage effects [8,9]. When using PFCs for stormwater management, the rainfall intensity (I) is an important factor that should be considered. To date, several studies have investigated the effects of these factors on the drainage of a PFC pavement. To achieve this, three methods have been used: the rainfall simulator experiment, laboratory experiment, and finite element analysis. The finite element analysis is a key method for observation because of its obvious benefits such as saving cost, saving time, and the high accuracy of the results [10].
Tan et al. [8] utilized a finite element program called Seep3D to observe the effect of pavement geometric design, including cross slope, longitudinal slope, thickness, width (Sx, Sy, T, and W), and rainfall intensity (I), on the drainage performance of a pavement. In their study, the permeability (k) of the porous asphalt was assumed to be 20 mm/s. The allowable rainfall intensity, which was the maximum rainfall intensity that could be applied over the pavement without surface ponding, was extracted according to the different values of the pavement geometric design. From the results of the study, a curve consisting of the ratio of the pavement thickness to the width (T/W) and the maximum allowable rainfall intensity was plotted. The outcome indicated that at a high value of cross slope (Sx), the longitudinal slope (Sy) did not seem to have any effect on the drainage of the pavement. In addition, the study found that a higher ratio of thickness to width (T/W) resulted in a lower effect on the longitudinal slope (Sy) of the drainage performance. In another study, Liu et al. [11] proposed a computational finite element model to predict the flow of water in a PFC during rainfall. The flow of water in the body of the PFC was estimated by a two-dimensional flow using the equation of diffusion, whereas the flow of water over the surface of the PFC was estimated by a three-dimensional flow using the equation of Richard. The study highlighted that the thickness (T) of the PFC pavement played an important role on the effect of the time for surface ponding. However, the thickness (T) of the PFC had a less significant effect on the phreatic line in its body.
In the permeable pavement design guide, the time at which surface ponding is initiated, known as the time for surface ponding (tp), is a key factor in evaluating the peak flow of drainage in urban areas [12,13]. In low impact development techniques, tp is called the delay time of peak flow, one of the typical factors for permeable pavement system design [14]. For transportation construction, it is also a critical factor for safety movements [15]. To date, there have not been many studies focused on the time for surface ponding of a PFC subjected to rainfall by finite element analysis. Rashid et al. [15] investigated the time for surface ponding of a PFC using a finite element analysis program called Flow 3D. The PFC was designed with a hexagonal modular pavement system for storage of water from rainfall. The results demonstrated that the time for surface ponding was obviously dependent on the rainfall intensity. Moreover, the hydrological performance of the hexagonal modular pavement system was affected by its permeability. The results illustrated that the hexagonal modular pavement system can be used as an effective tool in stormwater management by increasing the water storage capacity. Nguyen and Ahn [16] observed the time for surface ponding for a PFC using finite element analysis. In their study, the PFC had different lengths and slopes subjected to various rainfall intensities which were modelled and analyzed by the SVFlux 2D program. In the study, a series of analyses was examined using water flow length values of 10, 15, 20, and 30 m and slope values of 0.5%, 2%, 4%, 6%, and 8%. To determine the time for surface ponding, the PFCs were subjected to a series of rainfall intensities ranging from 10 to 120 mm/h. The results revealed that the time for surface ponding decreased when either the PFC length or rainfall intensity, or both, increased. Nevertheless, the time for surface ponding increased when the slope increased. The study provided a series of design charts to estimate the time for surface ponding for a PFC at given rainfall intensities. Recently, Hossam et al. [17] developed a three-dimensional finite element model to evaluate the impacts of PFC thickness, permeability, rainfall intensity, and traffic volume on seepage. From the analysis results, they implied that the considered factors, such as rainfall intensity, PFC thickness, and traffic volume, have a high impact on PFC seepage characteristics, except for PFC permeability. The implication was made because the PFC designed with porous asphalt, whose air void content was 16%, resulted in good drainage performance.
Previous studies have stated that the drainage performance of PFC is influenced by rainfall intensity, geometric design (e.g., cross slope, longitudinal slope, width, length), and its properties (e.g., air void, permeability). The time for surface ponding is a critical factor that has a significant effect on the hydrologic design for a PFC. Until recently, there has been little interest in the time for surface ponding of PFCs subjected to rainfall intensity. Thus, the purpose of the current study is to develop a finite element model to determine the time for surface ponding of a PFC subjected to rainfall intensity. Furthermore, this study examined the time for surface ponding of a PFC obtained from different water flow paths and subjected to different rainfall intensities. Based on the results, the subsurface drainage performance of the PFC was evaluated and discussed.

2. Subsurface Drainage and Time for Surface Ponding of a PFC

Generally, at a dry initial condition and constant rainfall intensity, the drainage of PFC for rainwater consists of two components: subsurface drainage and surface drainage. First, the rainwater infiltrates into the pores of the PFC and then drains out laterally through the side of the PFC, this drainage is known as subsurface drainage. The subsurface drainage of a PFC has a water shape in the PFC body that is laminar or between laminar and turbulent [9,18]. The head of the water flow (H) in a PFC body is captured in Figure 1. This value is a function of variations such as rainfall intensity, time of rainfall, permeability, and the geometric design of the PFC.
Second, during the rainfall process, as the pore of the PFC is filled with rainwater, the water head inside the PFC body gradually increases. When the water head reaches the surface of the PFC, surface runoff occurs, and then the rainwater starts to flow above the surface of the PFC; this drainage is known as the surface drainage. The duration from the time the rainfall starts to the surface ponding occurring over the surface of the PFC, is called the time for surface ponding (tp).

3. Modeling of Subsurface Drainage of a Two-Dimensional PFC Based on Finite Element Analysis

3.1. Equivalent Water Flow Path for the Subsurface Drainage

A PFC is designed with a cross slope (Sx) and longitudinal slope (Sy) that can help drain rainwater effectively. According to Ranieri [9], the majority of water drains out through the equivalent water flow path, which is a result of the cross slope (Sx), longitudinal slope (Sy), and width (W) of the PFC. The equivalent water flow path of a PFC is described in Figure 2. This value can be determined by Equations (1) and (2):
S R = S x 2 + S y 2
L R = W 1 + ( S y S x ) 2
Based on the manual of the American Association of State Highway and Transportation Officials, “Policy on Geometric Design of Highways and Streets” [19], and Equations (1) and (2), the equivalent water flow paths for the PFC including length (LR) and slope (SR), were forecasted. The results are shown in Figure 3.

3.2. Analysis Cases

In Figure 3, most of the results for the equivalent water flow path (LR and SR) are located in the shaded part. Hence, to assess the effect of geometric designs on the subsurface drainage of PFC, the current study chose the equivalent water flow path with a length (LR) of 10 m, 15 m, 20 m, and 30 m and a slope (SR) of 0.5%, 2%, 4%, 6%, and 8% for observation. For each analysis model, a rainfall intensity of 10 mm/h was initially calculated. Then, this value was increased in steps of 10 mm/h up to a value of 120 mm/h. For each scenario, the time for surface ponding (tp) was recorded and reported. First, the effect of length (LR) and slope SR for the PFC with a thickness (T) of 50 mm on the subsurface drainage was observed. Details of the analysis cases are presented in Table 1.
Previous studies showed that the subsurface drainage of a PFC significantly depends on the thickness (T) [8,9,20]. Secondly, this study also evaluated the impact of the thickness (T) of a PFC on its subsurface drainage. To achieve the scope, PFCs with different thickness T values were investigated. These values were chosen by following the literature studies [8,20]. Details of the analysis cases are shown in Table 2 below.

3.3. Governing Equations and Variational Formulation

In this study, transient unsaturated seepage was utilized to model the subsurface drainage of the PFC. In the analysis, it was assumed that the water has a constant volume and is incompressible. The governing equation of the two-dimensional water flow is illustrated in Equation (3):
x [ k x h x + k v d u w x ] + y [ k y h y + k v d u w y ] = γ w m 2 w h t
where kx and ky are the hydraulic conductivities in the horizontal and vertical directions, respectively, h is the total water head, kvd is the vapor conductivity, uw is the pore water pressure, γw is the unit weight of water,  m 2 w  is the coefficient of water storage obtained from the derivative of the soil–water characteristic curve (SWCC), and t denotes time.
It is of note that this study excludes the consideration of vapor flow and assumes isotropic permeability for the PFC pavement. Consequently, the partial differential equation in Equation (3) simplifies to the following:
( k h ) + f = γ w m 2 w h t
The SWCC presents the non-linear relationship between the volumetric water content and the suction in the PFC. In the current study, Van Genuchten’s equation [21,22] was used to extract the SWCC, as shown in Equation (5):
θ = θ r + θ s θ r [ 1 + ( a ψ n ) ] m
where θ represents volumetric water content, θs is the saturated volumetric water content, θr is the residual volumetric water content, Ψ signifies the soil suction, and a, n, and m are material (fitting) parameters.
The drainage process within the PFC is treated as a time-dependent problem governed by the partial differential equation (PDE) presented in Equation (4). To solve this, the time derivative using an implicit Euler approximation was discretized, leading to Equation (6):
( k h n + 1 ) + f n + 1 = γ w m 2 w ( h n + 1 h n Δ t )
where n denotes the time level and  Δ t  is the time discretization parameter. This equation can be effectively solved using the finite element method (FEM). The weak formulation of Equation (6) is expressed in Equation (7):
Ω h v d Ω + Δ t k Ω ( h v ) d Ω = Ω v h n + 1 d Ω + Δ t Γ f n + 1 v d Γ
where, for all ν belonging to a suitable function space, Ω represents the domain, and  d Ω  is the differential volume element. In this study, an FEM solver was developed using FEniCS [23] and implemented entirely in Python programing language.

3.4. Boundary Conditions

To simulate subsurface drainage in the body of a PFC, the model incorporated three primary types of boundary conditions, denoted as “natural,” “review,” and “zero-flux” conditions. The schematic representation of these conditions is depicted in Figure 1. Initially, the “natural” boundary condition was assigned to the bottom of the PFC, specifically along the CD line, where it was assumed that the rainfall infiltrated through the surface and gradually accumulated at the bottom of the PFC. Subsequently, the “review” boundary condition was designated for the BC line, corresponding to the location of subsurface drainage. In seepage analysis, the “review” boundary condition is defined as follows: (i) if the pressure head (h) is negative, the boundary condition results in zero flux; (ii) if h is positive, it corresponds to a negative flux that effectively reduces the pore-water pressures at the surface to zero. Finally, the zero-flux boundary conditions were imposed on the surface AB line and the upper AD line, where drainage was deemed infeasible.

3.5. PFC Parameters

In this study, the permeability of a PFC was assumed to be isotropic and chosen based on the result in the study of Yoo et al. [24], which was 10 mm/s. Literature studies demonstrated that when there was no rainfall in a dry condition, the PFC had a suction pressure. Therefore, in the PFC body, there was a negative value of pore water pressure [25]. Thus, the initial pore water pressure in the PFC body in the current study was set to a negative value within the range of the residual zone. Based on the SWCC, the value of the negative pore water pressure was chosen. The SWCC parameters for PFC in this study followed those results in the study of Lim and Kim [26]. In their study, they experimented on pervious concrete samples by using Fredlund’s device. Then, the SWCC parameters were extracted through the equation of Fredlund and Xing [27]. The SWCC parameters are presented in Table 3. From these parameters, the graph of the SWCC curve is shown in Figure 4.
Based on the SWCC curve for PFC in Figure 4, the suction pressure value was selected as 200 kPa to ensure that the PFC was initially dry before rainfall occurred.

4. Results and Discussion

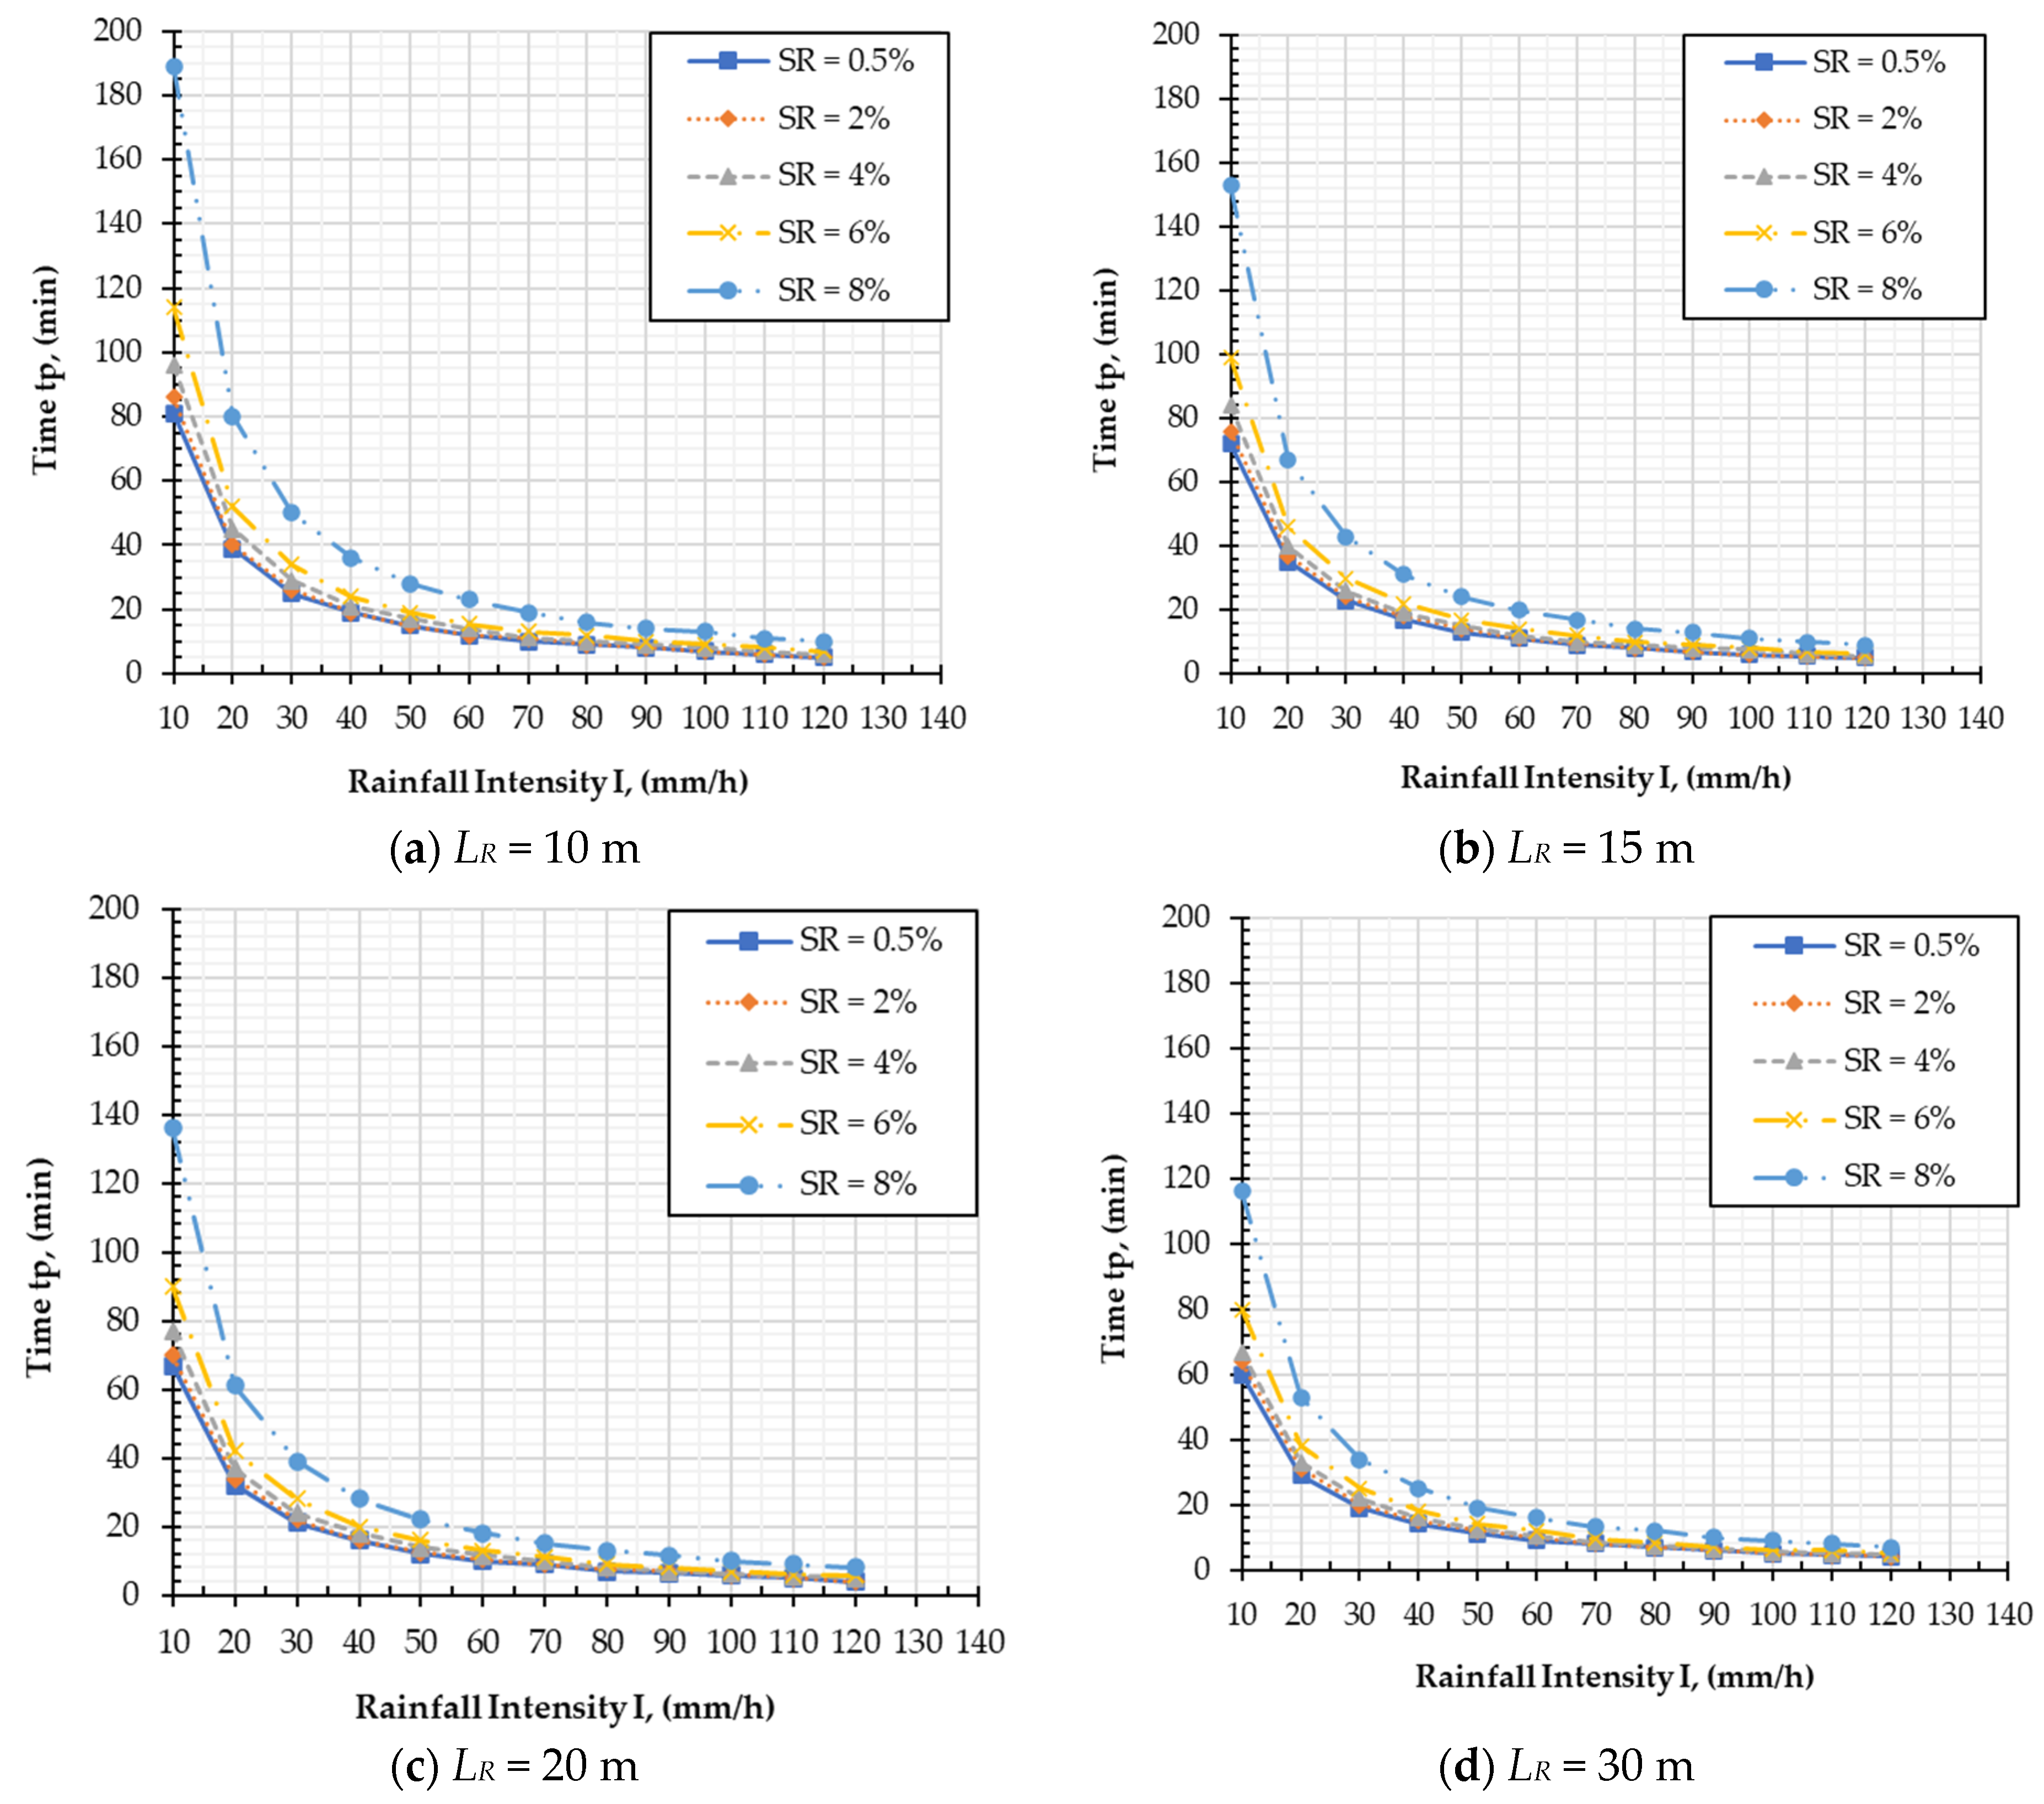
4.1. Time for Surface Ponding

A series of rainfall intensities from 10 mm/h to 120 mm/h, with a step of 10 mm/h, was applied to the PFC model to extract the time for surface ponding (tp). The results are displayed in Table 4.
It is apparent from Table 4 that a PFC with different geometric designs obtains various values of time for surface ponding. When the rainfall intensity increases, there is a downward trend in the time for surface ponding. The present finding in this study is in agreement with Mahmoud et al. [28] and Nguyen et al. [29] which showed that as the rainfall intensity increased, the time for surface ponding decreased. It could be concluded that the subsurface drainage of the PFC is strongly dependent on the rainfall intensity and the geometric design of the PFC.
The present study was successful as it was able to determine the time for surface ponding in several cases where the other study could not. In the study of Nguyen and Ahn [16], the time for surface ponding of the PFC at low rainfall intensity could not be determined since the SVFlux 2D program took such a long time to analyze. This study has gone some way towards filling the gap where the time for surface ponding could not be extracted.

4.2. Effect of Length of Equivalent Water Flow Path on the Subsurface Drainage of a PFC

To observe the effect of PFC geometric designs on subsurface drainage, the curves depicted in Figure 5 present the relationship between the length of the equivalent water flow path (LR) and the time for surface ponding (tp) according to the different rainfall intensity values (I). The curves show that there is an inverse relationship between LR and tp; remarkably, the higher value of LR resulted in a lower value of tp. For example, for I = 10 mm/h and SR = 0.5%, as LR increased by 20 m (from 10 m to 30 m), tp dropped by 21 min (from 81 min to 60 min). The behavior indicated that surface ponding could occur faster for the PFC that had a longer LR. This implication is consistent with that found in the studies of Nguyen and Ahn [16] and Liu et al. [30]. According to Luo et al. [31], a possible explanation for this might be that the PFC with a longer LR could accumulate more water from rainfall than the one with a shorter LR. Hence, PFCs with shorter LR performed better than the PFCs with longer LR in subsurface drainage.
The PFC with a shorter LR provided a wide range of time for surface ponding (tp). The evidence of this can be clearly seen in the case at SR = 4%; with the PFC with LR = 10 m, at I = 10 mm/h, and I = 50 mm/h, tp decreased by 79 min (from 96 to 17 min). Moreover, the values of tp for LR = 15, LR = 20, and LR = 30 m were 69, 63, and 54.5 min, respectively. Thus, the conclusion was that the PFC with a shorter LR seems to be more sensitive to rainfall intensity values than the one with a longer LR. It is of note that the change in LR values did not have a significant effect on the results of tp. This behavior could be seen clearly at high rainfall intensities. In Figure 5, the PFC with different LR values at the high rainfall intensities from 80 to 120 mm/h resulted in close tp values. Thus, it could be concluded that LR had a low impact on the subsurface drainage of the PFC.

4.3. Effect of Slope of Equivalent Water Flow Path on the Subsurface Drainage of a PFC

The effects of the slope of the equivalent water flow path (SR) on PFC subsurface drainage were also investigated. The curves in Figure 6 illustrate the relationship between the slope of the equivalent water flow path (SR) and the time for surface ponding (tp), according to the different rainfall intensity values (I). The observation showed that the increase in SR resulted in an increase of tp. For instance, for the PFC with LR = 10 m and I = 10 mm/h, when SR increased by 16 times (from 0.5% to 8%), tp increased more than two times (from 81 to 189 min). This performance is consistent with that of Tan et al. [8], Nguyen and Ahn [16]. The results indicated that the PFC with a higher SR exhibits a higher subsurface drainage capacity than the one with a lower SR. This rather contradictory result may be due to the speed of drainage. Alireza et al. [32] speculated that a higher slope could help increase the speed of drainage water in the PFC body and cause a lower water head in the PFC body.
The varieties of slope SR showed a lower impact on the subsurface drainage for the PFC with a longer LR. By way of illustration, at I = 10 mm/h, when the value of SR increases two times (from 2% to 4%), for LR = 10 m, tp increased significantly by 10 min (from 86 to 96 min), but for LR = 15, LR = 20, and LR = 30 m, this value increased by only 8 min, 7 min, and 3 min, respectively. Thus, it can be concluded that the subsurface drainage of the PFC with a longer LR is less sensitive to the slope SR. It is of note that the change in SR values had a significant effect on the results of tp. PFCs with different SR provided a wide range of results for tp. Thus, it could be concluded that SR had a high impact on the subsurface drainage of PFCs. Surprisingly, the results of tp of PFCs with different geometric designs are almost close at high rainfall intensities. This indicates that the subsurface drainage of PFCs at high rainfall intensity has a similar response, regardless of the geometric designs.

4.4. Effect of Thickness on the Subsurface Drainage of a PFC

The effect of thickness (T) of the PFC on its subsurface drainage was evaluated. Figure 7 describes the relationship between the time for surface ponding (tp) and rainfall intensity values (I) in the consideration of thickness (T) for PFCs having an equivalent length (LR) of 10 m.
In Figure 7, it can be seen that the thickness (T) has a strong effect on the results of the time for surface ponding tp of a PFC. As the thickness T of the PFC increased, the results of the time for surface ponding tp increased sharply. It is apparent that as T increases by a factor of two, tp only doubles. Moreover, as T increases by a factor of three, tp rises more than six times. The evidence of this can be clearly seen in the case of the PFC at I = 30 mm/h, when T increased two times from 25 to 50 mm, tp also increased two times (from 13 to 26 min). At the same condition, when T increased three times from 25 to 75 mm, tp rose about 7.3 times (from 13 to 95 min). This behavior implied that the thickness T of the PFC has a strong effect on its subsurface drainage. The finding further supports the idea of Chen et al. [33], who found that the thickness of the PFC had the most remarkable effect on the permeability of the PFC.
This study found that the subsurface drainage of the PFC is more sensitive to its thickness T at lower rainfall intensity values. For instance, at I = 20 mm/h and SR = 4%, the results for the time for surface ponding tp for PFC with T = 25 mm and 50 mm are 22 and 45 min, respectively. They vary significantly by 23 min. However, at I = 120 mm/h, the results are 2.7 and 6 min. The difference in the values of tp is only 3.3 min, which are close to each other. The conclusion was drawn that the thickness T of the PFC does not seem to significantly affect the subsurface drainage of the PFC at high rainfall intensity. A similar conclusion was found in the study of Nguyen and Ahn [16].

5. Conclusions

In this study, the subsurface drainage of a PFC with various equivalent water flow paths, including length and slope, was observed via two-dimensional finite element analysis. A series of analyses was conducted for PFCs with equivalent water flow path length values of 10, 15, 20, and 30 m and slope values of 0.5%, 2%, 4%, 6%, and 8%. The PFCs were subjected to a range of rainfall intensities, from 10 to 120 mm/h, with a step of 10 mm/h to extract the time for surface ponding. Based on the results and discussions, the following conclusions were drawn.
PFCs subjected to various rainfall intensity values resulted in various times for surface ponding. In general, when the rainfall intensity increased, there was a downward trend in the time for surface ponding of the PFC. The geometric designs of PFCs had a remarkable impact on the subsurface drainage of the PFC. PFCs with different geometric designs provide a wide range of time for surface ponding values. Among the three factors of the geometric design of the PFC, thickness has the most influence on subsurface drainage. It is of note that at a high rainfall intensity, the geometric design of the PFC does not seem to affect significantly the subsurface drainage of the PFC.
The observation of the subsurface drainage of the PFC according to the equivalent water flow path including the length LR and the slope SR showed that, with LR, it has an inversely proportional trend, while with SR, it has a similar trend. Another highlighted implication of this study is that the PFC with a shorter LR appears to be more sensitive to rainfall intensity and slope values. The present study provided additional evidence with respect to the effect of PFC thickness. As the thickness T increased, the results of the time for surface ponding tp increased gradually. The current study only examined the subsurface drainage of PFCs using two-dimensional finite element analysis based on FEniCS and implemented it entirely in the Python programing language. Further experimental investigations are needed to evaluate the subsurface drainage of PFCs, considering other factors such as permeability, rutting, and environmental factors.

Author Contributions

Conceptualization, T.H.N. and M.T.P.; methodology, T.H.N.; software, M.T.P.; validation, M.T.P. and T.H.N.; formal analysis, M.T.P.; investigation, T.H.N.; resources, M.T.P.; data curation, T.M.D.H.; writing—original draft preparation, T.H.N.; writing—review and editing, K.K.A.T. and T.H.N.; visualization, M.T.P.; supervision, T.H.N.; project administration, T.M.D.H.; funding acquisition, V.H.H. All authors have read and agreed to the published version of the manuscript.

Funding

This research was fully supported by Tra Vinh University under grant contract number 247/2022/HĐ.HĐKH&ĐT-ĐHTV.

Institutional Review Board Statement

Not applicable.

Informed Consent Statement

Not applicable.

Data Availability Statement

Data are contained within the article.

Acknowledgments

The authors would like to thank the Tra Vinh University.

Conflicts of Interest

Author Minh Triet Pham was employed by the company Akselos S.A. The remaining authors declare that the research was conducted in the absence of any commercial or financial relationships that could be construed as a potential conflict of interest.

References

  1. Chu, L.; Tang, B.; Fwa, T. Evaluation of functional characteristics of laboratory mix design of porous pavement materials. Constr. Build. Mater. 2018, 191, 281–289. [Google Scholar] [CrossRef]
  2. Wu, H.; Yu, J.; Song, W.; Zou, J.; Song, Q.; Zhou, L. A critical state-of-the-art review of durability and functionality of open-graded friction course mixtures. Constr. Build. Mater. 2020, 237, 117759. [Google Scholar] [CrossRef]
  3. Zhang, L.; Ye, Z.; Shibata, S. Assessment of rain garden effects for the management of urban storm runoff in Japan. Sustainability 2020, 12, 9982. [Google Scholar] [CrossRef]
  4. Manrique-Sanchez, L.; Caro, S. Numerical assessment of the structural contribution of porous friction courses (PFC). Constr. Build. Mater. 2019, 225, 754–764. [Google Scholar] [CrossRef]
  5. Eck, B.J.; Winston, R.J.; Hunt, W.F.; Barrett, M.E. Water quality of drainage from permeable friction course. J. Environ. Eng. 2012, 138, 174–181. [Google Scholar] [CrossRef]
  6. Berbee, R.; Rijs, G.; De Brouwer, R.; van Velzen, L. Characterization and treatment of runoff from highways in the Netherlands paved with impervious and pervious asphalt. Water Environ. Res. 1999, 71, 183–190. [Google Scholar] [CrossRef]
  7. Roseen, R.M.; Ballestero, T.P.; Houle, J.J.; Avellaneda, P.; Briggs, J.; Fowler, G.; Wildey, R. Seasonal performance variations for storm-water management systems in cold climate conditions. J. Environ. Eng. 2009, 135, 128–137. [Google Scholar] [CrossRef]
  8. Tan, S.; Fwa, T.; Chai, K. Drainage considerations for porous asphalt surface course design. Transp. Res. Rec. 2004, 1868, 142–149. [Google Scholar] [CrossRef]
  9. Ranieri, V. Runoff control in porous pavements. Transp. Res. Rec. 2002, 1789, 46–55. [Google Scholar] [CrossRef]
  10. Ali, M.H. Finite Element Analysis is A Powerful Approach to Predictive Manufacturing Parameters. J. Univ. Babylon Eng. Sci. 2018, 26, 229–238. [Google Scholar]
  11. Liu, X.; Chen, Y.; Shen, C. Coupled two-dimensional surface flow and three-dimensional subsurface flow modeling for drainage of permeable road pavement. J. Hydrol. Eng. 2016, 21, 04016051. [Google Scholar] [CrossRef]
  12. NRCS; USDA. Urban Hydrology for Small Watersheds-Technical Release 55; US Department of Agriculture Natural Resources Conservation: Washington, DC, USA, 1986. [Google Scholar]
  13. Eisenberg, B.; Lindow, K.C.; Smith, D.R. Permeable Pavements; American Society of Civil Engineers: Reston, VA, USA, 2015. [Google Scholar]
  14. LeFevre, N.-J.B.; Watkins, D.W., Jr.; Gierke, J.S.; Brophy-Price, J. Hydrologic performance monitoring of an underdrained low-impact development storm-water management system. J. Irrig. Drain. Eng. 2010, 136, 333–339. [Google Scholar] [CrossRef]
  15. Rashid, M.; Abustan, I.; Hamzah, M. Numerical simulation of a 3-D flow within a storage area hexagonal modular pavement systems. IOP Conf. Ser. Earth Environ. Sci. 2013, 16, 012056. [Google Scholar] [CrossRef]
  16. Nguyen, T.H.; Ahn, J. Numerical study on the hydrologic characteristic of permeable friction course pavement. Water 2021, 13, 843. [Google Scholar] [CrossRef]
  17. Abohamer, H.; Elseifi, M.A.; Mayeux, C.; Cooper, S.B., III; Cooper, S., Jr. Investigating the Seepage Characteristics of an Open-Graded Friction Course Using Finite Element Modeling. Transp. Res. Rec. 2023, 03611981231168103. [Google Scholar] [CrossRef]
  18. Kovács, G. Seepage Hydraulics; Elsevier: Amsterdam, The Netherlands, 2011. [Google Scholar]
  19. AASHTO. Policy on Geometric Design of Highways and Streets; American Association of State Highway Transportation Officials: Washington, DC, USA, 2001; p. 158. [Google Scholar]
  20. Ranieri, V.; Ying, G.; Sansalone, J. Drainage modeling of roadway systems with porous friction courses. J. Transp. Eng. 2012, 138, 395–405. [Google Scholar] [CrossRef]
  21. Van Genuchten, M.T. A closed-form equation for predicting the hydraulic conductivity of unsaturated soils. Soil Sci. Soc. Am. J. 1980, 44, 892–898. [Google Scholar] [CrossRef]
  22. Fredlund, M. User’s Manual for SVFlux, Saturated-Unsaturated Numerical Modeling; SoilVision Systems: Saskatoon, SK, Canada, 2010. [Google Scholar]
  23. Alnæs, M.; Blechta, J.; Hake, J.; Johansson, A.; Kehlet, B.; Logg, A.; Richardson, C.; Ring, J.; Rognes, M.E.; Wells, G.N. The FEniCS project version 1.5. Arch. Numer. Softw. 2015, 3, 20553. [Google Scholar] [CrossRef]
  24. Yoo, J.; Nguyen, T.H.; Lee, E.; Lee, Y.; Ahn, J. Measurement of Permeability in Horizontal Direction of Open-Graded Friction Course with Rutting. Sustainability 2020, 12, 6428. [Google Scholar] [CrossRef]
  25. Si, C.; Chen, E.; You, Z.; Zhang, R.; Qiao, P.; Feng, Y. Dynamic response of temperature-seepage-stress coupling in asphalt pavement. Constr. Build. Mater. 2019, 211, 824–836. [Google Scholar] [CrossRef]
  26. Lim, B.K.; Kim, Y.T.; Department of Ocean Engineering, Pukyong National University, Busan, South Korea. Personal Communication, 2012.
  27. Fredlund, D.G.; Xing, A. Equations for the soil-water characteristic curve. Can. Geotech. J. 1994, 31, 521–532. [Google Scholar] [CrossRef]
  28. Mahmoud, A.A.; Mbengue, M.T.M.; Hussain, S.; Abdullahi, M.A.; Beddal, D.; Abba, S.I. Investigation for Flood Flow quantification of Porous Asphalt with Different Surface and Subsurface Thickness. Knowl. Based Eng. Sci. 2023, 4, 78–89. [Google Scholar]
  29. Nguyen, H.T.; Nguyen, T.P.; Phan, T.N.; Tran, P.T.; Nguyen, P.B. Investigation on hydrologic performance of pervious concrete pavement by finite element analysis. Tra Vinh Univ. J. Sci. 2022, 12, 56–63. [Google Scholar] [CrossRef]
  30. Liu, L.; Wu, S.; Yao, G.; Zhang, J.; Montalvo, L.; Tahri, O. Developing In-Situ Permeability and Air Voids Requirements for Open-Graded Friction Course Pavement: Case Study. Int. J. Civ. Eng. 2022, 20, 107–114. [Google Scholar] [CrossRef]
  31. Luo, W.; Wang, K.C.; Li, L.; Li, Q.J.; Moravec, M. Surface drainage evaluation for rigid pavements using an inertial measurement unit and 1-mm three-dimensional texture data. Transp. Res. Rec. 2014, 2457, 121–128. [Google Scholar] [CrossRef]
  32. Pourhassan, A.; Gheni, A.A.; ElGawady, M.A. Water film depth prediction model for highly textured pavement surface drainage. Transp. Res. Rec. 2022, 2676, 100–117. [Google Scholar] [CrossRef]
  33. Chen, X.; Wang, H.; Li, C.; Zhang, W.; Xu, G. Computational investigation on surface water distribution and permeability of porous asphalt pavement. Int. J. Pavement Eng. 2022, 23, 1226–1238. [Google Scholar] [CrossRef]
Figure 1. Head of water flow in a PFC body, after Ranieri, Nguyen and Ahn [9,16].
Applsci 13 12428 g001
Figure 2. Equivalent water flow path: length (LR) and slope (SR), after Nguyen and Ahn [16].
Applsci 13 12428 g002
Figure 3. Equivalent water flow path includes length (LR) and slope (SR) values for the PFC.
Applsci 13 12428 g003
Figure 4. SWCC curve for the PFC, after Lim and Kim [26], Nguyen and Ahn [16].
Applsci 13 12428 g004
Figure 5. Relationship between the time for surface ponding (tp) and rainfall intensity (I) with different length (LR) values.
Applsci 13 12428 g005aApplsci 13 12428 g005b
Figure 6. Relationship between the time for surface ponding for PFC (tp) and rainfall intensity (I) with different slope (SR) values.
Applsci 13 12428 g006
Figure 7. Relationship between the time for surface ponding (tp) of the PFC and rainfall intensity (I) with different thickness (T) values.
Applsci 13 12428 g007aApplsci 13 12428 g007b
Table 1. Analysis cases to observe the effect of equivalent water flow path, length (LR) and slope (SR).
Length, LR (m)Slope, SR (%)Rainfall Intensity, I (mm/h)
10, 15, 20, 300.5, 2, 4, 6, 810, 20, 30, 40, 50, 60, 70, 80, 90, 100, 110, 120
Table 2. Analysis cases to observe the effect of PFC thickness (T).
Length, LR
(m)
Thickness, T
(mm)
Slope, SR
(%)
Rainfall Intensity, I (mm/h)
1025, 50, 750.5, 2, 4, 6, 810, 20, 30, 40, 50, 60, 70, 80, 90, 100, 110, 120
Table 3. SWCC parameters for the PFC pavement, after Lim and Kim [26].
Volumetric Water Content, θs (%) Residual Volumetric Water Content, θr (%)Material ParametersSoil suction, Ψ (kPa)
an
200.0012.231.630.01
Table 4. Time for surface ponding (tp) for the PFC at various rainfall intensity values (I).
LR (m)SR (%)Time for Surface Ponding, tp (min)
I = 10 (mm/h)2030405060708090100110120
100.58139251915121098765
28640261915121198765
496452921171411.2109876
61145234241915.5131210987
81898050362823191614131110
150.572352317131198765.55
27637241814119.58765.55
484402619151210987.56.35.5
699463022171412109876.2
8153674331242017141311109
200.5673221161210976.55.754
27034221612.510.597.57654
4773724181411.510876.35.55
69042282016131198765.7
81366139282218151311.51098
300.56029191411987654.54
264312015121087654.54
46733221612.510.38.57.36.45.554.7
68038251814.1129.58.37.26.165
811653342519.11613.21210987
Disclaimer/Publisher’s Note: The statements, opinions and data contained in all publications are solely those of the individual author(s) and contributor(s) and not of MDPI and/or the editor(s). MDPI and/or the editor(s) disclaim responsibility for any injury to people or property resulting from any ideas, methods, instructions or products referred to in the content.

