Article

Noise-to-Norm Reconstruction for Industrial Anomaly Detection and Localization

1
School of Information Science and Engineering, Northeastern University, Shenyang 110819, China
2
Department of AI Innovation Center, Midea, Foshan 528311, China
*
Authors to whom correspondence should be addressed.
Appl. Sci. 2023, 13(22), 12436; https://doi.org/10.3390/app132212436
Submission received: 12 September 2023 / Revised: 23 October 2023 / Accepted: 25 October 2023 / Published: 17 November 2023

Abstract

:
Anomaly detection has a wide range of applications and is especially important in industrial quality inspection. Currently, many top-performing anomaly detection models rely on feature embedding-based methods. However, these methods do not perform well on datasets with large variations in object locations. Reconstruction-based methods use reconstruction errors to detect anomalies without considering positional differences between samples. In this study, a reconstruction-based method using the noise-to-norm paradigm is proposed, which avoids the invariant reconstruction of anomalous regions. Our reconstruction network is based on M-net and incorporates multiscale fusion and residual attention modules to enable end-to-end anomaly detection and localization. Experiments demonstrate that the method is effective in reconstructing anomalous regions into normal patterns and achieving accurate anomaly detection and localization. On the MPDD and VisA datasets, our proposed method achieved more competitive results than the latest methods, and it set a new state-of-the-art standard on the MPDD dataset.

1. Introduction

In the field of computer vision, visual anomaly detection is a crucial issue that involves the process of detecting and pinpointing data instances that deviate from the expected or standard observations. In the past years, Anomaly detection had a wide range of applications in fields such as industrial quality inspection [1,2,3], medical diagnosis [4], and video surveillance [5,6]. In industrial production processes, product quality is highly susceptible to various factors, such as existing technologies and working conditions. Surface defects are the most visible manifestation of the impact on product quality. Therefore, surface defect detection is crucial to ensure product qualification and reliability. Anomaly detection plays a vital role in industrial quality inspection by identifying and locating defects in product appearance, thereby improving product quality and ensuring compliance with standards.
In recent years, with the rapid development of the computer vision field, deep learning-based methods have become an effective solution for industrial quality inspection. However, due to the limited number of anomaly samples and the difficulty of including all types of anomalies in a limited number of samples, and the labor-intensive data labeling process, supervised anomaly detection methods are severely limited. As a result, most recent research has focused on unsupervised learning methods, which aim to achieve anomaly detection without requiring prior information on anomaly samples. Unsupervised learning-based anomaly detection has become a promising research trend for the future.
In unsupervised anomaly detection methods, there are mainly two types of approaches: feature embedding-based and reconstruction-based methods. Feature embedding-based methods [7,8,9,10,11] that utilize pre-trained models to extract image features and realize the measurement or comparison of features by feature modeling, have been widely used in the field of unsupervised anomaly detection. However, feature embedding-based methods rely on pre-trained models on additional datasets such as ImageNet, and their performance may significantly decrease when the features of industrial images differ significantly from those of the pre-training dataset. Additionally, feature embedding-based methods are highly dependent on the consistency of the placement of the target and the shooting angle. Otherwise, false detections are likely to occur. In contrast, reconstruction-based methods [12,13,14,15] do not have this limitation and do not require additional training data, making them suitable for various scenarios. Reconstruction-based methods exhibit better anomaly detection and localization performances for randomly placed objects. However, reconstruction-based methods also have limitations. They may not be able to achieve complete reconstruction when dealing with images with complex structures and textures. In addition, reconstruction-based methods may result in invariant reconstruction of anomalous regions due to their strong reconstruction ability.
To address the aforementioned issues, we propose a reconstruction-based method using the noise-to-norm paradigm, which trains the reconstruction network on noisy images as input, significantly improving the network’s reconstruction ability. Additionally, the introduction of noise disturbs the anomalous regions, making it difficult to distinguish them from normal patterns, thus solving the problem of invariant reconstruction of anomalous regions.
Our proposed reconstruction model is based on M-net [16] and employs a multiscale fusion structure. Before being fed into the reconstruction network, the noisy image is down-sampled to varied sizes to enlarge the model’s receptive field, providing better robustness to anomalous regions of diverse sizes. The reconstruction network comprises three parts: an encoder, a decoder, and a feature fusion module; both the encoder and decoder contain residual attention modules and skip connections between them. The feature fusion module fuses the multiscale features to generate the reconstructed image.
Numerous experiments on the MPDD [2] and VisA [3] datasets have demonstrated that the proposed end-to-end anomaly detection method has excellent performance.
The main contributions of this study are summarized as follows:
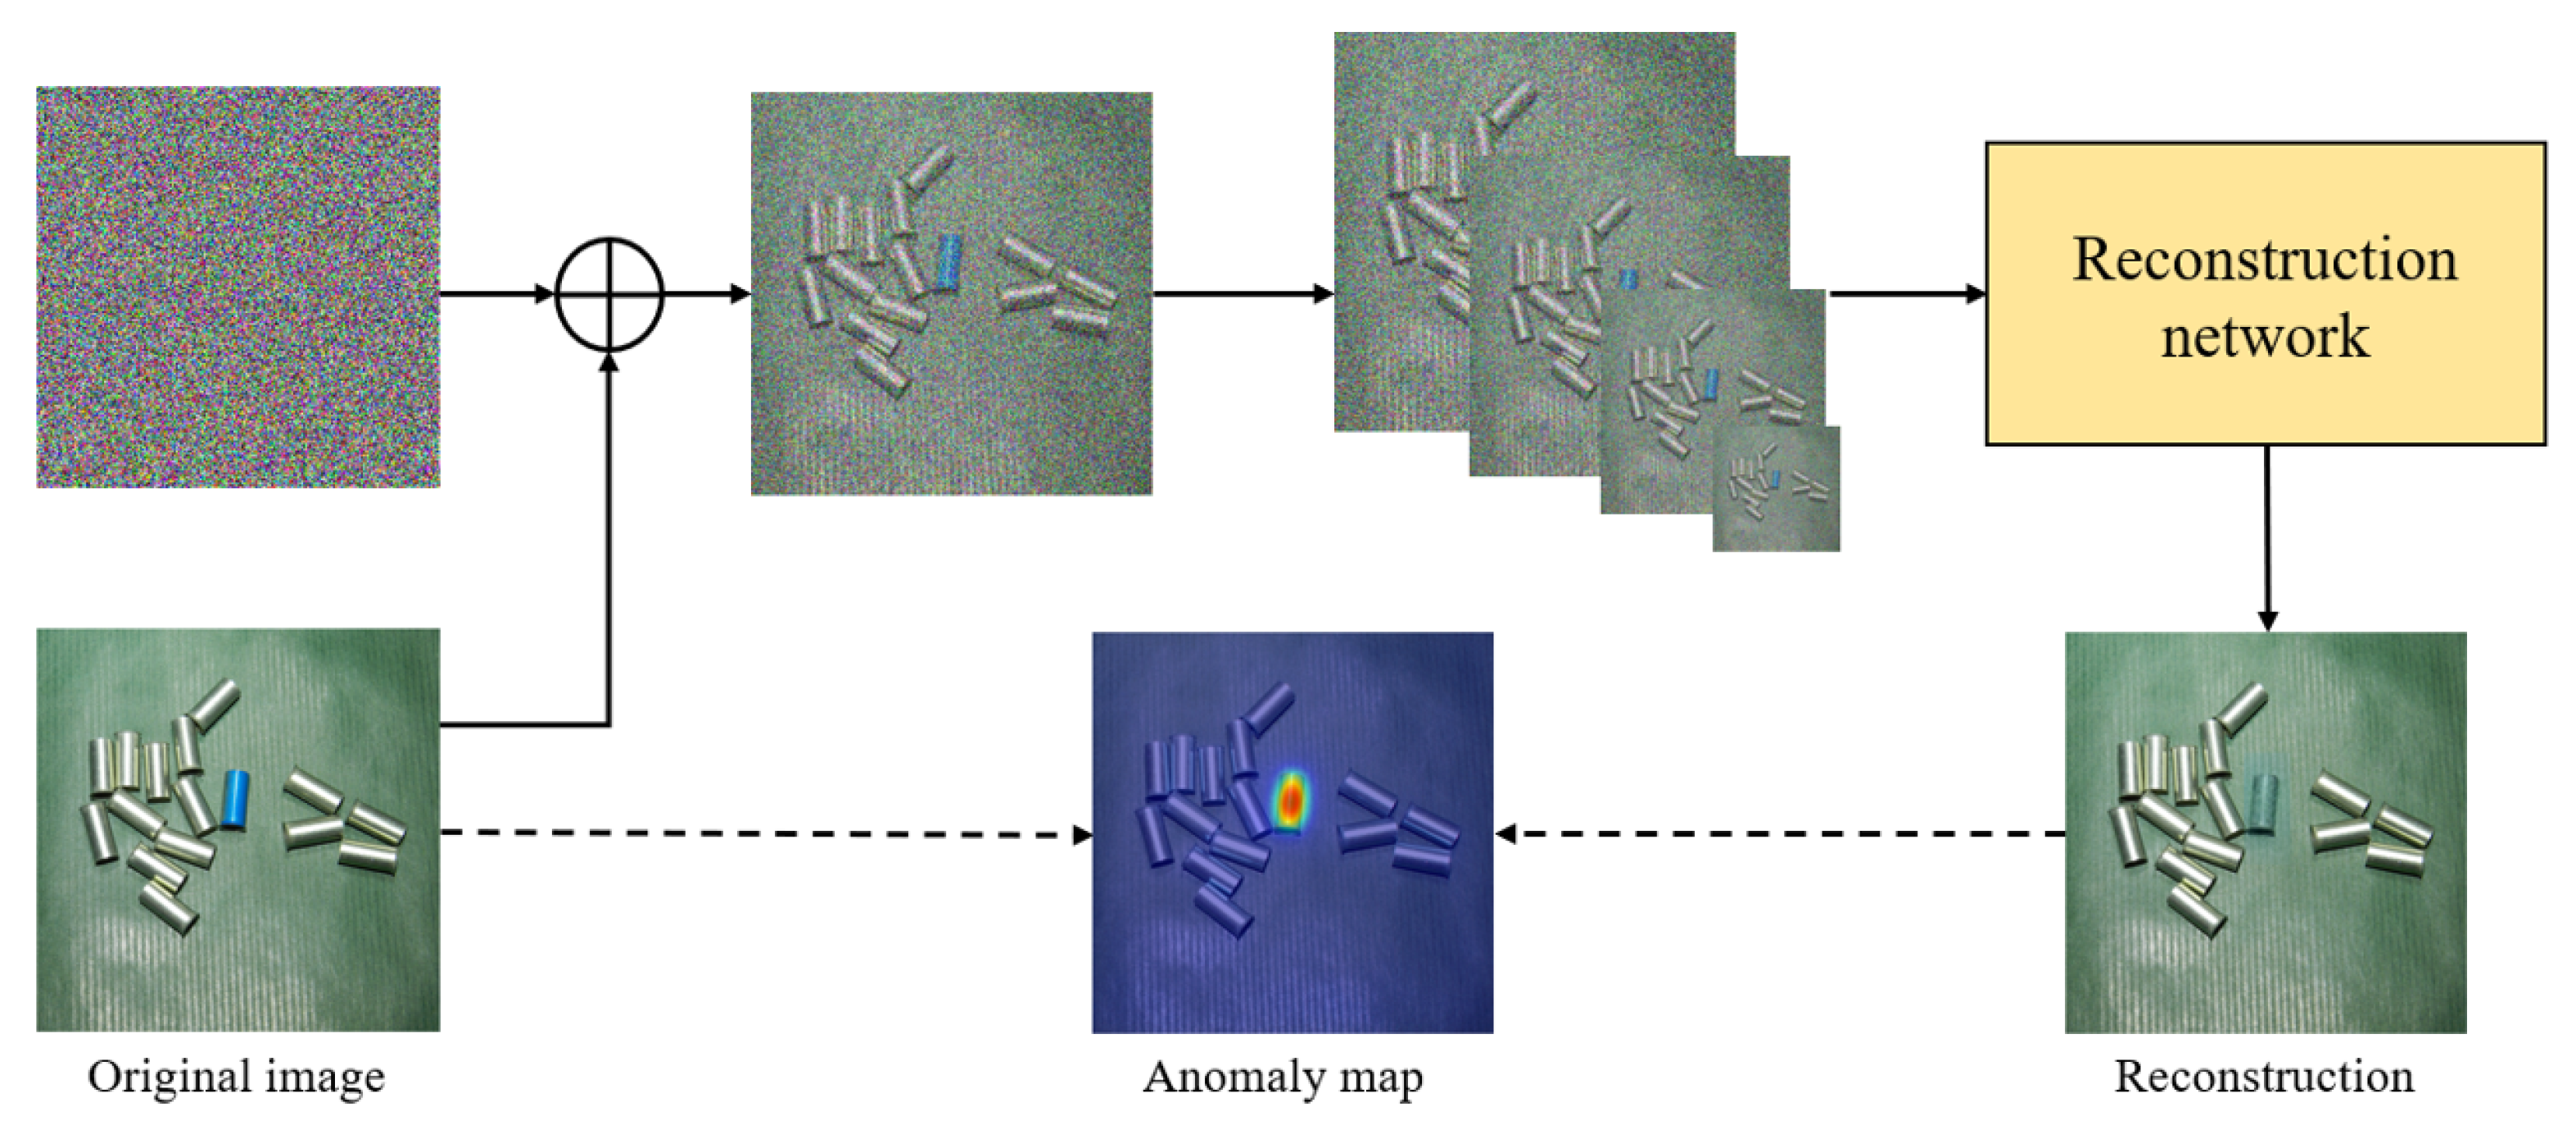
  • We introduce a novel unsupervised anomaly detection method based on the noise-to-norm paradigm.
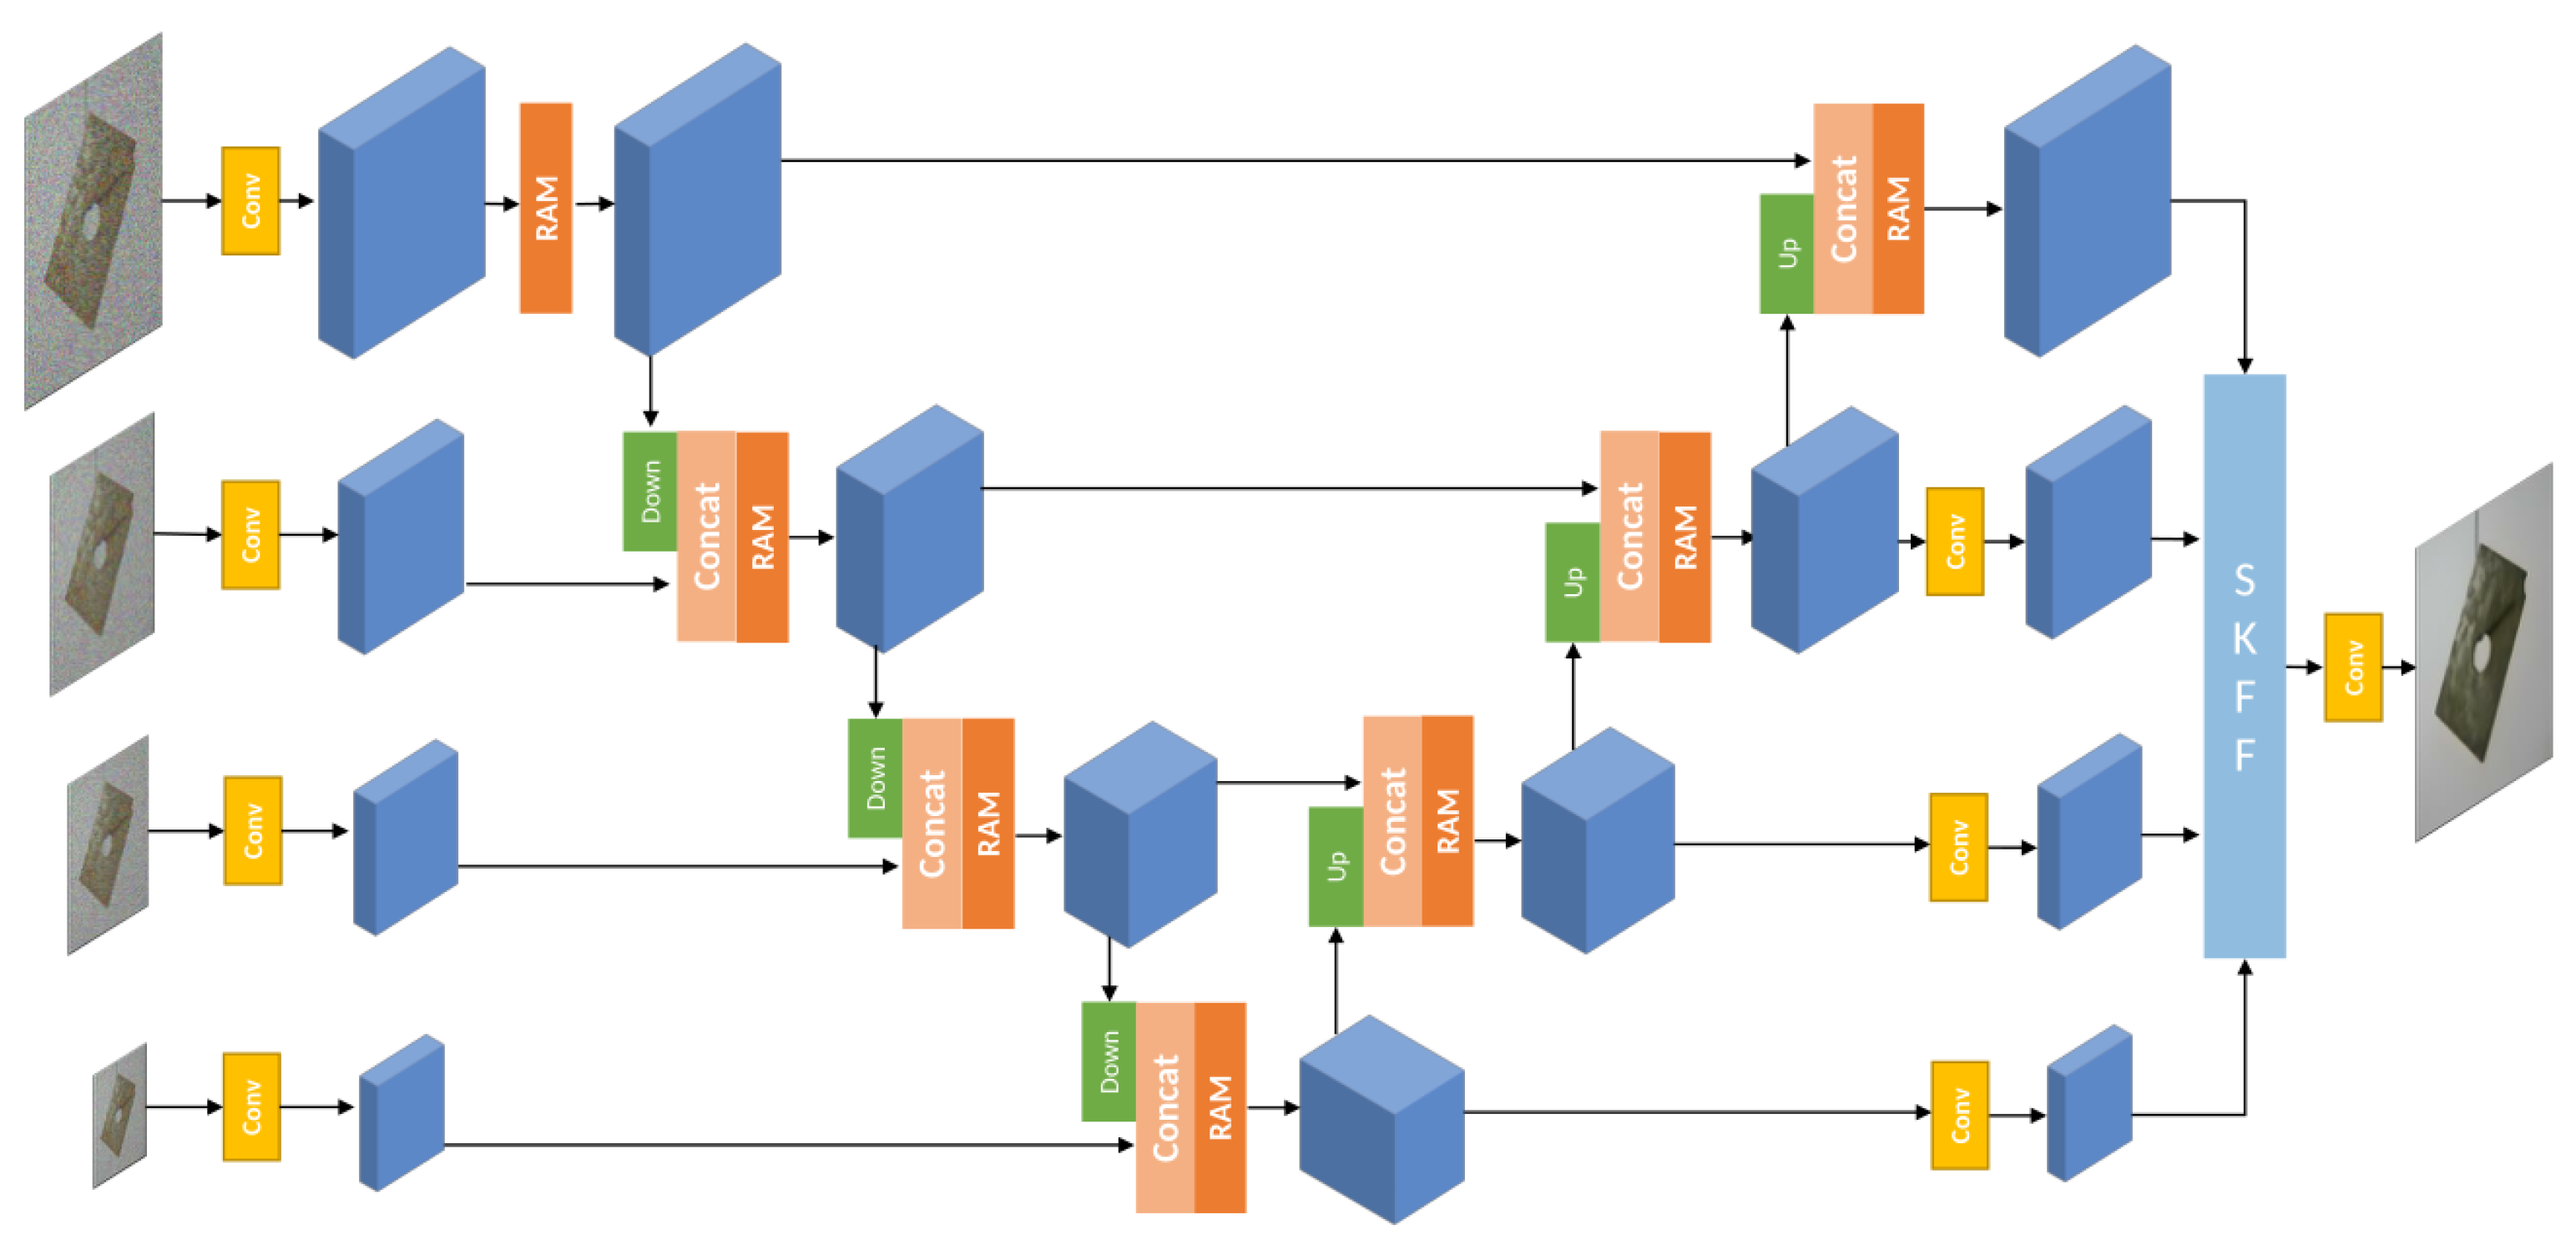
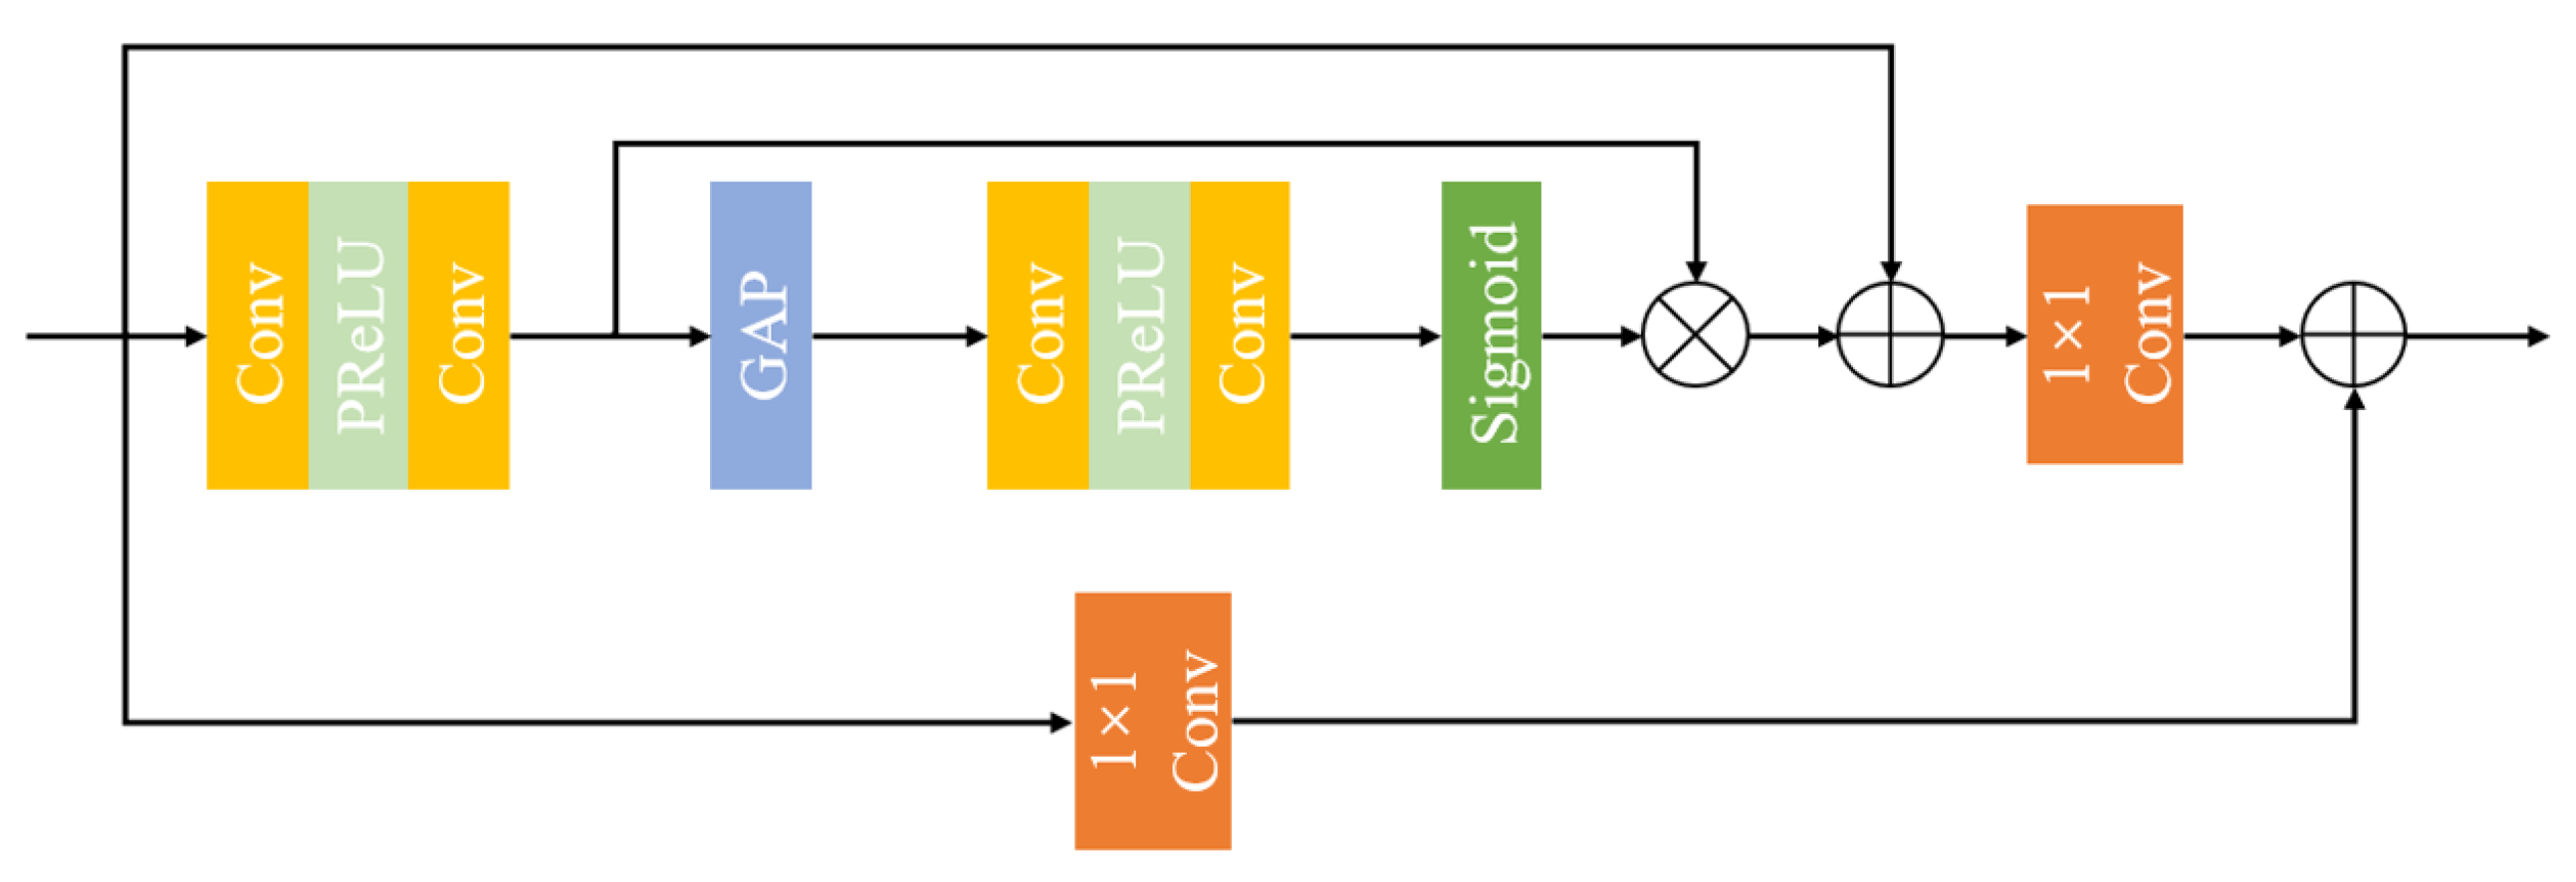
  • We propose a residual attention module that can be embedded in the encoder and decoder to achieve high-quality reconstruction of noisy images.
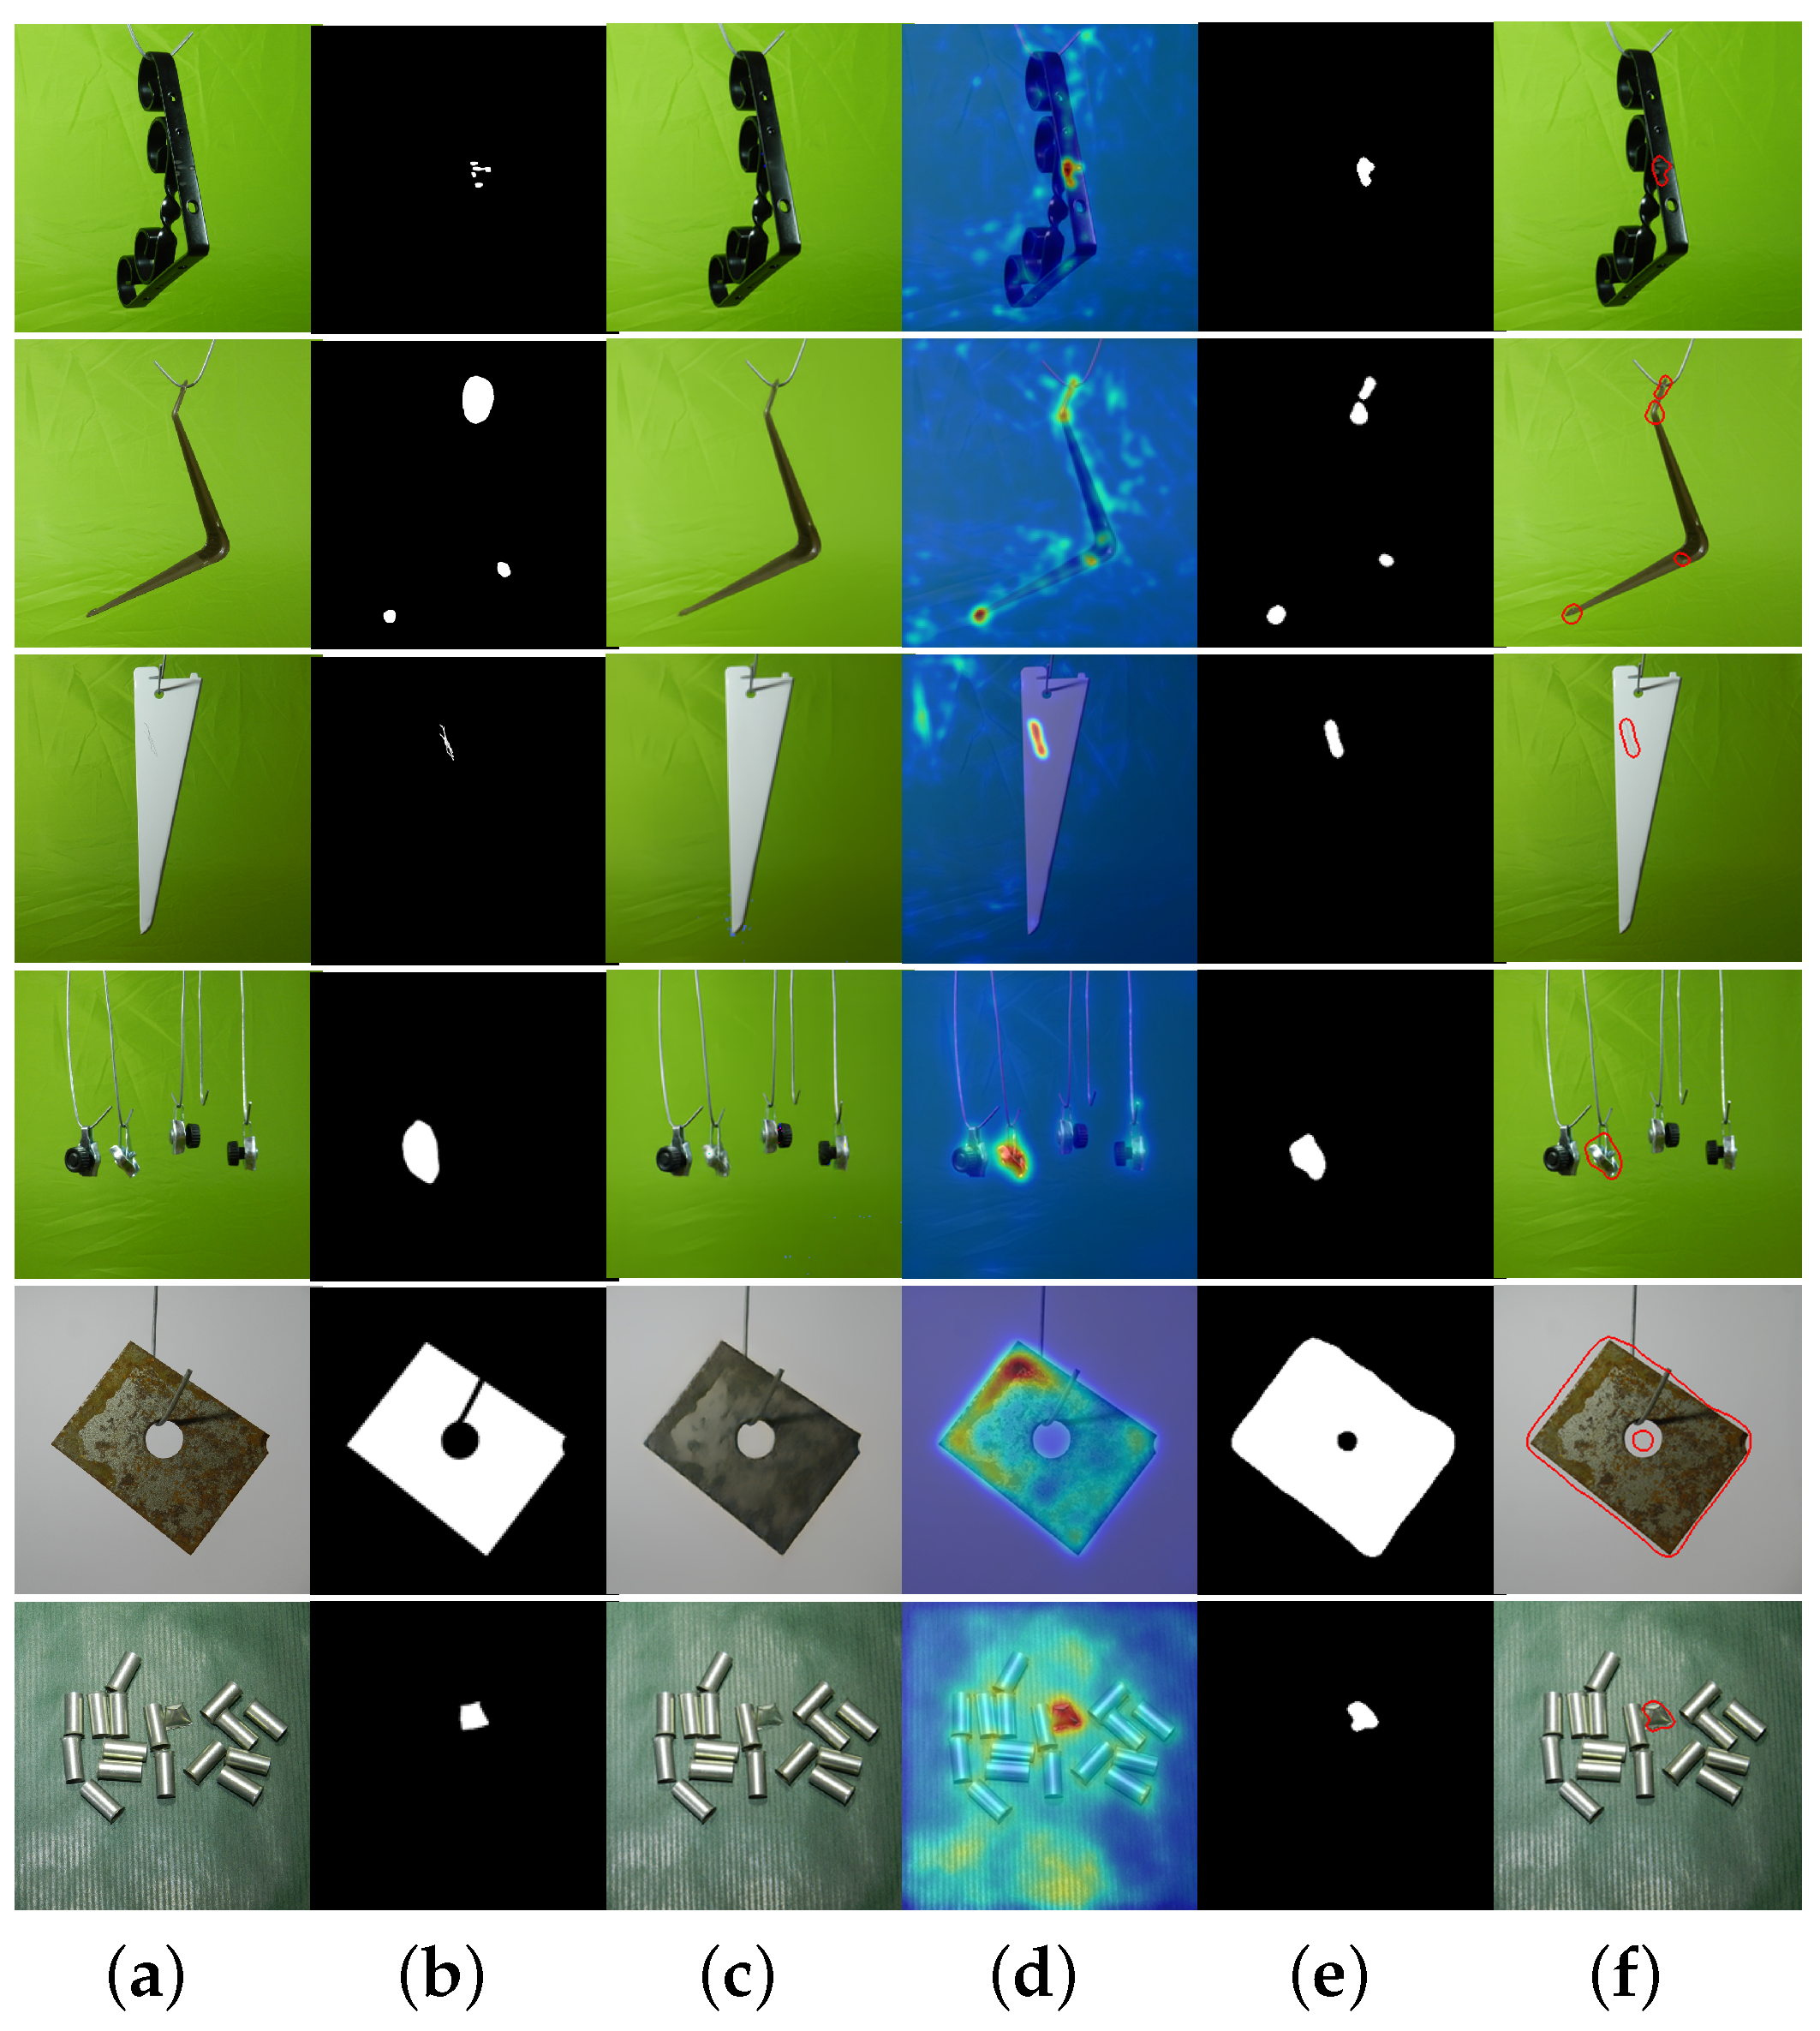
  • Our method achieves state-of-the-art (SOTA) performance on the MPDD dataset.

2. Related Work

Unsupervised learning addresses the high annotation costs and difficulty in collecting negative samples, making it the mainstream method for image anomaly detection. Unsupervised learning methods can be divided into two main categories: reconstruction-based and feature embedding-based methods.

2.1. Feature Embedding-Based Methods

Feature embedding-based methods aim to determine a feature distribution that can distinguish between normal and anomalous samples. Typically, these methods use a pre-trained network as a feature extractor to extract shallow features from images. By fitting normal sample features to a Gaussian distribution, Mahalanobis distance is a common method to calculate the anomaly scores [7,17] between the test set samples and the Gaussian distribution, to estimate the anomaly localization. Research in [8] employed a coreset-subsampled memory bank to ensure low inference cost at higher performance. Some studies attach a normalizing flow module to the feature extractor [10,11,18], features were first extracted and a normalizing flow module was utilized to enable transformations between data distributions and well-defined densities. Subsequently, anomaly detection and localization were performed based on the probability density of the feature map.
In general, feature embedding-based methods have achieved better results on the MVTec AD [1] dataset than those of the reconstruction-based methods because of their powerful representation capability of deep features. However, they rely on the uniformity of an object’s location, which makes optimization difficult for cases in which the object’s position varies significantly.

2.2. Reconstruction-Based Methods

The reconstruction-based method trains an encoder and a decoder to reconstruct images with low dependence on pre-trained models. This method aims to train a reconstruction model that works well on positive samples but poorly on anomalous regions and achieves anomaly detection and localization by comparing the original image with the reconstructed image. Early studies used Autoencoders [13,19,20] for image reconstruction, whereas some methods employed a generative adversarial network [12,14,21] to obtain better reconstruction performance. However, there is a problem of overgeneralization, which can lead to an accurate reconstruction of anomalous regions. To address this issue, some researchers proposed a method based on image inpainting [15,22,23,24], in which masks are used to remove parts of the original image, preventing the reconstruction of anomalous regions. However, for images with complex structures and irregular textures, excessive loss of the original information may limit the reconstruction ability and cause many false positives in normal regions.

3. Method

3.1. Overview

The proposed anomaly detection framework is based on the noise-to-norm paradigm, as shown in Figure 1.
Specifically, we introduce random Gaussian noise to corrupt the original image, and the process of adding noise ϵ is defined as follows:
x = ( 1 λ ) x 0 + λ ϵ , ϵ N ( 0.5 , 0.5 )
where λ ( 0 , 1 ) , x 0 is the data obtained by normalizing each channel of the original image according to a Gaussian distribution ( μ = 0.5 , σ = 0.5 ) . We add random noise generated from the same Gaussian distribution to the original image using weighted blending, thereby allowing us to control the degree to which the noise corrupts the original image. In contrast to the methods that simulate anomalies [20], our approach of adding noise is not intended to simulate anomalies. Instead, its purpose is to completely obscure the distinguishable appearance of anomalous regions, allowing the reconstruction network to transform the anomalous image into a normal image.
After adding noise, the images were down-sampled to varied sizes to serve as multiple inputs. These inputs were then utilized by the reconstruction network to generate anomaly free images. During the training phase, only anomaly free samples were used to train the reconstruction network. The reconstructed images were compared to the original images using a loss function, and the reconstruction capability of the model was continuously improved. During the inference phase, anomaly localization was achieved by generating an anomaly map that captured pixel-level differences between the reconstructed and original images. The specific details of the reconstructed network are described below.

3.2. Reconstruction Network

As we know, U-Net [25] and its variants have been widely used in deep learning models for image segmentation and other fields [26,27,28,29]. Our proposed network is based on the M-net [16], which originated from the field of image segmentation and has been proven to be effective in the domain of denoising. The overall architecture of the proposed reconstruction network is shown in Figure 2. Inspired by the SRMnet [30], we incorporated pixel shuffle operations into the encoder and decoder for upsampling and downsampling; this allows us to effectively manage resolution changes in the network and improve the reconstruction quality. The residual attention modules were merged after concatenating the features to enhance the feature representation and capture the relevant information. The encoder and decoder were connected through skip connections to facilitate the flow of information between different feature levels. The multiscale features were combined in the feature fusion module to generate the final reconstructed image. This design enables the network to effectively capture anomalies and produce high-quality reconstructions.

3.2.1. Residual Attention Module

The Residual Attention Modules are integrated after the concatenation of features to enhance feature representation and capture relevant information. These modules leverage residual connections and attention mechanisms to selectively emphasize notable features and suppress irrelevant ones. By focusing on informative regions and enhancing feature discrimination, the residual attention modules improve the network’s ability to generate high-quality reconstructions. In addition, the residual connections address the issue of vanishing gradients. By propagating gradients more effectively through the network, the residual connections enable faster convergence and improve the accuracy of the model. The specific structure of the residual attention module is shown in Figure 3. It comprises global pooling, convolutional, and activation layers. In both pathways, a 1 × 1 convolutional layer is employed to adjust the number of feature channels.

3.2.2. Selective Kernel Feature Fusion (SKFF)

Our decoder generates four feature maps with different resolutions, and we employed the SKFF [31] module for feature fusion. The SKFF allows for the selection of different convolutional kernels at different spatial positions to facilitate the fusion of features from different scales, enabling the integration of multiscale reconstruction features. This approach avoids directly connecting each feature map and instead aggregates weighted features, addressing the issues of a large number of parameters and higher computational complexity in the M-net.

3.3. Metric Function

We employed a metric function that combines the MS-SSIM and 1 proposed by Hang Zhao et al. in [32]. SSIM [33] is a widely used indicator for measuring the structural similarity between images. SSIM mainly considers three key features of images: luminance, contrast, and structure. MS-SSIM uses multiple different Gaussian filters ( σ = σ 1 , , σ M ) on the basis of SSIM. Specifically, for input images x and y of the same size, the luminance similarity of each pixel p is defined as:
l ( p ) = 2 μ x μ y + C 1 μ x 2 + μ y 2 + C 1
where C 1 = 0.01 is a constant used to prevent the denominator from being zero, μ x and μ y represent the weighted sum of patches centered at pixel p in image x and image y, respectively. μ x is defined as follows:
μ x = i = 1 N ω i x i
where the weight coefficient ω i is obtained from a Gaussian function.
Contrast and structural similarity can be represented by a single formula:
c s ( p ) = 2 σ x y + C 2 σ x 2 + σ y 2 + C 2
where C 2 = 0.03 is also a constant used to prevent the denominator from being zero, σ x 2 , σ y 2 , and σ x y represent the variance and covariance of patches centered at pixel p in image x and image y. σ x 2 and σ x y are defined as:
σ x 2 = i = 1 N ω i ( x i μ x ) 2
σ x y = i = 1 N ω i ( x i μ x ) ( y i μ y )
We use the index j = 1 , , M to represent different Gaussian filters. MS-SSIM is defined as:
M S - S S I M ( p ) = l M ( p ) · j = 1 M c s j ( p )
During the training phase, for an image of size H × W , the MS-SSIM loss can be expressed as follows:
L M S - S S I M = 1 H × W p 1 M S - S S I M ( p )
The total loss is calculated by adding the 1 loss multiplied by the Gaussian filter and the weighted MS-SSIM loss. This formula is shown as Equation (9).
L t o t a l = α · L M S - S S I M + ( 1 α ) · G σ M · L 1
where α represents the weight coefficient.
During the inference stage, we calculated the anomaly localization by computing the MS-SSIM and 1 error for each pixel.

4. Experiments

4.1. Datasets

4.1.1. MPDD

MPDD [2] is a challenging dataset that focuses on detecting defects in the manufacturing process of painted metal parts. It reflects the real-world situations encountered by human workers on production lines. The dataset includes six categories of metal parts. The images were captured under various spatial orientations, positions, and distance conditions with different light intensities and non-uniform backgrounds. The training set consisted of 888 normal samples, whereas the test set consisted of 176 normal and 282 abnormal samples.

4.1.2. VisA

VisA [3] consists of 10,821 images. There are 9621 normal and 1200 abnormal images. VisA contains 12 subsets, each corresponding to one class of objects. We assigned 90% of the normal images to the training set, whereas 10% of the normal images and all anomalous samples were grouped as the test set.

4.2. Experimental Details

Our study work was implemented in PyTorch using an NVIDIA GeForce GTX 2080. We resized all the original images of the VisA and the MPDD datasets to 256 × 256 for both training and testing. We divided 20% of the training dataset into validation sets. For each category of these two datasets, we utilized AdamW optimizer [34] with β = ( 0.5 , 0.999 ) . We set the initial learning rate to 10 6 and used cosine annealing [35] to adjust the learning rate with T _ max = 100 and e t a _ min = 10 6 . The maximum number of training epochs was set to 500, and the training was stopped early if the loss did not decrease within 20 consecutive epochs.
We evaluated our approach using different metrics for comparison with other baselines. We used the area under the curve (AUC) of the receiver operating characteristic (ROC) to evaluate the performance of image-level anomaly detection and pixel-level anomaly localization.

4.3. Comparative Experiments

4.3.1. MPDD

We compared our proposed method with several state-of-the-art (SOTA) methods on the MPDD dataset, including reconstruction-based methods [12,21] and feature embedding-based methods [7,8,11]. The image-level detection results are listed in Table 1, and the anomaly segmentation results are presented in Table 2. Experiments demonstrated that our proposed method outperformed previous SOTA methods on the MPDD dataset. The partial visualization results of the proposed method on the MPDD [2] dataset are shown in Figure 4.
Specifically, as shown in Table 1, our proposed method achieved an overall improvement of 8.82% compared to that of the previous best-performing method, CFLOW [11]. The most significant improvement was observed in the tubes that contained multiple instances with a random distribution of positions. These results highlighted the advantages of the proposed method. As shown in Table 2, the best average performance was achieved. However, the proposed method has some limitations. We were unable to achieve satisfactory performance in the brown bracket category. Most defects in the brown bracket category are deformation defects, and our method cannot accurately restore deformations, which hinders the accurate identification of such defects.

4.3.2. VisA

Further, to validate the generalizability and versatility of our method, we compared it with other SOTA methods [7,8,10,11,20,36] on the VisA [3] dataset. The anomaly detection results for the VisA dataset are listed in Table 3. Experiments demonstrated that our proposed method performed competitively on the VisA dataset.

4.4. Ablation Studies

4.4.1. Effect of λ

In this study, we employed a noise-to-norm reconstruction paradigm. To validate the effectiveness of adding noise and the effect of the noise coefficient ( λ ) on the detection results, we conducted comparative experiments. The results, as shown in Table 4, demonstrate that the overall detection performance was the best when λ = 0.3 . Compared to that of the case without added noise ( λ = 0 ), the detection accuracy increased by 22.28 % , and the segmentation accuracy increased by 9.55 % . Therefore, we finally set λ = 0.3 . These experimental results confirm the significant improvement in anomaly detection achieved using the noise-to-norm reconstruction approach.

4.4.2. Importance of Residual Attention Module

To demonstrate the effectiveness of the proposed residual attention module, we conducted an ablation experiment. In the control group, we replaced the residual attention module with a 1 × 1 convolutional layer, which was used to change the number of feature channels. The experimental results, as listed in Table 5, indicate that adding the residual attention module improved the detection accuracy by 28.68 % and the segmentation accuracy by 8.94 % . This demonstrates the significance of incorporating the residual attention module into the model.

5. Conclusions

In this study, an industrial image anomaly detection method based on noise-to-norm reconstruction is proposed. Our proposed method effectively solves the problem of invariant reconstruction of anomalous regions. We enhanced the M-net by incorporating a residual attention module and feature fusion, obtaining a reconstruction network. Our proposed method has significant advantages for handling data with multiple instances and varying object positions. Experimental results demonstrate that our method achieves SOTA performance in anomaly detection and localization on the MPDD dataset, and it also exhibits competitive performance on the VisA dataset.
Our proposed method has limitations in detecting object deformation anomalies. Additionally, when there is noise in the background of certain images in the dataset, it is easy for us to misidentify it as an anomaly. In future work, we will explore methods that combine the feature distribution of positive samples with a reconstruction approach to improve the anomaly detection performance of the model

Author Contributions

Conceptualization, S.D.; methodology, S.D.; validation, S.D. and Z.S.; data curation, S.D.; writing—original draft preparation, S.D.; writing—review and editing, Z.S.; visualization, S.D.; supervision, Z.S.; project administration, R.Z.; funding acquisition, R.Z. and J.G. All authors have read and agreed to the published version of the manuscript.

Funding

This research received no external funding.

Data Availability Statement

The data used to support the findings of this study are included within the article.

Conflicts of Interest

The authors declare no conflict of interest.

References

  1. Bergmann, P.; Fauser, M.; Sattlegger, D.; Steger, C. MVTec AD—A Comprehensive Real-World Dataset for Unsupervised Anomaly Detection. In Proceedings of the 2019 IEEE/CVF Conference on Computer Vision and Pattern Recognition (CVPR), Long Beach, CA, USA, 15–20 June 2019; pp. 9584–9592. [Google Scholar] [CrossRef]
  2. Jezek, S.; Jonak, M.; Burget, R.; Dvorak, P.; Skotak, M. Deep learning-based defect detection of metal parts: Evaluating current methods in complex conditions. In Proceedings of the 2021 13th International Congress on Ultra Modern Telecommunications and Control Systems and Workshops (ICUMT), Brno, Czech Republic, 25–27 October 2021; pp. 66–71. [Google Scholar] [CrossRef]
  3. Zou, Y.; Jeong, J.; Pemula, L.; Zhang, D.; Dabeer, O. SPot-the-Difference Self-supervised Pre-training for Anomaly Detection and Segmentation. In Proceedings of the Computer Vision—ECCV 2022, Tel Aviv, Israel, 23–27 October 2022; Springer: Cham, Switzerland, 2022; pp. 392–408. [Google Scholar]
  4. Menze, B.H.; Jakab, A.; Bauer, S.; Kalpathy-Cramer, J.; Farahani, K.; Kirby, J.; Burren, Y.; Porz, N.; Slotboom, J.; Wiest, R.; et al. The Multimodal Brain Tumor Image Segmentation Benchmark (BRATS). IEEE Trans. Med. Imaging 2015, 34, 1993–2024. [Google Scholar] [CrossRef] [PubMed]
  5. Lu, C.; Shi, J.; Jia, J. Abnormal Event Detection at 150 FPS in MATLAB. In Proceedings of the 2013 IEEE International Conference on Computer Vision, Sydney, NSW, Australia, 1–8 December 2013; pp. 2720–2727. [Google Scholar] [CrossRef]
  6. Zhang, Y.; Zhou, D.; Chen, S.; Gao, S.; Ma, Y. Single-Image Crowd Counting via Multi-Column Convolutional Neural Network. In Proceedings of the Proceedings of the IEEE Conference on Computer Vision and Pattern Recognition (CVPR), Las Vegas, NV, USA, 27–30 June 2016. [Google Scholar]
  7. Defard, T.; Setkov, A.; Loesch, A.; Audigier, R. PaDiM: A Patch Distribution Modeling Framework for Anomaly Detection and Localization. In Proceedings of the Pattern Recognition. ICPR International Workshops and Challenges, Virtual Event, 10–15 January 2021; Springer: Cham, Switzerland, 2021; pp. 475–489. [Google Scholar]
  8. Roth, K.; Pemula, L.; Zepeda, J.; Schölkopf, B.; Brox, T.; Gehler, P. Towards Total Recall in Industrial Anomaly Detection. In Proceedings of the 2022 IEEE/CVF Conference on Computer Vision and Pattern Recognition (CVPR), New Orleans, LA, USA, 18–24 June 2022; pp. 14298–14308. [Google Scholar] [CrossRef]
  9. Sun, Z.; He, Y.; Gritsenko, A.; Lendasse, A.; Baek, S. Embedded spectral descriptors: Learning the point-wise correspondence metric via Siamese neural networks. J. Comput. Des. Eng. 2020, 7, 18–29. [Google Scholar] [CrossRef]
  10. Yu, J.; Zheng, Y.; Wang, X.; Li, W.; Wu, Y.; Zhao, R.; Wu, L. FastFlow: Unsupervised Anomaly Detection and Localization via 2D Normalizing Flows. arXiv 2021, arXiv:2111.07677. [Google Scholar]
  11. Gudovskiy, D.; Ishizaka, S.; Kozuka, K. CFLOW-AD: Real-Time Unsupervised Anomaly Detection with Localization via Conditional Normalizing Flows. In Proceedings of the 2022 IEEE/CVF Winter Conference on Applications of Computer Vision (WACV), Waikoloa, HI, USA, 3–8 January 2022; pp. 1819–1828. [Google Scholar] [CrossRef]
  12. Akçay, S.; Atapour-Abarghouei, A.; Breckon, T.P. Skip-GANomaly: Skip Connected and Adversarially Trained Encoder-Decoder Anomaly Detection. In Proceedings of the 2019 International Joint Conference on Neural Networks (IJCNN), Budapest, Hungary, 14–19 July 2019; pp. 1–8. [Google Scholar] [CrossRef]
  13. Liu, T.; Li, B.; Zhao, Z.; Du, X.; Jiang, B.; Geng, L. Reconstruction from edge image combined with color and gradient difference for industrial surface anomaly detection. arXiv 2022, arXiv:2210.14485. [Google Scholar]
  14. Liang, Y.; Zhang, J.; Zhao, S.; Wu, R.C.; Liu, Y.; Pan, S. Omni-frequency Channel-selection Representations for Unsupervised Anomaly Detection. arXiv 2022, arXiv:2203.00259. [Google Scholar] [CrossRef] [PubMed]
  15. Zhang, Z.; Zhao, Z.; Zhang, X.; Sun, C.; Chen, X. Industrial Anomaly Detection with Domain Shift: A Real-world Dataset and Masked Multi-scale Reconstruction. arXiv 2023, arXiv:2304.02216. [Google Scholar] [CrossRef]
  16. Mehta, R.; Sivaswamy, J. M-net: A Convolutional Neural Network for deep brain structure segmentation. In Proceedings of the 2017 IEEE 14th International Symposium on Biomedical Imaging (ISBI 2017), Melbourne, VIC, Australia, 18–21 April 2017; pp. 437–440. [Google Scholar] [CrossRef]
  17. Zheng, Y.; Wang, X.; Deng, R.; Bao, T.; Zhao, R.; Wu, L. Focus Your Distribution: Coarse-to-Fine Non-Contrastive Learning for Anomaly Detection and Localization. In Proceedings of the 2022 IEEE International Conference on Multimedia and Expo (ICME), Taipei, Taiwan, 18–22 July 2022; pp. 1–6. [Google Scholar] [CrossRef]
  18. Rudolph, M.; Wehrbein, T.; Rosenhahn, B.; Wandt, B. Fully Convolutional Cross-Scale-Flows for Image-based Defect Detection. In Proceedings of the 2022 IEEE/CVF Winter Conference on Applications of Computer Vision (WACV), Waikoloa, HI, USA, 3–8 January 2022; pp. 1829–1838. [Google Scholar] [CrossRef]
  19. Shi, Y.; Yang, J.; Qi, Z. Unsupervised anomaly segmentation via deep feature reconstruction. Neurocomputing 2021, 424, 9–22. [Google Scholar] [CrossRef]
  20. Zavrtanik, V.; Kristan, M.; Skočaj, D. DRÆM – A discriminatively trained reconstruction embedding for surface anomaly detection. In Proceedings of the 2021 IEEE/CVF International Conference on Computer Vision (ICCV), Montreal, QC, Canada, 10–17 October 2021; pp. 8310–8319. [Google Scholar] [CrossRef]
  21. Tang, T.W.; Kuo, W.H.; Lan, J.H.; Ding, C.F.; Hsu, H.; Young, H.T. Anomaly Detection Neural Network with Dual Auto-Encoders GAN and Its Industrial Inspection Applications. Sensors 2020, 20, 3336. [Google Scholar] [CrossRef] [PubMed]
  22. Zavrtanik, V.; Kristan, M.; Skočaj, D. Reconstruction by inpainting for visual anomaly detection. Pattern Recognit. 2021, 112, 107706. [Google Scholar] [CrossRef]
  23. Pirnay, J.; Chai, K. Inpainting Transformer for Anomaly Detection. In Proceedings of the Image Analysis and Processing—ICIAP 2022, Lecce, Italy, 23–27 May 2022; Springer: Cham, Switzerland, 2022; pp. 394–406. [Google Scholar]
  24. Jiang, J.; Zhu, J.; Bilal, M.; Cui, Y.; Kumar, N.; Dou, R.; Su, F.; Xu, X. Masked Swin Transformer Unet for Industrial Anomaly Detection. IEEE Trans. Ind. Inform. 2023, 19, 2200–2209. [Google Scholar] [CrossRef]
  25. Ronneberger, O.; Fischer, P.; Brox, T. U-Net: Convolutional Networks for Biomedical Image Segmentation. In Proceedings of the Medical Image Computing and Computer-Assisted Intervention—MICCAI 2015, Munich, Germany, 5–9 October 2015; Navab, N., Hornegger, J., Wells, W.M., Frangi, A.F., Eds.; Springer: Cham, Switzerland, 2015; pp. 234–241. [Google Scholar]
  26. Li, C.; Tan, Y.; Chen, W.; Luo, X.; Gao, Y.; Jia, X.; Wang, Z. Attention Unet++: A Nested Attention-Aware U-Net for Liver CT Image Segmentation. In Proceedings of the 2020 IEEE International Conference on Image Processing (ICIP), Abu Dhabi, United Arab Emirates, 25–28 October 2020; pp. 345–349. [Google Scholar] [CrossRef]
  27. Li, H.; He, Y.; Xu, Q.; Deng, J.; le Li, W.; Wei, Y.; Zhou, J. Sematic segmentation of loess landslides with STAPLE mask and fully connected conditional random field. Landslides 2022, 20, 367–380. [Google Scholar] [CrossRef]
  28. Cao, H.; Wang, Y.; Chen, J.; Jiang, D.; Zhang, X.; Tian, Q.; Wang, M. Swin-Unet: Unet-Like Pure Transformer for Medical Image Segmentation. In Proceedings of the Computer Vision—ECCV 2022 Workshops, Tel Aviv, Israel, 23–27 October 2022; Karlinsky, L., Michaeli, T., Nishino, K., Eds.; Springer: Cham, Switzerland, 2023; pp. 205–218. [Google Scholar]
  29. Sun, Z.; Rooke, E.; Charton, J.; He, Y.; Lu, J.; Baek, S. ZerNet: Convolutional Neural Networks on Arbitrary Surfaces Via Zernike Local Tangent Space Estimation. Comput. Graph. Forum 2020, 39, 204–216. [Google Scholar] [CrossRef]
  30. Fan, C.M.; Liu, T.J.; Liu, K.H.; Chiu, C.H. Selective Residual M-Net for Real Image Denoising. In Proceedings of the 2022 30th European Signal Processing Conference (EUSIPCO), Belgrade, Serbia, 29 August–2 September 2022; pp. 469–473. [Google Scholar] [CrossRef]
  31. Zamir, S.W.; Arora, A.; Khan, S.; Hayat, M.; Khan, F.S.; Yang, M.H.; Shao, L. Learning Enriched Features for Real Image Restoration and Enhancement. In Proceedings of the Computer Vision—ECCV 2020, Glasgow, UK, 23–28 August 2020; Springer: Cham, Switzerland, 2020; pp. 492–511. [Google Scholar]
  32. Zhao, H.; Gallo, O.; Frosio, I.; Kautz, J. Loss Functions for Image Restoration With Neural Networks. IEEE Trans. Comput. Imaging 2017, 3, 47–57. [Google Scholar] [CrossRef]
  33. Wang, Z.; Bovik, A.; Sheikh, H.; Simoncelli, E. Image quality assessment: From error visibility to structural similarity. IEEE Trans. Image Process. 2004, 13, 600–612. [Google Scholar] [CrossRef] [PubMed]
  34. Loshchilov, I.; Hutter, F. Decoupled Weight Decay Regularization. In Proceedings of the International Conference on Learning Representations, Toulon, France, 24–26 April 2017. [Google Scholar]
  35. Loshchilov, I.; Hutter, F. SGDR: Stochastic Gradient Descent with Warm Restarts. arXiv 2016, arXiv:1608.03983. [Google Scholar]
  36. Deng, H.; Li, X. Anomaly Detection via Reverse Distillation from One-Class Embedding. In Proceedings of the 2022 IEEE/CVF Conference on Computer Vision and Pattern Recognition (CVPR), New Orleans, LA, USA, 18–24 June 2022; pp. 9727–9736. [Google Scholar] [CrossRef]
Figure 1. Framework of the proposed method.
Applsci 13 12436 g001
Figure 2. The overall architecture of the proposed reconstruction network.
Applsci 13 12436 g002
Figure 3. Illustration of the residual attention module.
Applsci 13 12436 g003
Figure 4. Visualization of examples on MPDD. (a) Original image (b) Ground truth (c) Reconstructed image (d) Anomaly map (e) Prediction of anomalous regions (f) Prediction of anomalous regions on the original image.
Applsci 13 12436 g004
Table 1. Comparison of image-level detection results (AUROC%) on the MPDD dataset.
MethodDAGANSkip-GANomalyPaDiMCFLOWPatchCoreOurs
Bracket Black68.5561.3075.6072.6781.8893.42
Bracket Brown77.0762.1485.4088.8478.4393.14
Bracket White72.1173.3382.2287.7876.0089.33
Connector99.7673.6291.6794.7696.67100.00
Metal Plate85.4373.2456.3099.51100.0099.57
Tubes31.9346.4257.5173.1459.7394.16
Avg.72.4864.8474.7886.1282.1294.94
Best results are highlighted in bold.
Table 2. Comparison of pixel-level detection results (AUROC%) on the MPDD dataset.
MethodDAGANSkip-GANomalyPaDiMCFLOWPatchCoreOurs
Bracket Black89.7388.9694.2396.8898.4198.97
Bracket Brown81.5078.0792.4497.7891.4693.10
Bracket White70.6378.8198.1198.6197.4497.82
Connector85.7380.2097.8998.3995.0098.95
Metal Plate89.9589.7292.9398.2196.5798.78
Tubes82.3177.3093.9496.4395.0599.17
Avg.83.3182.1996.7497.7295.6697.80
Best results are highlighted in bold.
Table 3. Comparison of image-level detection results (AUROC%) on the VisA dataset.
MethodDRAEMRD4ADPaDiMCFLOWFastFlowPatchCoreOurs
Candle94.492.291.697.092.898.683.7
Capsules76.390.170.793.071.281.693.3
Cashew90.799.693.090.991.097.393.4
Chewing gum94.299.798.898.391.499.197.7
Fryum97.496.688.691.188.696.297.3
Macaroni195.098.487.069.698.397.591.6
Macaroni296.297.670.577.286.378.191.5
PCB154.897.694.791.477.498.594.7
PCB277.891.188.596.761.997.395.6
PCB394.595.591.099.674.397.998.7
PCB493.496.597.594.280.999.698.2
Pipe fryum99.497.097.099.072.099.892.6
Avg.88.796.089.191.582.295.194.0
Best results are highlighted in bold.
Table 4. Effect of noise coefficient ( λ ) on image/pixel-level detection results (AUROC%).
Noise Coefficient λ = 0 λ = 0.2 λ = 0.3 λ = 0.4
Bracket Black47.61/77.2183.71/98.1693.42/98.9790.56/99.02
Bracket Brown82.50/83.9390.57/91.8493.14/93.1084.09/92.86
Bracket White74.89/89.8292.78/98.3589.33/97.8283.22/96.74
Connector96.67/93.70100.00/98.78100.00/98.95100.00/98.80
Metal Plate97.83/97.8898.92/98.9699.57/98.7899.30/98.40
Tubes39.45/85.8897.06/98.6194.16/99.1793.75/99.44
Avg.73.16/88.0793.84/97.4594.94/97.8091.82/97.54
Best results are highlighted in bold.
Table 5. Effect of residual attention module on image/pixel-level detection results (AUROC%).
Image-LevelPixel-Level
Residual Attention module
Bracket Black93.4250.4798.9789.36
Bracket Brown93.1475.3293.1080.36
Bracket White92.3365.9296.7585.74
Connector100.0062.3898.9594.99
Metal Plate99.5788.6198.7896.69
Tubes94.1657.8799.1784.93
Avg.95.4466.7697.6288.68
Best results are highlighted in bold.
Disclaimer/Publisher’s Note: The statements, opinions and data contained in all publications are solely those of the individual author(s) and contributor(s) and not of MDPI and/or the editor(s). MDPI and/or the editor(s) disclaim responsibility for any injury to people or property resulting from any ideas, methods, instructions or products referred to in the content.

