
The Influence of Vertical Seismic Acceleration on the Triggering of Landslides Constrained by Bedding Faults under an Inertial Frame Reference: The Case of the Daguangbao (DGB) Landslide


 ,
, 
Abstract
:1. Introduction
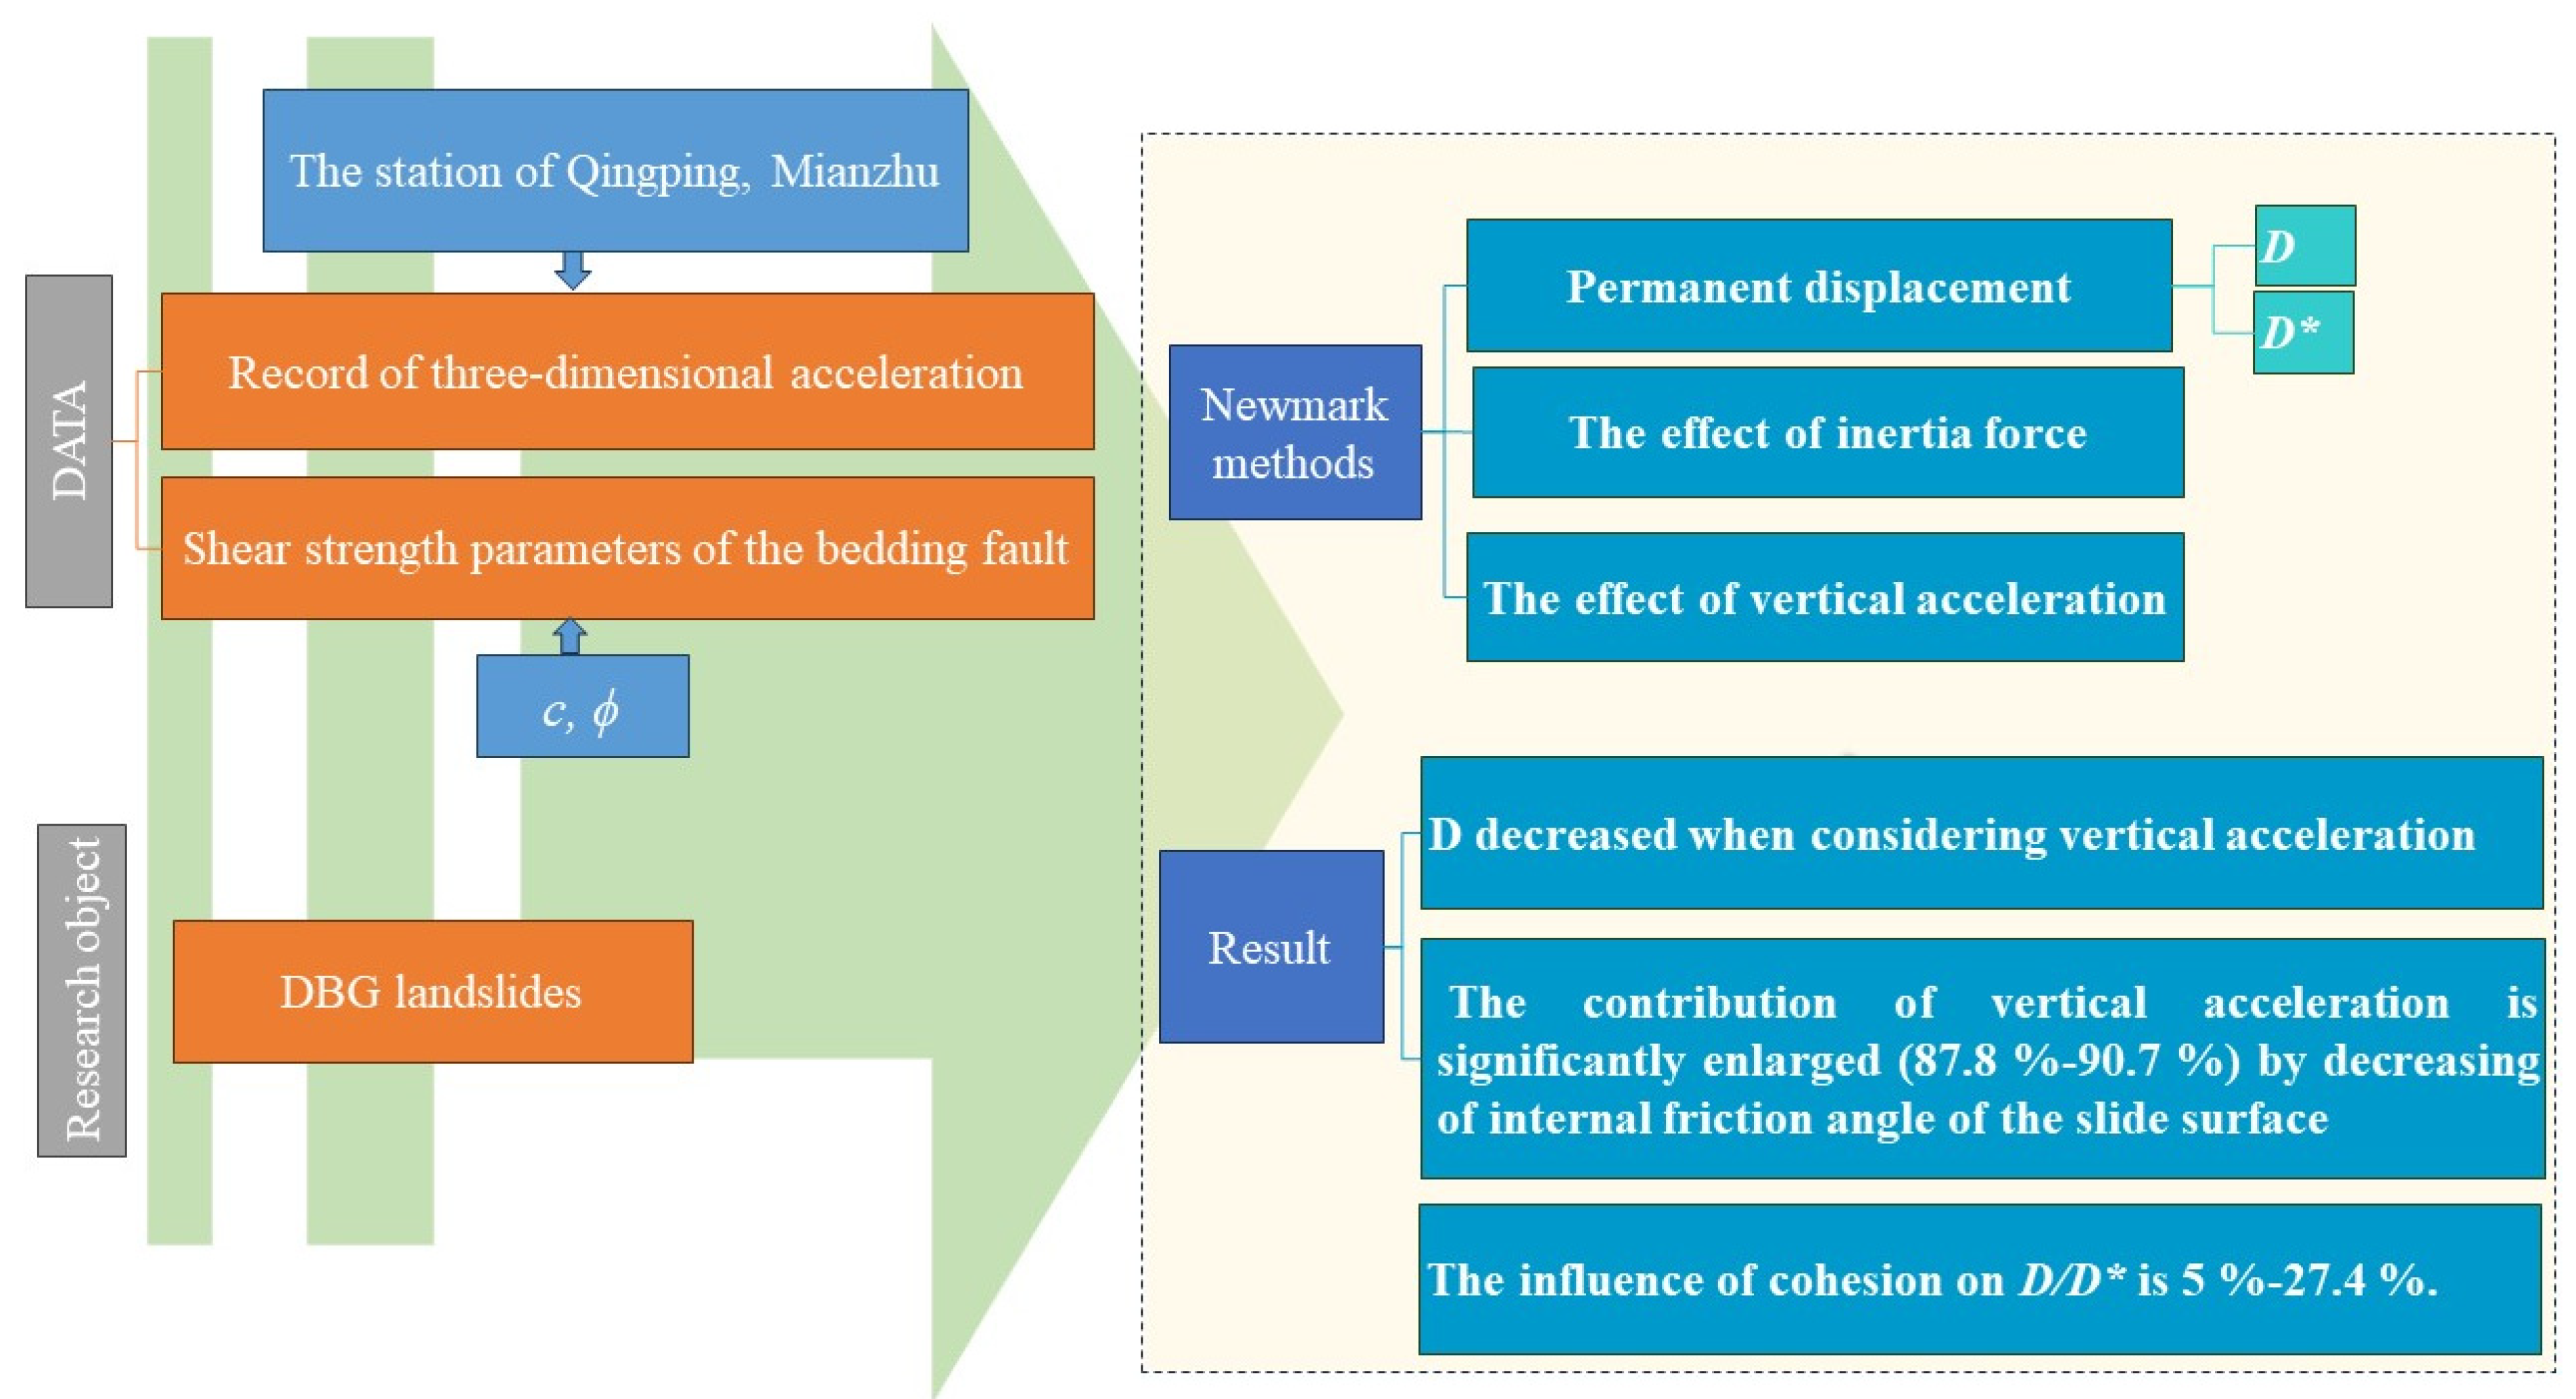
2. Materials and Methods
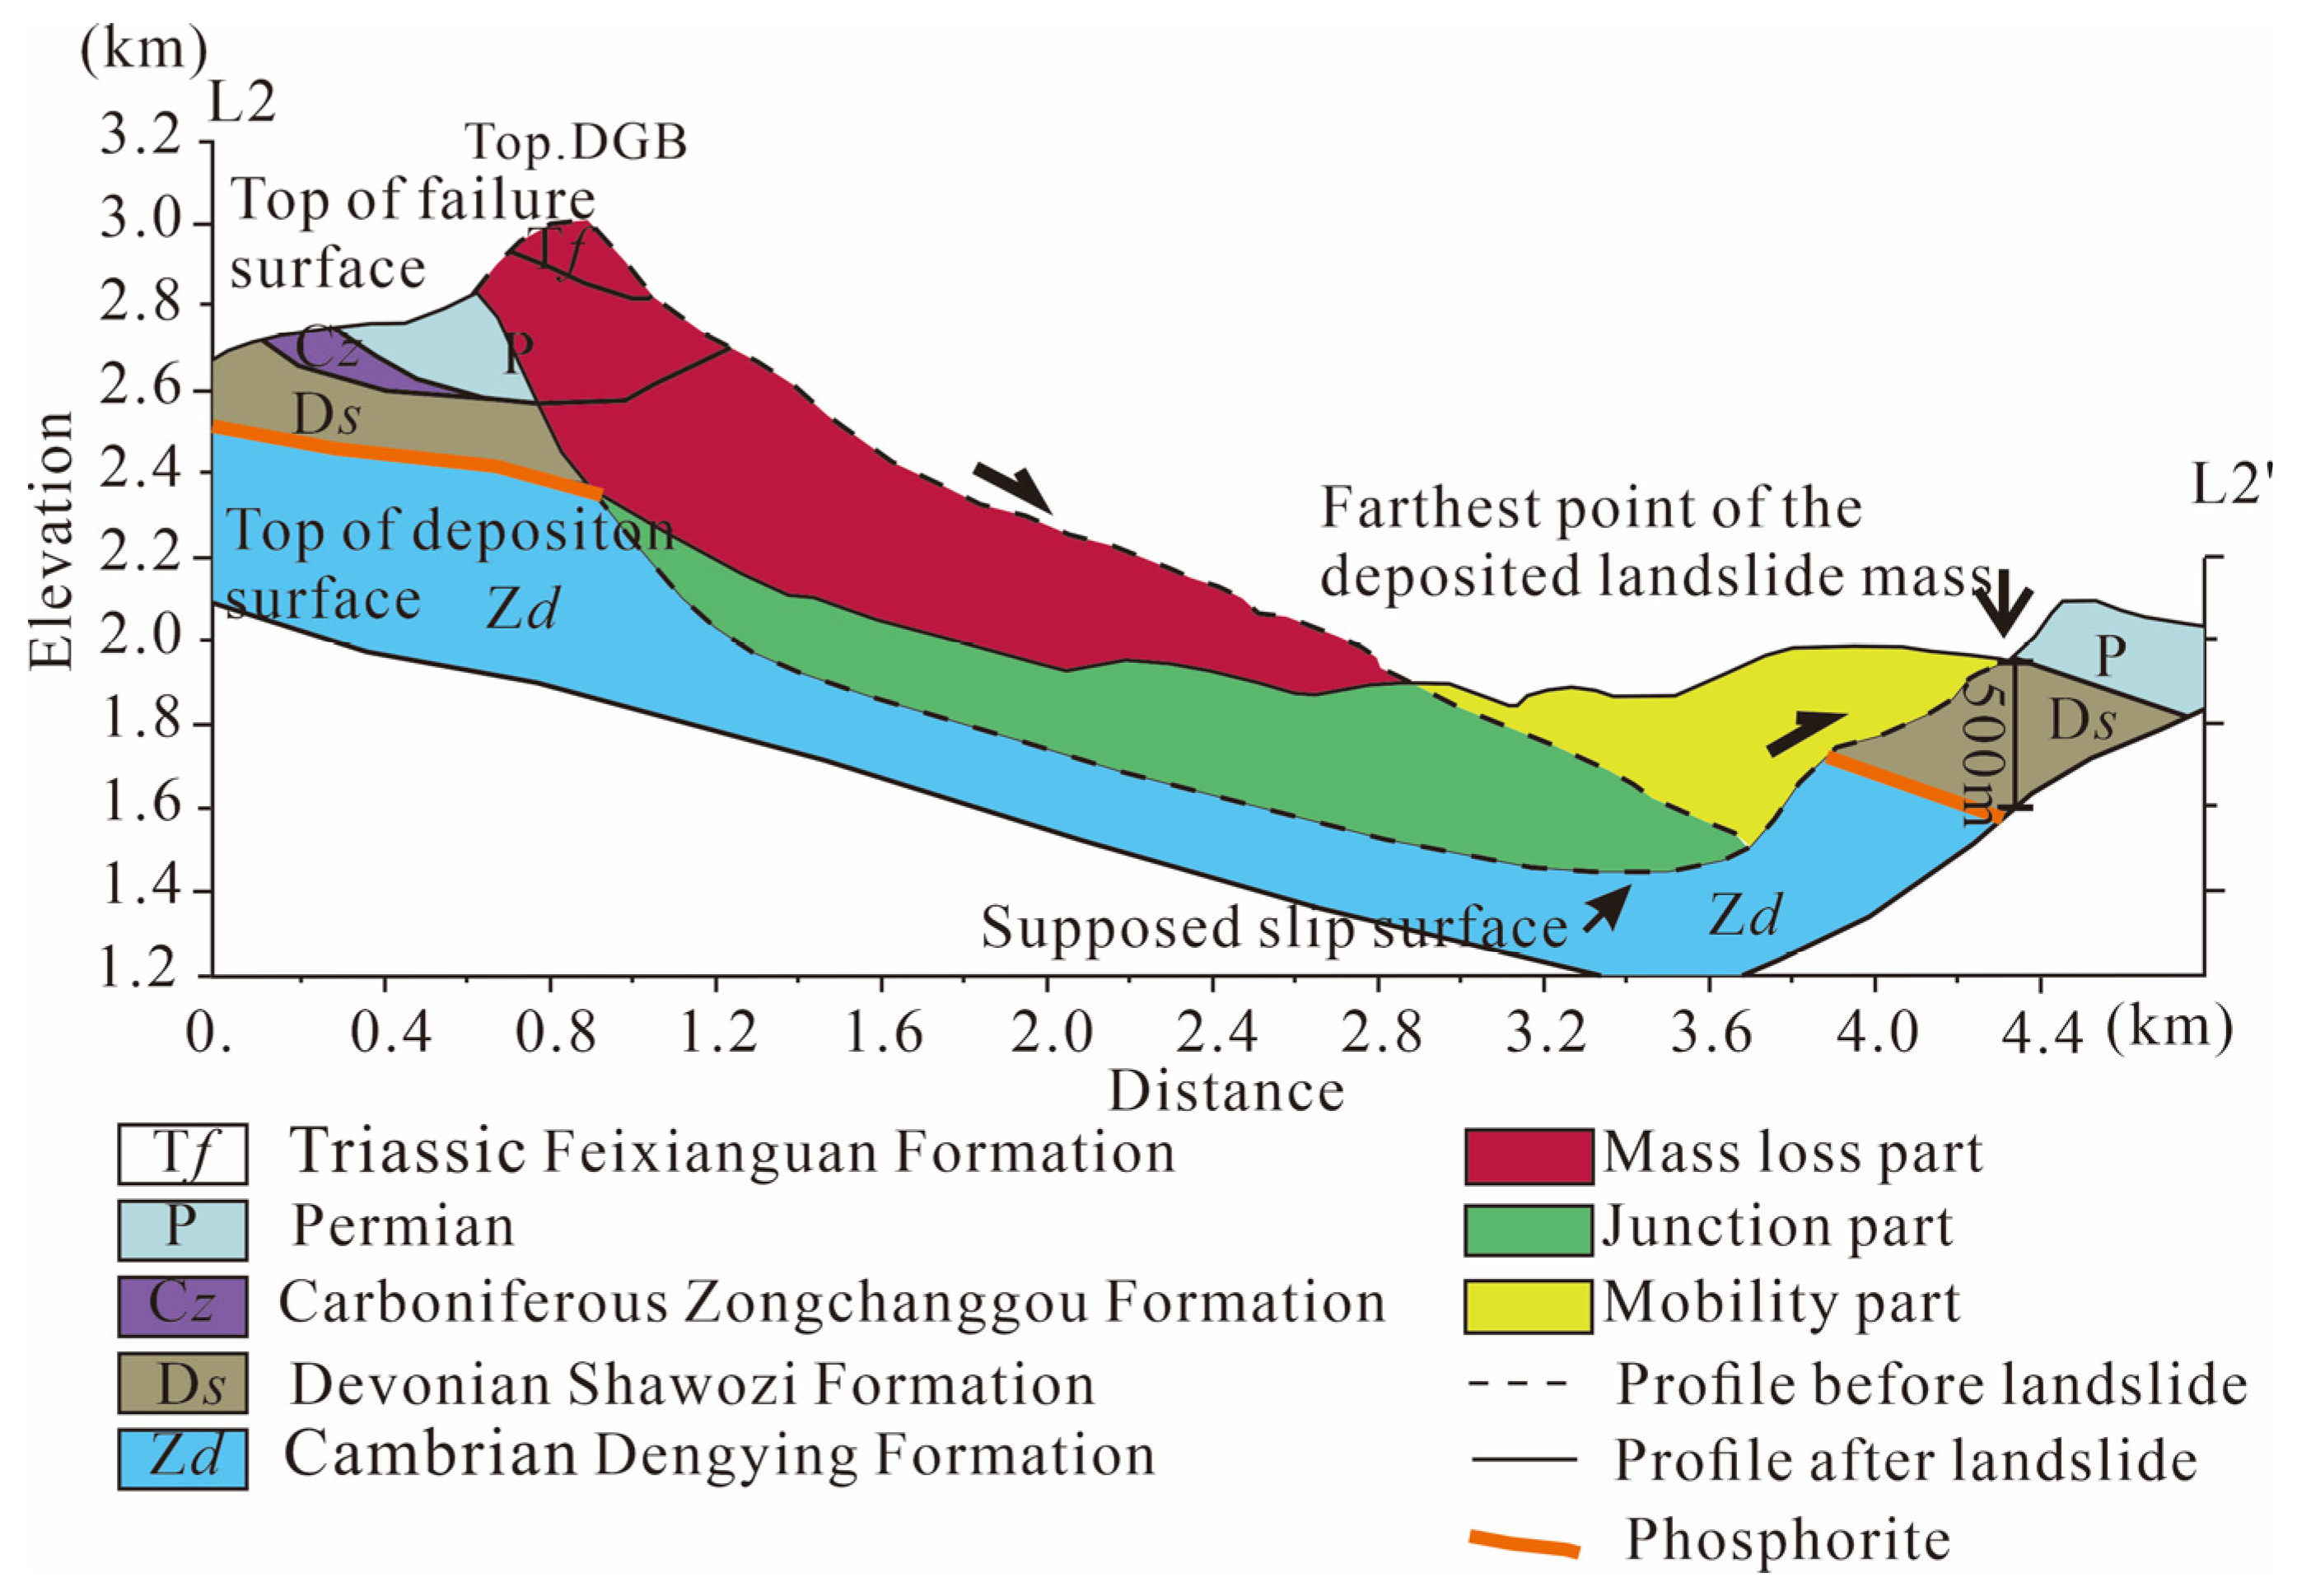
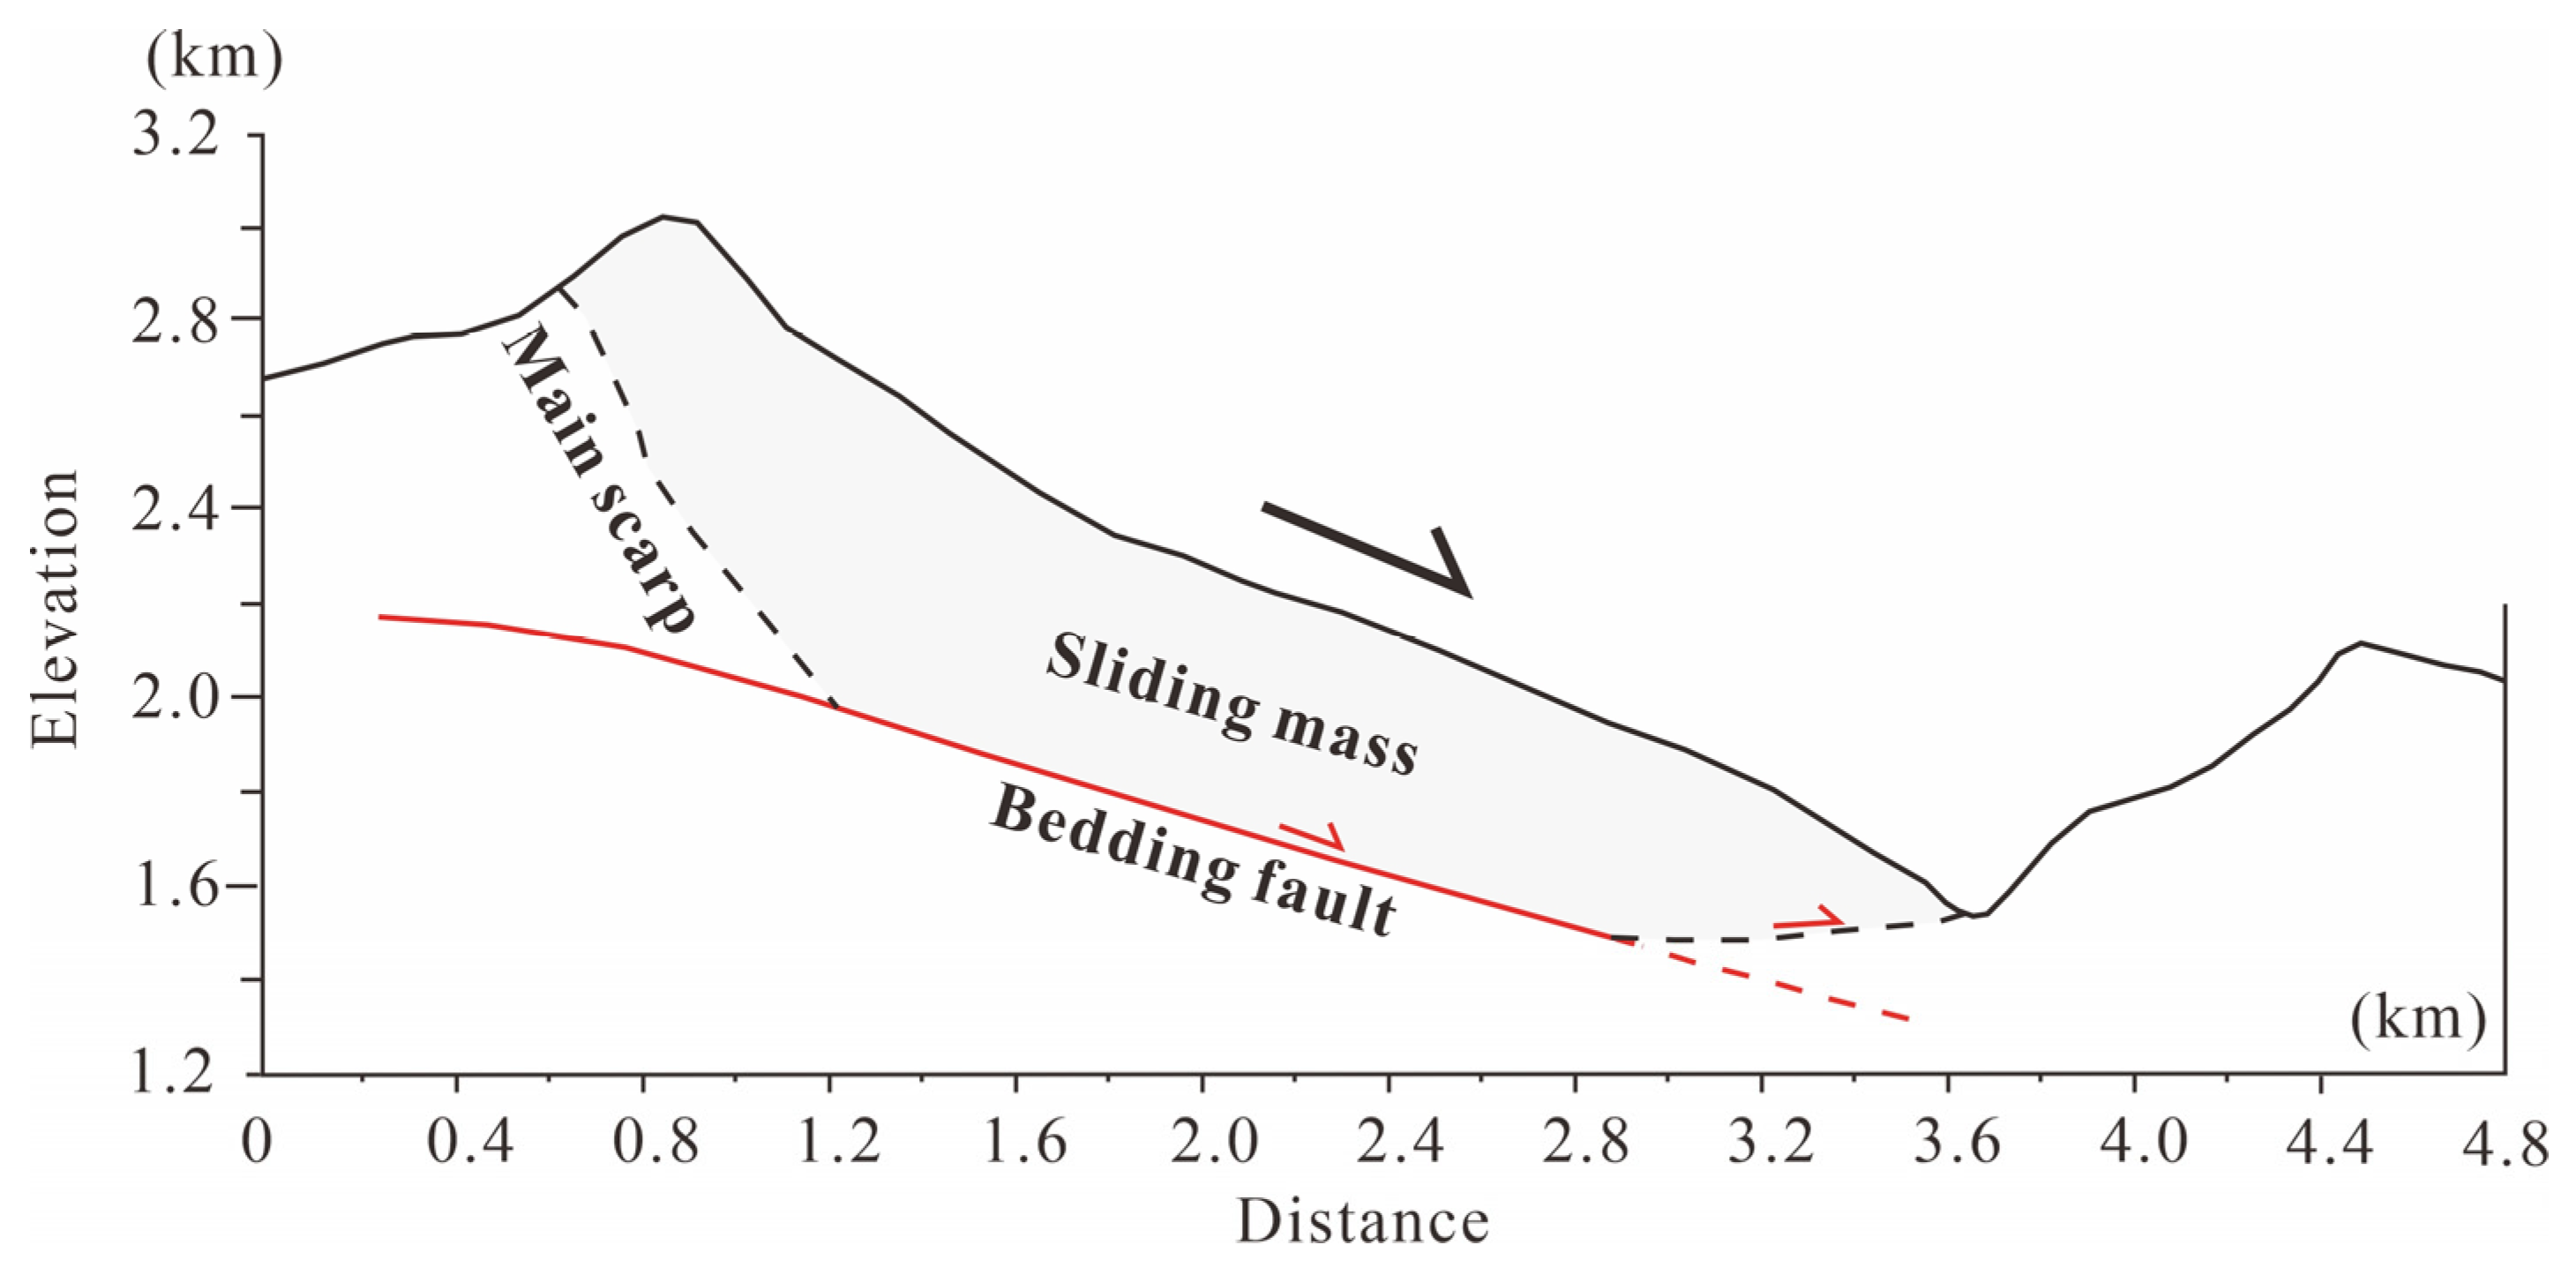
2.1. Study Area
2.2. Methods
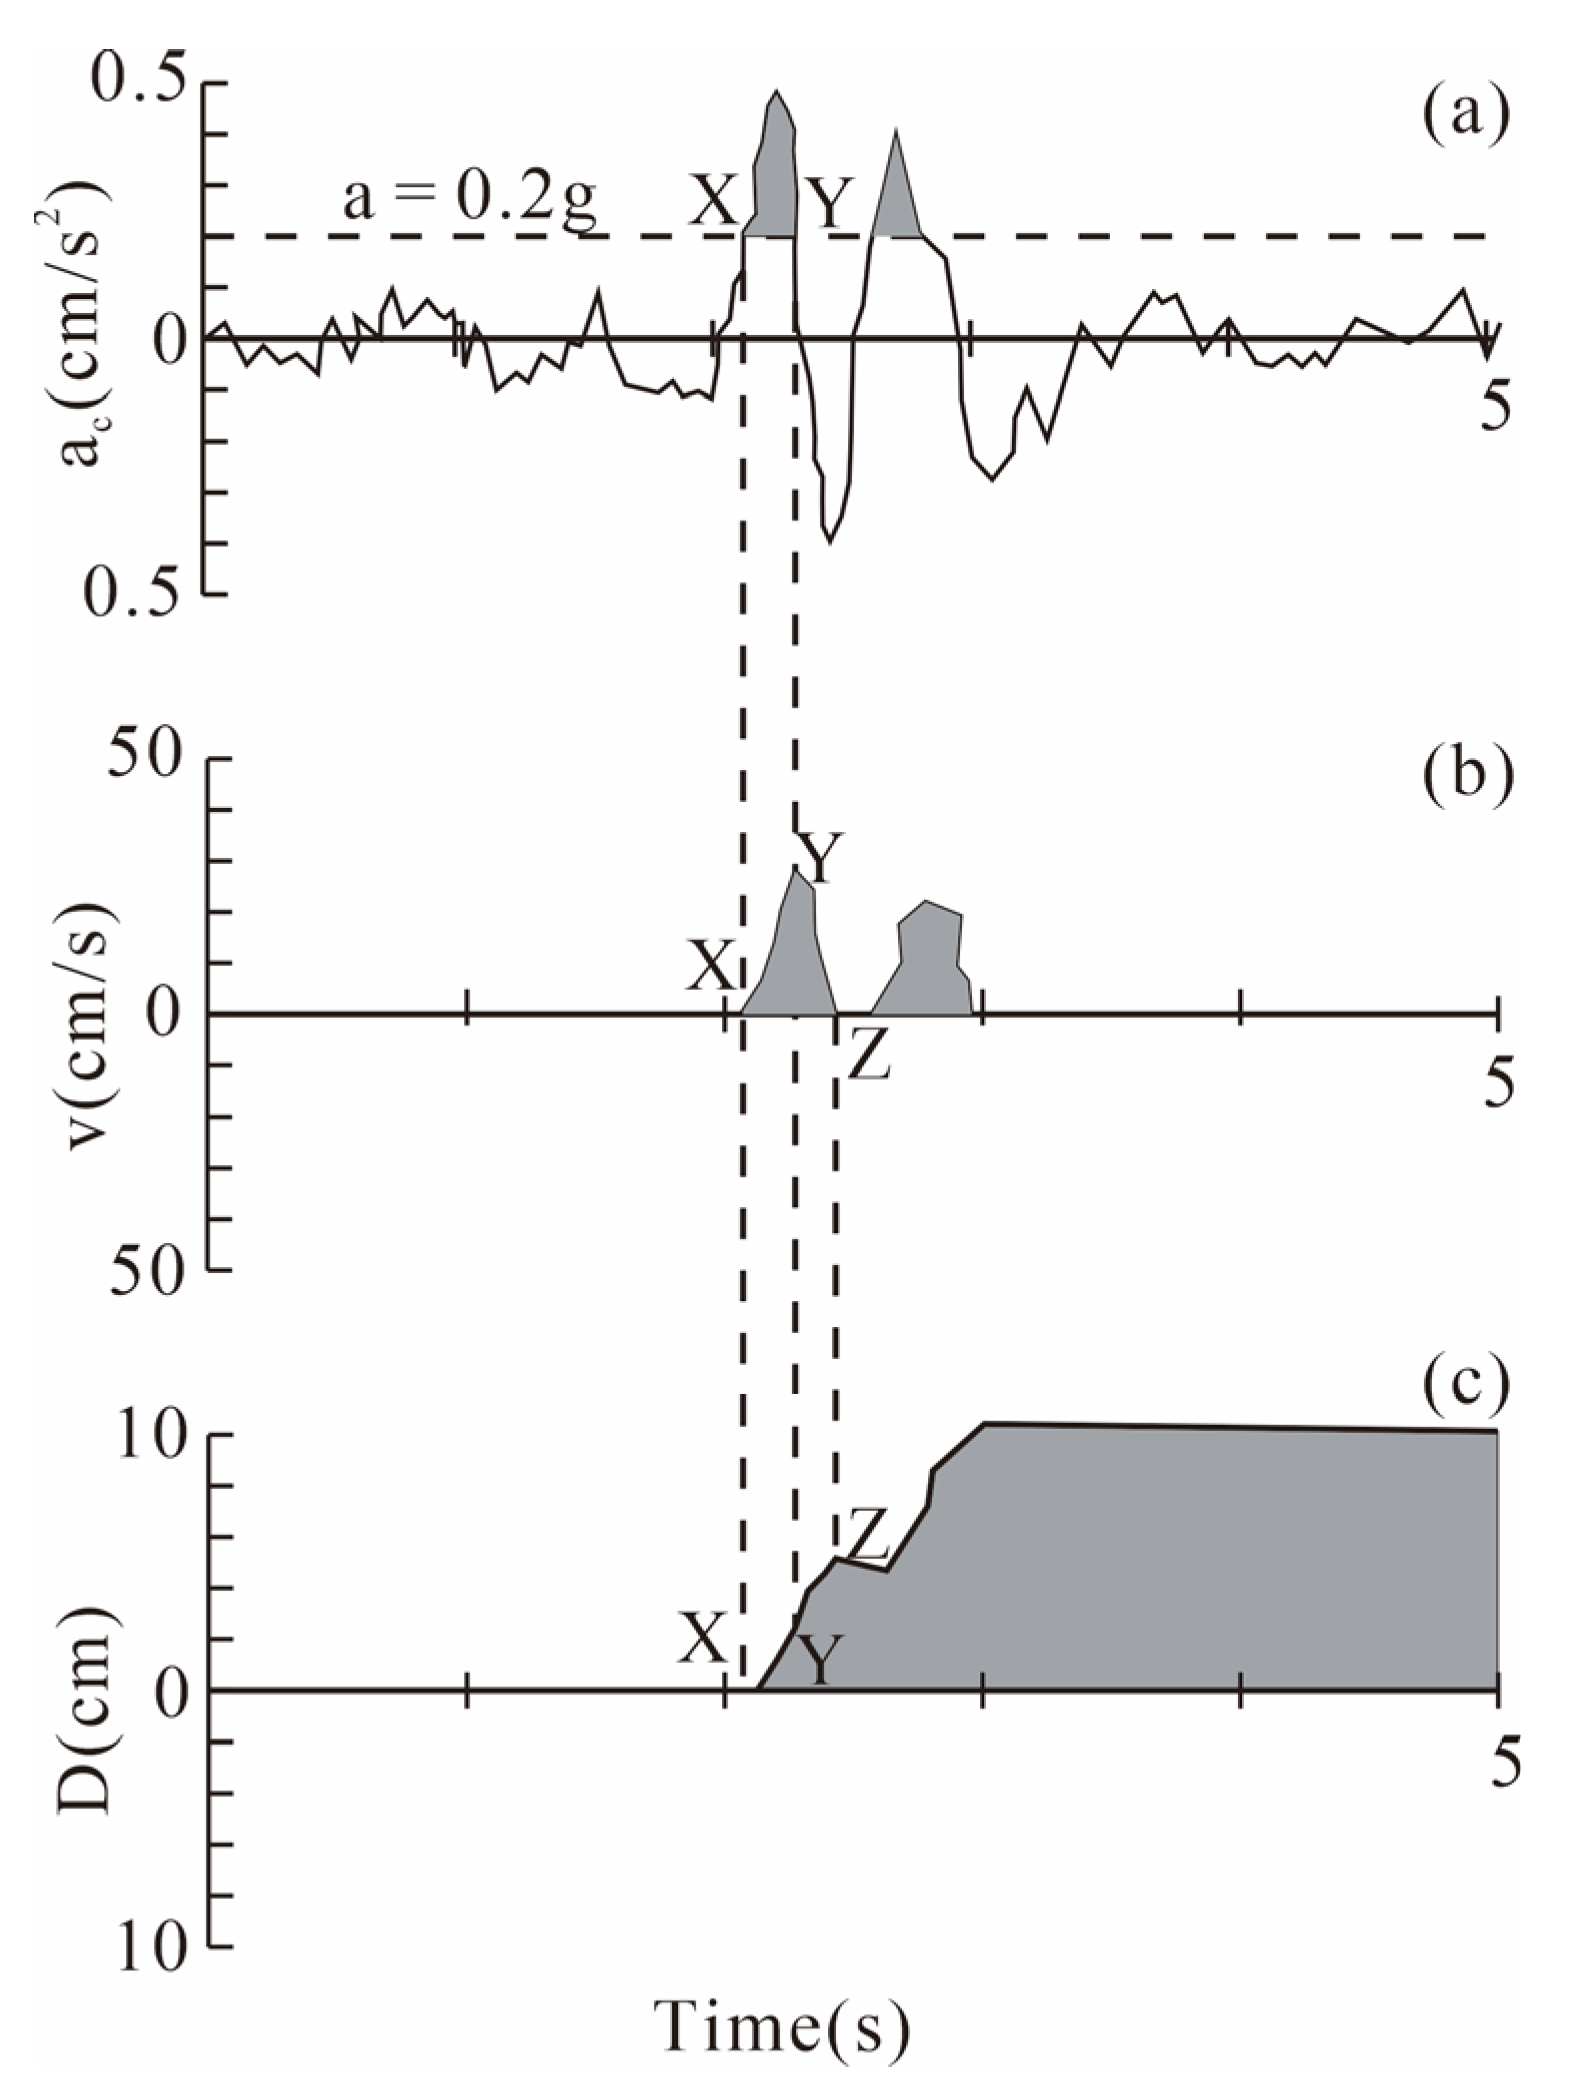
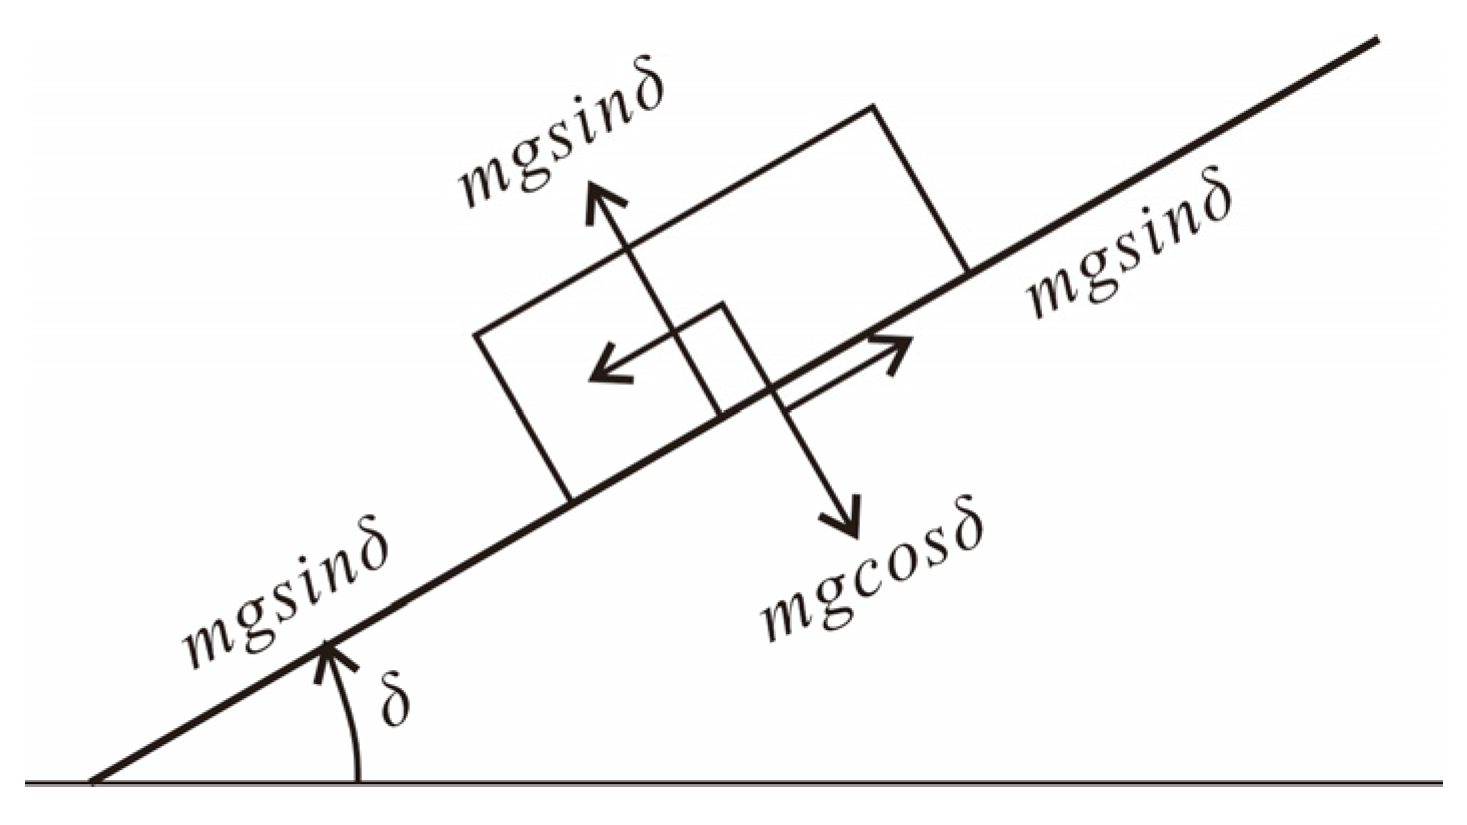
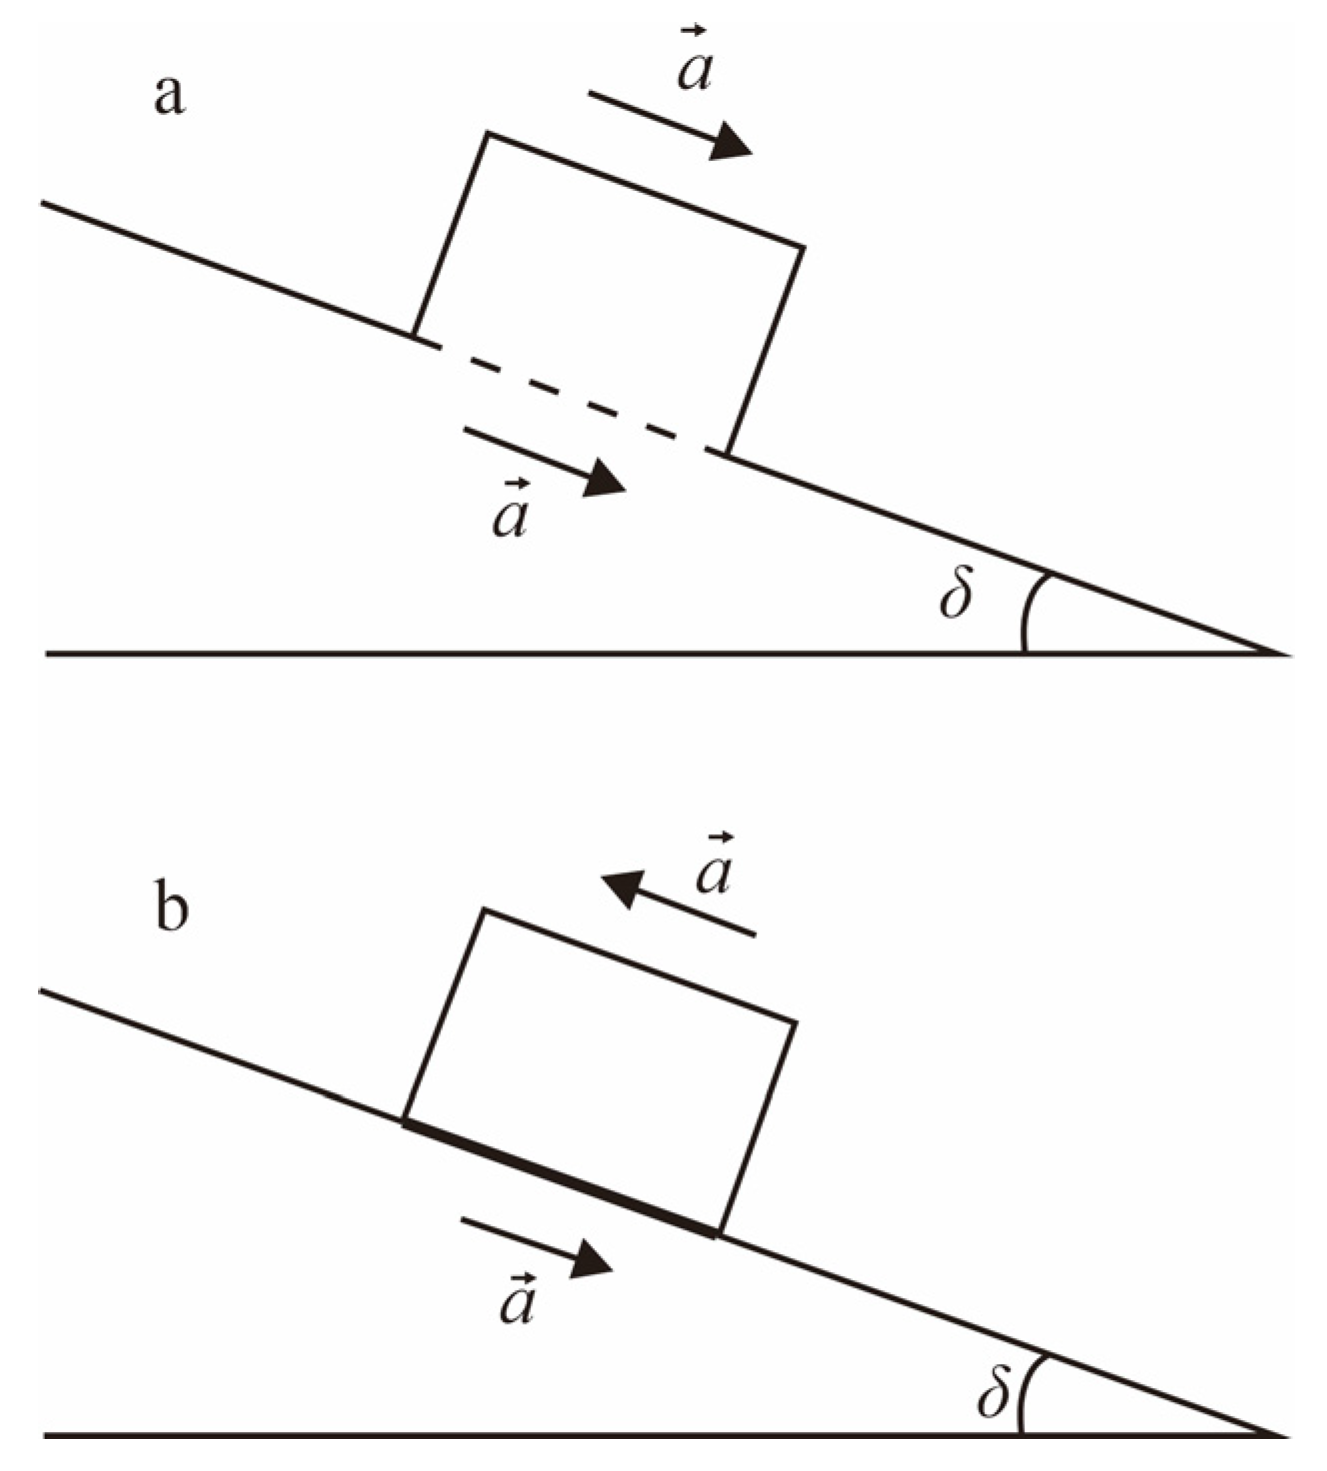
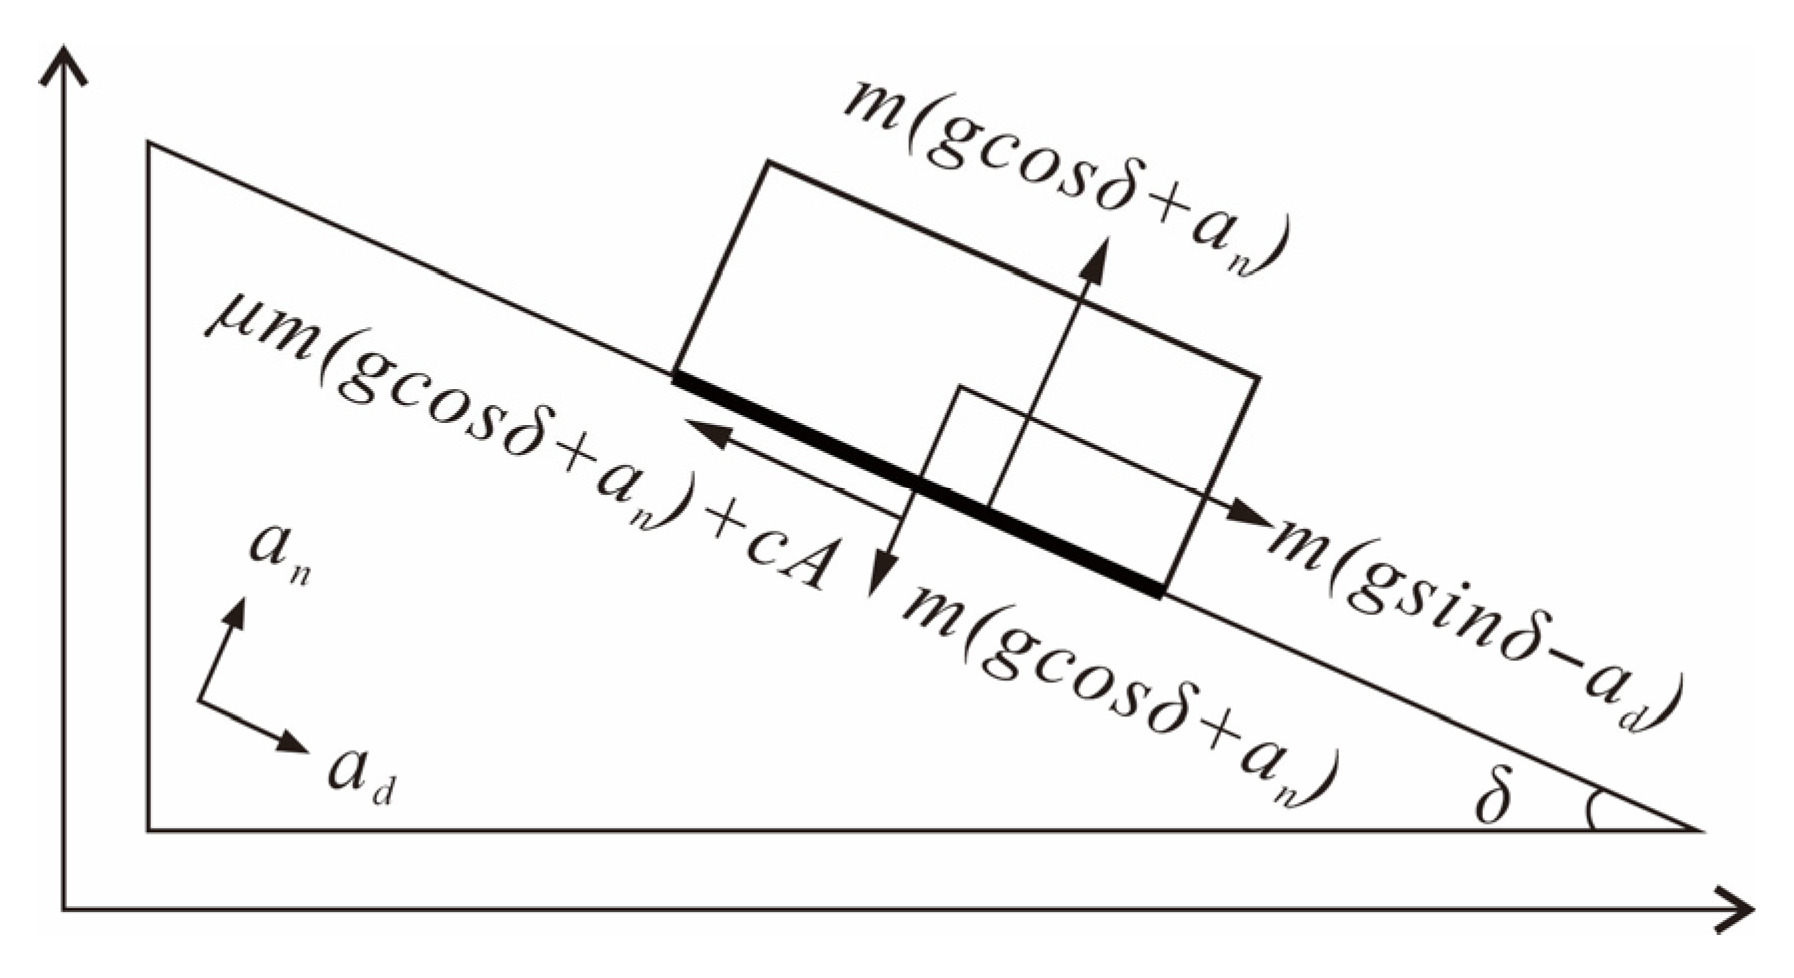
2.2.1. The Permanent Displacement Analysis
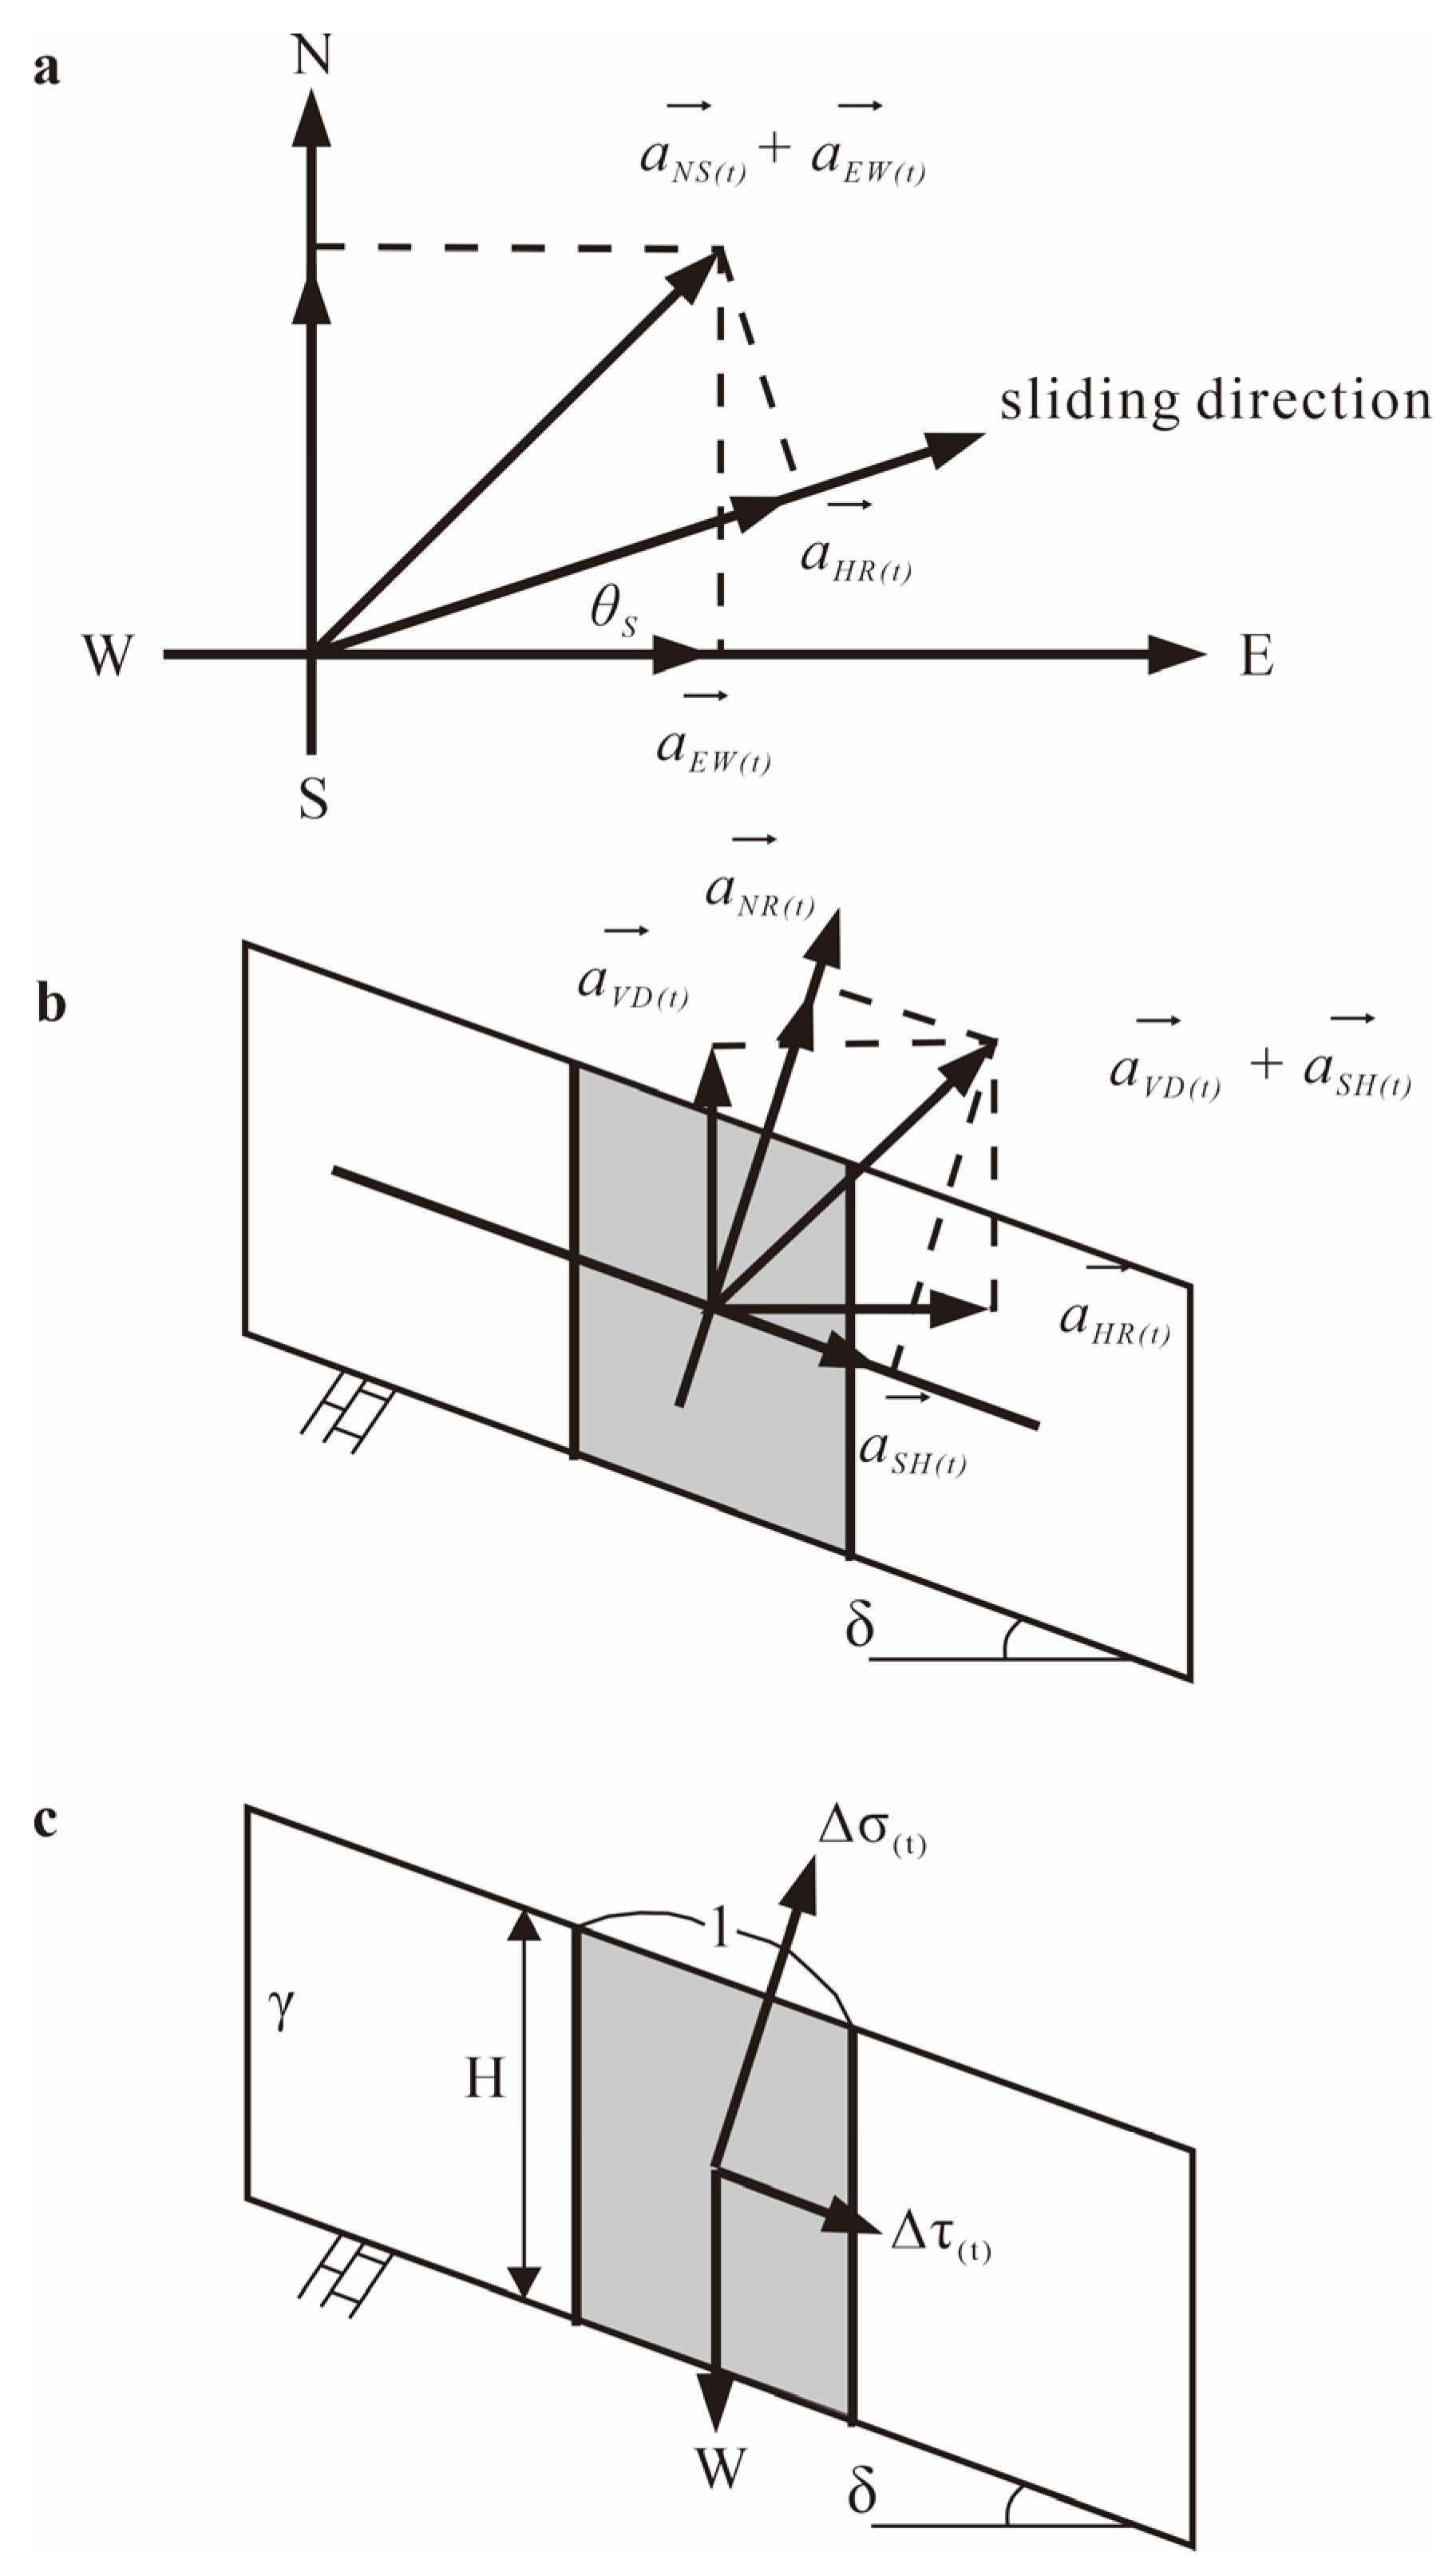
2.2.2. Description of Three-Dimensional Acceleration
2.2.3. Shear Strength Parameters of the Bedding Fault
3. Results
3.1. Permanent Displacement
3.2. The Effect of Inertia Force
3.3. The Effect of Vertical Acceleration
4. Discussion
5. Conclusions
- (1)
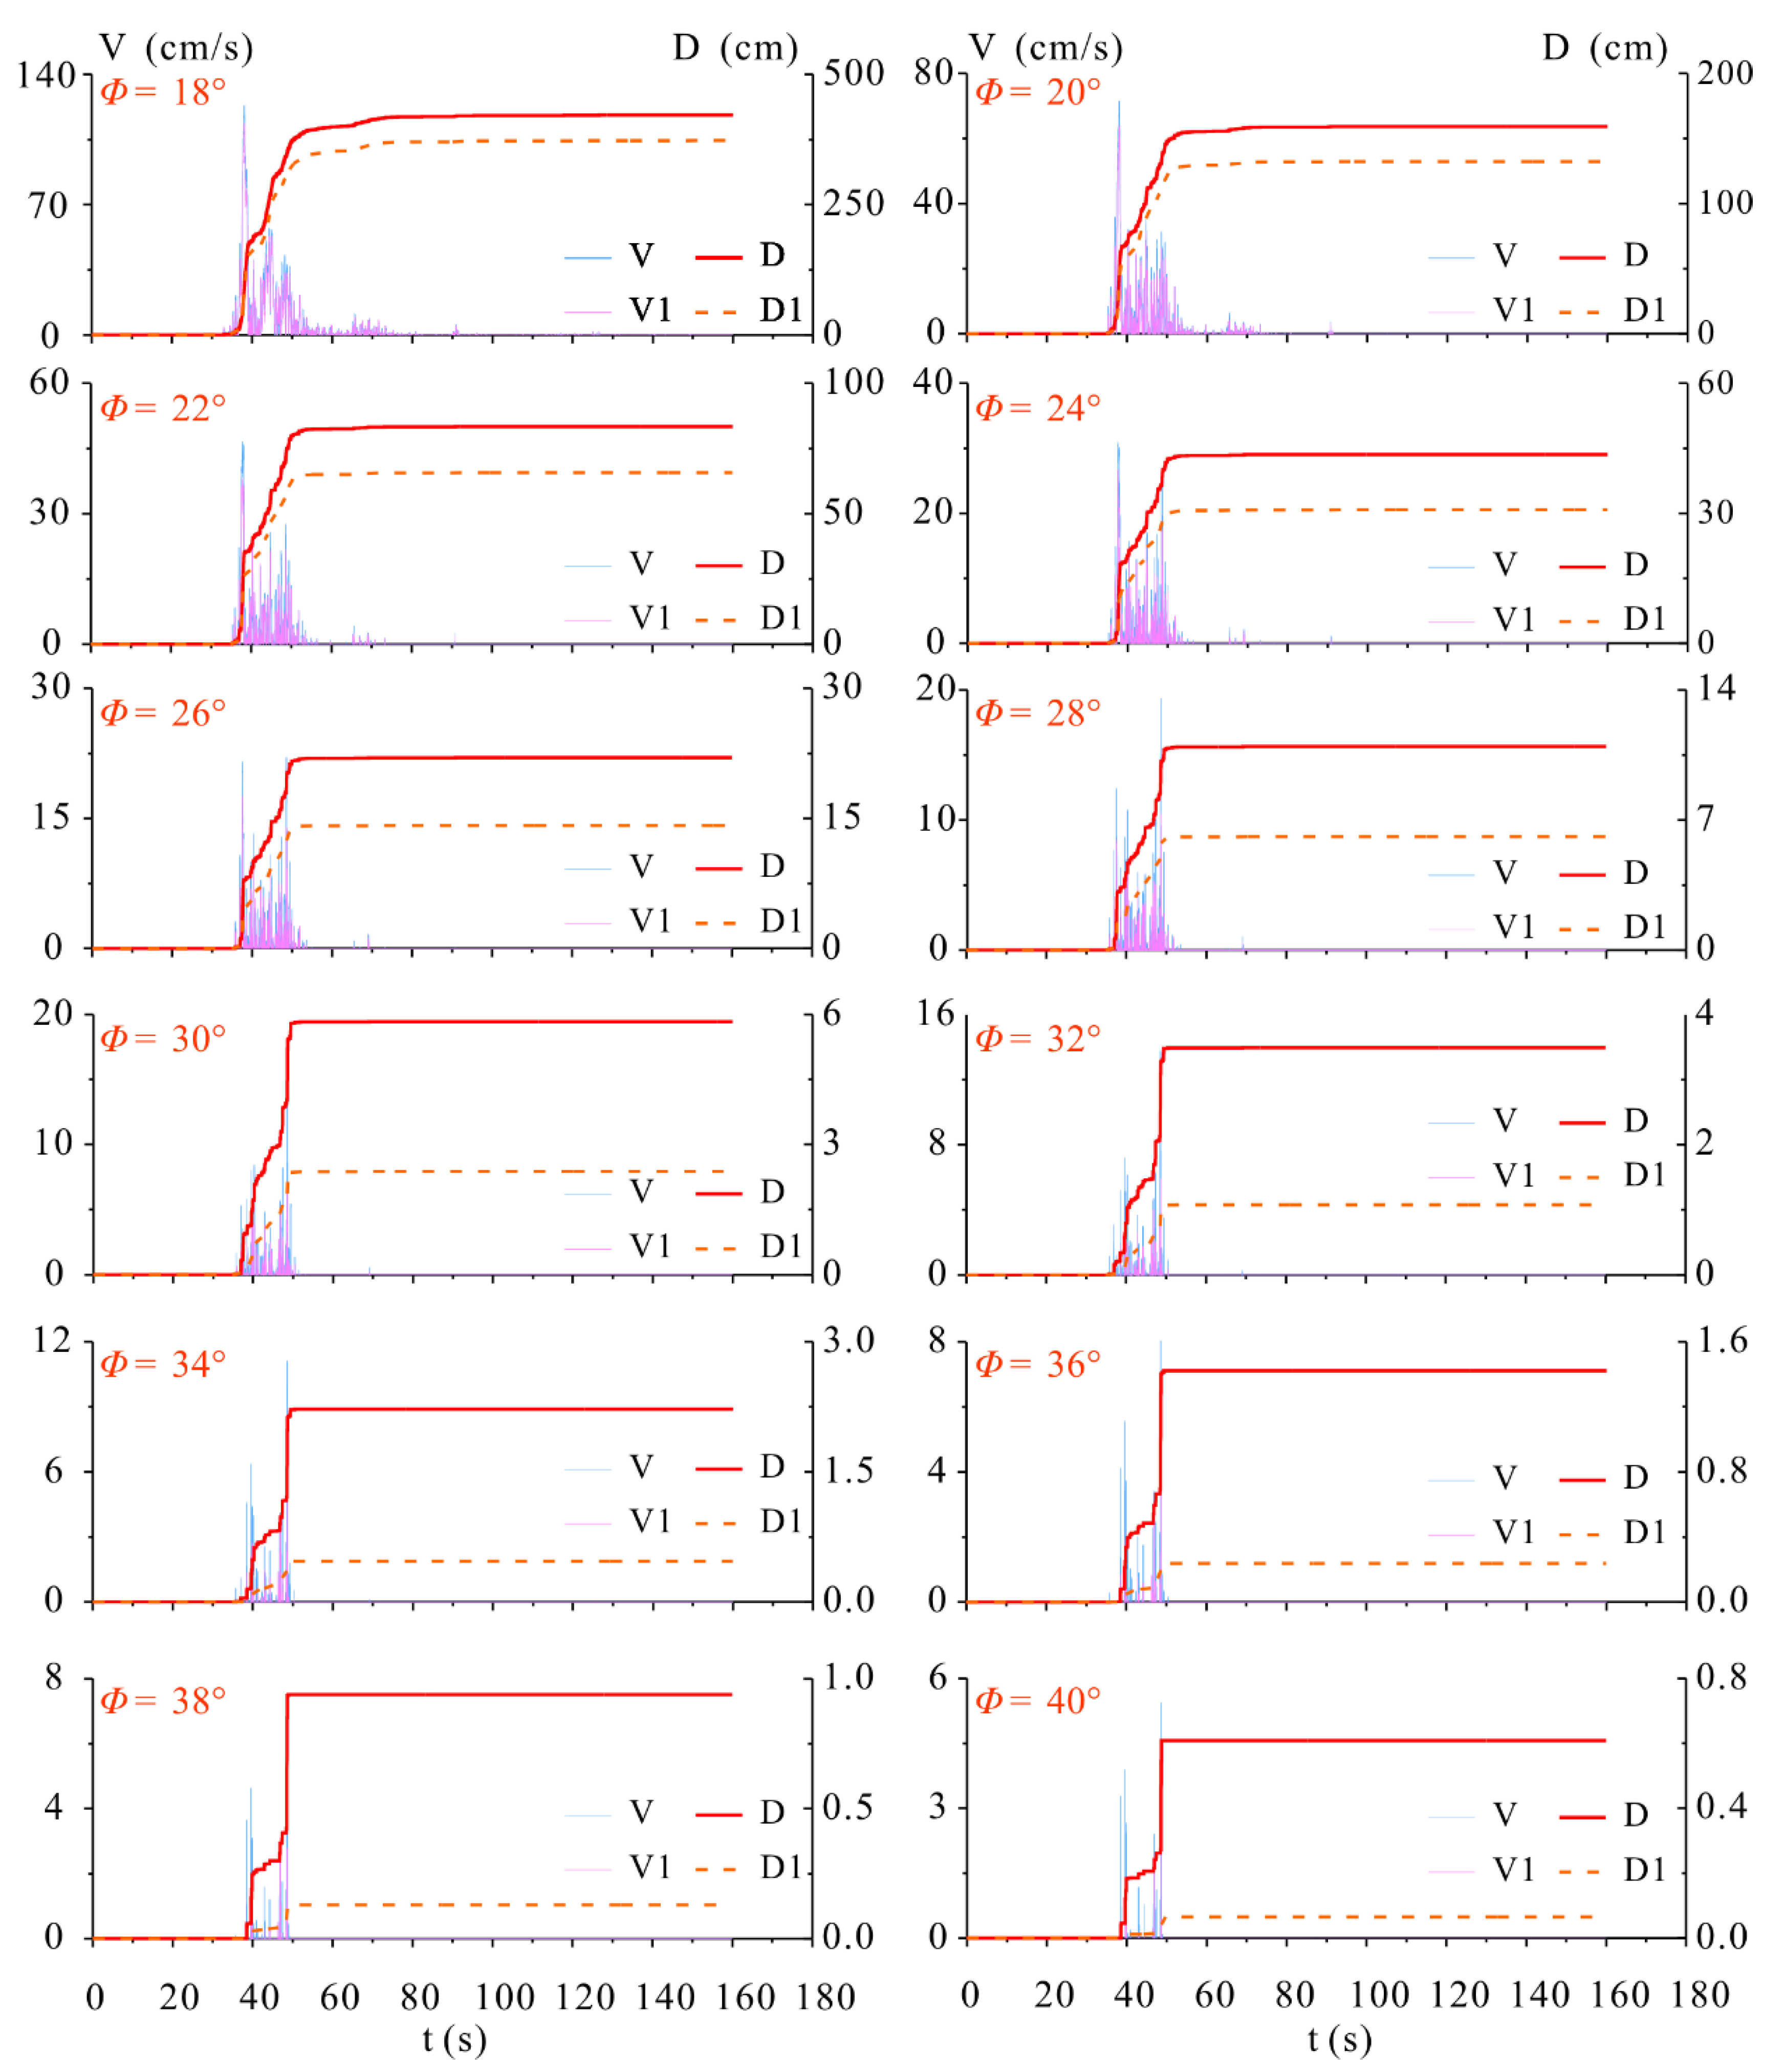
- The vertical acceleration and horizontal inertia force significantly increased the permanent displacement of the DGB landslide and increased the possibility of landslide instability. The permanent displacement is 4.9 cm considering an, while it is just 2.0 cm without considering an.
- (2)
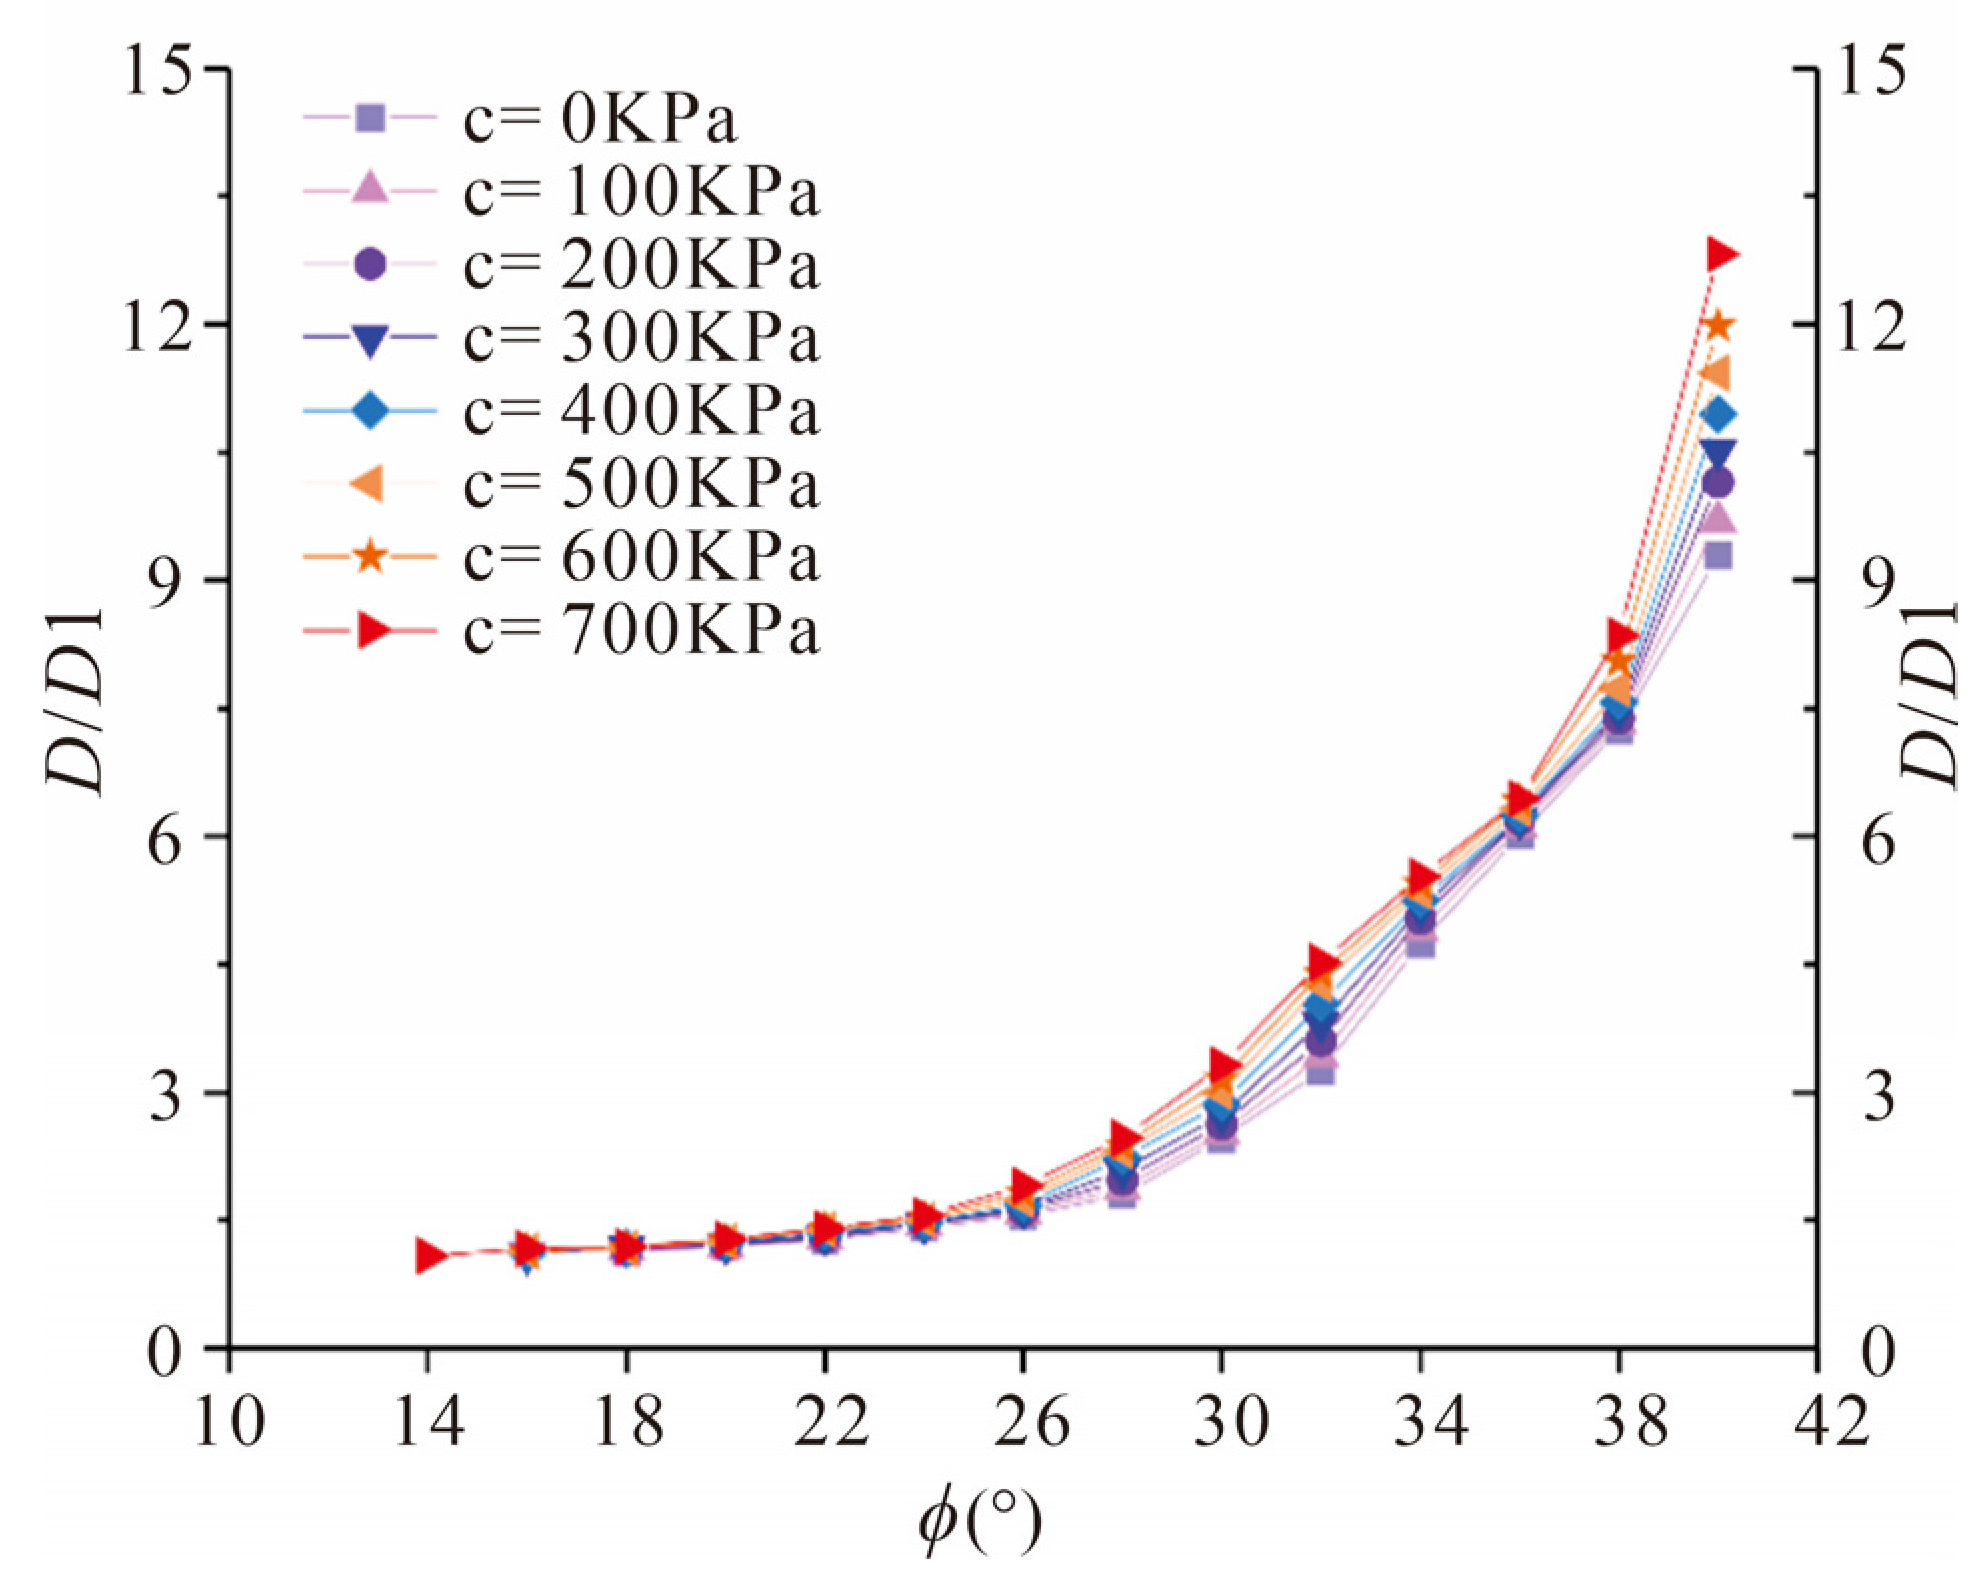
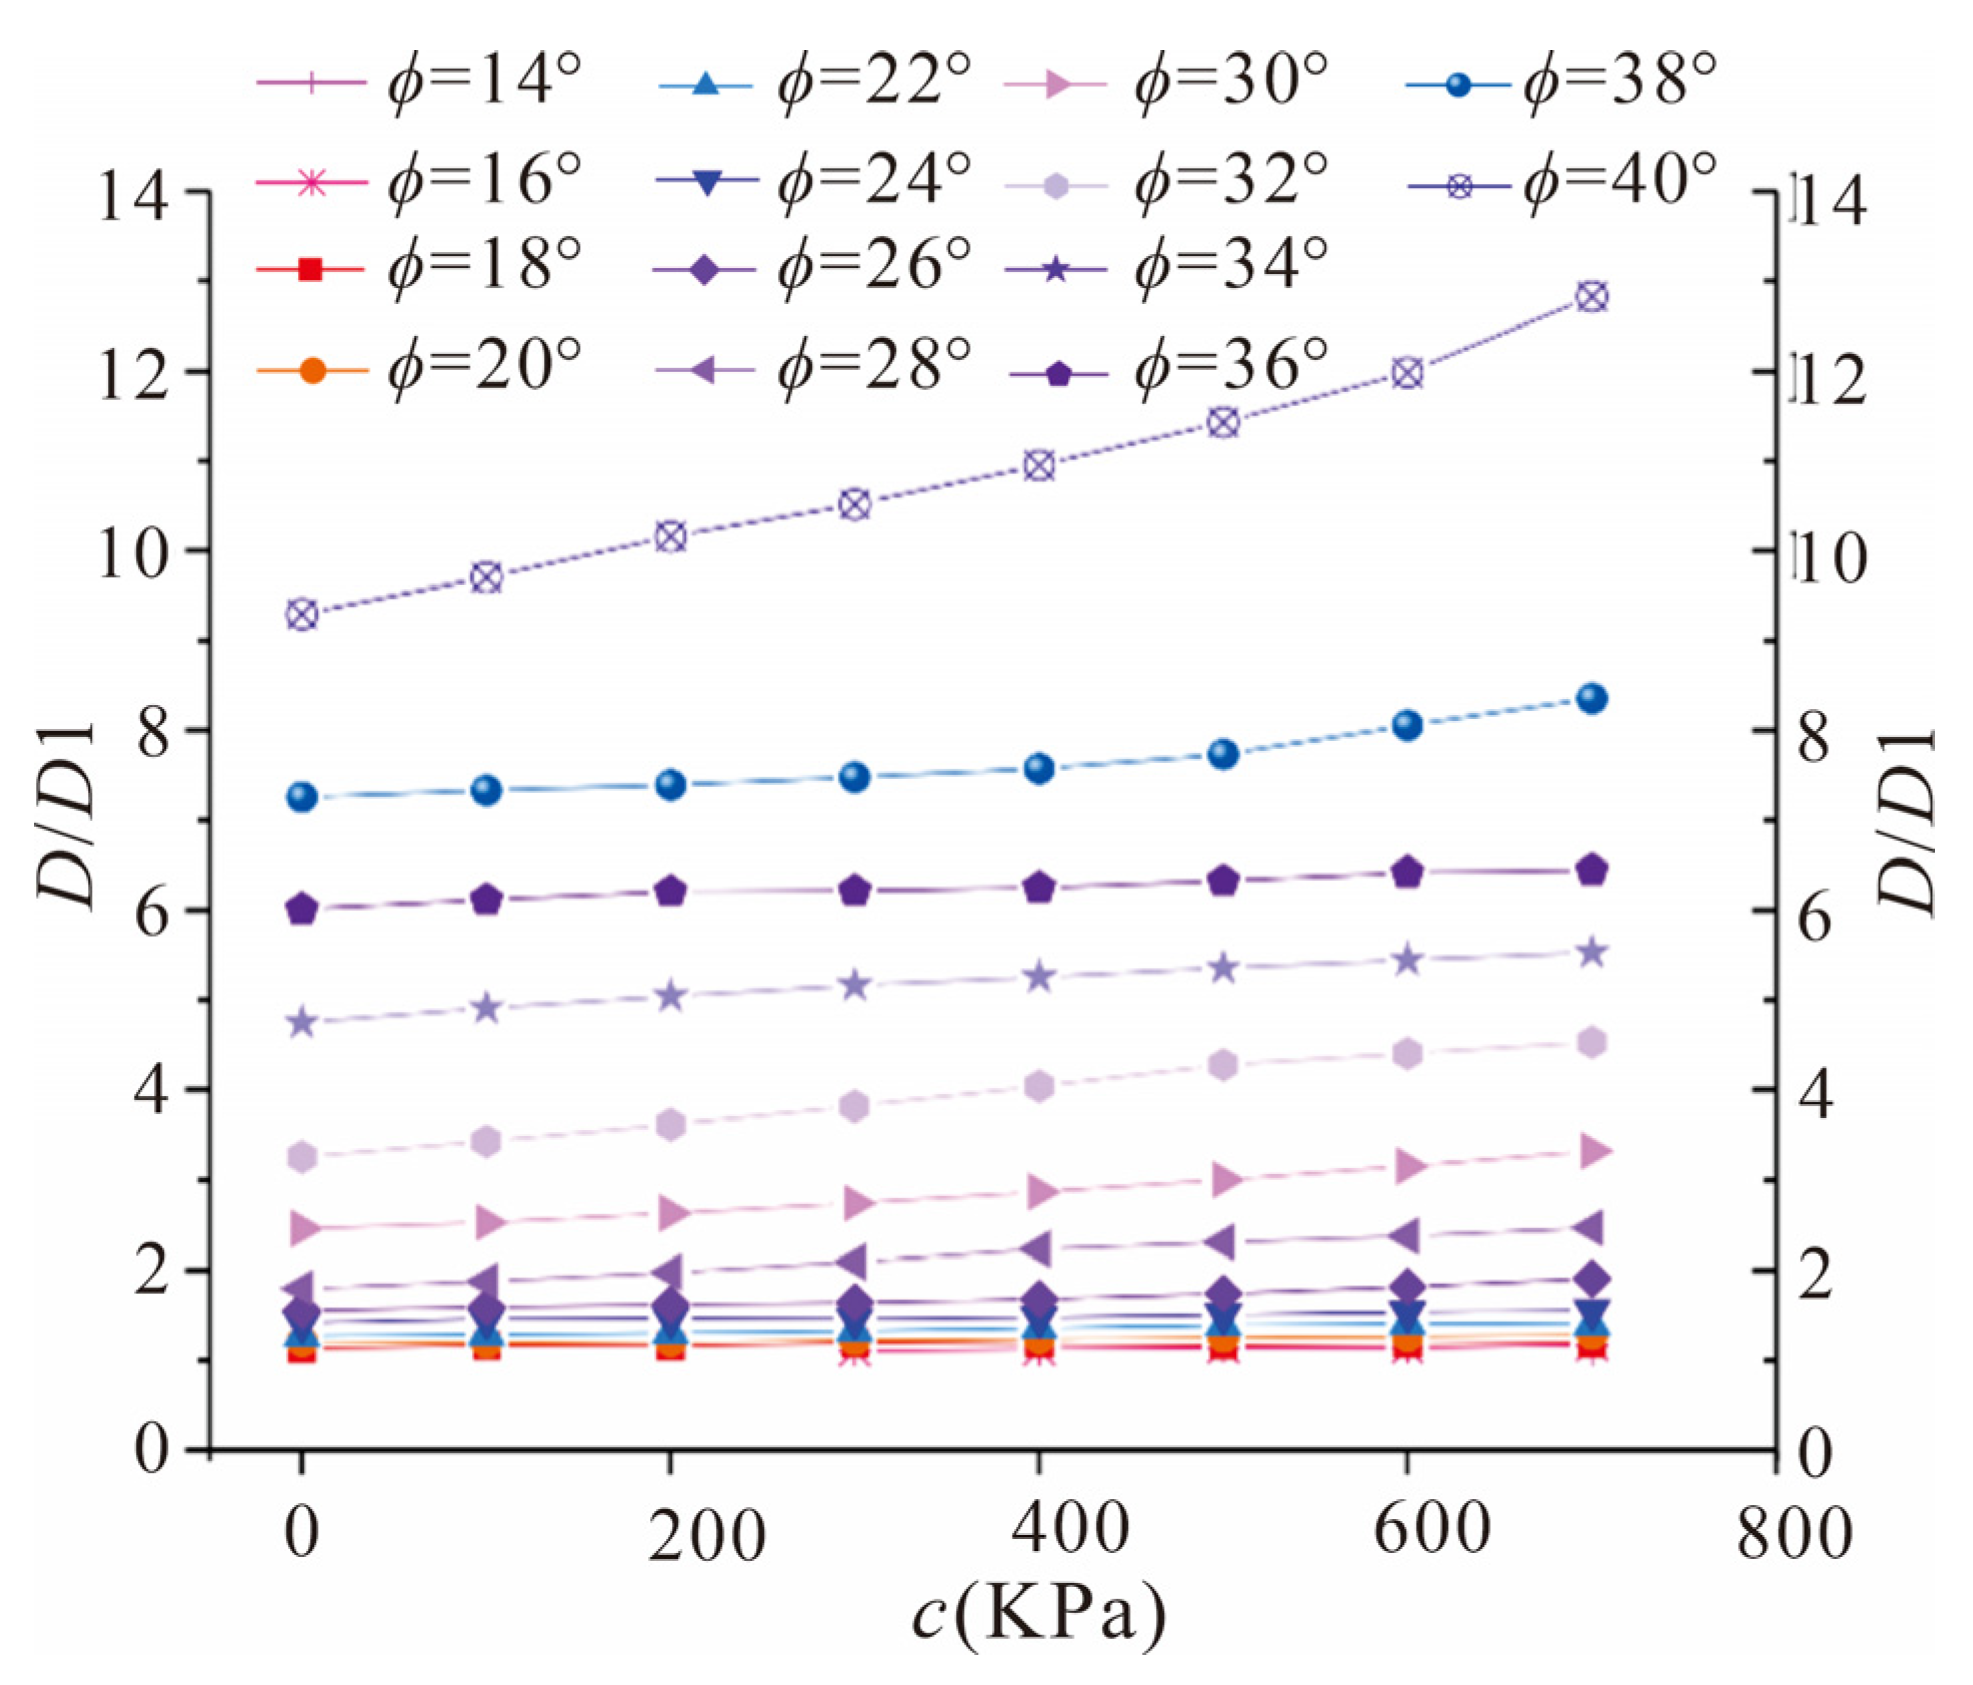
- Compared with the lower shear strength parameter of the sliding surface, the contributions of vertical acceleration and inertial force to the permanent displacement are more obvious when the shear strength parameter of the sliding surface is higher. When ϕ > 18°, the D/D* is greater than 1, and the maximum D/D* reaches 7. When ϕ < 22°, the D/D* increases in an upward convex pattern with an increasing internal friction angle. When the internal friction angle is 22°~28°, the increasing trend of D/D* is not obvious. The D/D* increases linearly with increasing cohesion. When the internal friction angle is certain, the change in cohesion has less influence on the D/D*. When the internal friction angle is greater than 30°, the D/D* is 2~7;
- (3)
- The contribution of vertical acceleration is significantly enlarged (87.8–90.7%) by the decreasing of the internal friction angle of the slide surface, while it is less influenced (5–27.4%) by the cohesion.
- (4)
- The fast accumulation event of permanent displacement is triggered in the concentration stage of the seismic energy release, and 50% of the energy was released within 30–50 s in the DGB landslide area. It is assumed that the DGB landslide may have been triggered at 30–50 s due to 50% of the seismic energy being released in this time span.
Author Contributions
Funding
Institutional Review Board Statement
Informed Consent Statement
Data Availability Statement
Conflicts of Interest
Abbreviations
| DGB landslide | Daguangbao landslide |
| Tf | Triassic Feixianguan Formation |
| P | Permian |
| Ds | Devonian Shawozi Formation |
| Zd | Cambrian Dengying Formation |
| PGA | Peak ground acceleration |
| UD | Accelerations in vertical directions |
| EW | Accelerations in east–west directions |
| NS | Accelerations in north–south directions |
References
- Refice, A.; Capolongo, D. Probabilistic modeling of uncertainties in earthquake-induced landslide hazard assessment. Comput. Geosci. 2002, 28, 735–749. [Google Scholar] [CrossRef]
- Ingles, J.; Darrozes, J.; Soula, J.C. Effects of the vertical component of ground shaking on earthquake-induced landslide displacements using generalized Newmark analysis. Eng. Geol. 2006, 86, 134–147. [Google Scholar] [CrossRef]
- Shen, H.; Klapperich, H.; Abbas, S.M.; Ibrahim, A. Slope stability analysis based on the integration of GIS and numerical simulation. Autom. Constr. 2012, 26, 46–53. [Google Scholar] [CrossRef]
- Jiao, Y.Y.; Wang, Z.H.; Wang, X.Z.; Adoko, A.C.; Yang, Z.X. Stability assessment of an ancient landslide crossed by two coal mine tunnels. Eng. Geol. 2013, 159, 36–44. [Google Scholar] [CrossRef]
- Zhang, Z.; Wang, T.; Wu, S.; Tang, H.; Liang, C. Investigation of dormant landslides in earthquake conditions using a physical model. Landslides 2017, 14, 1181–1193. [Google Scholar] [CrossRef]
- Belghali, M.; Saada, Z.; Garnier, D.; Maghous, S. Pseudo-static stability analysis of rock slopes reinforced by passive bolts using the generalized Hoek–Brown criterion. J. Rock Mech. Geotech. Eng. 2017, 9, 659–670. [Google Scholar] [CrossRef]
- Gibson, M.D.; Wartman, J.P.; MacLaughlin, M.M.; Keefer, D.K. Pseudo-static failure modes and yield accelerations in rock slopes. Int. J. Rock Mech. Min. Sci. 2018, 102, 1–14. [Google Scholar] [CrossRef]
- Fu, X.; Sheng, Q.; Du, W.; Mei, H.; Chen, H.; Du, Y. Evaluation of dynamic stability and analysis of reinforcement measures of a landslide under seismic action: A case study on the Yanyangcun landslide. Bull. Eng. Geol. Environ. 2020, 79, 2847–2862. [Google Scholar] [CrossRef]
- Rodríguez-Peces, M.J.; Román-Herrera, J.C.; Peláez, J.A.; Delgado, J.; Tsigé, M.; Missori, C.; Martino, S.; Garrido, J. Obtaining suitable logic-tree weights for probabilistic earthquake-induced landslide hazard analyses. Eng. Geol. 2020, 275, 105743. [Google Scholar] [CrossRef]
- Cui, S.; Pei, X.; Jiang, Y.; Wang, G.; Fan, X.; Yang, Q.; Huang, R. Liquefaction within a bedding fault: Understanding the initiation and movement of the Daguangbao landslide triggered by the 2008 Wenchuan Earthquake (Ms = 8.0). Eng. Geol. 2021, 295, 106455. [Google Scholar] [CrossRef]
- Shukha, R.; Baker, R. Design implications of the vertical pseudo-static coefficient in slope analysis. Comput. Geotech. 2008, 35, 86–96. [Google Scholar] [CrossRef]
- Kontoe, S.; Pelecanos, L.; Potts, D. An important pitfall of pseudo-static finite element analysis. Comput. Geotech. 2013, 48, 41–50. [Google Scholar] [CrossRef]
- Liu, C.; Le, T.; Shi, B.; Zhu, Y. Discussion on three major problems of engineering application of the particle discrete element method. Chin. J. Rock Mech. Eng. 2020, 39, 1142–1152. (In Chinese) [Google Scholar]
- Newmark, N.M. Effects of earthquakes on dams and embankments. Geotechnique 1965, 15, 139–160. [Google Scholar] [CrossRef]
- Makdisi, F.I.; Seed, H.B. Simplified procedure for estimating dam and embankment earthquake-induced deformations. J. Geotech. Eng. Div. 1978, 104, 849–867. [Google Scholar] [CrossRef]
- Huang, C.C.; Lee, Y.H.; Liu, H.P.; Keefer, D.K.; Jibson, R.W. Influence of surface-normal ground acceleration on the initiation of the Jih-Feng-Erh-Shan landslide during the 1999 Chi-Chi, Taiwan, earthquake. Bull. Seismol. Soc. Am. 2001, 91, 953–958. [Google Scholar] [CrossRef]
- Yuan, R.M.; Tang, C.L.; Deng, Q.H. Effect of the acceleration component normal to the sliding surface on earthquake-induced landslide triggering. Landslides 2015, 12, 335–344. [Google Scholar] [CrossRef]
- Dong, J.J.; Tsao, C.C.; Yang, C.M.; Wu, W.J.; Lee, C.T.; Lin, M.L.; Zhang, W.F.; Pei, X.J.; Wang, G.H.; Huang, R.Q. The geometric characteristics and initiation mechanisms of the earthquake-triggered Daguangbao landslide. In Geotechnical Hazards from Large Earthquakes and Heavy Rainfalls; Springer: Tokyo, Japan, 2017; pp. 203–213. [Google Scholar]
- Harrington, C.C.; Liel, A.B. Collapse assessment of moment frame buildings, considering vertical ground shaking. Earthq. Eng. Struct. Dyn. 2016, 45, 2475–2493. [Google Scholar] [CrossRef]
- Zaker Esteghamati, M. A Holistic Review of GM/IM Selection Methods from a Structural Performance-Based Perspective. Sustainability 2022, 14, 12994. [Google Scholar] [CrossRef]
- Bayraktar, A.; Hökelekli, E.; Halifeoğlu, F.M.; Mosallam, A.; Karadeniz, H. Vertical strong ground motion effects on seismic damage propagations of historical masonry rectangular minarets. Eng. Fail. Anal. 2018, 91, 115–128. [Google Scholar] [CrossRef]
- Rinaldin, G.; Fasan, M.; Noé, S.; Amadio, C. The influence of earthquake vertical component on the seismic response of masonry structures. Eng. Struct. 2019, 185, 184–193. [Google Scholar] [CrossRef]
- Chen, Z.Y.; Chen, W.; Zhang, W.; Lou, M.L. Effects of axial compression ratio of central columns on seismic performance of a multi-story underground structure. Int. J. Comput. Methods 2016, 13, 1641014. [Google Scholar] [CrossRef]
- Li, W.; Chen, Q. Effect of vertical ground motions and overburden depth on the seismic responses of large underground structures. Eng. Struct. 2020, 205, 110073. [Google Scholar] [CrossRef]
- Quaranta, G.; Angelucci, G.; Mollaioli, F. Near-fault earthquakes with pulse-like horizontal and vertical seismic ground motion components: Analysis and effects on elastomeric bearings. Soil Dyn. Earthq. Eng. 2022, 160, 107361. [Google Scholar] [CrossRef]
- Godt, J.; Şener, B.; Verdin, K.; Wald, D.; Earle, P.; Harp, E.; Jibson, R. Rapid assessment of earthquake-induced landsliding. In Proceedings of the First World Landslide Forum, Tokyo, Japan, 18–21 November 2008. [Google Scholar]
- Wang, X.Y.; Nie, G.Z.; Wang, S. Evaluation criteria of landslide hazards induced by Wenchuan earthquake using fuzzy mathematical method. Rock Soil Mech. 2011, 32, 403–410. [Google Scholar]
- Ma, S.Y.; Xu, C.; Wang, T.; Liu, J.M. Application of two simplified Newmark models to the assessment of landslides triggered by the 2008 wenchuan earthquake. Seismol. Geol. 2019, 41, 774–788. [Google Scholar]
- Chen, Y.; Gu, H.; Lu, Z. Variations of gravity before and after the Haicheng earthquake, 1975, and the Tangshan earthquake, 1976. Phys. Earth Planet. Inter. 1979, 18, 330–338. [Google Scholar] [CrossRef]
- Chen, Y.; Wu, F.T. Lancang—Gengma earthquake: A preliminary report on the 6 November 1988, event and its aftershocks. Eos Trans. Am. Geophys. Union 1989, 70, 1527–1540. [Google Scholar] [CrossRef]
- Cui, S.; Pei, X.; Huang, R. Effects of geological and tectonic characteristics on the earthquake-triggered Daguangbao landslide, China. Landslides 2018, 15, 649–667. [Google Scholar] [CrossRef]
- Zhu, L.; Pei, X.; Cui, S.; Wang, S.; Zhang, X.; Liang, Y. On the initiation mechanism of the Daguangbao landslide triggered by the 2008 Wenchuan (Ms 7.9) earthquake. Soil Dyn. Earthq. Eng. 2020, 137, 106272. [Google Scholar]
- Pei, X.; Zhu, L.; Cui, S.; Zhang, X.; Liang, Y.; Gao, H.; Zhang, Z. Liquefaction characteristics of interlayer dislocation zone of Daguangbao landslide and its start-up cause. Rock Soil Mech. 2019, 40, 1085–1096. [Google Scholar]
- Jibson, R.W.; Harp, E.L.; Michael, J.A. A method for producing digital probabilistic seismic landslide hazard maps. Eng. Geol. 2000, 58, 271–289. [Google Scholar] [CrossRef]
- Salih, N.; Mansurbeg, H.; Kolo, K.; Préat, A. Hydrothermal carbonate mineralization, calcretization, and microbial diagenesis associated with multiple sedimentary phases in the upper cretaceous bekhme formation, Kurdistan Region-Iraq. Geosciences 2019, 9, 459. [Google Scholar] [CrossRef]
- Salih, N.; Mansurbeg, H.; Muchez, P.; Gerdes, A.; Préat, A. Hydrothermal fluids and cold meteoric waters along tectonic-controlled open spaces in upper cretaceous carbonate rocks, Ne-Iraq: Scanning data from in situ u-pb geochronology and microthermometry. Water 2021, 13, 3559. [Google Scholar] [CrossRef]
- Wang, G.; Sassa, K.; Fukuoka, H. Seismic behavior of saturated sandy soils: Case study for the May 2003 Tsukidate landslide in Japan. In Landslides; Springer: Berlin/Heidelberg, Germany, 2005; pp. 157–164. [Google Scholar]
- Wang, G.; Sassa, K. Seismic loading impacts on excess pore-water pressure maintain landslide triggered flowslides. Earth Surf. Process. Landf. 2009, 34, 232–241. [Google Scholar] [CrossRef]
- Liao, C.J.; Lee, D.H.; Wu, J.H.; Lai, C.Z. A new ring-shear device for testing rocks under high normal stress and dynamic conditions. Eng. Geol. 2011, 122, 93–105. [Google Scholar] [CrossRef]
- Wilson, R.C.; Keefer, D.K. Dynamic analysis of a slope failure from the 6 August 1979 Coyote Lake, California, earthquake. Bull. Seismol. Soc. Am. 1983, 73, 863–877. [Google Scholar] [CrossRef]
- Trifunac, M.D. Energy of strong motion at earthquake source. Soil Dyn. Earthq. Eng. 2008, 28, 1–6. [Google Scholar] [CrossRef]
- Wang, G.; Huang, R.; Chigira, M.; Wu, X.; Lourenço, S.D. Landslide Amplification by Liquefaction of Runout-Path Material after the 2008 Wenchuan (M 8.0) Earthquake, China. Earth Surf. Process. Landf. 2013, 38, 265–274. [Google Scholar] [CrossRef]
- Lucas, A.; Mangeney, A.; Ampuero, J.P. Frictional velocity-weakening in landslides on Earth and on other planetary bodies. Nat. Commun. 2014, 5, 3417. [Google Scholar] [CrossRef]
- Liu, W.; He, S.; Li, X.; Xu, Q. Two-dimensional landslide dynamic simulation based on a velocity-weakening friction law. Landslides 2016, 13, 957–965. [Google Scholar] [CrossRef]
- Hu, W.; Huang, R.; McSaveney, M.; Yao, L.; Xu, Q.; Feng, M.; Zhang, X. Superheated steam, hot CO2 and dynamic recrystallization from frictional heat jointly lubricated a giant landslide: Field and experimental evidence. Earth Planet. Sci. Lett. 2019, 510, 85–93. [Google Scholar] [CrossRef]
- Deng, Y.; Yan, S.; Scaringi, G.; Liu, W.; He, S. An empirical power density-based friction law and its implications for coherent landslide mobility. Geophys. Res. Lett. 2020, 47, e2020GL087581. [Google Scholar] [CrossRef]
- Meng, X.; Pei, X.; Huang, R.; Cui, S.; Zhu, L.; Zhan, W. Shear behaviors of rock mass in the interlayer fault zone of Daguangbao landslide. J. Eng. Geol. 2018, 26, 309–318. (In Chinese) [Google Scholar]
- Feng, W.; Wang, Q.; Zhang, G.; Liu, Z.; Yi, X. Improvement of Hoek-Brown criterion and application of landslide zone of cataclastic rock mass mechanical strength in evaluation of Daguangbao landslide. Chin. J. Rock Mech. Eng. 2017, 36 (Suppl. S1), 335–342. (In Chinese) [Google Scholar]
- Yin, Y.; Wang, M.; Li, B.; Feng, Z. Dynamic response characteristics of Daguangbao landslide triggered by Wenchuan earthquake. Chin. J. Rock Mech. Eng. 2012, 31, 1969–1982. (In Chinese) [Google Scholar]
- Pei, X.; Cui, S.; Huang, R. A model of initiation of Daguangbao landslide: Dynamic dilation and water hammer in sliding zone during strong seismic shaking. Chin. J. Rock Mech. Eng. 2018, 37, 430–448. (In Chinese) [Google Scholar]
- Zhu, L.; Wang, X. Physical modeling and numerical simulation of deformation and failure process of large rockslide in earthquake. J. Eng. Geol. 2013, 21, 228–235. (In Chinese) [Google Scholar]
- Wang, Q. Strength Characteristics of Sinian Dengying Formation in Bedding Shear Zone of Daguangbao Landslide; Chengdu University of Technology: Chengdu, China, 2017. (In Chinese) [Google Scholar]
- Cui, S.; Pei, X.; Huang, R. An initiation model of DGB landslide: Non-coordinated deformation inducing rock damage in sliding zone during strong seismic shaking. Chin. J. Rock Mech. Eng. 2019, 38, 237–253. (In Chinese) [Google Scholar]
- Li, T.; Pei, X.; Huang, R. A study of motion features of the Daguangbao large-scale landslide induced by the Wenchuan Earthquake. Hydrogeol. Eng. Geol. 2014, 41, 122–127. (In Chinese) [Google Scholar]
- Feng, W.; Yi, X.; Ge, H.; Wang, Q.; Liu, Z.; Zhang, G. In-situ borehole shear test on cataclastic rock mass of Daguangbao landslide. Chin. J. Geotech. Eng. 2017, 39, 1718–1723. (In Chinese) [Google Scholar]


Disclaimer/Publisher’s Note: The statements, opinions and data contained in all publications are solely those of the individual author(s) and contributor(s) and not of MDPI and/or the editor(s). MDPI and/or the editor(s) disclaim responsibility for any injury to people or property resulting from any ideas, methods, instructions or products referred to in the content. |
© 2023 by the authors. Licensee MDPI, Basel, Switzerland. This article is an open access article distributed under the terms and conditions of the Creative Commons Attribution (CC BY) license (https://creativecommons.org/licenses/by/4.0/).
Share and Cite
Xiang, G.; Jiang, T.; Yang, Q.; Cui, S.; Zhu, L.; He, Y.; Li, H. The Influence of Vertical Seismic Acceleration on the Triggering of Landslides Constrained by Bedding Faults under an Inertial Frame Reference: The Case of the Daguangbao (DGB) Landslide. Appl. Sci. 2023, 13, 12911. https://doi.org/10.3390/app132312911
Xiang G, Jiang T, Yang Q, Cui S, Zhu L, He Y, Li H. The Influence of Vertical Seismic Acceleration on the Triggering of Landslides Constrained by Bedding Faults under an Inertial Frame Reference: The Case of the Daguangbao (DGB) Landslide. Applied Sciences. 2023; 13(23):12911. https://doi.org/10.3390/app132312911
Chicago/Turabian StyleXiang, Guoping, Tao Jiang, Qingwen Yang, Shenghua Cui, Ling Zhu, Yuhang He, and Huajin Li. 2023. "The Influence of Vertical Seismic Acceleration on the Triggering of Landslides Constrained by Bedding Faults under an Inertial Frame Reference: The Case of the Daguangbao (DGB) Landslide" Applied Sciences 13, no. 23: 12911. https://doi.org/10.3390/app132312911