Article

Vulnerability Exploitation Risk Assessment Based on Offensive Security Approach

1
System Security Research Center, Chonnam National University, Gwangju 61186, Republic of Korea
2
Department of Data Science, Chonnam National University, Gwangju 61186, Republic of Korea
*
Author to whom correspondence should be addressed.
Appl. Sci. 2023, 13(22), 12180; https://doi.org/10.3390/app132212180
Submission received: 7 October 2023 / Revised: 28 October 2023 / Accepted: 6 November 2023 / Published: 9 November 2023
(This article belongs to the Special Issue IoT in Smart Cities and Homes)

Abstract

:
Security incidents targeting control systems and the industrial internet of things (IIoT) are on the rise as attackers gain a better understanding of the nature of these systems and their increasing connectivity to information technology (IT). Every year, the number of vulnerabilities associated with these incidents increases, making it impractical to apply timely patches for all of them. The current vulnerability assessments, which are the basis for vulnerability patching, have limitations in that they do not adequately reflect the risk of exploitation in the real world after discovery and do not consider operational technology (OT) and industrial control system (ICS) environments other than IT environments. This study proposes to evaluate exploit risk in real-world environments by considering OT/ICS environments and calculating three metrics, including exploit chain risk, exploit code availability, and exploit use probability based on cyber threat information, including IIoT vulnerability data, used in OT/ICS environments. In addition, we construct exploitation scenarios in a control system environment to prioritize vulnerabilities with a high risk of exploitation based on the three metrics. We show that by assessing the risk of attackers’ intentions and exploited technologies for attacks against IIoT devices in a control system environment, we can provide defenders with comprehensive attack risk information for proactive defense.

1. Introduction

Operational technology (OT) and industrial control systems (ICS) monitor and control the operational processes of critical national infrastructure and industrial processes extensively employed in industries, such as power, gas, petroleum, and petrochemicals. They achieve this through the use of technologies, such as the industrial internet of things (IIoT). Therefore, it is crucial to apply prompt patches guided by vulnerability risk assessments to avert national losses resulting from cyberattacks. However, the importance of maintaining facility availability makes it difficult for ICS to respond quickly to newly discovered vulnerabilities that are exploited during operations [1].
The current method for prioritizing patches relies on the common vulnerability scoring system (CVSS) baseline scores [2]. However, this system has a significant limitation as it does not account for temporal factors. While it provides an impact index to assess post-attack severity, it neglects the real-time risk of an exploit [3]. Unfortunately, even manufacturers of digital assets only partially consider temporal scores, and this oversight often results in a decrease in urgency, as evidenced by the decline in previously assessed baseline scores [4]. In addition, these scores do not take into account environments outside of the information technology (IT) environment, making it difficult to perform vulnerability assessments for IIoT devices in real-world OT/ICS environments [5,6,7].
Assessing the risk of exploiting a vulnerability demands comprehension of the environment where the vulnerability is applicable and a perspective rooted in the attackers’ intentions encompassing their motives in exploiting the vulnerability and the ease with which they can perform the exploitation. In this regard, this paper assumes the following research questions:
  • Does it consider vulnerability characteristics for IIoT devices in OT/ICS environments in addition to IT environments?
  • Does it reflect the time-varying exploit characteristics of the vulnerability?
  • It is possible to perform an exploit risk assessment based on attacker intent to evaluate the exploit risk for a vulnerability?
In this paper, we gathered vulnerability and threat data from IIoT devices operating in OT/ICS environments. Using this data, we propose three new metrics for appraising vulnerability danger in non-IT settings, considering the attackers’ evolving capabilities and ability to exploit. These metrics enable the assessment of exploitability and cascading exploitation technique risks to evaluate the vulnerability to an attacker’s perspective. This approach allows defenders to establish effective defenses by assessing a vulnerability’s ease of exploitation and the range of attack techniques to which it can be vulnerable to.
The structure of this paper is as follows. Section 2 provides a brief overview of the underlying technology used in this study. In Section 3, we describe related work. Section 4 presents a framework for real-world risk assessment of vulnerabilities, describing each procedure, the three proposed metrics, and their application. Section 5 applies the proposed evaluation method to real-world known ICS vulnerabilities and presents the results. Section 6 compares and discusses our results with existing vulnerability assessment frameworks through a case study and presents limitations and future research directions. Section 7 presents the conclusions and its contributions.

2. Background

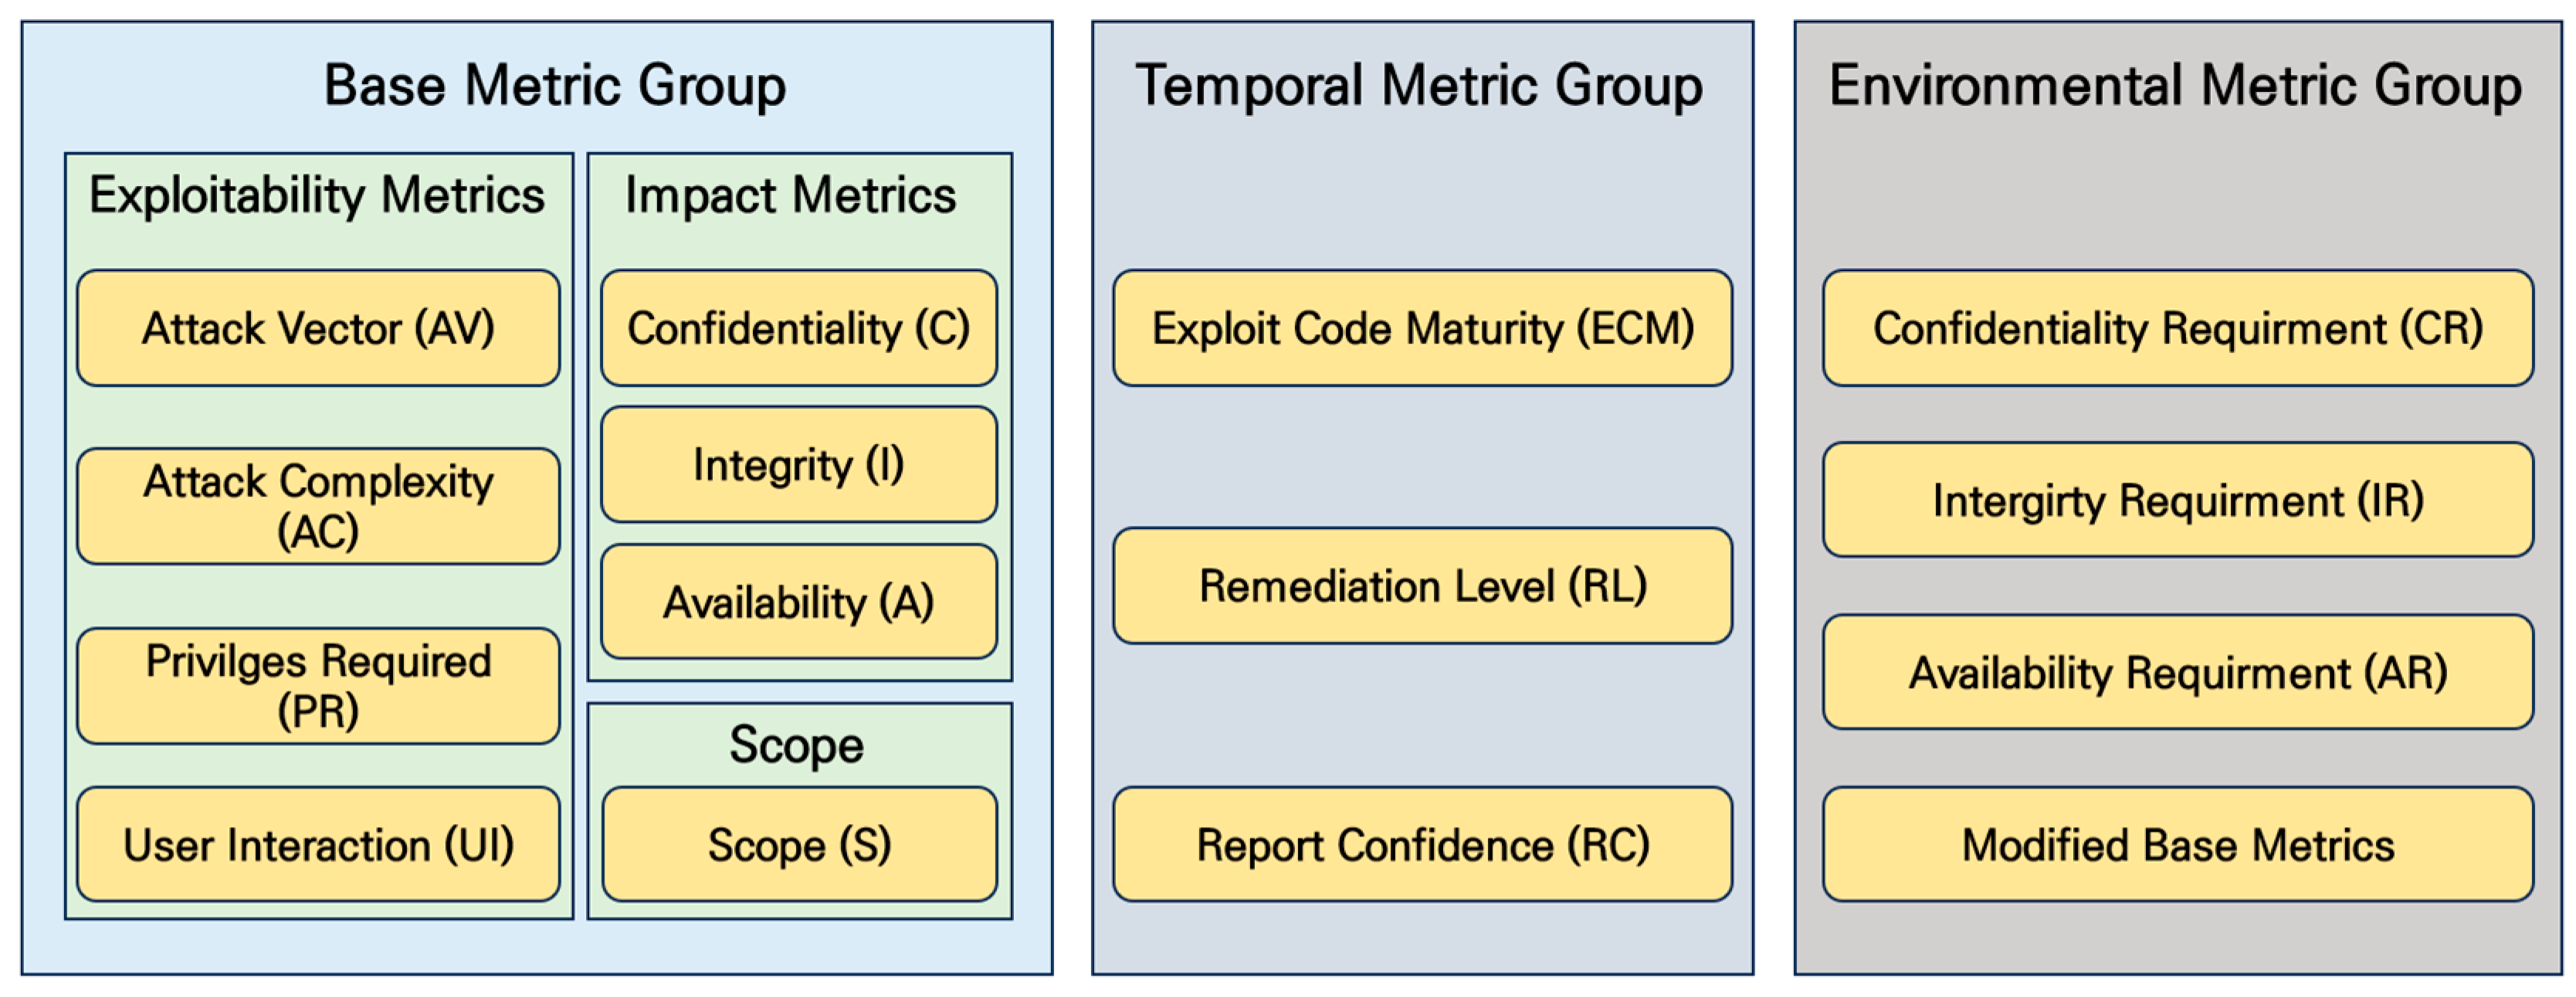
2.1. Common Vulnerability Scoring System

CVSS is a universally open and standardized method for rating IT vulnerabilities [8]. It helps in the assessment of the severity and potential impact of vulnerabilities, providing a method to capture the principal characteristics of a vulnerability and produce a numerical score reflecting its severity. The numerical score can then be translated into a qualitative representation (such as low, medium, high, and critical) to help organizations properly assess and prioritize their vulnerability management processes.
CVSS is composed of three metric groups as shown in Figure 1: Base, Temporal, and Environmental. The Base group represents the intrinsic qualities of a vulnerability that are constant over time and across user environments. The Temporal group reflects the characteristics of a vulnerability that change over time but not among user environments. The Environmental group provides context by capturing the characteristics of a vulnerability that are relevant and unique to a particular user’s environment. Despite its wide use in assessing IT environment vulnerabilities, CVSS has limitations when applied to OT/ICS environments due to different operational characteristics.

2.2. MITRE ATT&CK

The MITRE ATT&CK framework is a repository of threat intelligence that analyzes instances of cyberattacks from across the globe. This framework includes information on attack tactics, techniques, and procedures (TTPs) that have been or could be used by attackers. It also covers details about the attack groups behind these attacks and the software, including malware and legitimate tools, that they have employed. In addition, the framework offers insights into how to detect and mitigate each attack technique, as well as the data sources and components that can be used for detection [9].
The TTPs within ATT&CK consist of tactics that align with the immediate objectives that an attacker seeks to achieve. These tactics involve various attack techniques that can be used to accomplish these objectives, along with the specific methods or procedures utilized by the identified attack group or software for each attack technique. The distribution of attack techniques within each tactic is presented in Table 1.

3. Related Work

Several multifaceted assessment approaches have been studied to address the limitations of the existing vulnerability severity assessment system, CVSS [10,11,12,13,14]. In this paper, we analyzed existing studies that conducted evaluations based on the attributes to be considered in the evaluation and classified them into approaches from the perspectives of severity, possibility of abuse, and hostile action information.

3.1. Vulnerability Severity Assessment Studies

To compensate for the limitations of existing scoring systems, vulnerability severity assessment studies have been conducted, considering factors, such as patch information and release dates. Many of these studies utilize the level of availability of exploit code as an attribute to gauge an attacker’s ease of exploiting a vulnerability. As part of our research objective to evaluate vulnerabilities from an offensive security perspective, we examined studies that dynamically evaluated vulnerability scores by considering exploit information.
Jung et al. [15] defined evaluation criteria for the “exploit code maturity” attribute of CVSS’s temporal metric using reference URLs and tag information from publicly available vulnerabilities. They automated the evaluation process and prioritized patches based on scores to leverage contextual information on ease of exploitation. However, the evaluated scores merely lower severity and do not track vulnerability weaponization levels. Singh et al. [16] calculated CVSS’s temporal metric scores using exploit code maturity and patch-level information derived from vulnerability data. These scores, in combination with base metric information, were used to calculate the exploit frequency and estimate the quantitative security risk. Nevertheless, the criteria for assessing exploit code maturity lack standardization and heavily rely on empirical judgment. In a different approach, Bulut et al. [17] introduced three attributes, namely, Weaponized Exploit (WX), Utility, and Opportune, to evaluate vulnerability exploitability, relying on sources, such as Exploit DB, Metasploit, GitHub, and expert judgment, for their assessment. Although these attributes were incorporated as weighting factors in severity score calculations, reliance on expert judgment hinders consistent evaluations and quantification of risk scores.

3.2. Vulnerability and Exploitability Assessment Studies

Assessing vulnerability risk solely through exploit code availability reveals only the ease of potential exploitation by attackers. Therefore, we conducted a study to estimate the likelihood of an attacker utilizing the developed exploit code in a real-world setting. In this study, we conducted a correlation analysis between publicly available vulnerabilities and exploited data sources to determine the likelihood of real-world exploitation. We categorized in-the-wild exploits and corresponding threats, organizing the data over a specific time frame for training a prediction model.
Suciu et al. [18] proposed a novel learning feature called “Expected Exploitability (EE)”, which factors in time-varying exploitability based on various exploit data. This feature also considers methods for addressing label bias and noise to enhance the exploitability evaluation accuracy. Edkrantz et al. [19] proposed the use of machine learning to predict the likelihood of exploitation based on past attack patterns, using data collected from Twitter, the dark web, and blogs, such as Pastebin. In another approach, Jacob et al. [20] proposed an exploit prediction scoring system that collects publicly available vulnerabilities and exploit data. This system performs a linkage analysis between each data point, extracts features to calculate exploitability based on the correlation coefficient between them, and calculates the probability of exploitation within a 30-day timeframe, generating a score between 0 and 1. In contrast to CVSS, which generates a severity score based on the static features of vulnerability, this score can capture the dynamic risk of a vulnerability by considering factors, such as the attacker’s skill level and actual exploitation incidents.

3.3. Adversarial Behavior Intelligence-Based Risk Assessment

In addition to vulnerability assessments based on the level of availability of exploit code for attackers to use and the likelihood that they will use it to launch actual attacks, a body of research dedicated to risk assessments associated with attack groups and advanced persistent threats (APTs) exists. This research centers on data related to hostile behavior exhibited by attackers and underscores the critical need to comprehend an attacker’s motives and the techniques they utilize to achieve them before exploiting vulnerabilities. This, in turn, allows defenders to understand the attacker’s motives and techniques, facilitating the formulation of a comprehensive security strategy that extends beyond addressing individual vulnerabilities.
Ahmed et al. [21] introduced a cyber threat assessment methodology that relies on the MITRE ATT&CK framework. This methodology uses TTP information from MITRE ATT&CK to identify the TTPs used by attackers and subsequently generates an attack graph that identifies all possible attack paths, spanning from the initial approach to the final objective. The probabilities of attack occurrence and success are calculated, taking into account the attacker’s interest in each attack path, and the attack path with the highest probability of success is identified. Cho et al. [22] introduced a method for scoring APT attacks using the MITRE ATT&CK framework. This method begins by assigning scores to each attack technique in ATT&CK and subsequently scores the entire APT attack, which comprises multiple attack techniques, by considering the weight of the tactics to which the attack technique belongs. The scoring of attack techniques is based on quantifiable factors, such as whether the technique can be executed remotely, the risk associated with vulnerability exploited by the technique, and the complexity of the tools used in the technique.
Previous studies have assessed risk by examining the availability of exploit code for vulnerabilities targeted by attackers, the likelihood of real-world attacks using these vulnerabilities, and an understanding of an attacker’s behavior. While these studies include elements of offensive security, none of them provide a comprehensive analysis. Table 2 categorizes these studies based on their characteristics and highlights their limitations. To effectively assess the exploitation risk of a vulnerability, it is essential to adopt an attacker’s perspective. This perspective encompasses understanding both the attacker’s motives for exploiting the vulnerability and the ease with which the vulnerability can be exploited. Notably, existing research has largely overlooked vulnerabilities in OT and ICS environments, thus failing to capture the true exploit risk within these specific environments.

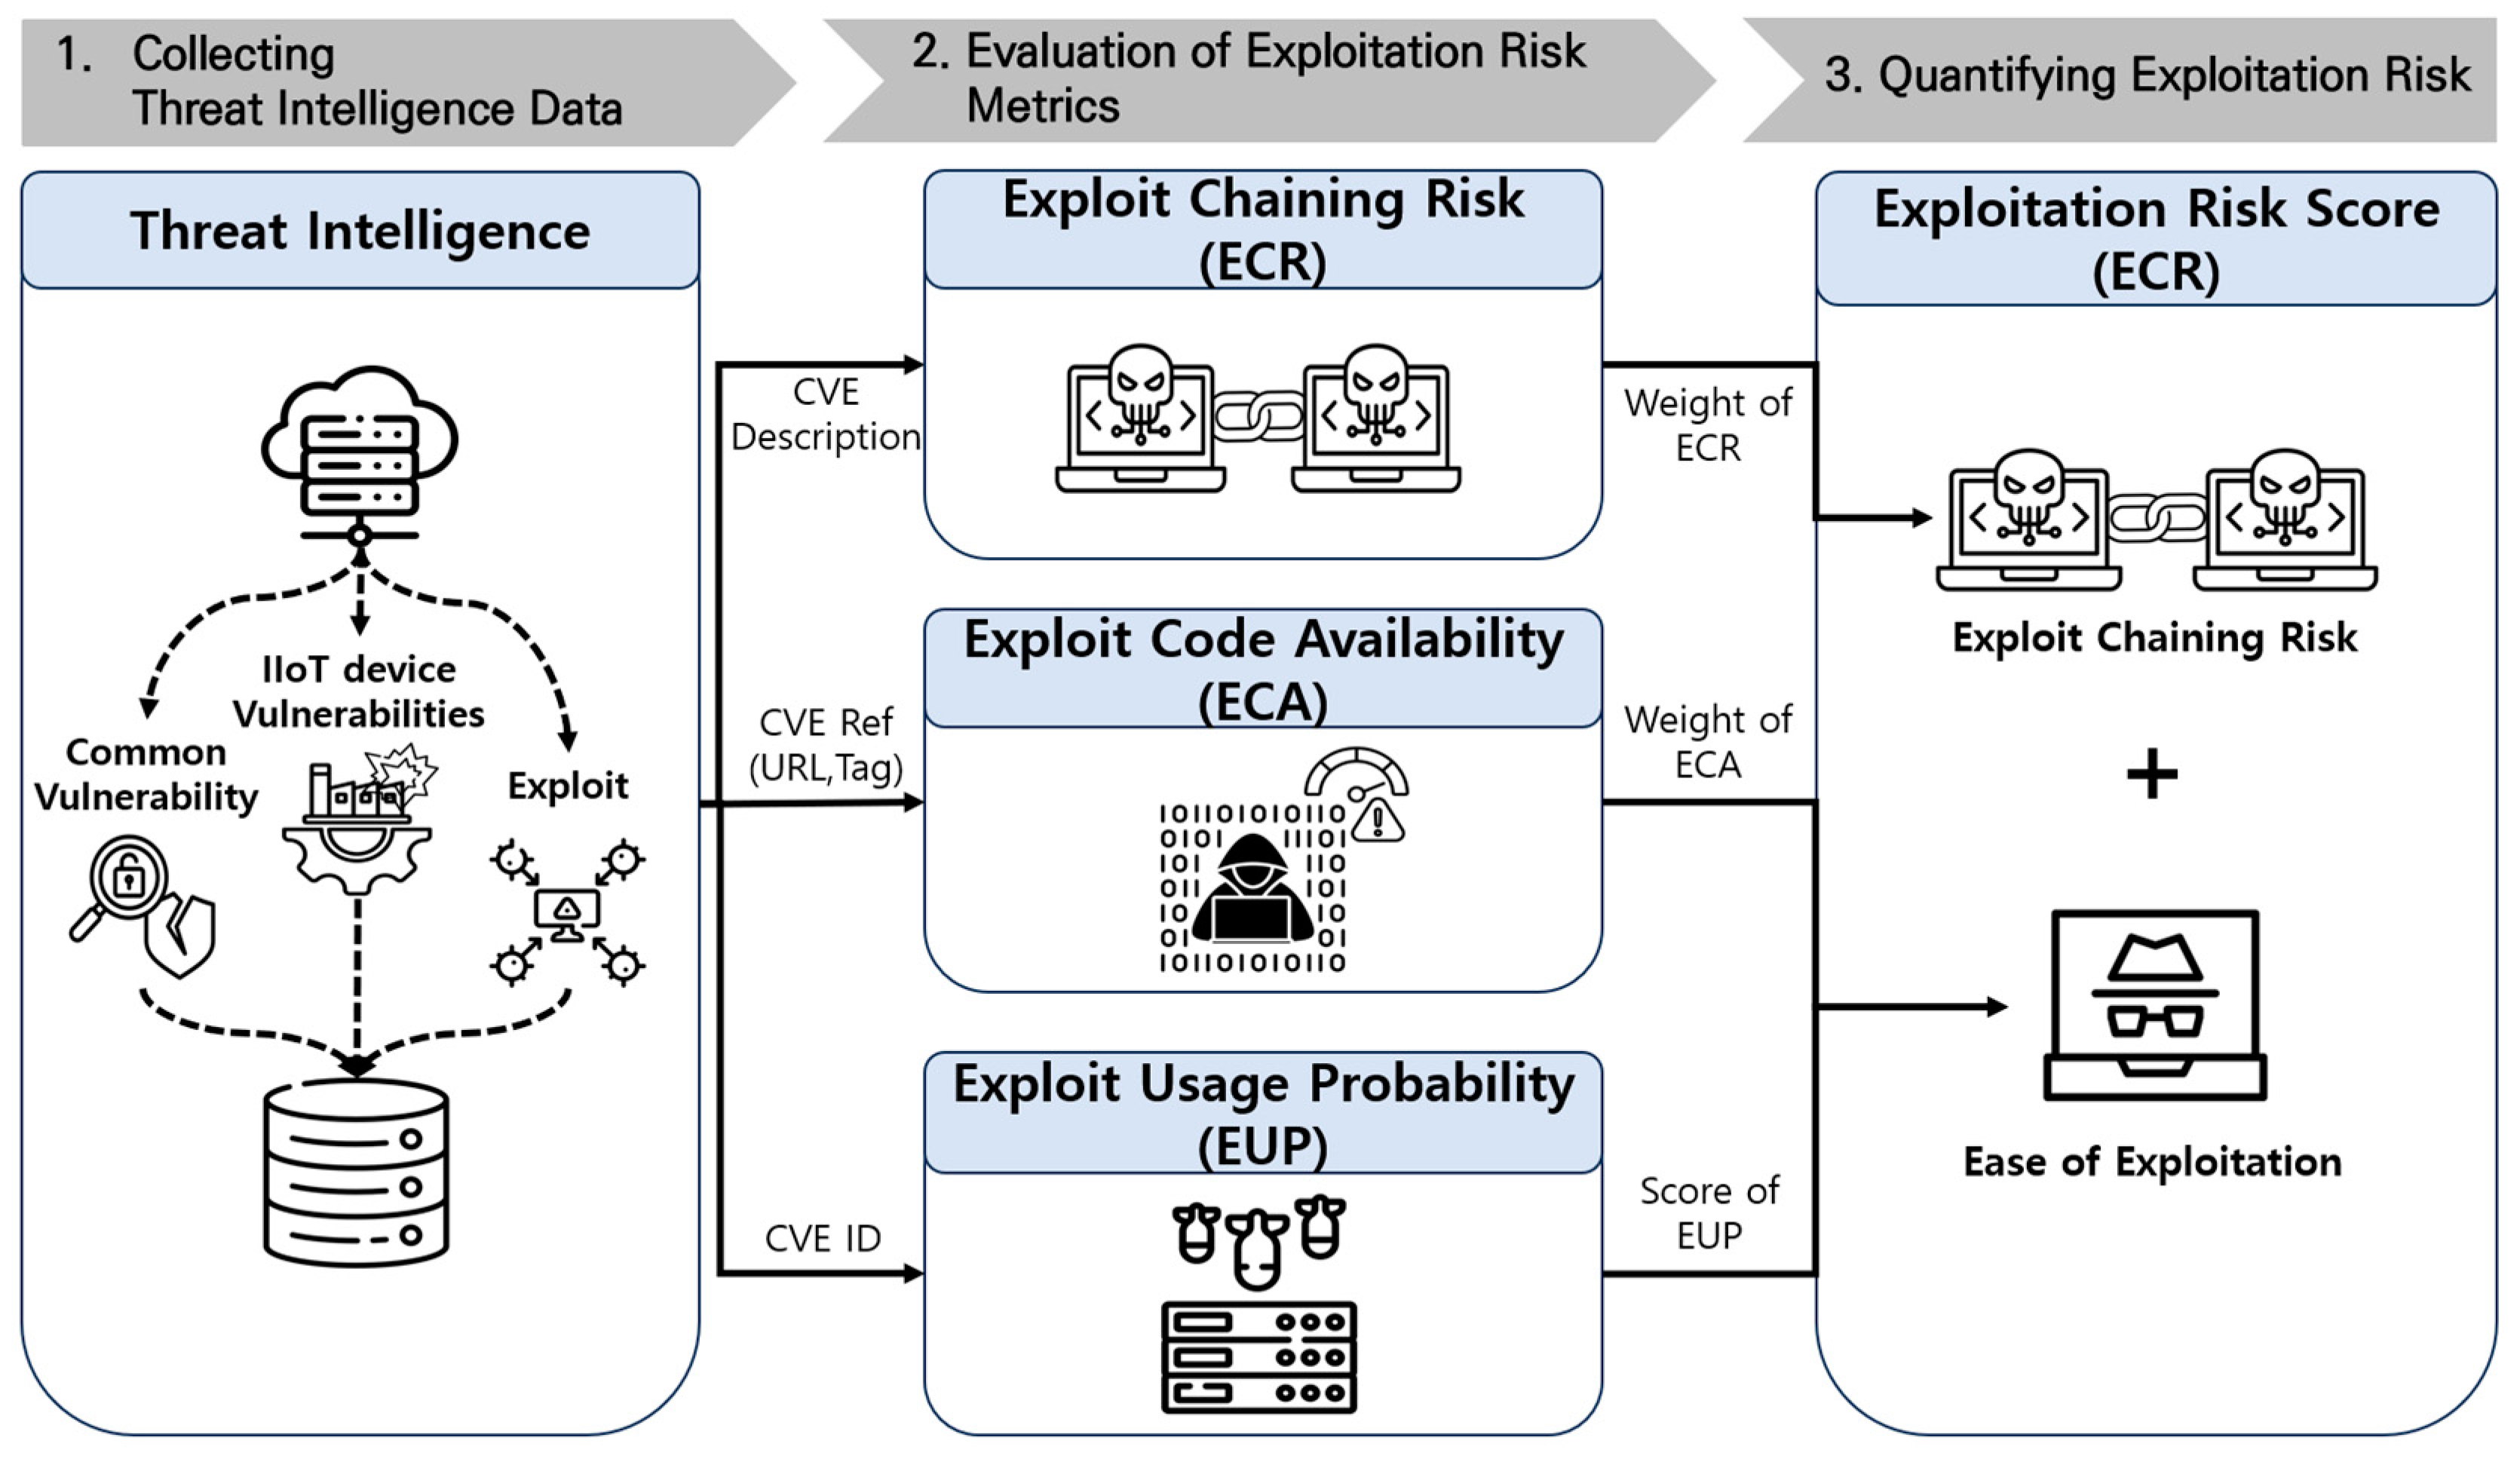
4. Exploitation Risk Assessment for Vulnerability

Considering the limitations of existing vulnerability assessment schemes and related research, this study proposes an assessment approach to evaluate the risk of exploiting vulnerabilities in real-world environments. Figure 2 shows the overall process of the exploit risk score (ERS) assessment study conducted in this study. First, in order to reflect the OT/ICS environment in addition to the vulnerabilities in the IT environment, we collect vulnerability information that occurred within IIoT devices and threat information that exploited those vulnerabilities. Next, based on the collected information, the following three aspects of exploitation risk metrics are evaluated. We evaluate exploit chaining risk, which refers to the cascading risk of attack techniques that can be exploited to achieve an attacker’s motives, the level of availability of attack code leveraged by an attacker, and the probability of successful exploitation. Finally, we quantify the actual risk of exploitation of the vulnerability using the three metrics evaluated.

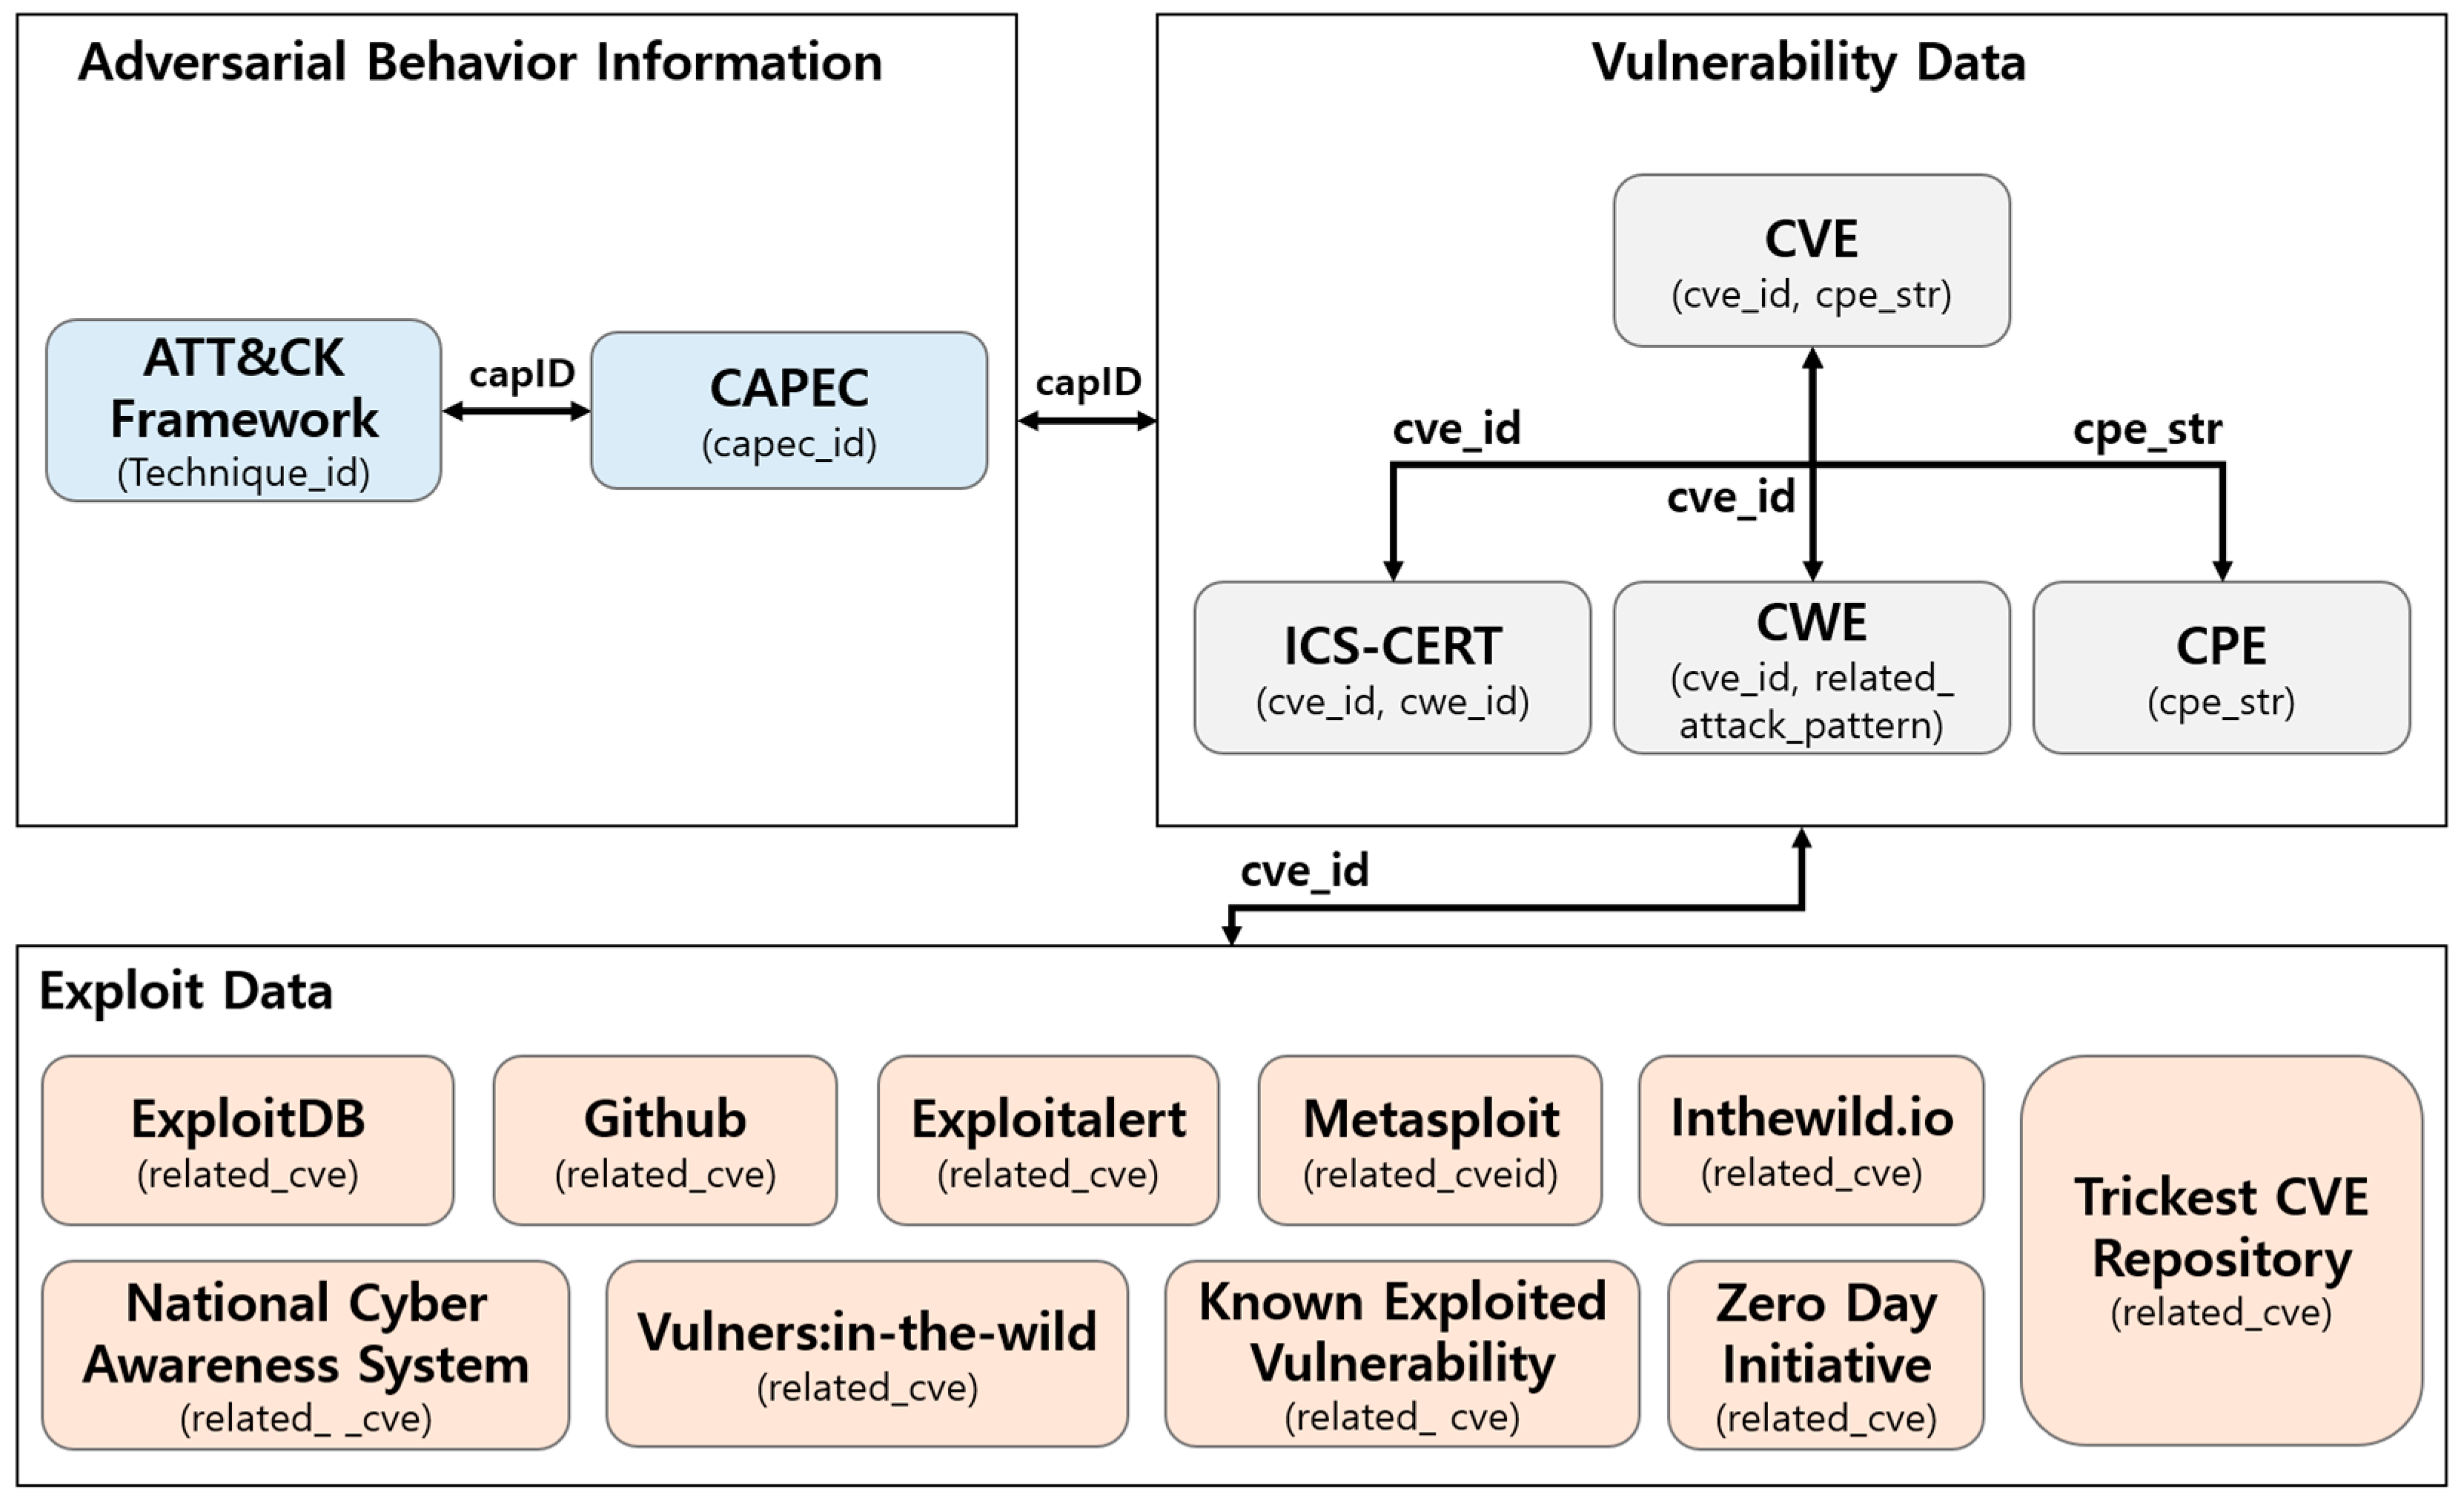
4.1. Collecting Vulnerability/Exploit Data

The data utilized in this study can be broadly categorized into (1) vulnerability-related data and (2) exploit-related data. Vulnerability-related data consist of data from various sources, including common vulnerabilities and exposures (CVEs), common platform enumeration (CPE), common weakness enumeration (CWE), and common attack pattern enumeration and classification (CAPEC) datasets obtained from the National Vulnerability Database (NVD). In addition, we use insights from the MITRE ATT&CK framework, which provides an analysis of the tactics, techniques, and procedures used by various attack groups. To ensure a standardized source of information, we also used the Cybersecurity and Infrastructure Security Agency’s (CISA) ICS-CERT Advisories. This source provides insight into the types of vulnerabilities in OT and ICS environments, thereby aiding the development of our assessment approaches.
To classify exploit code maturity and assess severity within OT and ICS environments, we utilized exploit data from exploit DB and GitHub, which provide proof-of-concept (PoC) information as seen in previous studies, along with data from Exploitalert. We also referred to the Trickiest CVE Repository, which provides updated PoC information on publicly available vulnerabilities. To obtain information on exploited vulnerabilities, we leveraged known exploited vulnerabilities (KEV) data, which provide details on exploited vulnerabilities. We consulted the National Cyber Awareness System (NCAS), which provides information on security issues, vulnerabilities, and exploits in infrastructure and advanced persistent threat groups. In addition, we referred to the Zero-day Initiative, Vulners, and in the wild.io, which provided vulnerability details and exploits utilized in zero-day and in-the-wild attacks. We also used Rapid7’s Metasploit, which provides automatically combined attack module information for vulnerabilities, to collect comprehensive exploit information for publicly available vulnerabilities.
Each piece of collected vulnerability information is linked on the basis of specific attributes, while exploit data are linked to vulnerability information using the source vulnerability identifier, CVE. Figure 3 provides a visual representation of these connections.

4.2. Evaluation of Exploitation Risk Metrics

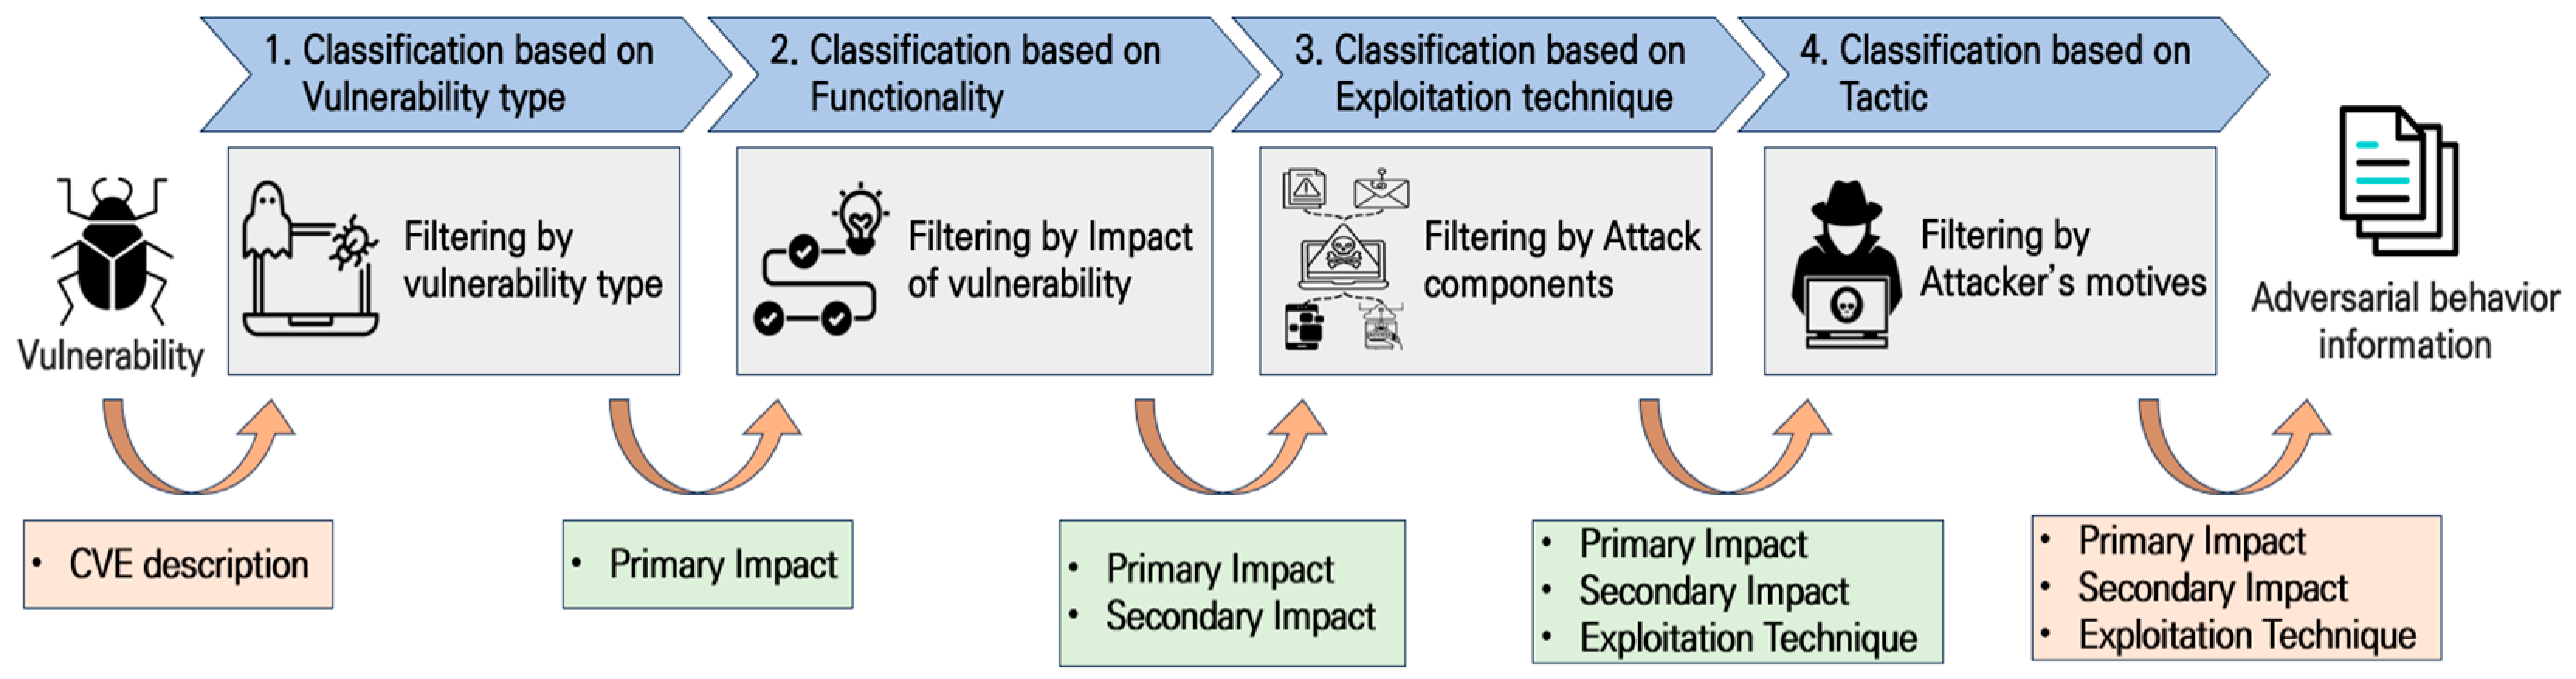
4.2.1. Exploit Chaining Risk

Attackers do not restrict themselves to exploiting a single vulnerability to accomplish a single attack motive; rather, they often exploit multiple vulnerabilities in succession. This practice is known as vulnerability chaining, which involves the consecutive exploitation of multiple vulnerabilities during a single attack [23]. To quantify the probability of vulnerability chaining, we rely on information about the attacker’s tactics and techniques (TTPs) used to exploit these vulnerabilities. We use the attack technique applied to exploit the vulnerability and the impact information following a successful exploit. The impact information guides us in identifying the exploit techniques capable of causing it, leading to the determination of the probability of chained attacks targeting a single vulnerability. It is important to note that our research aims to assess the likelihood of chained attacks, not to identify specific vulnerabilities that can be chained together.
To facilitate the mapping of TTPs to identify specific CVEs and their subsequent impact techniques, we use a mapping methodology provided by MITRE. This methodology maps attack techniques and their subsequent impact on a CVE, categorizing them into three groups: exploitation technique, primary impact, and secondary impact. The exploitation technique is the method used to exploit a specific vulnerability, whereas the primary impact is the benefit an attacker can attain by exploiting the vulnerability. Secondary impact encompasses the subsequent techniques and impacts achievable by an attacker by using the techniques associated with the primary impact.
CVE descriptions include information regarding the type of vulnerability, potential attacker actions upon exploiting the vulnerability, and the attacker’s likely approach. To map TTPs using information contained in CVE descriptions, we follow MITRE’s established methodology [24] for categorizing and mapping related attack techniques to vulnerability types, exploit outcomes, exploit behaviors, and tactics, as shown in Figure 4.
In this study, exploit chaining probability (ECP) refers to the probability of the next technique being employed, given the success of the previous technique. The probability of each technique is calculated based on its frequency of use in attack groups, malware, etc., where it has been observed. These probabilities are used to calculate the probability of a subsequent attack, assuming the previous attack technique was successful. A higher calculated probability suggests that the technique is used more often by multiple attack groups and software, making it more likely to be employed and chained by an attacker.
ECP calculates the probability of chaining from the initial attack technique to the final subsequent attack technique by considering the probability that the subsequent attack will not occur if the preceding attack has occurred. The formula is as follows:
E C P = P A × 1 k = 1 n P ( B k c A + k = 1 n P ( C k c B , = P A × 1 k = 1 n P ( B k c ) + k = 1 n P ( C k c ) ,
Tactics are prioritized and weighted according to their urgency and impact on the security of the target. The prioritization of tactics shown in Table 3 is consistent with the prioritization of each tactic as defined in the key phases of the Technical Cyber Threat Framework published by the U.S. National Security Agency (NSA) [25], and the weights for quantification were defined based on criteria utilized in existing research [12].
The highest priority (1) tactic is “exfiltration and impact”, which is the ultimate goal of an APT attack. The second highest priority (2) tactics include activities that, while not the ultimate goal, pose significant and severe threats if carried out by an attacker, including internal propagation, credential access, and collection. The third highest priority (3) tactic encompasses persistence and privilege escalation. Conversely, tactics of the lowest priority (6) encompass reconnaissance and resource development, which are activities that precede an attacker’s initial penetration of a victim host or network. Tactics with a default priority (5) are initial access tactics that occur after the attacker first penetrates the victim host or network. Execution, defense evasion, detection, and command and control tactics have the fourth highest priority (4). Notably, defense evasion and command and control tactics are categorized under the ongoing process phase of the technical cyber threat framework, indicating that they can be performed at any point in the cyber-attack progression.
The weights for each tactic were assigned as shown in Table 3. Weights are evenly distributed within the range of 1 to 2, from the highest priority (1) to the default priority (5). For the lower-priority tactics performed before full penetration, the weight is assigned at an interval lower than 1.
The exploit chaining risk (ECR) calculated in this study reflects the probability of chaining and the tactical severity of the attack technique being chained. The tactical severity and ECR equation is as follows:
W T = k = 1 n { C ( T k ) × W T k }
E C R V = E C P V × W ( T ) ,
where ECP(V) represents the chaining probability of an attack technique against Vulnerability V, and W(T) is the sum of the weight for the identified tactic T multiplied by the number of attack techniques associated with that tactic. ECR(V) for Vulnerability V is calculated by multiplying these two values.

4.2.2. Exploit Code Availability

Attackers typically develop exploits to target vulnerabilities or use existing exploits for their attacks. In this study, we evaluate exploit code availability (ECA), which gauges the availability of exploit code for vulnerabilities employed by attackers, into four types, including Undefined, Unproven, Proof of Concept, and Attacked, based on the disclosure of exploit code for each level of availability for published vulnerabilities.
To establish these categories, we performed a correlation analysis on published vulnerability data and exploit information sources, considering variations in exploit code availability. We defined classification criteria for each exploit source before conducting the correlation analysis. These sources provide a range of information, including validated exploits, actual exploits, analyzed information, and automated modules.
We establish class definitions based on previous studies [6,7,8] and the level of information provided by the collected exploit sources. Weighting is uniformly distributed within the range (1, 2). Table 4 shows the classification criteria and assigned weights based on the source of the exploit information.
Next, we perform a correlation analysis between CVEs and exploit sources for each class. CVE data provide valuable insights into the extent of vulnerability exploitation by assigning it to an object called references. The reference object has two keys (URL and tag) that are used to capture exploit information. The URL key is paired with a uniform resource locator (URL) that points to reference websites related to the vulnerability, including vendor advisories, security posts, and exploit code sharing. These referenced URLs can be used to infer the credibility and authority of an exploit reference for a CVE. The initial step involves analyzing the frequency distribution of these URLs. Table 5 shows the top 15 referring URLs based on 192,116 CVEs spanning from 1999 to 2022 in the NVD database.
The majority of URLs in this list are provided by IT vendors, such as OpenSuse, GitHub (cloud code repository), Red Hat, Oracle, and IBM. These entities are known as CVE numbering authorities (CNAs) and are authorized to assign CVE IDs to vulnerabilities. CNAs are categorized into seven types, and the current list includes Vendor, Researcher, and Open Source. Vendor CNAs assign CVE IDs to vulnerabilities found in their products, and Researcher CNAs conduct research to identify vulnerabilities covered by published CVEs. In addition, Open Source CNAs produce, manage, or maintain products or services with freely available source code that can be modified and redistributed [26]. These research organizations acknowledge reported vulnerabilities by verifying them, assessing their validity, and assigning a unique CVE ID. This implies that in the case of a CNA with a source of “Vendor”, “Researcher”, or “Open Source”, the vulnerability is considered validated.
The URL list includes four reference vulnerability databases, including SecurityFocus (an online computer security news portal and information security service provider), SecurityTracker (a web portal that tracks the latest security vulnerabilities), Exploit-db (a CVE-compliant archive of publicly available vulnerabilities and corresponding vulnerable software), and PacketStormSecurity (an information security web portal that provides current and historical computer security tools, attacks, and security advisories). These vulnerability databases are frequently cited in the literature as representative sources for assessing CVE-associated vulnerabilities and exploit reports [27,28,29]. Consequently, in this paper, we consider these vulnerability databases to be more reliable sources than other websites.
In this study, we analyzed the frequency distribution of related vendor and vulnerability information URLs for insight into the OT/ICS vulnerability environment. Table 6 presents the top 10 related reference URLs and their corresponding frequencies, all based on the same CVE.
Most of the URLs in this list fall under the Vendor CNAs category, while other links from US-CERT provide analysis and advisories for vulnerabilities found in OT/ICS environments. These URLs fall under the CNA-LR classification and belong to organizations that are authorized to assign CVE IDs for vulnerabilities that extend beyond the scope of traditional CNAs. This includes vulnerabilities reported or observed to CISA and vulnerabilities affecting the ICS or healthcare industries. For this paper, we consider these URLs to be validated sources for ICS/OT vulnerabilities.
In addition, tag keys are paired with values associated with different categories of reference resources, including vendor advisory, third-party advisory, technical description, vulnerability database (VDB) entry, mitigation, exploit, and patch. We performed an exploratory analysis of the most frequently used tags. Table 7 shows the frequency distribution of tags using data from 1999 to 2022 in the NVD. Each CVE may have contained more than one tag, and based on the frequency distribution, the tags “Third-party advisory,” “Vendor advisory,” and “VDB entry” accounted for over half of all tags.
To determine the availability of the exploit code, we performed an association analysis. In addition to the results from the URL and tag frequency analysis, we explored the connection between the previously classified exploit sources and the reference information (URL and tags) associated with the CVE. Initially, we performed an association analysis between URLs and each predefined class of exploit sources. This allowed us to classify and define the extent of exploit-related information contained in the URL corresponding to each CVE. We also performed a similar association analysis for tag information, classifying and defining the level of availability of exploiting the information provided by individual tags and combinations of tags. Figure 5 shows the results of the association analysis using URL and tag information for the sources classified as PoC and Attacked.
Initially, we analyzed the referring URLs of each source category and their corresponding CVEs to determine the distribution of the probability of providing exploit information at 25%, 50%, and beyond. Our analysis revealed that CNA links corresponding to Vendor and Researcher, along with “securityfocus.com”, “securitytracker.com”, “exploitdb.com”, and “secunia.com”, were primary providers of Proof of Concept-level exploit information. For Attacked-level exploit information, the most common sources included general CNA and CNA-LR links, “packetstormsecurity.com” and “zeroday-initiative.com”.
Subsequently, we delved into the results of the association analysis involving tags and combinations of tags. Notably, we observed several common tags, such as “Third Party Advisory”, “Vendor Advisory”, “Exploit”, and “VDB Entry”, for both Proof of Concept- and Attacked-exploit levels. Among these, the single tag “Exploit” and the combination of “Vendor Advisory” were prevalent, encompassing approximately 70% of CVEs in the “Proof of Concept” class. In the “Attacked” class, at least two tag combinations, including “Third Party Advisory” or “Vendor Advisory” were present in approximately 70% of the four most common tags. Based on these results and the frequency analysis performed earlier, we established the classification criteria shown in Table 8.

4.2.3. Exploit Usage Probability

Exploit usage probability (EUP) signifies the likelihood that an attacker will exploit a vulnerability in an actual attack. In this study, we use the results of the exploit prediction scoring system (EPSS), a scoring system that calculates the likelihood of a vulnerability being exploited within a 30-day window. EPSS maintains real-time updates with exploit information and incident reports related to vulnerabilities, resulting in a daily exploitability score. This score is considered to be one of the considerations within a risk-based vulnerability management approach. Effective vulnerability management requires a comprehensive severity assessment that incorporates insights from different perspectives. This study uses the EPSS score, in conjunction with the ECA weight assigned to each vulnerability, to calculate the ease of exploitation (EoE), which provides information on how easily a vulnerability can be exploited. The concept of EoE and its role in calculating the exploit risk of a vulnerability will be discussed further in Section 4.3.

4.3. Quantification of Exploitation Risk

To gauge the risk associated with exploiting a vulnerability, we use the three metrics mentioned earlier. The exploitation risk we calculate in this study is the risk of an attacker exploiting a vulnerability by considering both the tactical risk associated with chaining-related attack techniques and the ease of exploitation.
The risk of the cascade of attack techniques related to the tactical aspects of the vulnerability aligns with Equation (3) derived in Section 4.2.1. In addition, the EoE is calculated by considering the EUP and ECA for the vulnerability. In this regard, the derived exploitation risk score (ERS) formula is as follows:
E C R V = E C P V × W ( T ) ,   ( V :   Vulnerability ,   T :   Tactic )
E o E V = E C A V × E U P V
E R S V = E C R V + E o E V

5. Case Study

To illustrate the proposed evaluation method, we selected a single vulnerability and calculated the exploitation risk score for that specific vulnerability using the evaluation procedure. Subsequently, we compared the calculated risk with existing vulnerability score evaluation results. In addition, a case study was conducted by recreating an actual attack scenario to verify the feasibility of the proposed method within the OT/ICS environment.

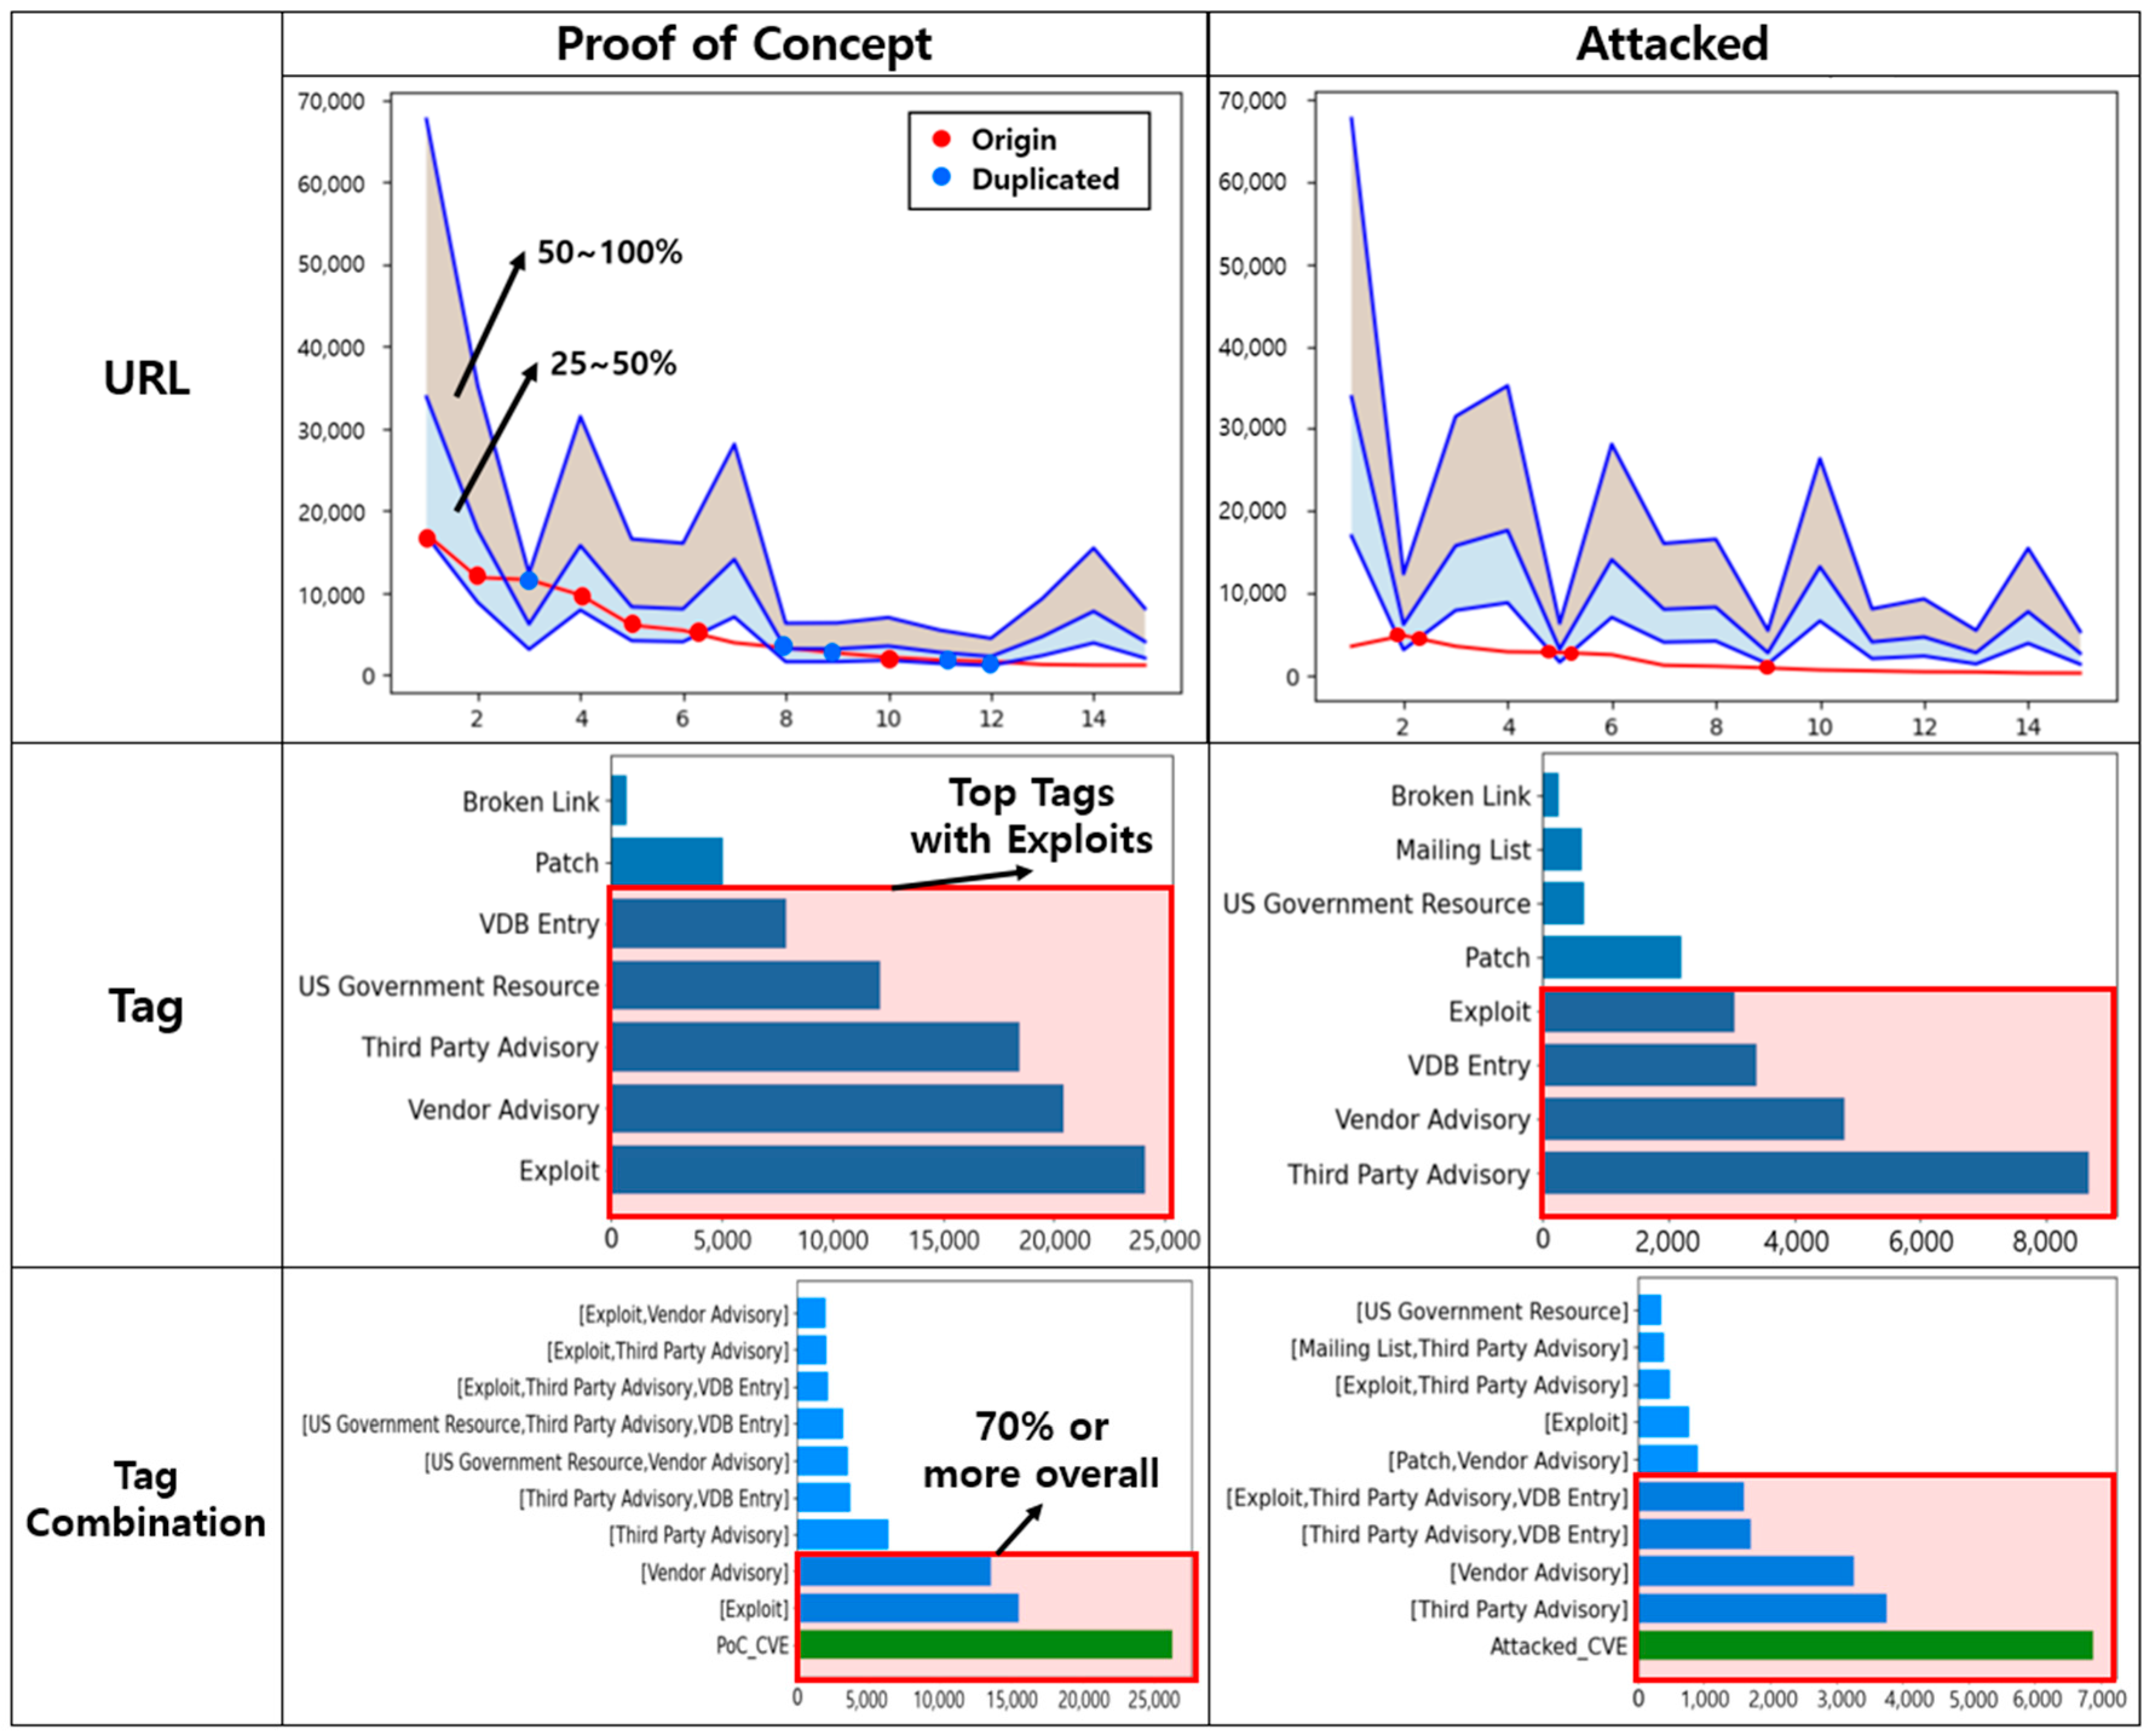
5.1. Application of the Assessment Method for Vulnerability

We applied our assessment method to the vulnerability CVE-2023-36844, which was initially released in August 2023 with a CVSS score of 5.3. This vulnerability pertains to a PHP external variable modification vulnerability in Juniper Networks Junos OS J-Web, which could allow an unauthenticated, network-based attacker to gain control of critical environment variables. Successful exploitation could allow an attacker to cause a loss of system integrity.
The chained vulnerabilities are CVE-2023-36845, CVE-2023-36846, and CVE-2023-3684. Here, CVE-2023-36845 was utilized as an initial means of access to control critical environment variables during the course of the attack, and CVE-2023-36846 and CVE-2023-3684 were used to compromise file system integrity on endpoint assets. According to Juniper Networks, the attack campaign compromised approximately 8000+ Juniper instances, with the majority of targets reportedly located in South Korea [30].
To calculate the ECR for this vulnerability, we began by mapping the techniques used to exploit the vulnerability and the techniques that subsequently resulted in impact. As shown in Table 9, we have compiled a list of identified attack techniques and associated tactics linked to vulnerability. Table 9 also provides information regarding the number of attack groups and software that have used these techniques during each phase, in addition to the probability of the technique being used in that specific phase. Based on our identification results, it is evident that this vulnerability is an external variable modification vulnerability that can be exploited for an injection attack. Such an attack could lead to RCE and compromise system integrity.
On the basis of this information, we calculated the ECP for the attack technique causing subsequent impacts, considering the weighting of the tactics utilized, resulting in the final ECR as follows:
E C P ( V ) = P A × 1 k = 1 n P ( B k c A + k = 1 n P ( C k c B = 1 × 1 0.21 × 0.86 × 0.99 × 0.85 × 0.99 × 0.9 + 0.92 × 0.69 × 0.38 = 0.62
W T = k = 1 n { C ( T k ) × W T k } = 1.25 + 1.75 + 4 × 1.5 + 1 + 3 × 2 + 1.5 + 1.25 = 18.75
E C R V = E C P V × k = 1 n { C ( T k ) × W T k } = 0.62 × 18.75 = 11.625
We utilized the exploit code availability and the probability of an actual attack exploiting the vulnerability to determine the ease of exploitation. Table 10 shows the metrics utilized to calculate the exploitation risk score for CVE-2023-36844 and a summary of the existing scoring system scores.
Multiple sources, including Packetstormsecurity, Zero-day Initiative, and inthewild.io, have identified the vulnerability in question. These sources have reported actual attacks that exploit this vulnerability. Consequently, based on the predefined criteria, ECA is assessed as Attacked.
To determine the probability of the vulnerability being exploited and resulting in an actual attack, this study uses the EPSS score, which, as explained earlier, calculates the probability of the vulnerability being exploited within 30 days. For CVE-2023-36844, the current probability of exploitation within 30 days is approximately 38%. Therefore, the predefined metric EUP in this paper has a value of 0.38.
Based on this, EoE, which signifies the ease with which an attacker can exploit the vulnerability, is calculated. Consequently, the final exploitation risk score (ERS) is calculated, yielding a value of 12.385, as follows:
E o E ( V ) = E C A ( V ) × E U P ( V ) = 2 × 0.38 = 0.76
E R S V = E C R V + E o E V = 11.625 + 0.76 = 12.385
Due to its traditional vulnerability scoring system score of 5.3, many organizations overlooked this vulnerability in their managed vulnerabilities. However, this vulnerability was chained with several other vulnerabilities to launch a successful RCE attack, which compromised the integrity of the target system.

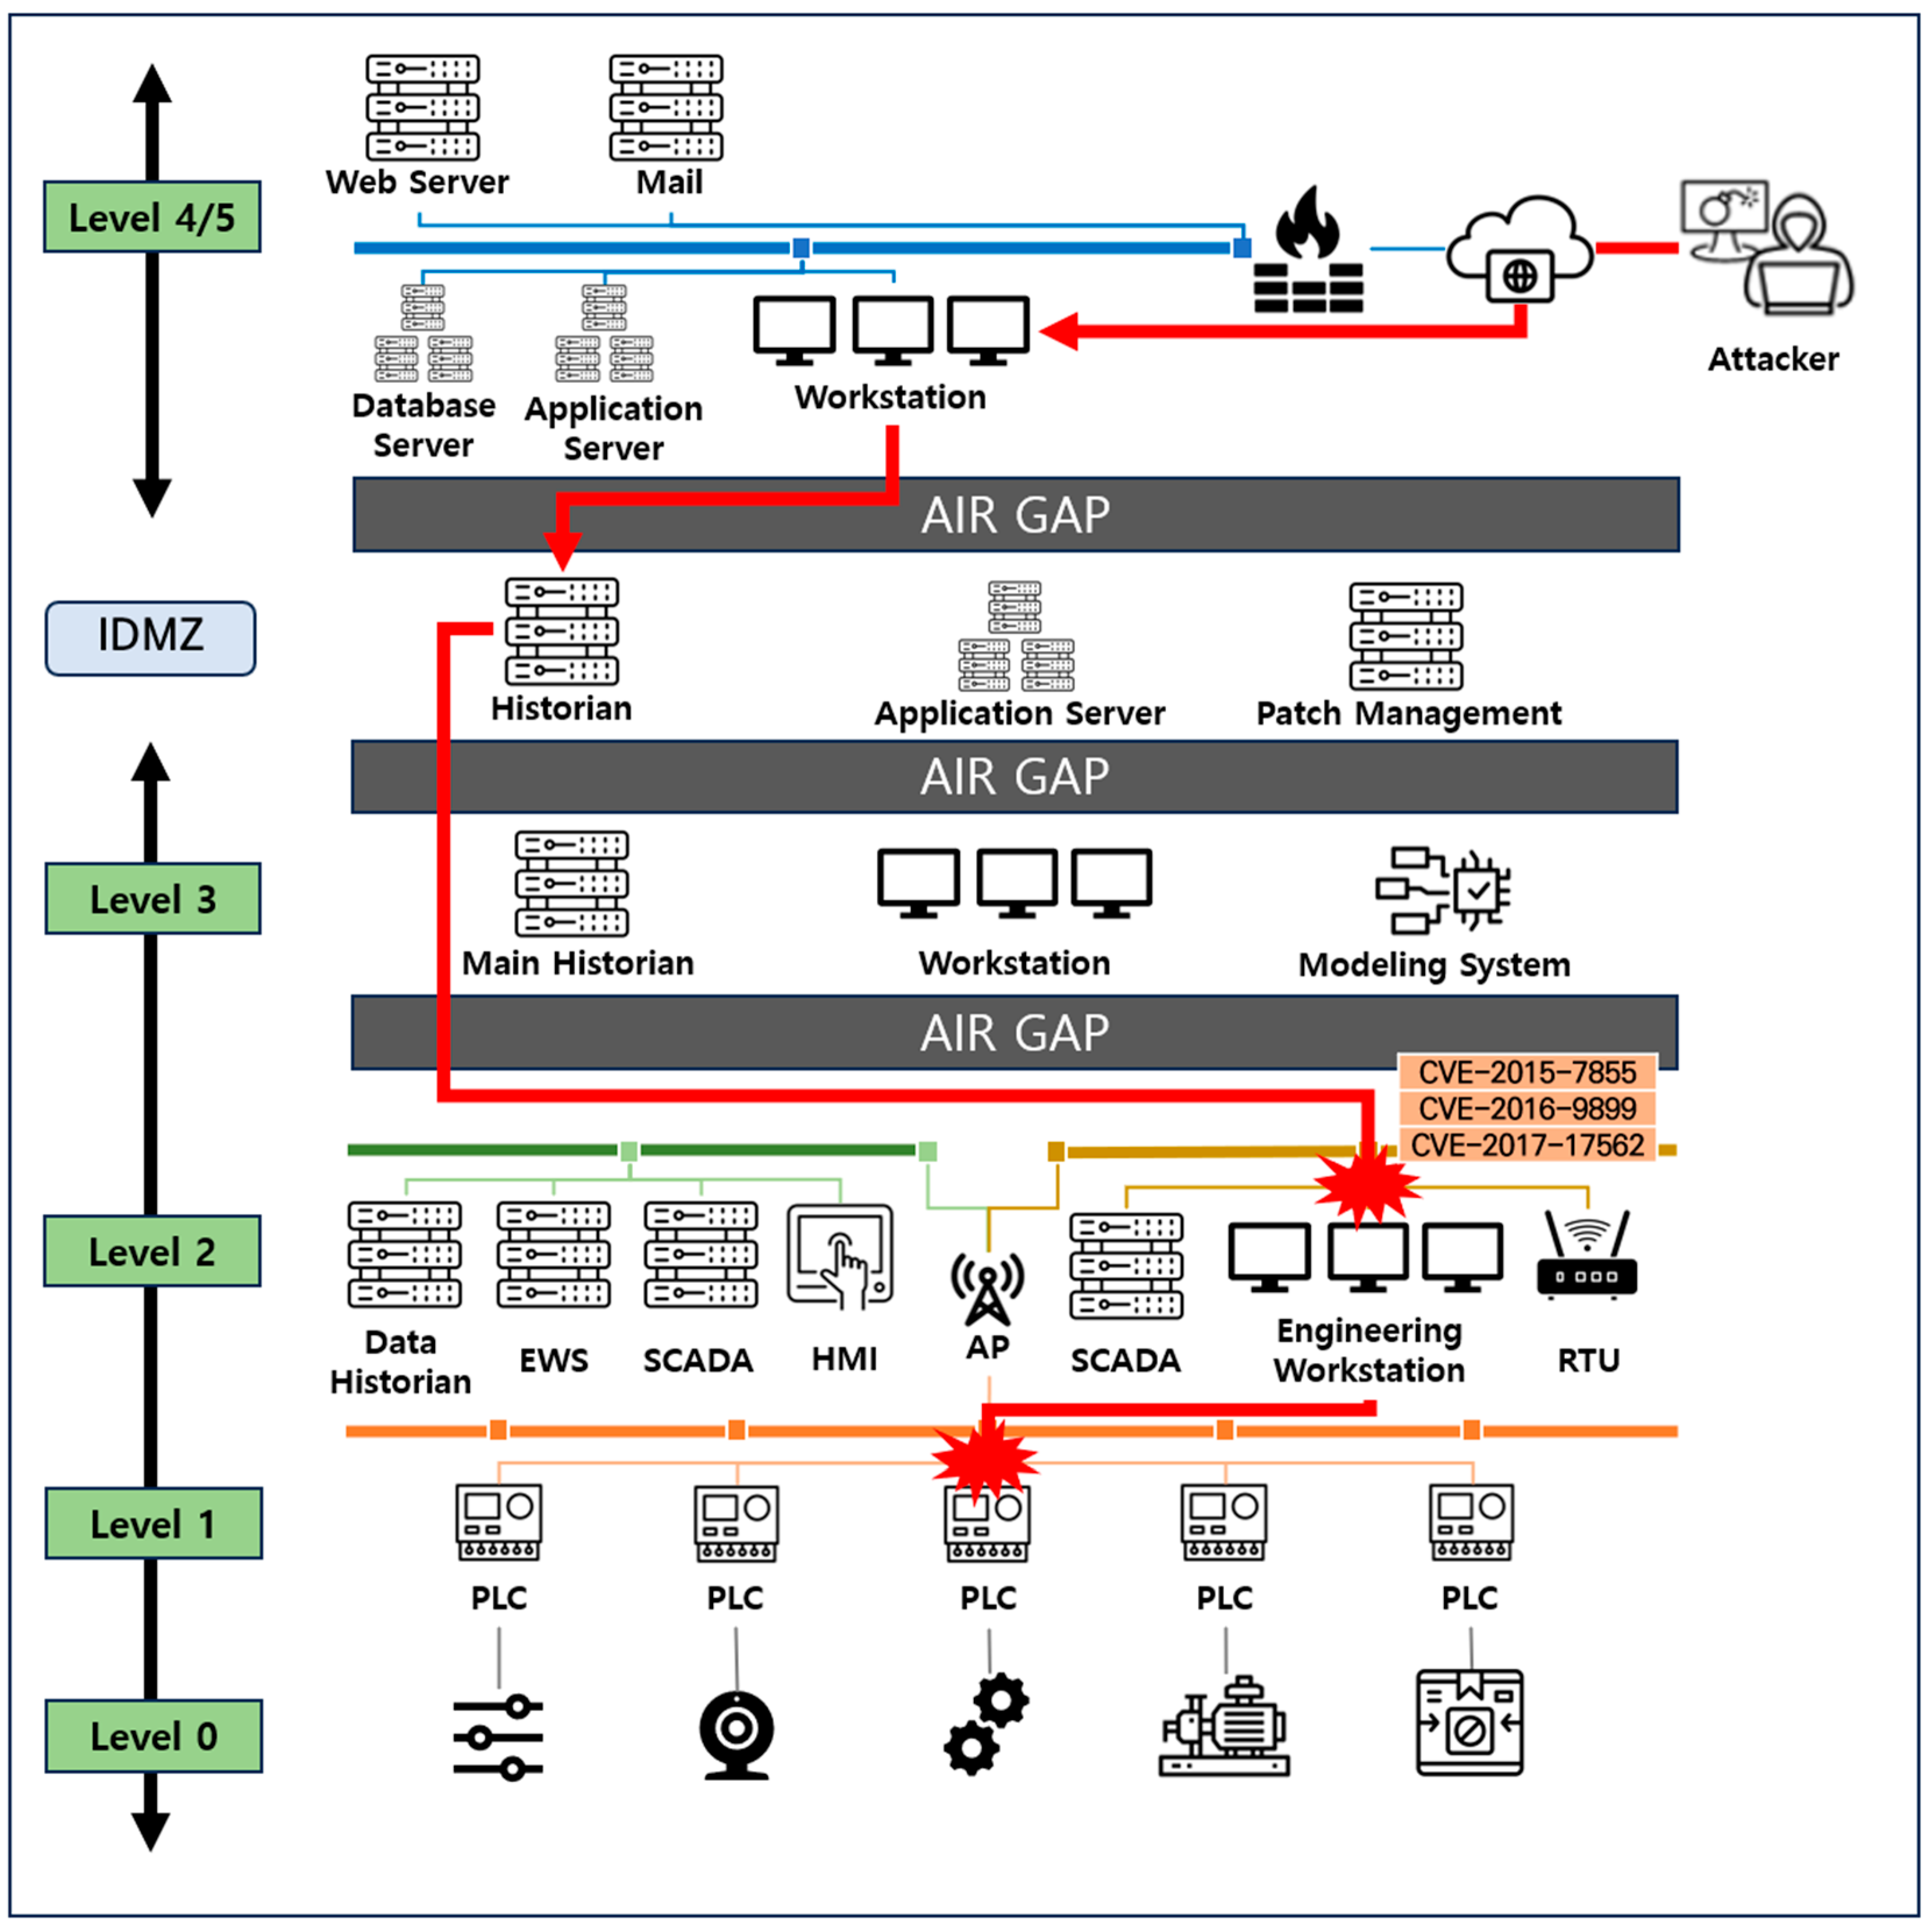
5.2. Application of Exploit Risk Assessment in OT/ICS Environments

To validate the effectiveness of the vulnerability risk assessment method proposed in this study, we recreated a scenario based on a real-world threat case as shown in Figure 6. This scenario simulated a network-separated OT/ICS environment, where an attacker exploited a minimized airgap vulnerability between the business and industrial areas to perform process control and information leakage attacks through an external command and control server. Vulnerabilities affecting assets were identified using CVEs sourced from NVD, whereas vulnerabilities targeted by attack execution procedures were identified through Greynoise and threat reports containing information on real-world exploited vulnerabilities that were not collected in this study.
In this study, we applied the proposed vulnerability exploitation risk assessment methodology to the control server, which is a crucial component of the attack scenario that directly or indirectly affects the process. We then performed a comparative analysis of our results with those obtained from existing vulnerability assessment systems.
The control server is equipped with an ecosystem control expert, which is the control software that monitors and controls the subordinate programmable logic controllers (PLCs). An attacker could gain administrative privileges, and remotely issue carefully crafted logic commands to the PLCs for process control. Detailed information about the vulnerabilities identified in the control server is presented in Table 11. This information encompasses not only basic information about each vulnerability but also details on the techniques that could be used for exploitation and the potential impact on an attacker.
We used the mapping methodology employed in this study to map the exploitation techniques utilized by attackers against the vulnerability, as well as the cascading techniques that cause subsequent impacts. Subsequently, we implemented the vulnerability exploitation risk assessment as outlined in this study. Table 12 evaluates each of the proposed indices for exploited vulnerabilities to produce a final exploitation risk score.
A total of five vulnerabilities were identified in this asset, and among them, only three were exploited. Notably, among these three exploited vulnerabilities, there were vulnerabilities with a score of 7.0 or lower that were not addressed within the existing assessment system. Following the ERS evaluation, the vulnerability CVE-2015-7855 was rated higher than CVE-2019-19281, which had a score of 7.5 in the existing evaluation system. This is primarily due to CVE-2015-7855 having a significantly higher ECR and a significantly higher probability of being exploited and utilized in an attack. Thus, it is confirmed that CVE-2019-19281 has a higher impact once exploited, but CVE-2015-7855 has a higher risk of being exploited. The remaining two vulnerabilities, CVE-2016-9899 and CVE-2017-17562, exhibit nearly identical ECR values. However, the difference in EUP (the probability of the vulnerability being exploited and used in an actual attack) results in a higher ERS score for CVE-2017-17562, reflecting its greater urgency.

6. Discussion

6.1. Review Case Study Results and Contributions

In the first case, we utilized the proposed evaluation system to determine the Exploitation Risk Score in a real-world case where four vulnerabilities were exploitatively cascaded. Specific to this instance, we calculated three metrics for the vulnerability identified as CVE-2023-36844 during the first approach.
When determining the ERS for a vulnerability, the assessment relies on three metrics: ECR, EUP, and ECA. It is essential to have a thorough understanding of the attacker’s motives and techniques to achieve them.
The attack techniques identified based on the potential impact information for CVE-2023-36844 include those related to integrity compromise, which fall into the secondary impact category. This is consistent with the primary impact information for vulnerabilities that have been cascaded in real-world attacks to compromise system integrity. The attack vector is used by multiple APT groups and malware, resulting in a 62% probability of cascading. This means that there is an approximate 62% probability that the integrity compromising vulnerability (CVE-2023-36846, CVE-2023-3684) will be cascaded and exploited by performing an initial approach using CVE-2023-36844. This is combined with a tactical weight that represents the attacker’s aggressiveness and motives to produce an ECR that ultimately represents the risk of an attacker cascading vulnerabilities to achieve their motives based on their attack technique.
The EoE, which denotes the difficulty of an attacker in exploiting a vulnerability, was calculated using the ECA and EUP measurements for CVE-2023-36844. Subsequently, the ECR previously calculated was added to derive the final risk score, ERS.
As a result, unlike the traditional CVSS score, which in this case provides a static severity score for the unchanging attributes of the vulnerability, the ERS provides a dynamic, comprehensive understanding of the attack technique used to achieve the attacker’s motives across three dimensions.
In the second case, we constructed a data leakage attack scenario in a control system environment based on an actual cyber incident. Among them, the evaluation was performed on five vulnerabilities found in the devices where command injection and data leakage occurred, and all three vulnerabilities that were exploited in the actual control system were identified.
Among the evaluation results in Table 12, we can see that for CVE-2015-7855, which was used for exploitation, although its CVSS score is lower than the management target score of 7.0 compared to CVE-2019-19281, it can be confirmed that the final ERS calculated in this paper is higher. CVE-2019-19281 has approximately one higher risk of attack technique chaining to achieve the attacker’s motives than CVE-2015-7855. However, CVE-2015-7855 has a very high probability (97%) of being successfully exploited because validated attack code is available for exploitation. This means that CVE-2015-7855 is relatively less likely than CVE-2019-19281 to be cascaded into high impact attacks if exploited, but the technical level of attack against CVE-2015-7855 that creates the cascading risk is easier and more urgent from a defense perspective. This resulted in a higher final ERS compared to the opposite case, CVE-2019-19281.
As a result, this case demonstrates that the ERS can reflect the true risk of exploitation for a vulnerability within a control system. It also shows that the ERS provides a comprehensive understanding of the vulnerability within a control system to determine the risk of an attack and the urgency of the vulnerability causing the impact.
Based on the case study results, the exploit risk assessment proposed in this paper can serve as a metric to understand the state of vulnerability exploitation within IIoT devices in control system. This is a previously unaddressed area that is critical to understanding its impact on threat propagation and subsequent attacks. The significance of this is that it can be combined with CVSS scores to evaluate the impact of existing exploit results, which can provide defenders with useful information to formulate more effective prioritization for IIoT devices within control systems.

6.2. Comparative Analysis with Existing Studies

This study aimed to capture and quantify how attackers exploit vulnerabilities with what purpose in OT/ICS environments from an offensive security perspective and how easy it is for attacks to succeed. Table 13 compares the evaluation attributes and application environments considered in this study and previous studies based on this.
Evaluation attributes are split into static, which do not change over time, and dynamic, which do. Static attributes include inherent vulnerability characteristics, like attack vector and access rights. Impact factors cover confidentiality, integrity, and availability. Dynamic attributes focus on the ease of exploitation and attacker’s motives, reflecting the likelihood of a successful attack and the motivation of an attacker to carry out an attack.
Unlike previous research, this study considered both the attacker’s goals and ease of exploitation for a complete evaluation of OT/ICS system vulnerability. We found vulnerabilities that pose a significant risk of being exploited based on the attacker’s goals. This shows a thorough evaluation rather than just identifying vulnerabilities based on a single objective of past research.

6.3. Limitations and Future Work

Notably, the current assessment results may rely on ECR for some vulnerabilities with a low probability of exploitation. This reliance stems from two factors.
First, the fact that the current exploit probability prediction, as provided by EPSS, is highly accurate primarily for network vulnerabilities in IT environments. This means that when assessing vulnerabilities in OT/ICS environments, the exploitation information about exploiting vulnerabilities in those environments may not be fully considered.
The second is the fact that the final score based on the EoE, which is calculated based on the ECR, ECA, and EUP that make up the current score, has a large difference in the range of scores for each index. This means that a vulnerability with a high EoE, but with a weak attacker’s motive, may not be considered as dangerous as other vulnerabilities.
Based on these limitations, future research aims to first analyze IIoT device vulnerability data in OT/ICS environments and develop a customized prediction model that can predict the likelihood of exploitation considering such environments. Then, we aim to improve the accuracy of the vulnerability exploitation risk score proposed in this study by conducting a study to derive measures to bridge the evaluation score gap with ECR.

7. Conclusions

Cyber threats are continually evolving, leading to an increasing number of IIoT vulnerabilities in OT/ICS environments, including critical infrastructure. Current vulnerability management methodologies often fall short as they do not adequately consider the temporal characteristics of vulnerabilities or their applicability in non-IT environments.
In our study, we collected and analyzed vulnerabilities and threat data specific to IIoT devices in OT/ICS environments. We proposed three evaluation metrics that encapsulate the risk associated with exploitation from an offensive security perspective and consider the attacker’s motives.
Our results indicate that our approach is more effective at identifying exploited vulnerabilities within all discovered IIoT weaknesses in OT/ICS settings than relying solely on high CVSS scores. Our scoring mechanism provides practical insights into actual exploitations by considering both the ease of exploitation from an offensive security perspective and risks posed by cascading attacks. In future work, we plan to improve accuracy levels associated with exploitability indices by developing a predictive model extending threat characteristics inherent to IIoT vulnerabilities. Our findings serve to identify previously unexplored aspects of the vulnerability exploitation of IIoT devices and their subsequent impact within the control system environment. We believe that our approach, when combined with existing scoring schemes, can significantly enhance the creation of effective prioritization mechanisms.

Author Contributions

Methodology, S.-S.Y. and D.-Y.K.; Validation, K.-K.K.; Formal analysis, D.-Y.K.; Resources, K.-K.K.; Writing—original draft, S.-S.Y.; Writing—review & editing, I.-C.E.; Funding acquisition, I.-C.E. All authors have read and agreed to the published version of the manuscript.

Funding

This research was supported by the Nuclear Safety Research Program through the Korea Foundation of Nuclear Safety (KoFONS) with financial resources granted by the Nuclear Safety and Security Commission (NSSC) of the Republic of Korea (No. 2106061). This work was also supported by the Institute for Information & Communications Technology Planning & Evaluation (IITP) grant funded by the Korean government (MSIT) (No. 2022-0-01203, Regional strategic industry convergence security core talent training business). This research was also supported by the MSIT (Ministry of Science and ICT), Korea, under the Innovative Human Resource Development for Local Intellectualization support program (IITP-2023-RS-2022-00156287) supervised by the IITP (Institute for Information & communications Technology Planning & Evaluation).

Data Availability Statement

No new data were created or analyzed in this study. Data sharing is not applicable to this article.

Conflicts of Interest

The authors declare no conflict of interest.

References

  1. Culot, G.; Fattori, F.; Podrecca, M.; Sartor, M. Addressing Industry 4.0 Cybersecurity Challenges. IEEE Eng. Manag. Rev. 2019, 47, 79–86. [Google Scholar] [CrossRef]
  2. FIRST CVSS Documentation. Available online: https://www.first.org/cvss/specification-document (accessed on 18 June 2023).
  3. Balsam, A.; Nowak, M.; Walkowski, M.; Oko, J.; Sujecki, S. Analysis of CVSS Vulnerability Base Scores in the Context of Exploits’ Availability. In Proceedings of the 2023 23rd International Conference on Transparent Optical Networks (ICTON), Bucharest, Romania, 2–6 July 2023; IEEE: New York, NY, USA, 2023; pp. 1–4. [Google Scholar]
  4. Ruohonen, J. A look at the time delays in CVSS vulnerability scoring. Appl. Comput. Inform. 2019, 15, 129–135. [Google Scholar] [CrossRef]
  5. Figueroa-Lorenzo, S.; Añorga, J.; Arrizabalaga, S. A Survey of IIoT Protocols: A Measure of Vulnerability Risk Analysis Based on CVSS. ACM Comput. Surv. 2020, 53, 1–53. [Google Scholar] [CrossRef]
  6. Weiss, J.; Stephens, R.; Miller, N. Changing the Paradigm of Control System Cybersecurity. Computer 2022, 55, 106–116. [Google Scholar] [CrossRef]
  7. Falco, G.; Caldera, C.; Shrobe, H. IIoT Cybersecurity Risk Modeling for SCADA Systems. IEEE Internet Things J. 2018, 5, 4486–4495. [Google Scholar] [CrossRef]
  8. Torkura, K.A.; Sukmana, M.I.; Cheng, F.; Meinel, C. Continuous auditing and threat detection in multi-cloud infrastructure. Comput. Secur. 2021, 102, 102124. [Google Scholar] [CrossRef]
  9. MITRE ATT&CK. Available online: https://attack.mitre.org/ (accessed on 7 October 2023).
  10. Farris, K.A.; Shah, A.; Cybenko, G.; Ganesan, R.; Jajodia, S. VULCON: A system for vulnerability prioritization, mitigation, and management. ACM Trans. Priv. Secur. 2018, 21, 16. [Google Scholar] [CrossRef]
  11. Elbaz, C.; Rilling, L.; Morin, C. Fighting N-day vulnerabilities with automated CVSS vector prediction at disclosure. In Proceedings of the 15th International Conference on Availability, Reliability and Security, Virtual, 25–28 August 2020; pp. 1–10. [Google Scholar]
  12. Dissanayaka, A.M.; Mengel, S.; Gittner, L.; Khan, H. Vulnerability prioritization, root cause analysis, and mitigation of secure data analytic framework implemented with mongodb on singularity linux containers. In Proceedings of the 4th International Conference on Compute and Data Analysis, Silicon Valley, CA, USA, 9–12 March 2020; pp. 58–66. [Google Scholar]
  13. Ur-Rehman, A.; Gondal, I.; Kamruzzaman, J.; Jolfaei, A. Vulnerability Modelling for Hybrid Industrial Control System Networks. J. Grid Comput. 2020, 18, 863–878. [Google Scholar] [CrossRef]
  14. Chen, H.; Liu, R.; Park, N.; Subrahmanian, V.S. Using twitter to predict when vulnerabilities will be exploited. In Proceedings of the 25th ACM SIGKDD International Conference on Knowledge Discovery & Data Mining, Anchorage, AK, USA, 4–8 August 2019; pp. 3143–3152. [Google Scholar]
  15. Jung, B.; Li, Y.; Bechor, T. CAVP: A context-aware vulnerability prioritization model. Comput. Secur. 2022, 116, 102639. [Google Scholar] [CrossRef]
  16. Singh, U.K.; Joshi, C. Quantitative security risk evaluation using CVSS metrics by estimation of frequency and maturity of exploit. In Proceedings of the World Congress on Engineering and Computer Science, San Francisco, CA, USA, 19–21 October 2016; Volume 1, pp. 19–21. [Google Scholar]
  17. Bulut, M.F.; Adebayo, A.; Sow, D.; Ocepek, S. Vulnerability prioritization: An offensive security approach. arXiv 2022, arXiv:2206.11182. [Google Scholar]
  18. Suciu, O.; Nelson, C.; Lyu, Z.; Bao, T.; Dumitraș, T. Expected exploitability: Predicting the development of functional vulnerability exploits. In Proceedings of the 31st USENIX Security Symposium 2022, USENIX Security 22, Boston, MA, USA, 10–12 August; pp. 377–394.
  19. Edkrantz, M.; Truvé, S.; Said, A. Predicting vulnerability exploits in the wild. In Proceedings of the 2015 IEEE 2nd International Conference on Cyber Security and Cloud Computing, New York, NY, USA, 3–5 November 2015; IEEE: New York, NY, USA, 2015; pp. 513–514. [Google Scholar]
  20. Jacobs, J.; Romanosky, S.; Suciu, O.; Edwards, B.; Sarabi, A. Enhancing Vulnerability Prioritization: Data-Driven Exploit Predictions with Community-Driven Insights. In Proceedings of the 2023 IEEE European Symposium on Security and Privacy Workshops (EuroS&PW), Delft, The Netherlands, 3–7 July 2023; IEEE: New York, NY, USA, 2023; pp. 194–206. [Google Scholar]
  21. Shin, C.; Lee, I.; Choi, C. Exploiting TTP Co-Occurrence via GloVe-Based Embedding with MITRE ATT&CK Framework. IEEE Access 2023, 11, 100823–100831. [Google Scholar]
  22. Cho, S.; Park, Y.; Lee, K.; Choi, C.; Shin, C.; Lee, K. An APT Attack Scoring Method Using MITRE ATT&CK. J. Korea Inst. Inf. Secur. Cryptol. 2022, 32, 673–689. [Google Scholar]
  23. Zhang, W.; Li, D.; Min, X.; Zhai, G.; Guo, G.; Yang, X.; Ma, K. Perceptual Attacks of No-Reference Image Quality Models with Human-in-the-Loop. Adv. Neural Inf. Process. Syst. 2022, 35, 2916–2929. [Google Scholar]
  24. MITRE Engenuity. Available online: https://mitre-engenuity.org/cybersecurity/center-for-threat-informed-defense/our-work/mapping-attck-to-cve-for-impact/ (accessed on 27 October 2023).
  25. NSA/CSS Technical Cyber Threat Framework v2. Available online: https://media.defense.gov/2019/Jul/16/2002158108/-1/-1/0/CTR_NSA-CSS-TECHNICAL-CYBER-THREAT-FRAMEWORK_V2.PDF (accessed on 7 October 2023).
  26. CVE CNAs. Available online: https://www.cve.org/ProgramOrganization/CNAs (accessed on 27 October 2023).
  27. Adebiyi, A.; Arreymbi, J.; Imafidon, C. A neural network based security tool for analyzing software. In Proceedings of the Doctoral Conference on Computing, Electrical and Industrial Systems, Costa de Caparica, Portugal, 15–17 April 2013; pp. 80–87. [Google Scholar]
  28. Mu, D.; Cuevas, A.; Yang, L.; Hu, H.; Xing, X.; Mao, B.; Wang, G. Understanding the reproducibility of crowd-reported security vulnerabilities. In Proceedings of the 27th {USENIX} Security Symposium, {USENIX} Security 18, Baltimore, MD, USA, 15–17 August 2018; pp. 919–936. [Google Scholar]
  29. Dong, Y.; Guo, W.; Chen, Y.; Xing, X.; Zhang, Y.; Wang, G. Towards the detection of inconsistencies in public security vulnerability reports. In Proceedings of the 28th {USENIX} Security Symposium ({USENIX} Security 19, Santa Clara, CA, USA, 14–16 August 2019; pp. 869–885. [Google Scholar]
  30. SOC Prime Security. Available online: https://socprime.com/rs/rule/40ab8bdc-9c02-4f1f-b59d-3045f9b0d4e4 (accessed on 7 October 2023).
Figure 1. CVSS v3.x Metric Group.
Applsci 13 12180 g001
Figure 2. Process of exploitation risk assessment for vulnerability.
Applsci 13 12180 g002
Figure 3. Connections between collected threat intelligence information.
Applsci 13 12180 g003
Figure 4. CVE mapping to MITRE ATT&CK TTPs for Impact.
Applsci 13 12180 g004
Figure 5. Results of correlation analysis of vulnerability URLs and tags by exploit class.
Applsci 13 12180 g005
Figure 6. Examples of attack scenarios in a control system environment.
Applsci 13 12180 g006
Table 1. Tactics in MITRE ATT&CK and number of (sub-)techniques in each tactic.
Tactic IDTactic NameTechniqueSub-TechniqueTotal
TA0043Reconnaissance103343
TA0042Resource Development83745
TA0001Initial Access91019
TA0002Execution142236
TA0003Persistence1994113
TA0004Privilege Escalation138396
TA0005Defense Evasion42142184
TA0006Credential Access174663
TA0007Discovery311344
TA0008Lateral Movement91322
TA0009Collection172037
TA0010Exfiltration16925
TA0011Command and Control92332
TA0040Impact131326
Table 2. Comparison of research characteristics related to vulnerability risk assessment.
Related WorkEvaluation Attribute
Exploit Code AvailabilityExploit UsabilityAdversarial Behavior Intelligence
Ahmed et al. [5]not considerednot consideredconsidered
Jung et al. [6]considerednot considerednot considered
Singh and Joshi [7]considerednot considerednot considered
Bulut et al. [8]considerednot considerednot considered
Suciu et al. [9]consideredconsiderednot considered
Edkrantz et al. [10]consideredconsiderednot considered
Jacob et al. [11]consideredconsiderednot considered
Cho et al. [12]not considerednot consideredconsidered
Table 3. Priority and corresponding weight of tactics.
Tactic IDTactic NamePriorityWeight
TA0042Reconnaissance60.75
TA0043Resource Development60.75
TA0001Initial Access51
TA0002Execution41.25
TA0003Persistence31.5
TA0004Privilege Escalation31.5
TA0005Defense Evasion41.25
TA0006Credential Access21.75
TA0007Discovery41.25
TA0008Lateral Movement21.75
TA0009Collection21.75
TA0010Exfiltration12
TA0011Command and Control41.25
TA0040Impact12
Table 4. Classification criteria based on exploit sources.
Exploit Code AvailabilityWeightClassification Criteria
Attacked2{Metasploit|KEV|NCAS|inthewild.io|Vulners:in the wild|ZDI}
Proof of Concept1.5{ExploitDB|Github|ICS-CERT|exploitalert|Trikest CVE Repository}
Unproven1Not satisfy any rules above
Notes: KEV: known exploit vulnerability, NCAS: National Cyber Awareness System, ICS: industrial control system. ZDI: Zero Day Initiative.
Table 5. Frequency distribution of URLs.
No.URL StringFrequency
1securityfocus.com67,735
2securitytracker.com50,022
3xchange.xforce.ibmcloud.com35,216
4secunia.com31,481
5github.com26,357
6osvdb.org16,532
7vupen.com16,021
8debian.org15,436
9Redhat.com12,751
10exploitdb.com12,317
11Oracle.com10,201
12gentoo.org10,021
13opensuse.org9480
14Openwall.com9320
15Packetstormsecurity.com9271
Table 6. Frequency distribution of URLs related to vulnerabilities of ICS/OT.
No.URL StringFrequency
1us-cert.gov/ics3163
2siemens.com1571
3schneider-electric.com458
4advantech.com218
5rockwellautomation.com 142
6search.abb.com 131
7kaspersky.com 125
8mitsubishielectric.com97
9moxa.com53
10geindustrial.com41
Table 7. Frequency distribution of tags.
No.Tag NameFrequency
1Third Party Advisory182,126
2Vendor Advisory 162,671
3VDB Entry86,220
4Patch68,699
5Exploit43,953
6Mailing List28,934
7Issue Tracking18,654
8US Government Resource13,647
9Release Notes11,150
10Broken Link5712
11Permissions Required4401
12Product3466
13Mitigation3025
14Technical Description1591
15Not Applicable1489
Table 8. Classification Criteria of Exploit Code Availability.
Exploit Code Availability WeightClassification Criteria
Attacked2{CNA(Vendor, Researcher)|packetstormsecurity|zeroday-initiative} Link & {[(‘Vendor Advisory’|’Third Party Advisory’)]&(‘VDB Entry’, ‘Exploit’] Tag)
Proof of Concept1.5{(CNA|CNA-LR)|securityfocus|exploit-db|securitytracker|secunia.com} Link & ([‘Exploit’|‘US Government Resource’] Tags)}
Unproven1Does not satisfy any rules above
Table 9. Identified TTPs and probability information for ‘CVE-2023-36844’.
StepTacticTechniqueProcedureTotal
Procedure
P(tec)PC(tec)
Exploitation TechniqueTA0002T1059333310
Primary
Impact
TA0009T10051792240.790.21
TA0003T1505.003310.140.86
TA0003T113620.010.99
TA0001T1190340.150.85
TA0040T1565.00120.010.99
TA0040T1485230.10.9
Secondary
Impact
TA0040T1499.0041130.080.92
TA0003
TA0004
TA0005
T157440.310.69
TA0003T155480.620.38
Notes: P(tec): probability of an attack skill being utilized, PC(tec): probability of an attack technique not being utilized.
Table 10. Scoring results for ‘CVE-2023-36844’.
CVE IDExploit Chaining RiskEase of
Exploitation
Exploitation Risk ScoreBase Score
ECPW (T)EUPECA
CVE-2023-368440.6218.750.38212.3855.3
11.6250.76
Table 11. Exploited vulnerability basics and tactical/technical information.
CVE IDBase ScoreExploitation TechniquePrimary ImpactSecondary ImpactTactics
CVE-2015-78556.51215
CVE-2023-385585.51203
CVE-2016-98999.81136
CVE-2019-192817.51315
CVE-2017-175628.11136
Table 12. Assessment of exploit risk based on exploit vulnerability information.
CVE IDExploit Chaining RiskEase of
Exploitation
Exploitation Risk ScoreBase ScoreExploited
ECPW (T)ECREUPECA
CVE-2015-78550.849.257.770.9729.716.5O
CVE-2023-3855814.54.50.000421.54.55.5X
CVE-2016-98990.83108.30.866210.0329.8O
CVE-2019-192810.939.58.840.0021.58.847.5X
CVE-2017-175620.8311.59.550.97211.4858.1O
Table 13. Comparison results with existing studies.
Related WorkStaticDynamicApplicable Domain
TypePaperVulnerability CharacteristicImpact FactorEase of
Exploitation
Attacker’s Motives
Severity Assessment[6]5310IT
[7]5310IT
[8]5310IT
Exploitability Assessment[9]0020IT
[10]0020IT
[11]0020IT
Threat Risk Scoring[5]0003IT,OT/ICS
[12]0003IT,OT/ICS
Our work0023IT,OT/ICS
Disclaimer/Publisher’s Note: The statements, opinions and data contained in all publications are solely those of the individual author(s) and contributor(s) and not of MDPI and/or the editor(s). MDPI and/or the editor(s) disclaim responsibility for any injury to people or property resulting from any ideas, methods, instructions or products referred to in the content.

