
Classification of Alzheimer’s Disease Based on White Matter Connectivity Network

Abstract
:1. Introduction
- (1)
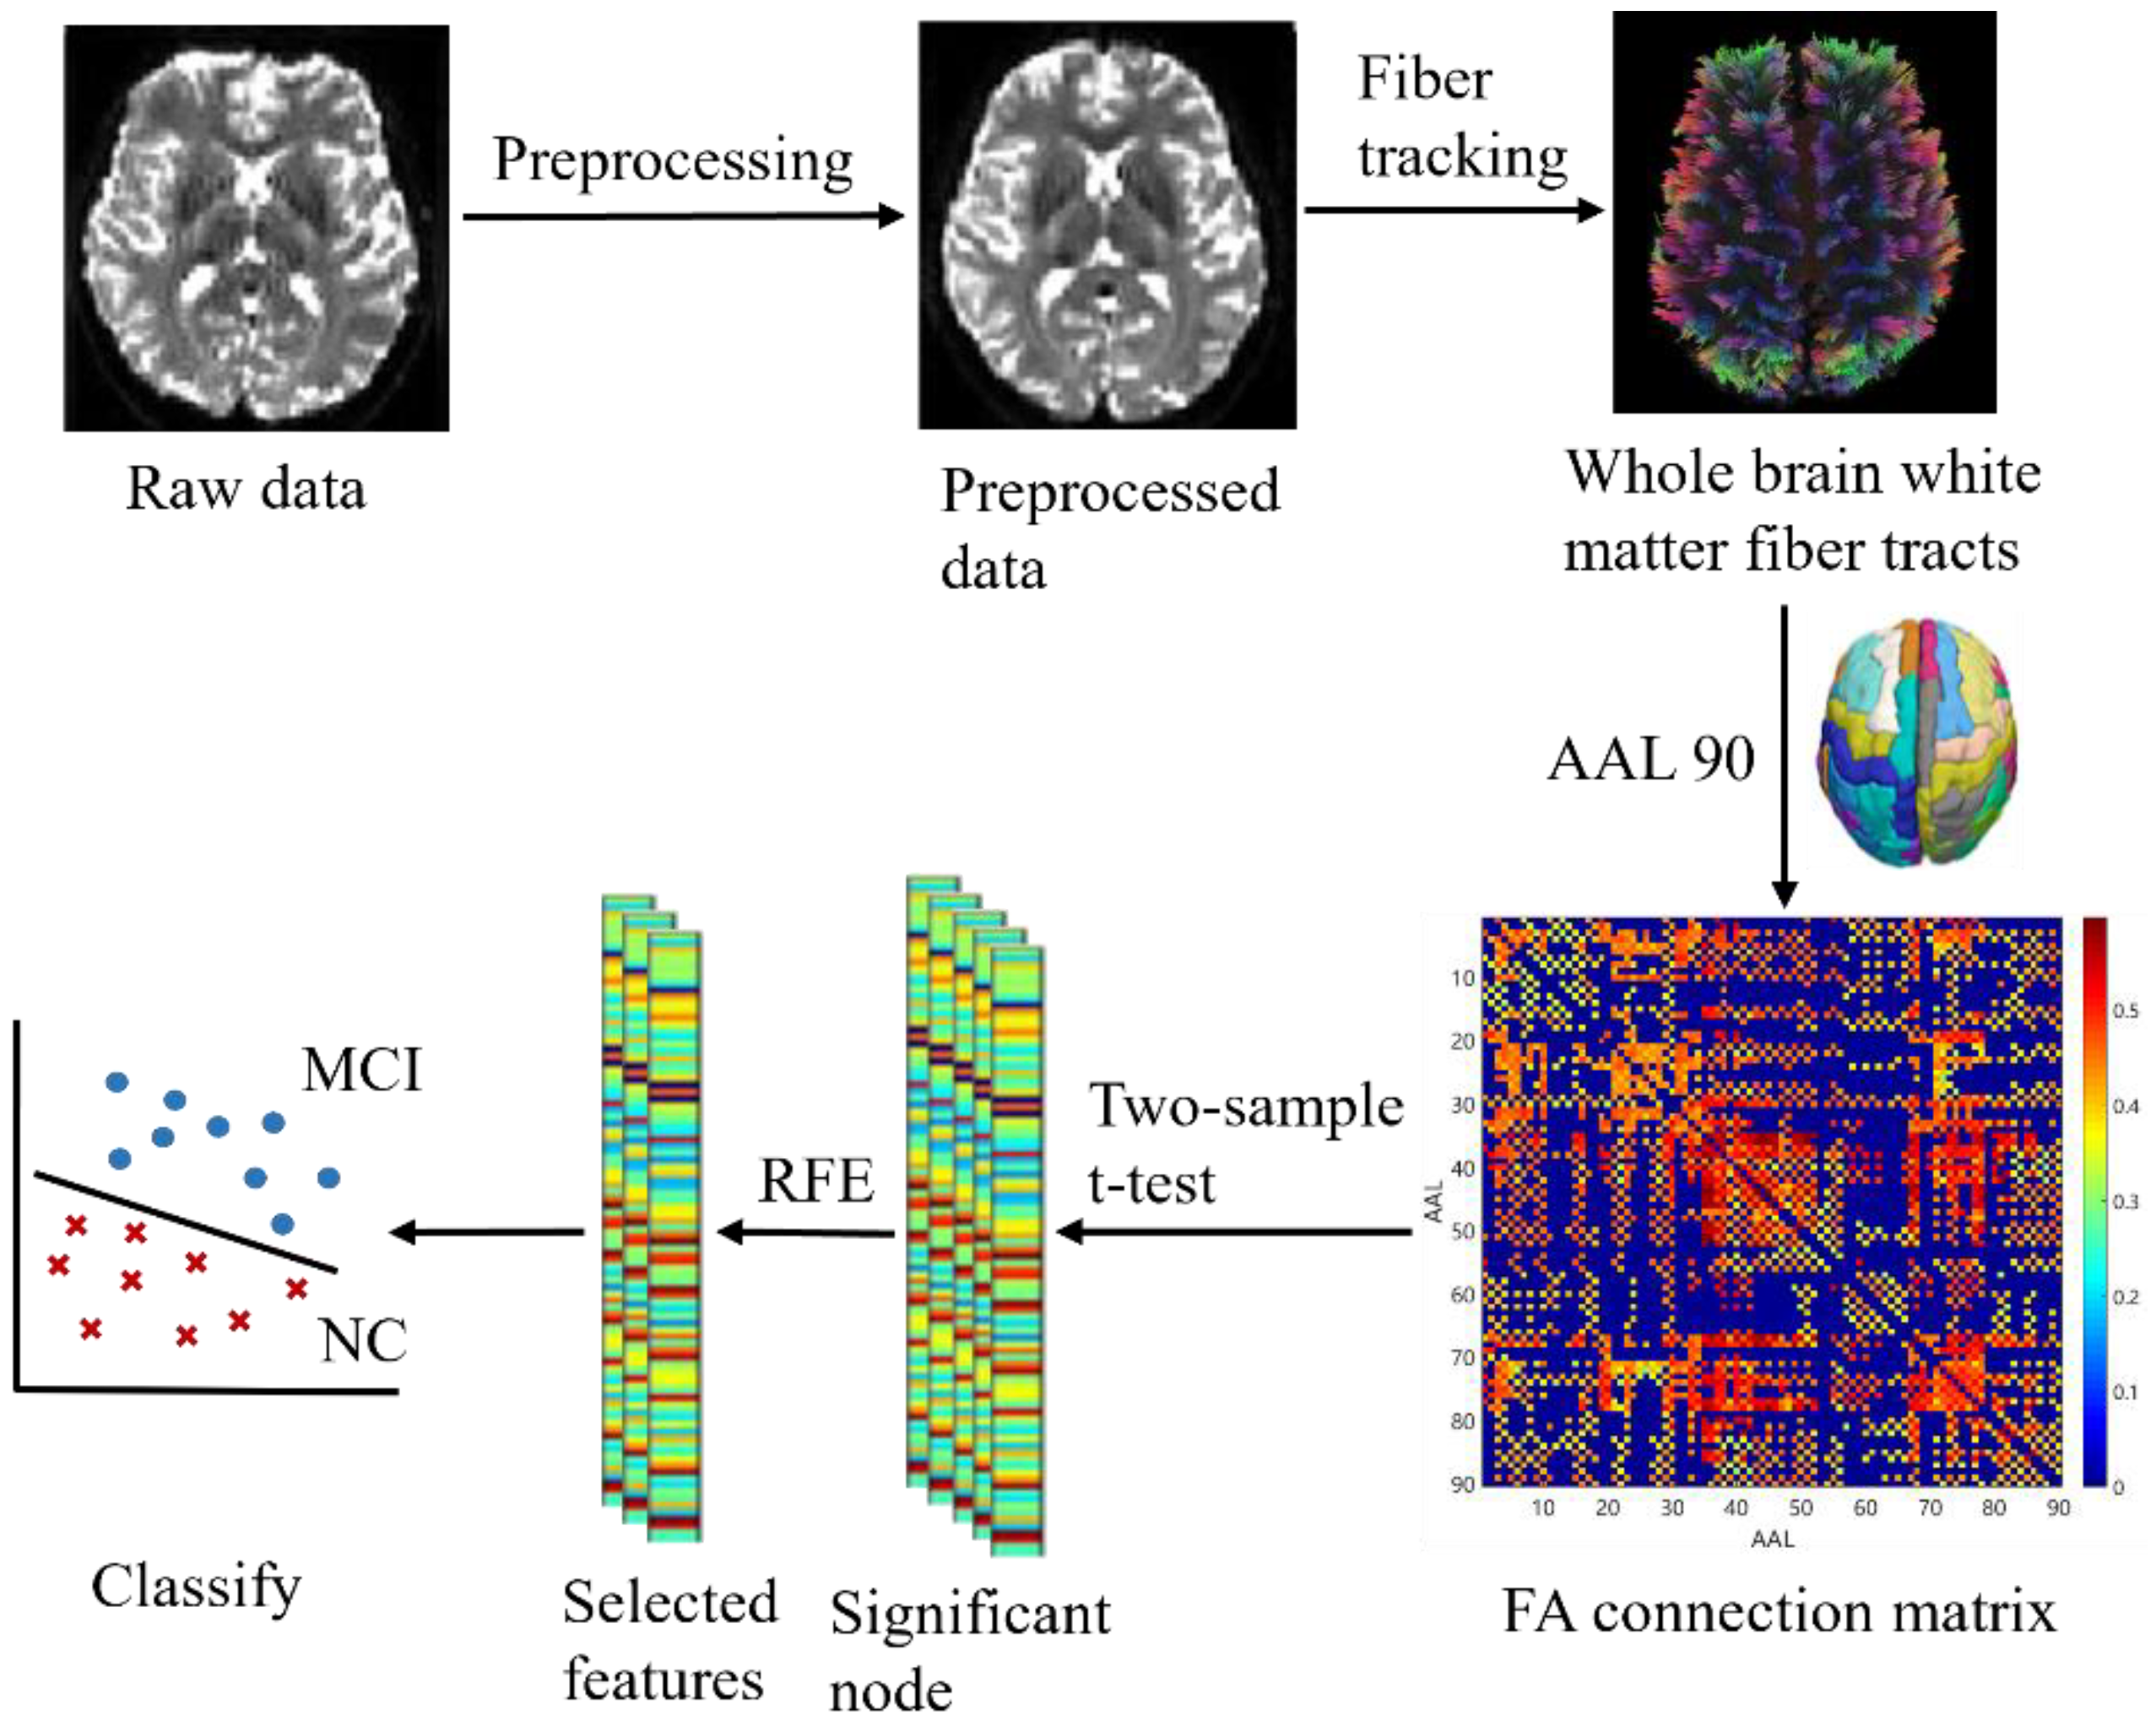
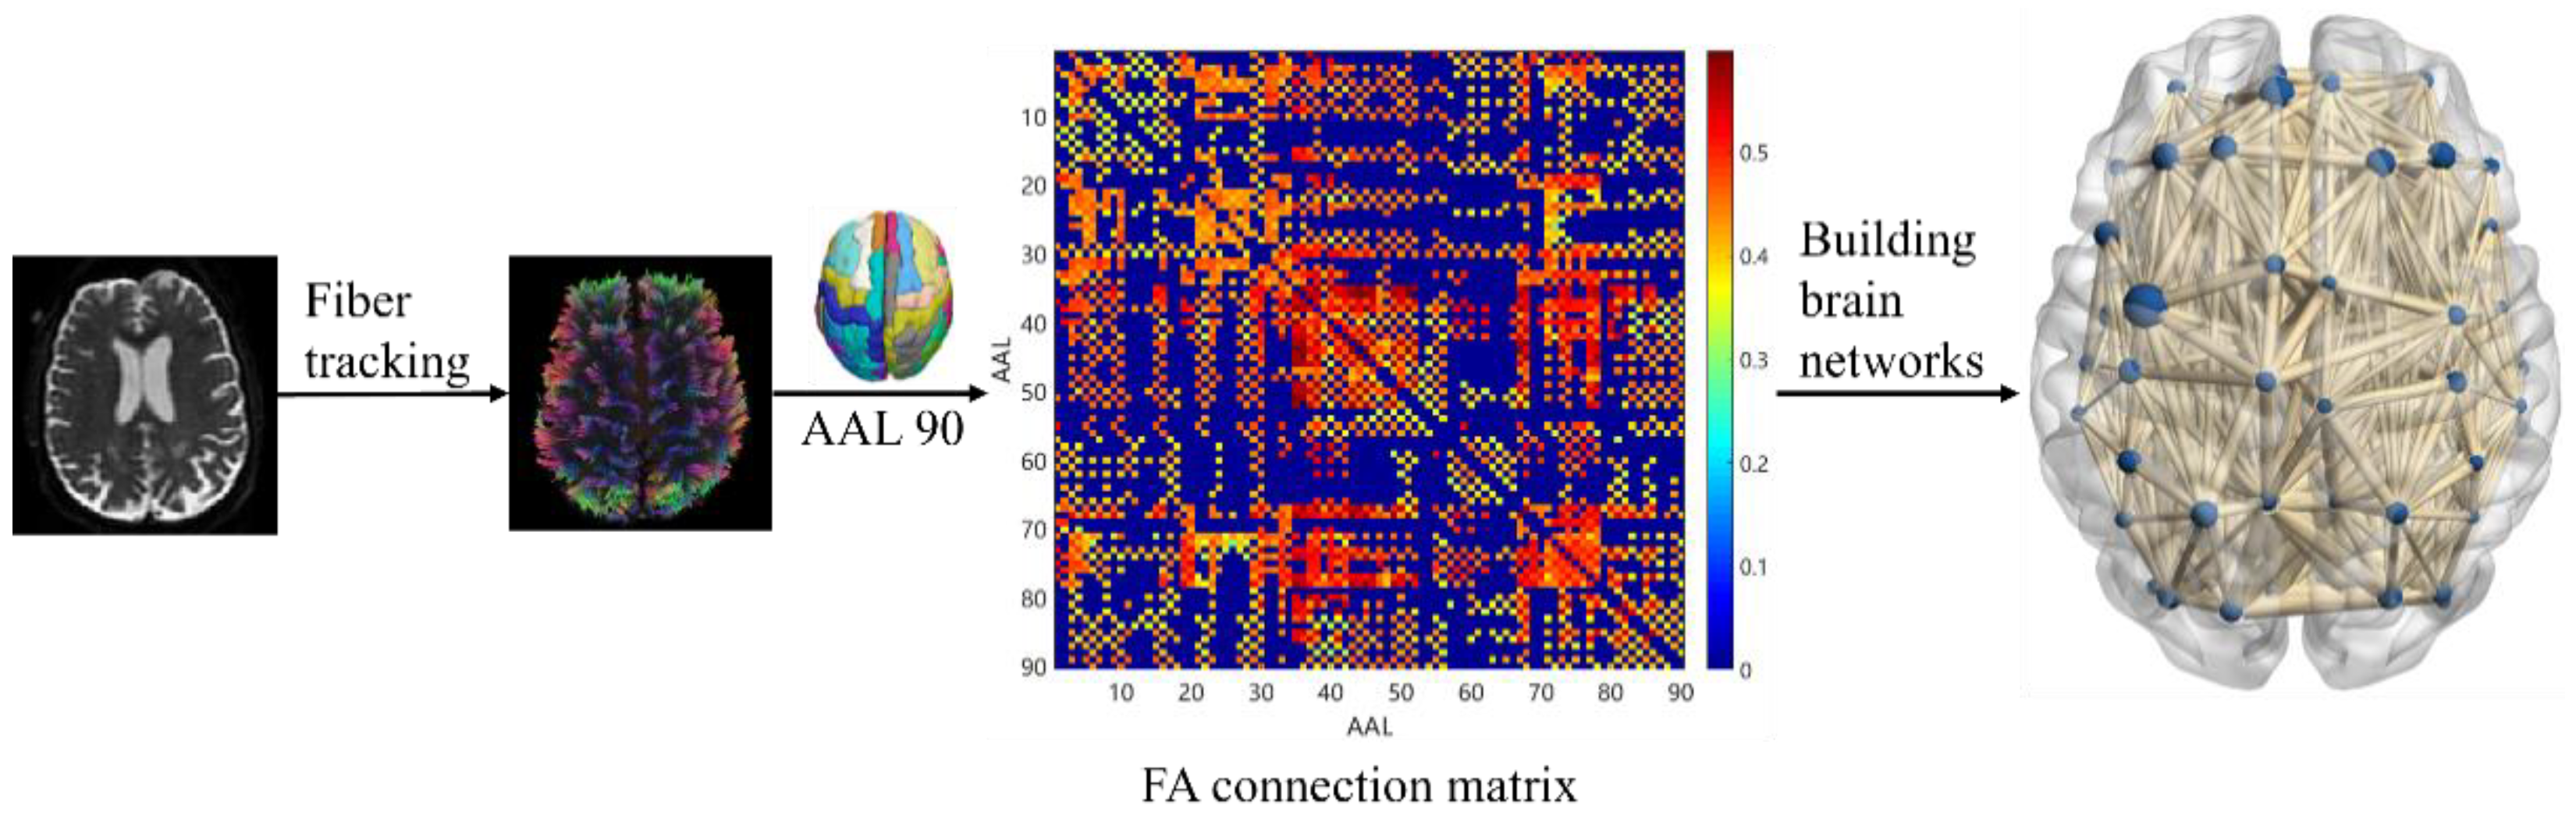
- Calculate the DTI index of the WM connectivity between the brain regions of the whole brain and construct the FA connectivity network as features.
- (2)
- Combine the statistical test and recursive feature elimination (RFE) [31] to screen the combination features with better classification effects. The contribution of features was also calculated using RFE to analyze the pathological mechanisms of AD and MCI.
2. Materials and Methods
2.1. Subjects and Experimental Environment
2.2. System Pipeline
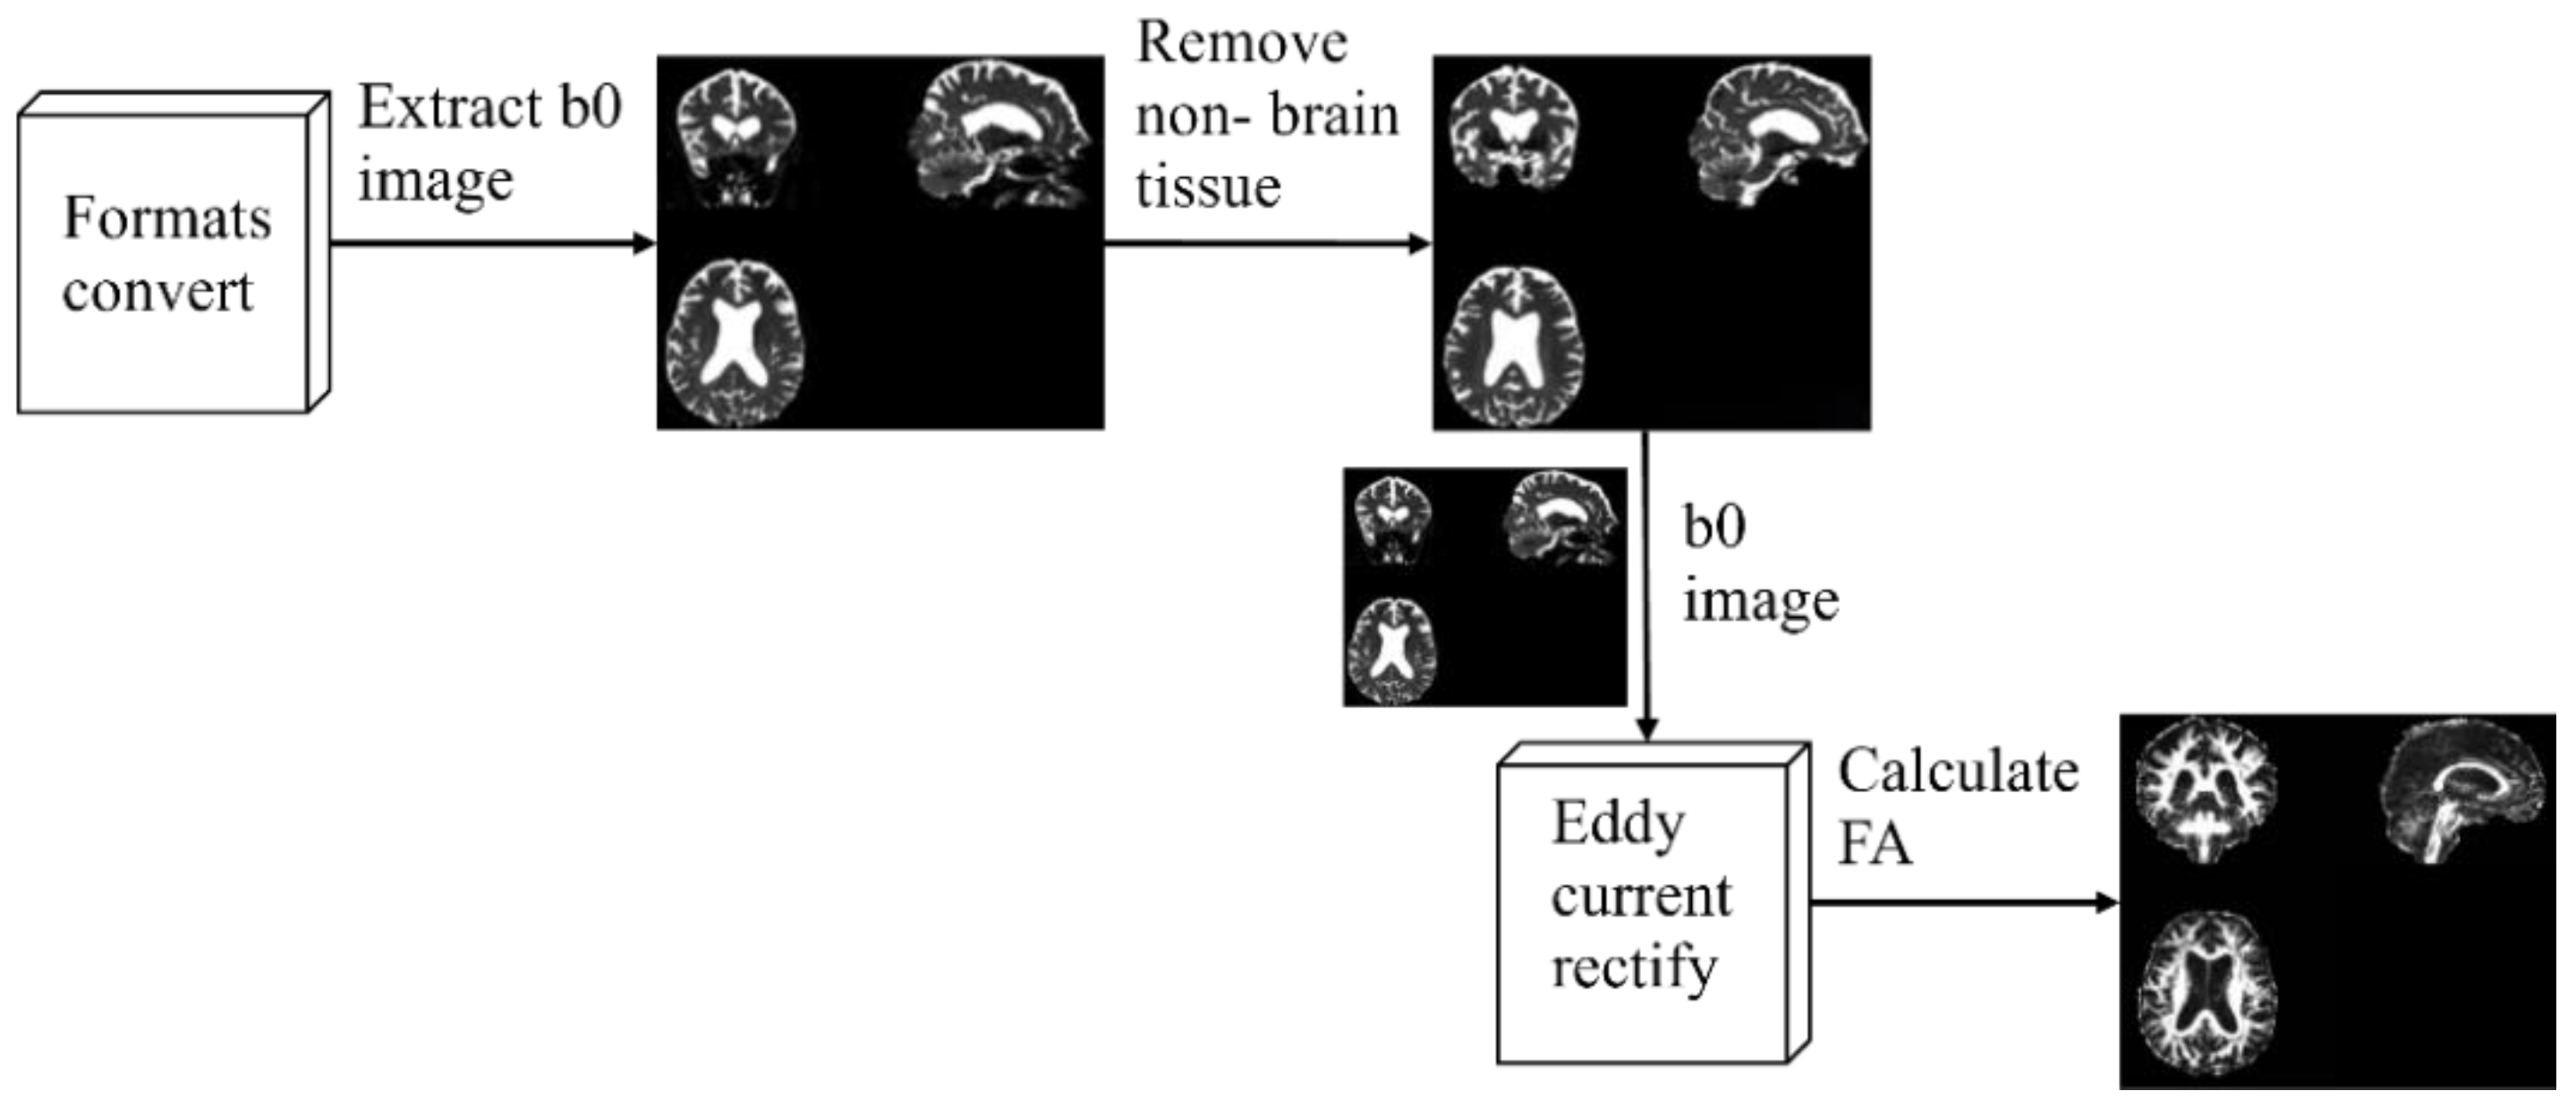
2.3. Image Processing
2.4. White Matter Connectivity Network Construction
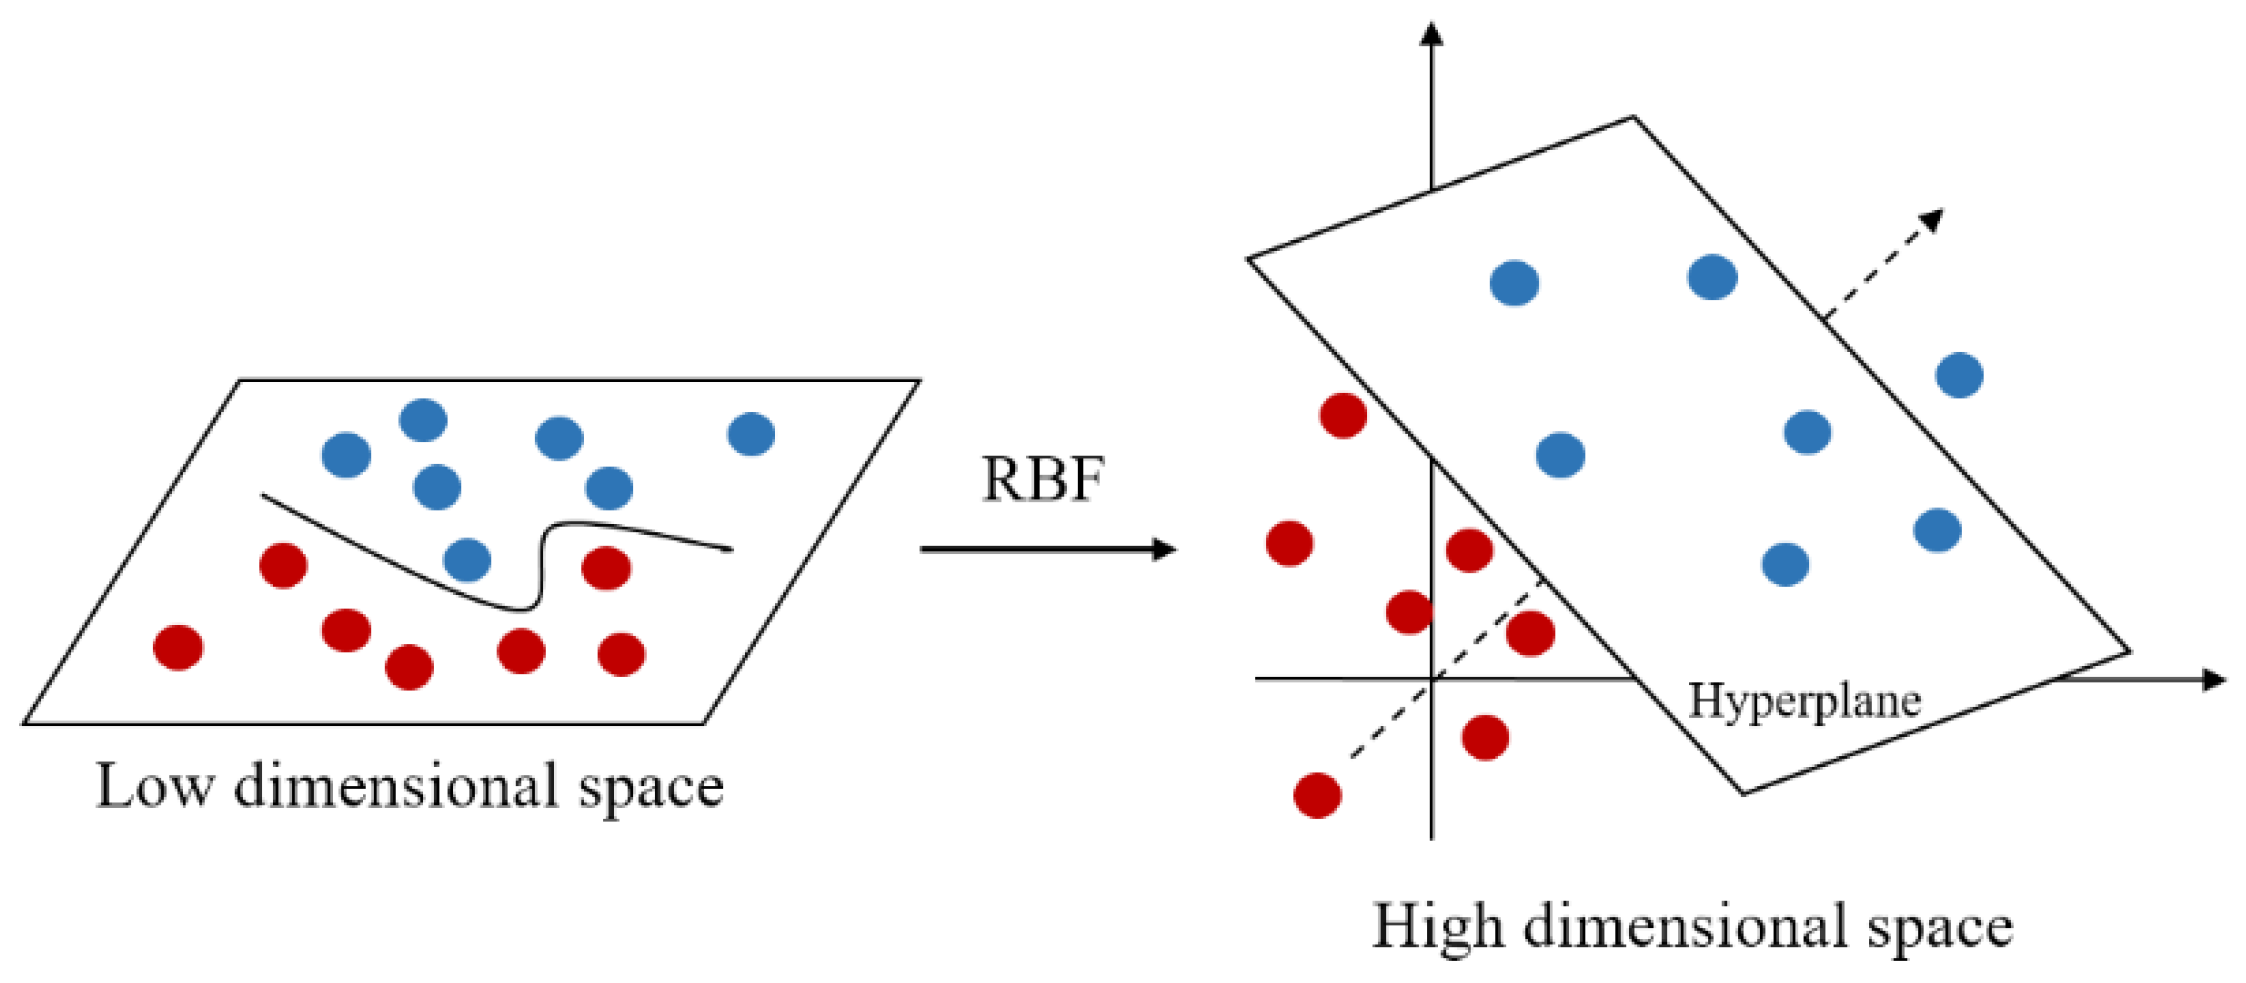
2.5. Gaussian Kernel Support Vector Machine
2.6. Statistical Processing
2.7. Evaluation Indicators
3. Results and Discussion
3.1. Analysis of Demographic Information
3.2. Comparison of FA Values
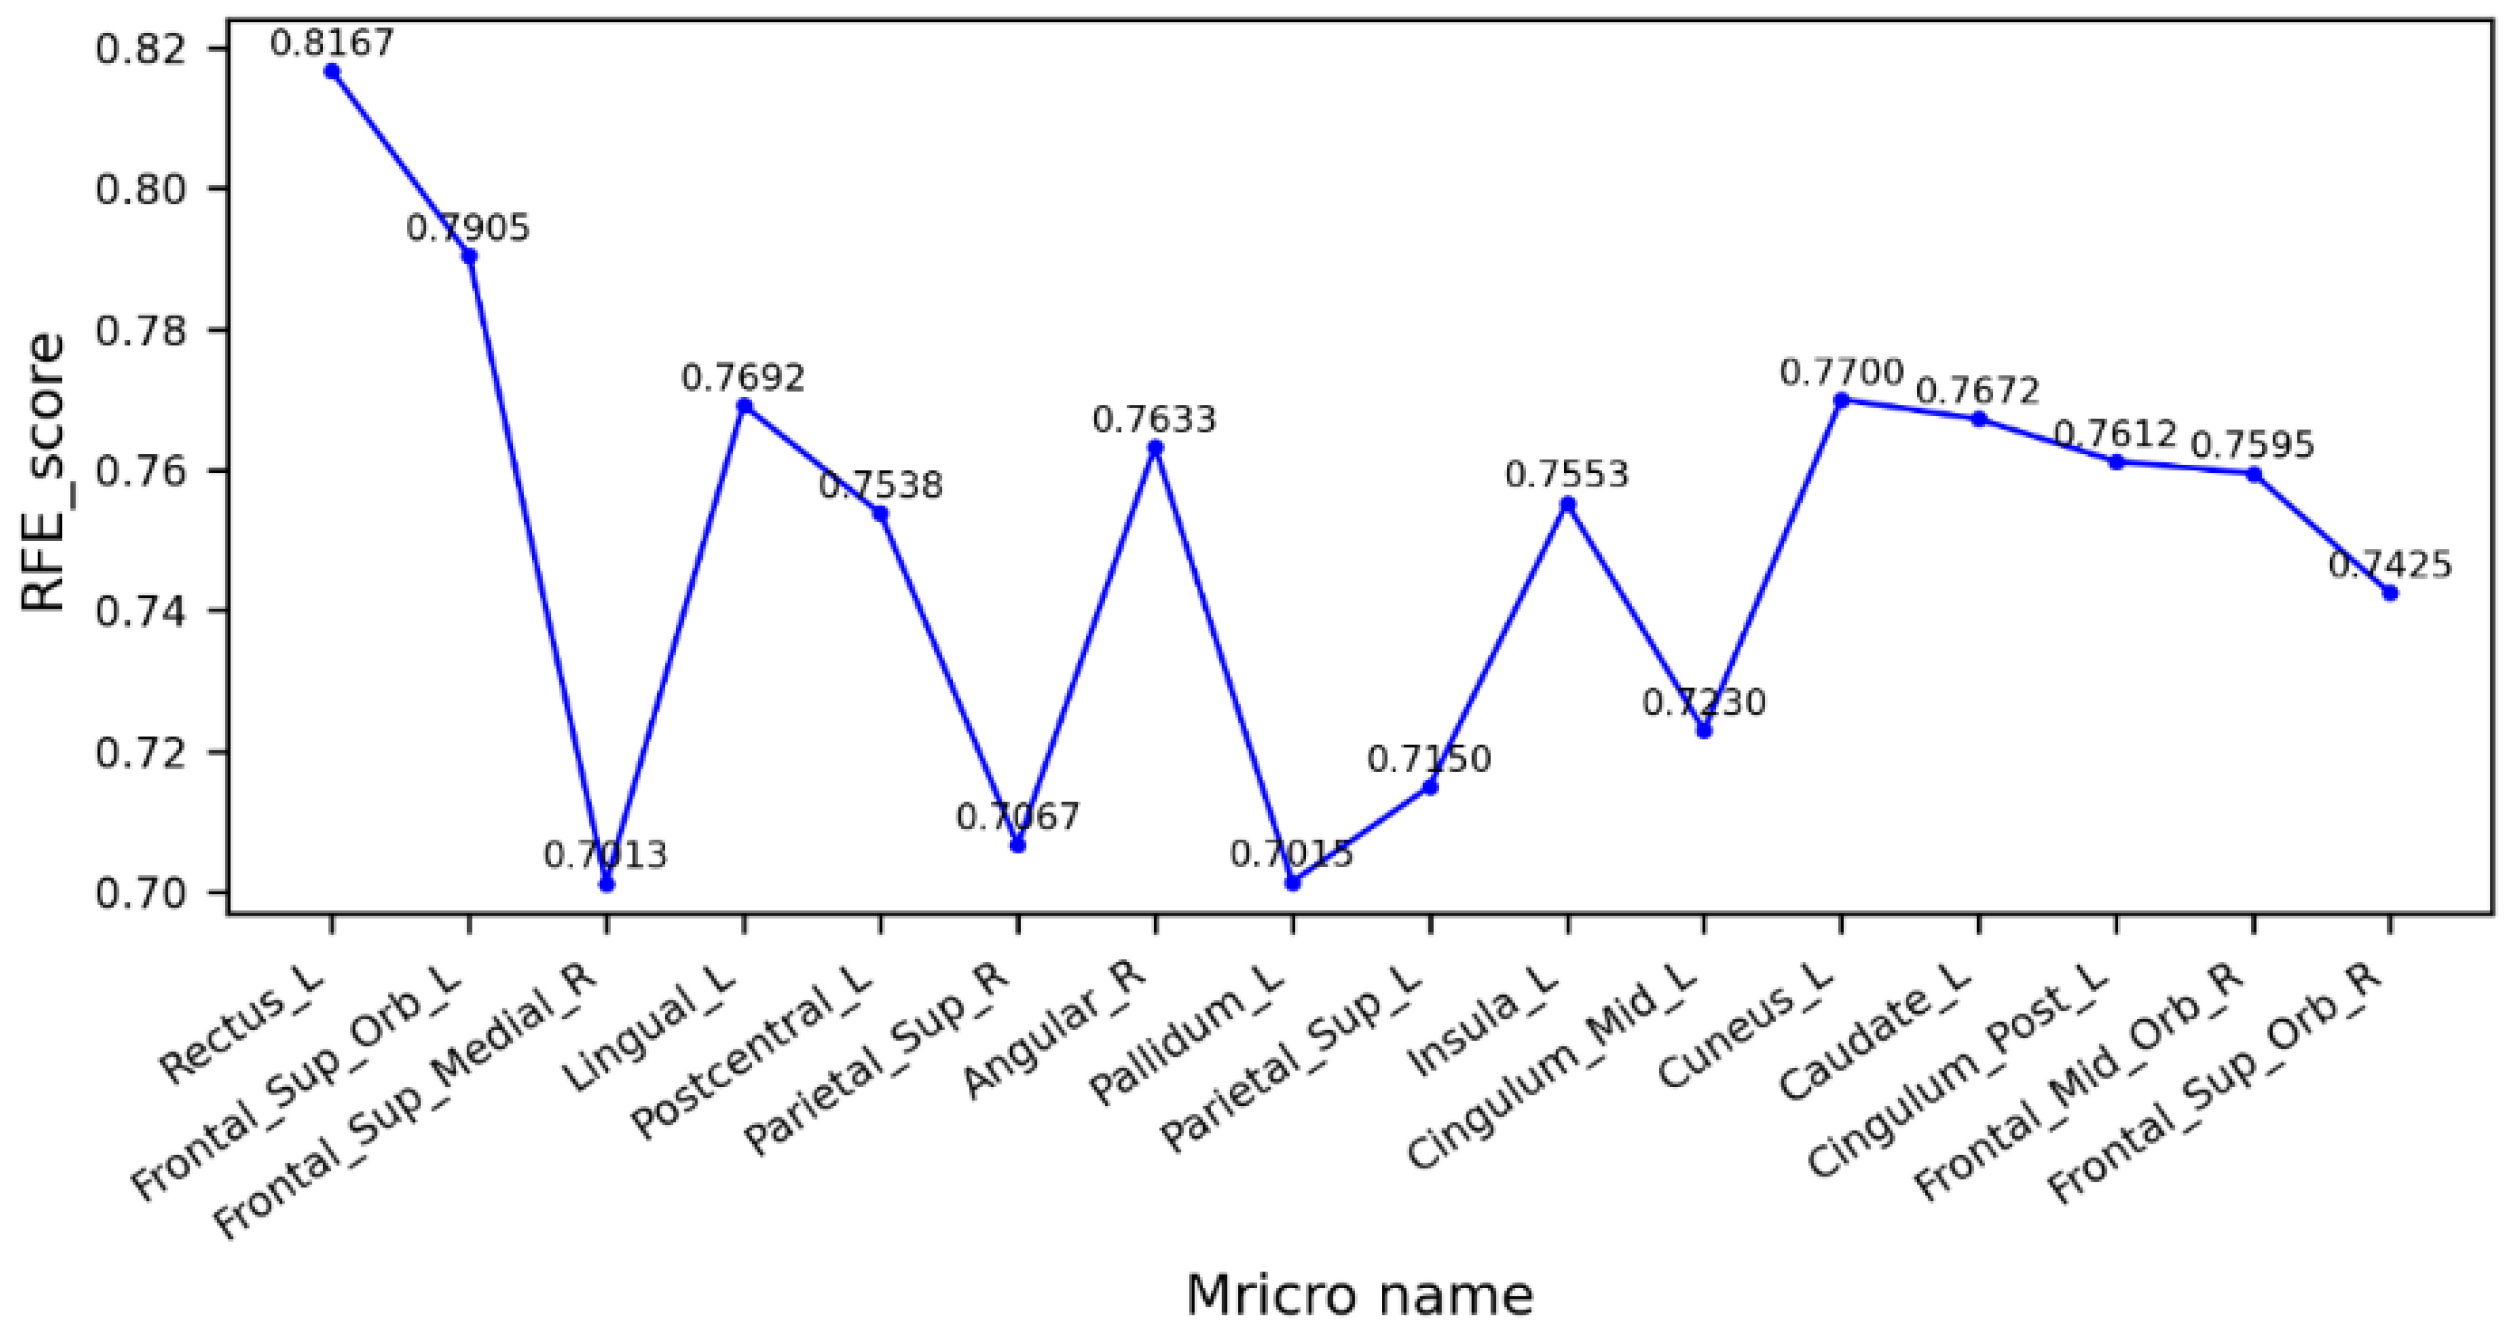
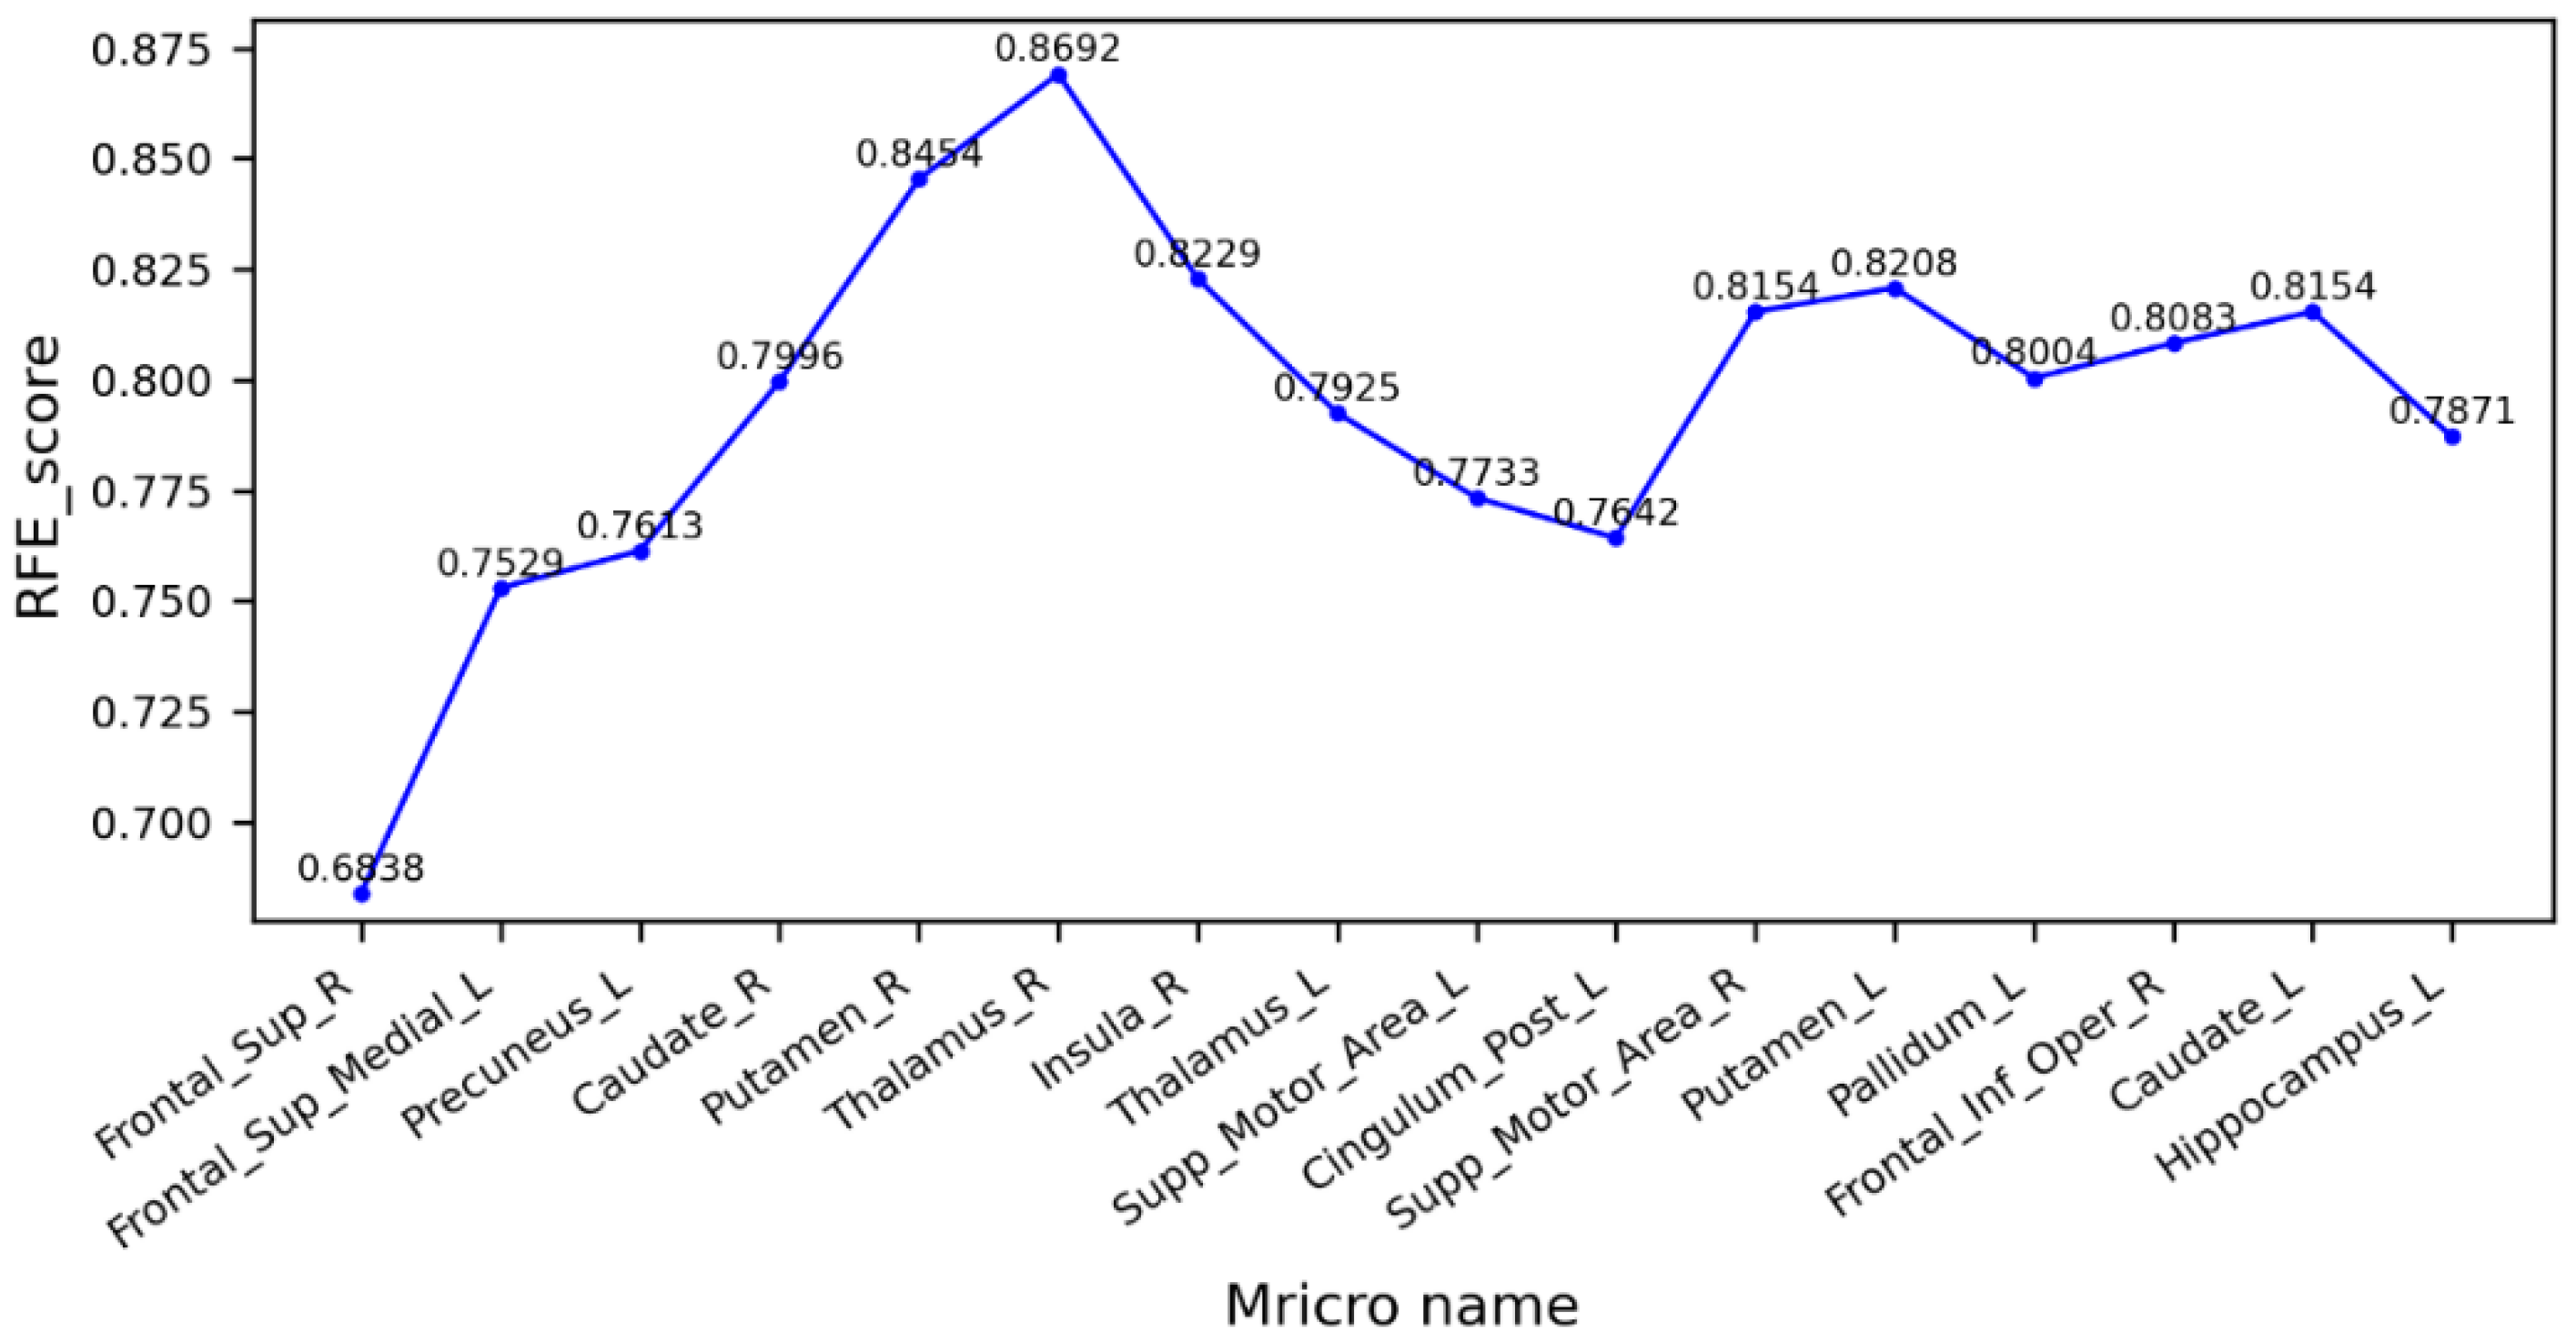
3.3. Feature Extraction
3.4. Results and Discussion
4. Conclusions
Author Contributions
Funding
Institutional Review Board Statement
Informed Consent Statement
Data Availability Statement
Acknowledgments
Conflicts of Interest
References
- Prince, M.; Comas-Herrera, A.; Knapp, M.; Guerchet, M.; Karagiannidou, M. World Alzheimer Report 2016: Improving Healthcare for People Living with Dementia. Coverage, Quality and Costs Now and in the Future; Alzheimer’s Disease International: London, UK, 2016. [Google Scholar] [CrossRef]
- Qin, Y.; Zhang, J.; Wu, Y.; Ge, X.; Han, H.; Cui, J.; Bai, W.; Yu, H. Research progress on reversal of mild cognitive impairment to cognitive normal. Chin. Fam. Med. 2021, 24, 3506–3509. [Google Scholar]
- Odusami, M.; Maskeliūnas, R.; Damaševičius, R. An Intelligent System for Early Recognition of Alzheimer’s Disease Using Neuroimaging. Sensors 2022, 22, 740. [Google Scholar] [CrossRef] [PubMed]
- Zhou, Y.; Si, X.P.; Chen, Y.Y.; Chao, Y.; Lin, C.-P.; Li, S.; Zhang, X.; Ming, D.; Li, Q. Hippocampus- and Thalamus-Related Fiber-Specific White Matter Reductions in Mild Cognitive Impairment. Cereb. Cortex 2022, 32, 3159–3174. [Google Scholar] [CrossRef] [PubMed]
- Caranova, M.; Soares, J.F.; Batista, S.; Castelo-Branco, M.; Duarte, J.V. A systematic review of microstructural abnormalities in multiple sclerosis detected with NODDI and DTI models of diffusion-weighted magnetic resonance imaging. Magn. Reson. Imaging 2023, 104, 61–71. [Google Scholar] [CrossRef] [PubMed]
- Yan, Z.; Wang, X.; Zhu, Q.; Shi, Z.; Chen, X.; Han, Y.; Zheng, Q.; Wei, Y.; Wang, J.; Li, Y. Alterations in White Matter Fiber Tracts Characterized by Automated Fiber-Tract Quantification and Their Correlations with Cognitive Impairment in Neuromyelitis Optica Spectrum Disorder Patients. Front. Neurosci. 2022, 16, 904309. [Google Scholar] [CrossRef]
- Kwon, B.M.; Lee, J.Y.; Ko, N.; Kim, B.-R.; Moon, W.-J.; Choi, D.-H.; Lee, J. Correlation of Hemispatial Neglect with White Matter Tract Integrity: A DTI Study. Brain NeuroRehabil. 2022, 15, e6. [Google Scholar] [CrossRef]
- Sun, X.R.; Wang, X.C.; Zhang, H.; Tan, Y. Research progress of magnetic resonance diffusion imaging in mild cognitive impairment. Magn. Reson. Imaging 2021, 12, 70–72+84. [Google Scholar]
- Dalboni da Rocha, J.L.; Bramati, I.; Coutinho, G.; Moll, F.T.; Sitaram, R. Fractional Anisotropy changes in Parahippocampal Cingulum due to Alzheimer’s Disease. Sci. Rep. 2020, 10, 2660. [Google Scholar] [CrossRef]
- Jung, W.S.; Um, Y.H.; Kang, D.W.; Lee, C.U.; Woo, Y.S.; Bahk, W.-M.; Lim, H.K. Diagnostic Validity of an Automated Probabilistic Tractography in Amnestic Mild Cognitive Impairment. Clin. Psychopharmacol. Neurosci. 2018, 16, 144–152. [Google Scholar] [CrossRef]
- Bergamino, M.; Walsh, R.R.; Stokes, A.M. Free-Water Diffusion Tensor Imaging Improves the Accuracy and Sensitivity of White Matter Analysis in Alzheimer’s Disease. Sci. Rep. 2021, 11, 6990. [Google Scholar] [CrossRef]
- Wurst, Z.; Kuchtová, B.B.; Křemen, J.; Lahutsina, A.; Ibrahim, I.; Tintěra, J.; Bartoš, A.; Brabec, M.; Rai, T.; Zach, P.; et al. Basal Ganglia Compensatory White Matter Changes on DTI in Alzheimer’s Disease. Cells 2023, 12, 1220. [Google Scholar] [CrossRef]
- Cole, K.; Wei, S.-M.; Martinez, P.E.; Gregory, M.D.; Kippenhan, J.S.; Kohn, P.D.; Nieman, L.K.; Yanovski, J.A.; Schmidt, P.J.; Berman, K.F. Changes in Brain Structure Associated with Adrenarche in Typically Developing Prepubertal Children. Psychoneuroendocrinology 2023, 153, 1589. [Google Scholar] [CrossRef]
- Bergamino, M.; Schiavi, S.; Daducci, A.; Walsh, R.R.; Stokes, A.M. Analysis of Brain Structural Connectivity Networks and White Matter Integrity in Patients With Mild Cognitive Impairment. Front. Aging Neurosci. 2022, 14, 793991. [Google Scholar] [CrossRef] [PubMed]
- Rizzolo, L.; Narbutas, J.; Van Egroo, M.; Chylinski, D.; Besson, G.; Baillet, M.; Bahri, M.A.; Salmon, E.; Maquet, P.; Vandewalle, G.; et al. Relationship between brain AD biomarkers and episodic memory performance in healthy aging. Brain Cogn. 2021, 148, 105680. [Google Scholar] [CrossRef] [PubMed]
- Borna, B.; Clara, T. Brain Networks, Clinical Manifestations, and Neuroimaging of Cognitive Disorders: The Role of Computed Tomography (CT), Magnetic Resonance Imaging (MRI), Positron Emission Tomography (PET), and Other Advanced Neuroimaging Tests. Clin. Geriatr. Med. 2023, 39, 45–65. [Google Scholar] [CrossRef]
- Li, K.; Zeng, Q.; Luo, X.; Qi, S.; Xu, X.; Fu, Z.; Hong, L.; Liu, X.; Li, Z.; Fu, Y.; et al. Neuropsychiatric symptoms associated multimodal brain networks in Alzheimer’s disease. Hum. Brain Mapp. 2023, 44, 119–130. [Google Scholar] [CrossRef]
- Lu, M.; Guo, Z.; Gao, Z.; Cao, Y.; Fu, J. Multiscale Brain Network Models and Their Applications in Neuropsychiatric Diseases. Electronics 2022, 11, 3468. [Google Scholar] [CrossRef]
- Xu, X.; Xu, S.; Han, L.; Yao, X. Coupling analysis between functional and structural brain networks in Alzheimer’s disease. Math. Biosci. Eng. MBE 2022, 19, 8963–8974. [Google Scholar] [CrossRef]
- Billeci, L.; Badolato, A.; Bachi, L.; Tonacci, A. Machine Learning for the Classification of Alzheimer’s Disease and Its Prodromal Stage Using Brain Diffusion Tensor Imaging Data: A Systematic Review. Processes 2020, 8, 1071. [Google Scholar] [CrossRef]
- Platt, J. Sequential Minimal Optimization: A Fast Algorithm for Training Support Vector Machines; Microsoft Research: Washington, DC, USA, 1998. [Google Scholar]
- Li, Q.; Tao, L.; Xiao, P.; Gui, H.; Xu, B.; Zhang, X.; Zhang, X.; Chen, H.; Wang, H.; He, W.; et al. Combined brain network topological metrics with machine learning algorithms to identify essential tremor. Front. Neurosci. 2022, 16, 1035153. [Google Scholar] [CrossRef]
- Lee, M.; Hong, Y.; An, S.; Park, U.; Shin, J.; Lee, J.; Oh, M.S.; Lee, B.-C.; Yu, K.-H.; Lim, J.-S.; et al. Machine learning-based prediction of post-stroke cognitive status using electroencephalography-derived brain network attributes. Front. Aging Neurosci. 2023, 15, 1238274. [Google Scholar] [CrossRef] [PubMed]
- Krämer, C.; Stumme, J.; da Costa Campos, L.; Rubbert, C.; Caspers, J.; Caspers, S.; Jockwitz, C. Classification and prediction of cognitive performance differences in older age based on brain network patterns using a machine learning approach. Netw. Neurosci. 2023, 7, 122–147. [Google Scholar] [CrossRef]
- Gao, Z.; Feng, Y.; Ma, C.; Ma, K.; Cai, Q. Disrupted Time-Dependent and Functional Connectivity Brain Network in Alzheimer’s Disease: A Resting-State fMRI Study Based on Visibility Graph. Curr. Alzheimer Res. 2020, 17, 69–79. [Google Scholar] [CrossRef]
- Lacasa, L.; Luque, B.; Ballesteros, F.; Luque, J.; Nuño, J.C. From time series to complex networks: The visibility graph. Proc. Natl. Acad. Sci. USA 2008, 105, 4972–4975. [Google Scholar] [CrossRef] [PubMed]
- Dai, K.; Lu, J.M.; Li, W.P.; Zhang, X.; Qing, Z.; Zhang, B. Classification prediction study of mild cognitive impairment based on diffusion tensor imaging automated fiber quantitative analysis. J. Clin. Radiol. 2022, 41, 23–29. [Google Scholar]
- Dou, X.; Yao, H.; Feng, F.; Wang, P.; Zhou, B.; Jin, D.; Yang, Z.; Li, J.; Zhao, C.; Wang, L.; et al. Characterizing white matter connectivity in Alzheimer’s disease and mild cognitive impairment: An automated fiber quantification analysis with two independent datasets. Cortex 2020, 129, 390–405. [Google Scholar] [CrossRef]
- Zhao, J.; Ding, X.; Du, Y.; Wang, X.; Men, G. Functional connectivity between white matter and gray matter based on fMRI for Alzheimer’s disease classification. Brain Behav. 2019, 9, e01407. [Google Scholar] [CrossRef]
- Li, X.; Yang, C.; Xie, P.; Han, Y.; Su, R.; Li, Z.; Liu, Y. The diagnosis of amnestic mild cognitive impairment by combining the characteristics of brain functional network and support vector machine classifier. J. Neurosci. Methods 2021, 363, 109334. [Google Scholar] [CrossRef] [PubMed]
- Guyon, I.; Weston, J.; Barnhill, S.; Vapnik, V. Gene Selection for Cancer Classification using Support Vector Machines. Mach. Learn. 2002, 46, 389–422. [Google Scholar] [CrossRef]
- Smith, S.; Bannister, P.R.; Beckmann, C.; Brady, M.; Clare, S.; Flitney, D.; Hansen, P.; Jenkinson, M.; Leibovici, D.; Ripley, B.; et al. FSL: New tools for functional and structural brain image analysis. NeuroImage 2001, 13, 249. [Google Scholar] [CrossRef]
- Shu, N.; Liu, Y.; Li, K.; Duan, Y.; Wang, J.; Yu, C.; Dong, H.; Ye, J.; He, Y. Diffusion tensor tractography reveals disrupted topological efficiency in white matter structural networks in multiple sclerosis. Cereb. Cortex 2011, 21, 2565–2577. [Google Scholar] [CrossRef]
- Zhang, Y.; Han, J. Differential privacy fuzzy C-means clustering algorithm based on gaussian kernel function. PLoS ONE 2021, 16, e0248737. [Google Scholar] [CrossRef]
- Kahl, M.; Wagner, G.; de la Cruz, F.; Köhler, S.; Schultz, C.C. Resilience and cortical thickness: A MRI study. Eur. Arch. Psychiatry Clin. Neurosci. 2020, 270, 533–539. [Google Scholar] [CrossRef] [PubMed]
- Khazaee, A.; Ebrahimzadeh, A.; Babajani-Feremi, A. Classification of patients with MCI and AD from healthy controls using directed graph measures of resting-state fMRI. Behav. Brain Res. 2017, 322, 339–350. [Google Scholar] [CrossRef]
- Fu, X.; Shrestha, S.; Sun, M.; Wu, Q.; Luo, Y.; Zhang, X.; Yin, J.; Ni, H. Microstructural White Matter Alterations in Mild Cognitive Impairment and Alzheimer’s Disease: Study Based on Neurite Orientation Dispersion and Density Imaging (NODDI). Clin. Neuroradiol. 2020, 30, 569–579. [Google Scholar] [CrossRef]
- Cooray, G.K.; Sundgren, M.; Brismar, T. Mechanism of visual network dysfunction in relapsing-remitting multiple sclerosis and its relation to cognition. Clin. Neurophysiol. 2020, 131, 361–367. [Google Scholar] [CrossRef] [PubMed]
- Liu, W.; Gauthier, S.; Jia, J. Alzheimer’s disease: Current status and perspective. Sci. Bull. 2022, 67, 2494–2497. [Google Scholar] [CrossRef]
- Khvostikov, A.; Aderghal, K.; Benois-Pineau, J.; Krylov, A.; Catheline, G. 3D CNN-based classification using sMRI and MD-DTI images for Alzheimer disease studies. arXiv 2018, arXiv:1801.05968. [Google Scholar] [CrossRef]
- Marzban, E.N.; Eldeib, A.M.; Yassine, I.A.; Kadah, Y.M. Alzheimer’s Disease Neurodegenerative Initiative. Alzheimer’s disease diagnosis from diffusion tensor images using convolutional neural networks. PLoS ONE 2020, 15, e0230409. [Google Scholar] [CrossRef] [PubMed]
- Zhou, Y.; Si, X.; Chao, Y.-P.; Chen, Y.; Lin, C.-P.; Li, S.; Zhang, X.; Sun, Y.; Ming, D.; Li, Q. Automated Classification of Mild Cognitive Impairment by Machine Learning with Hippocampus-Related White Matter Network. Front. Aging Neurosci. 2022, 14, 866230. [Google Scholar] [CrossRef]
- Bigham, B.; Zamanpour, S.A.; Zare, H. Features of the superficial white matter as biomarkers for the detection of Alzheimer’s disease and mild cognitive impairment: A diffusion tensor imaging study. Heliyon 2022, 8, e08725. [Google Scholar] [CrossRef] [PubMed]


| Characteristics and Ratings | AD | MCI | NC | p-Value |
|---|---|---|---|---|
| Age | 67.76 ± 5.91 | 67.96 ± 5.27 | 65.64 ± 4.55 | 0.053 |
| Gender (M/F) | 22/16 | 23/23 | 23/33 | 0.270 |
| Educational attainment | 11.81 ± 3.46 | 12.03 ± 3.76 | 14.05 ± 2.34 | 0.068 |
| MMSE | 23.13 ± 2.98 | 28.87 ± 2.10 | 29.48 ± 1.09 | 0.303 |
| Mricro Name | MCI | NC | p-Value |
|---|---|---|---|
| Parietal_Sup_L | 0.19 ± 0.20 | 0.31 ± 0.17 | 9.42 × 10⁻⁴ |
| Parietal_Sup_R | 0.07 ± 0.18 | 0.24 ± 0.26 | 5.18 × 10⁻⁴ |
| Frontal_Sup_Orb_L | 0.30 ± 0.23 | 0.41 ± 0.16 | 6.01 × 10⁻³ |
| Frontal_Sup_Orb_R | 0.30 ± 0.21 | 0.40 ± 0.14 | 5.91 × 10⁻³ |
| Cingulum_Post_L | 0.07 ± 0.18 | 0.24 ± 0.26 | 5.18 × 10⁻⁴ |
| Cuneus_L | 0.19 ± 0.20 | 0.31 ± 0.17 | 9.42 × 10⁻⁴ |
| Rectus_L | 0.07 ± 0.18 | 0.23 ± 0.23 | 1.59 × 10⁻³ |
| Pallidum_L | 0.12 ± 0.22 | 0.27 ± 0.27 | 3.15 × 10⁻³ |
| Caudate_L | 0.30 ± 0.21 | 0.40 ± 0.14 | 5.91 × 10⁻³ |
| Insula_L | 0.39 ± 0.19 | 0.47 ± 0.10 | 7.33 × 10⁻³ |
| Lingual_L | 0.39 ± 0.19 | 0.47 ± 0.10 | 7.33 × 10⁻³ |
| Cingulum_Mid_L | 0.40 ± 0.17 | 0.46 ± 0.05 | 9.28 × 10⁻³ |
| Postcentral_L | 0.40 ± 0.17 | 0.46 ± 0.05 | 9.28 × 10⁻³ |
| Frontal_Sup_Medial_R | 0.09 ± 0.18 | 0.23 ± 0.23 | 1.59 × 10⁻³ |
| Angular_R | 0.01 ± 0.07 | 0.11 ± 0.22 | 5.49 × 10⁻³ |
| Frontal_Mid_Orb_R | 0.01 ± 0.06 | 0.08 ± 0.17 | 9.65 × 10⁻³ |
| Mricro Name | MCI | AD | p-Value |
|---|---|---|---|
| Putamen_L | 0.48 ± 0.13 | 0.26 ± 0.25 | 3.31 × 10⁻⁶ |
| Putamen_R | 0.47 ± 0.15 | 0.25 ± 0.26 | 1.27 × 10⁻⁵ |
| Thalamus_L | 0.43 ± 0.17 | 0.21 ± 0.24 | 5.55 × 10⁻⁶ |
| Thalamus_R | 0.41 ± 0.19 | 0.20 ± 0.24 | 3.39 × 10⁻⁵ |
| Supp_Motor_Area_L | 0.41 ± 0.07 | 0.27 ± 0.19 | 2.49 × 10⁻⁵ |
| Supp_Motor_Area_R | 0.39 ± 0.15 | 0.19 ± 0.22 | 5.17 × 10⁻⁶ |
| Caudate_L | 0.31 ± 0.23 | 0.11 ± 0.20 | 7.11 × 10⁻⁵ |
| Caudate_R | 0.47 ± 0.13 | 0.28 ± 0.26 | 5.10 × 10⁻⁵ |
| Precuneus_L | 0.36 ± 0.16 | 0.17 ± 0.21 | 1.05 × 10⁻⁵ |
| Frontal_Sup_Medial_L | 0.41 ± 0.07 | 0.27 ± 0.19 | 2.49 × 10⁻⁵ |
| Hippocampus_L | 0.47 ± 0.17 | 0.26 ± 0.27 | 2.93 × 10⁻⁵ |
| Pallidum_L | 0.41 ± 0.22 | 0.19 ± 0.25 | 3.41 × 10⁻⁵ |
| Cingulum_Post_L | 0.30 ± 0.25 | 0.08 ± 0.18 | 4.02 × 10⁻⁵ |
| Insula_R | 0.39 ± 0.15 | 0.19 ± 0.22 | 5.17 × 10⁻⁶ |
| Frontal_Inf_Oper_R | 0.37 ± 0.06 | 0.24 ± 0.19 | 3.33 × 10⁻⁵ |
| Frontal_Sup_R | 0.37 ± 0.06 | 0.24 ± 0.19 | 3.33 × 10⁻⁵ |
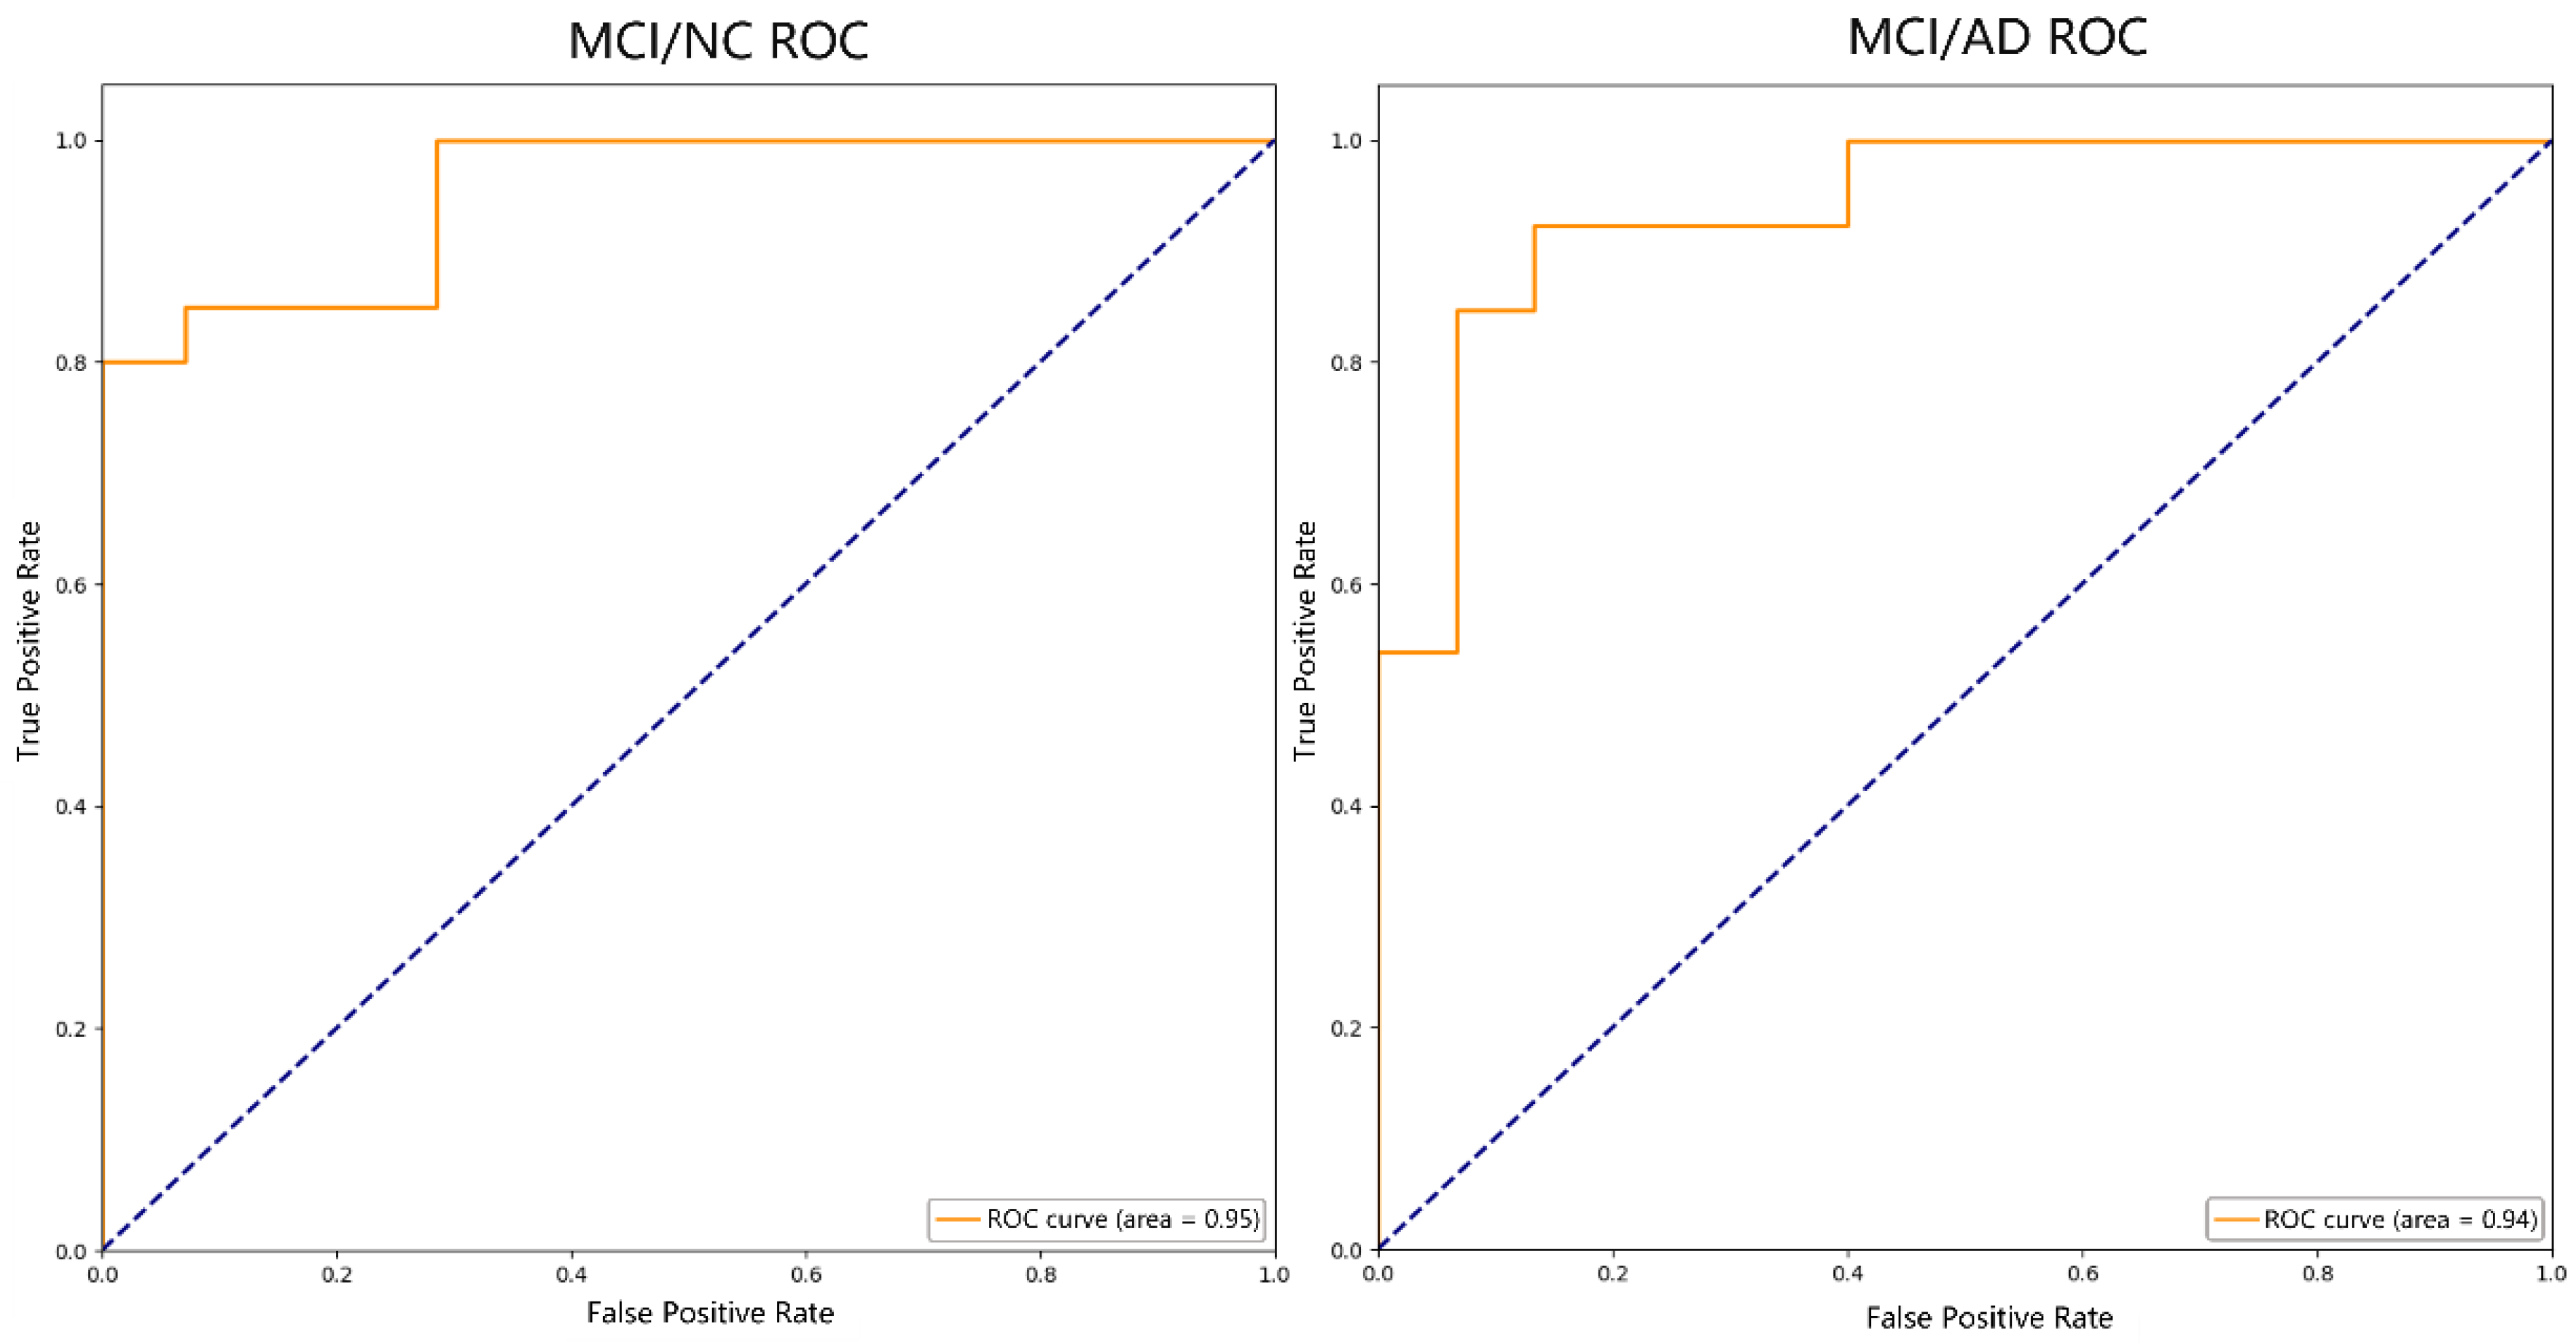
| Indicators | AD vs. MCI | MCI vs. NC |
|---|---|---|
| ACC | 89.29% | 91.18% |
| SEN | 92.86% | 92.31% |
| SPE | 85.71% | 90.48% |
| AUC | 0.94 | 0.95 |
| Studies | Subjects | Classifier | Feature | Performance | |||
|---|---|---|---|---|---|---|---|
| AD | MCI | NC | AD/MCI | MCI/NC | |||
| Khvostikov et al. [40] | 48 | 108 | 58 | CNN | HIP-related MD | ACC: 80% | ACC: 63% |
| Dalboni et al. [9] | 15 | 15 | 15 | Linear SVM | Bilateral parahippocampal gyrus FA | ACC: 90% | ACC: 90% |
| Marzban et al. [41] | / | 106 | 185 | CNN | HIP-related and EC-related MD | / | ACC: 71.1% |
| SPE: 81.8% | |||||||
| AUC: 0.68 | |||||||
| Zhou et al. [42] | / | 42 | 54 | SVM-RFE | HIP-related FA | / | ACC: 79.8% |
| SEN: 84.1% | |||||||
| SPE: 73.8% | |||||||
| AUC: 0.901 | |||||||
| Bigham et al. [43] | 24 | 24 | 24 | Quadratic SVM | Whole brain FA, MD, RD | ACC: 83.3% | ACC: 83.3% |
| SEN: 80.7% | SEN: 94.4% | ||||||
| SPE: 86.3% | SPE: 76.6% | ||||||
| AUC: 0.93 | AUC: 0.88 | ||||||
| Our study | 38 | 46 | 56 | SVM-RFE | Whole brain FA | ACC: 89.29% | ACC: 91.18% |
| SEN: 92.86% | SEN: 92.31% | ||||||
| SPE: 85.71% | SPE: 90.48% | ||||||
| AUC: 0.94 | AUC: 0.95 | ||||||
Disclaimer/Publisher’s Note: The statements, opinions and data contained in all publications are solely those of the individual author(s) and contributor(s) and not of MDPI and/or the editor(s). MDPI and/or the editor(s) disclaim responsibility for any injury to people or property resulting from any ideas, methods, instructions or products referred to in the content. |
© 2023 by the authors. Licensee MDPI, Basel, Switzerland. This article is an open access article distributed under the terms and conditions of the Creative Commons Attribution (CC BY) license (https://creativecommons.org/licenses/by/4.0/).
Share and Cite
Yang, X.; Xia, Y.; Li, Z.; Liu, L.; Fan, Z.; Zhou, J. Classification of Alzheimer’s Disease Based on White Matter Connectivity Network. Appl. Sci. 2023, 13, 12030. https://doi.org/10.3390/app132112030
Yang X, Xia Y, Li Z, Liu L, Fan Z, Zhou J. Classification of Alzheimer’s Disease Based on White Matter Connectivity Network. Applied Sciences. 2023; 13(21):12030. https://doi.org/10.3390/app132112030
Chicago/Turabian StyleYang, Xiaoli, Yuxin Xia, Zhenwei Li, Lipei Liu, Zhipeng Fan, and Jiayi Zhou. 2023. "Classification of Alzheimer’s Disease Based on White Matter Connectivity Network" Applied Sciences 13, no. 21: 12030. https://doi.org/10.3390/app132112030