Article

Near-Infrared Spectroscopy Coupled with a Neighborhood Rough Set Algorithm for Identifying the Storage Status of Paddy

1
Academy of National Food and Strategic Reserves Administration, Beijing 100037, China
2
National Engineering Research Center of Grain Storage and Logistics, Beijing 100037, China
*
Author to whom correspondence should be addressed.
Appl. Sci. 2023, 13(20), 11357; https://doi.org/10.3390/app132011357
Submission received: 15 September 2023 / Revised: 11 October 2023 / Accepted: 13 October 2023 / Published: 16 October 2023
(This article belongs to the Special Issue Spectral Detection: Technologies and Applications)

Abstract

:
Rapid and non-destructive identification of the suitable storage status of paddy during storage is crucial for controlling the quality of stored grains, which can provide high-quality raw grains for rice processing. Near-infrared (NIR) spectroscopy combined with neighborhood rough set (NRS) and multiple classification methods were used to identify the different storage statuses of paddy. The NIR data were collected in the range of 1000–1800 nm, and three storage statuses from suitable storage to severely unsuitable storage were divided using the measured fatty acid value of paddy. The spectral features were selected using NRS, successive projection algorithm and variable combination population analysis methods. Random forest (RF), extreme learning machine, and soft independent modeling of class analogy classifiers coupled with spectral features were used to establish classification models to distinguish the different storage statuses of paddy. The comparison results indicated that the optimal wavelengths selected by NRS combined with the RF classifier to construct the NRS-RF series models led to satisfactory identification results, with high correct classification rates of 96.31% and 93.68% in the calibration and test sets, respectively; the indicators of sensitivity and specificity ranged from 0.93 to 0.99. Therefore, the combination of NIR technology with NRS and RF algorithms for identifying the storage status of paddy was feasible, as this would be more helpful for rapidly evaluating the changes of stored paddy quality. The proposed method from this study is expected to provide support for the development of non-destructive equipment for the accurate detection of the quality of stored paddy.

1. Introduction

Paddy is one of the three major reserves of raw grains worldwide, and its quality and safety during storage have attracted much attention from the public [1,2]. Due to the imbalance of temperature and humidity during the storage process, paddy is prone to phenomena such as increased water content, erosion by grain insects, and fungal infection, which leads to deterioration in its quality status [3]. This directly leads to serious losses in the quantity and quality of stored paddy when it is discharged from the warehouse [4,5]. Therefore, there is a technical challenge that urgently needs to be overcome in the field of grain storage, which is to explore and clarify the quality change trend and suitable storage status of paddy during the storage process, and then establish appropriate rapid detection methods to effectively identify the safety status of paddy [6].
The fatty acid value is one of the important indicators used to measure the effectiveness of maintaining the quality of paddy storage [7]. The changes in fatty acid values correlate with other quality indicators such as freshness, food value, and germination rate [8]. Furthermore, it can also determine the current storage status of paddy samples through the range of measured values. The national standard of China (GB/T 20569-2006) requires that the fatty acid value (KOH/dry basis)/(mg/100 g) of japonica rice can be used to classify the storage status of rice: suitable for storage (≤25 mg/100 g), mildly unsuitable for storage (≤35 mg/100 g), and severely unsuitable for storage (>35 mg/100 g). The conventional detection methods for fatty acid content in paddy are usually based on physical and chemical tests [9]. Although these methods meet the accuracy standards, there are some problems such as long detection cycles, difficulty in quantification, destructive testing, and high instrument costs that need to be further addressed [10]. They are not suitable for the rapid, non-destructive, batch, and on-site testing needs of modern grain storage technology aimed at the quality and safety of stored grains [11].
At present, near-infrared (NIR) spectroscopy technology, based on the analysis of changes in internal components of the samples, has been widely applied in the quality detection of agricultural products [12,13] such as fruits, vegetables, meat, and grain due to its advantages of being fast and non-destructive, its simple operation, and not needing pre-treatment [14]. At the same time, the related standard for NIR analysis models of rice moisture, crude protein, and other indicators has been issued [15], and it also has good application prospects in grain and oil quality and safety testing [16]. Some scholars have conducted research on NIR detection methods for fatty acid values in rice using principal component analysis, partial least squares regression, support vector machines, and other main reference algorithms, and have achieved certain results [17]. Other scholars have established a relationship model by combining the moldy state and the fatty acid value of rice [18]. In addition, there are also scholars who have used the combination methods of weighted multiplicative scatter correction with variable selection and partial least square to dynamically monitor fatty acid values in rice storage based on a portable near-infrared spectroscopy (NIRS) system [19]. It can be concluded that the combination of NIR technology and data analysis methods is feasible for detecting the quality of rice. However, the accuracy of the detection model and the expression effect of feature wavelengths still need to be improved.
The collected raw spectral data contain a large amount of collinearity and redundancy information, which seriously affects the efficiency of data analysis [20]. Therefore, feature spectrum optimization is one of the important links in spectral data analysis and modeling. In other words, screening out a small number of wavelengths using appropriate algorithms can improve modeling efficiency and prediction accuracy. The typical wavelength selection algorithms such as competitive adaptive reweighted sampling (CARS), successive projections algorithms (SPA), random frog, and variable combination population analysis (VCPA) have been applied in spectral data analysis [21,22]. Neighborhood rough set (NRS) is a feature selection method with strong applicability. Its biggest advantage is to use the equivalence relationship between the upper and lower approximation sets to obtain the core knowledge of the data without losing any effective information [23], thereby reducing information and completing data dimensionality reduction [24]. Liu [25] utilized hyperspectral technology and the NRS algorithm to select feature bands and build a classification model for soybean varieties. Zhu [26] successfully combined NRS with hyperspectral images for detecting the degree of apple powdering. However, the complexity of most models can be further simplified, and accuracy and stability still need to be improved.
In addition, the research on spectral feature wavelength selection based on NRS algorithms is relatively limited, and a complete set of extraction methods has not been formed. The application modes facing different samples are still in the exploratory stage. In this study, the NRS algorithm is introduced into the field of the spectral non-destructive detection of paddy quality and safety, and further applies it to effectively extract spectral features of different types of paddy. In particular, using the storage state of paddy as a classification standard and establishing a qualitative model for identifying it is rarely reported in the literature.
Based on the description above, this study takes japonica paddy as the research object, and uses NIR technology combined with feature selection methods such as neighborhood rough sets to establish classification models and discriminate the suitable storage status of paddy, achieving rapid non-destructive testing of the safety and quality of the stored paddy. The specific aims were (1) to collect the NIR data (1000–1800 nm) of paddy samples during storage; (2) to detect the fatty acid of paddy and identify three grades (storage status) by these values; (3) to extract the spectral features using NRS, SPA, and VCPA algorithms and compare their differences; (4) to construct classification models using random forest (RF), extreme learning machine (ELM), and soft independent modeling of class analogy (SIMCA) classifiers with spectral features to distinguish the different storage statuses of paddy; and (5) to compare performances of different models.

2. Materials and Methods

2.1. Sample Preparation

The high-quality japonica paddy was selected for the samples, and they were obtained from some grain depots in northern China. The moisture content of all the samples ranged from 14.0% to 14.5%, which met the safe moisture standards for paddy storage. More than 300 samples were packed in airtight bags and first stored in an artificial climate chamber with a low temperature (≤4 °C) for later parameter determination. The effective number of samples was 285 after sorting, and each sample was divided into two parts, one for near-infrared spectroscopy data collection and the other for fatty acid value determination. The fatty acid of the rice was measured by the methods of the developed national standard of China (milled cereal productions–determination of fat acidity). In the experiment, three parallel measurements were taken for each sample and the average value was taken as the final result. Furthermore, the fatty acid values could be used as criteria for determining the storage status of rice according to the relevant standard of guidelines for evaluation of paddy storage character (GB/T 20569-2006). In other words, the paddy samples could be classified into three storage statuses based on the fatty acid value (KOH mg/100 g by dry basis): grade1 of suitable storage (value ≤ 25.0), grade2 of mildly unsuitable storage (25.0 < value ≤ 35.0), and grade3 of severely unsuitable storage (value > 35.0). After the data analysis, two-thirds of the samples (n = 190) were selected randomly as the training set and the remaining one-third (n = 95) was used as the testing set, which ensured independence between the two sets.

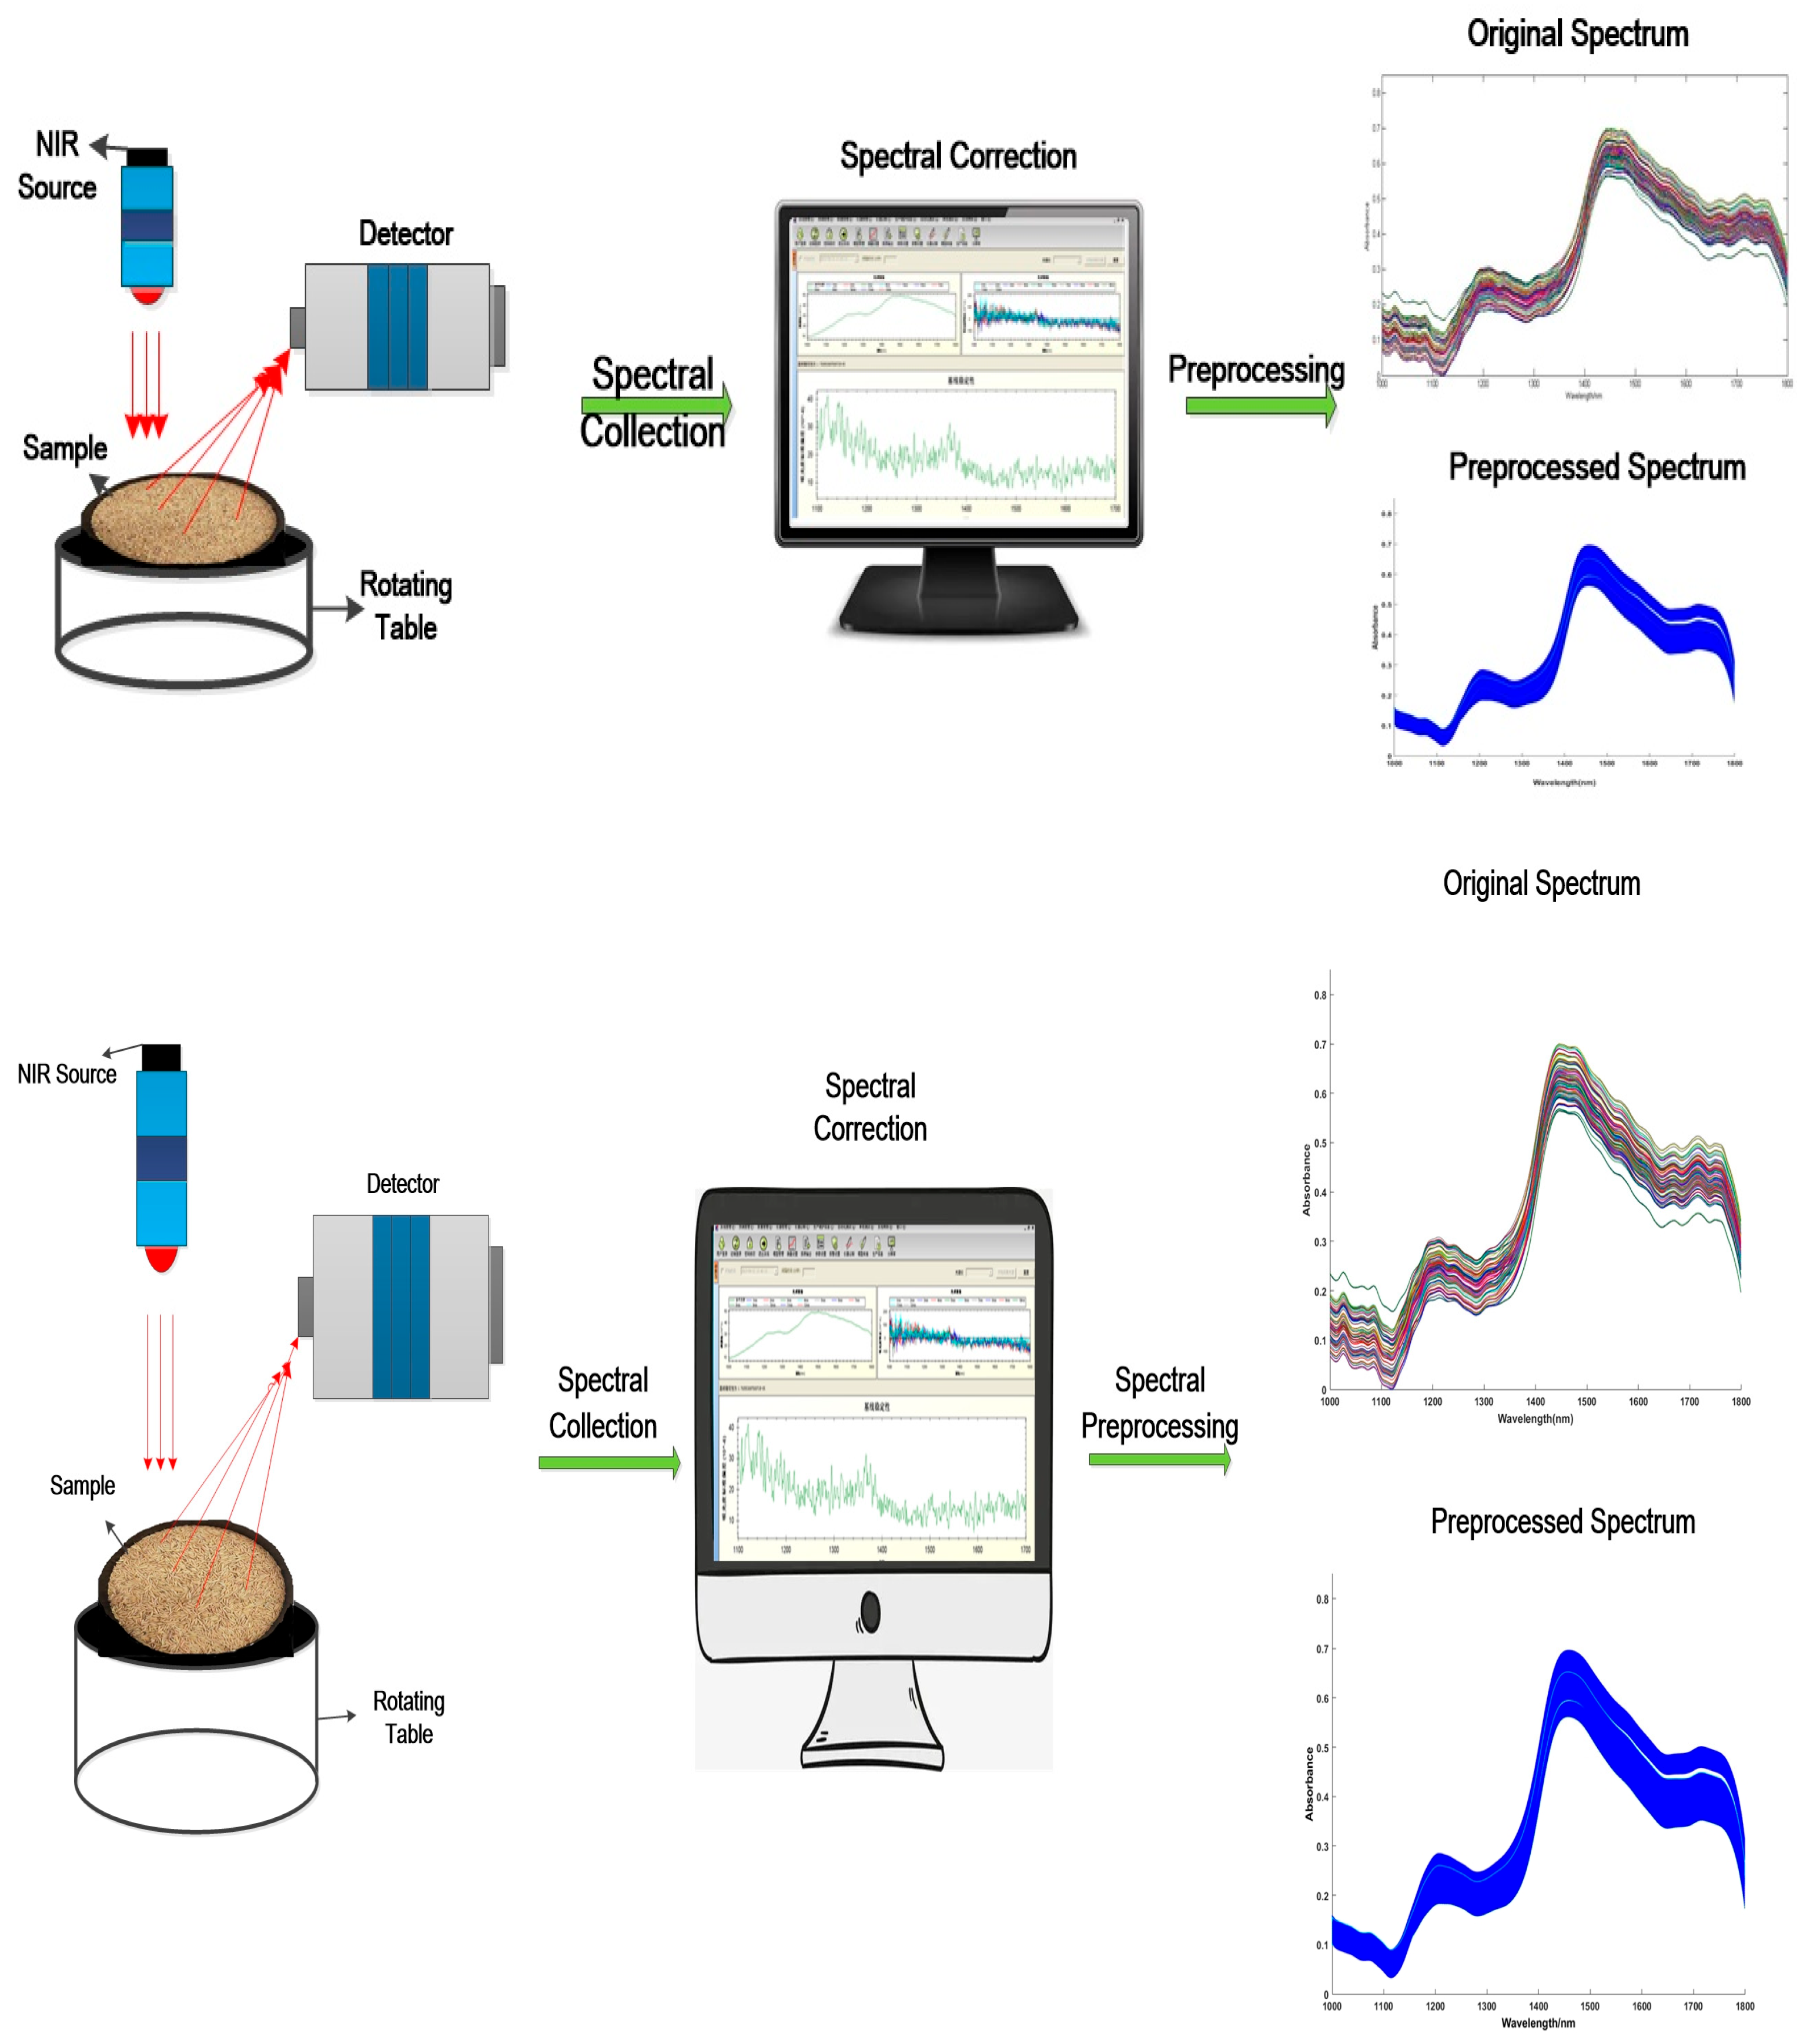
2.2. Near-Infrared Spectrometer

A SupNIR-3000 NIR analyzer produced by Focus Technology (Hangzhou, China) Co., Ltd. was used to collect the spectrum data of the paddy sample. The NIR instrument adopted an optical design that combined holographic digital gratings and a high sensitivity indium gallium arsenic detector (with TEC cooling and constant temperature). Based on the principle of diffuse reflection, the sample data were collected and analyzed using a downward illumination method, which could reduce heating of the sample by the light source. Additionally, the collected spectral range was 1000–1800 nm, with a wavelength accuracy of ± 0.2 nm, wavelength repeatability <0.05 nm, resolution of 10.9 ± 0.3 nm, and absorbance noise <5E-5AU. Each sample was collected three times, scanned 32 times, and the average value was taken to obtain the spectral data of the final sample. The schematic diagram of the spectral collection in this study is shown in Figure 1.

2.3. Spectral Feature Selection Algorithms

2.3.1. Neighborhood Rough Set

The classical rough set (RS) theory was proposed by Polish mathematician Pawlak [27]. RS theory understands knowledge as the division of data and classification as the equivalence relation in a specific space, which can describe or reduce uncertain or imprecise knowledge by using feature attributes. In particular, there is no need to provide any other prior information during the process of data analysis. However, when RS theory is used for continuous data processing, it needs to be discretized, which causes the loss of original data feature attributes. Therefore, the concept of neighborhood is introduced into RS theory to form a neighborhood rough set (NRS) model to solve the process of discretization of numeric characteristic variables in the data set [28]. The specific description is as follows:
Assuming the collected near-infrared spectral dataset of rice is S = Xij (i = 1,2,n; j = 1,2,…,m), n is the number of samples and m is the number of spectral bands. Based on NRS theory, the non-empty real number sample is set as U = { x 1 , x 2 , , x n } , C is the conditional attribute (spectral information feature), and D is the decision attribute (three states of rice storage). Assuming M is the neighborhood relationship for describing C or a decision attribute table, then N D T = ( U , M , D ) is the neighborhood decision system. Among them, the neighborhood of x i ( x i U ) can be defined as δ x i = { x i | x i U , Δ ( x i , x j ) δ , δ 0 }, where the Δ ( x i , x j ) represents the distance measurement function, which usually can be expressed using the P-norm of Δ p x 1 , x 2 = i = 1 N | f x 1 , a i f x 2 , a i | P 1 p . In addition, for N D T = < U , M , D > , a neighborhood decision system, the set U is divided into N equivalence classes ( X 1 , X 2 , , X N ) via the decision attribute D and Q M , the lower approximation N Q D _ and upper approximation ( N Q D ¯ ) of D about the Q field are, respectively, expressed as:
N Q D _ = i = 1 N N Q X i _
N Q D ¯ = i = 1 N N Q X i ¯
where  N Q X i _ = { x i | δ Q ( x i ) X , x i U } , N Q X i ¯ = { x i | δ Q x i X Φ , x i U } .
Variable precision is one of the important parameters in neighborhood rough set models, which is usually represented by variable factor β. With the introduction of variable factors, the model can be allowed to have a certain degree of classification error rate. That is to say, as many classification samples as possible are classified into the same category under a given relatively small error rate. The data analysis ability of the rough set model is improved by allowing for certain classification errors in upper and lower approximations to analyze classification problems with uncertain relationships in probability. The value range of β is 0.5 < β ≤ 1, when β = 1, equivalent to the classical rough set [29]. Two parameters of β and neighborhood range δ directly affect the performance of the neighborhood rough set model and the analysis results of the data. Therefore, β and δ parameter matching and selection are important steps in model establishment [30]. In this study, the performance of the model is compared and analyzed under different parameter changes.
The main steps for selecting spectral feature bands based on the NRS model are as follows:
(1) The collected spectral data should be preprocessed, and a decision information table is further constructed as follows:
M = s 11       s 21               s n 1       s 12         s 22                     s n 2                                                           s 1 m           s 2 m                 s n m         d 1 d 2 d n
where the matrix S represents the spectral information of the sample and can be considered as a conditional attribute, and s n m refers to the spectral value of the nth sample at wavelength m. Matrix d represents the category of the sample and can be considered as a decision attribute.
(2) The different β and δ are set for modeling, and the NRS model is trained starting from an empty set using heuristic search algorithms until the model’s discriminative ability no longer increases after adding any conditions. Furthermore, the feature variables with strong representativeness are gradually selected and placed in the subsets. Finally, a series of feature subsets are generated for subsequent analysis.
(3) Different algorithms are used as classifiers for comparison. A series of feature subsets are selected as input vectors of classifiers for training and recognition. The final reduction result is to select a subset that maximizes recognition accuracy and contains the least number of bands.

2.3.2. Successive Projections Algorithm

The successive projection algorithm (SPA) is a typical spectral feature extraction method [31]. SPA is a forward variable selection algorithm that minimizes collinearity in linear space. Assuming the number of samples in the dataset is n and the number of spectral wavelengths is m, the spectral matrix X is n × m. SPA starts by selecting any wavelength as the starting point and iteratively searches for the parts of the projection that have not been incorporated into the wavelength combination. Each cycle continuously introduces the maximum projection direction until W times (w < n−1), thus forming a wavelength subset that minimizes the linear relationship between any adjacent wavelengths in the subset. In this study, the probability of wavelength selection was calculated and the first few wavelengths with higher probability were selected as the final candidate variables.

2.3.3. Variable Combination Population Analysis

Variable combination population analysis (VCPA) is a feature wavelength selection algorithm and its main idea derives from model cluster analysis [32]. VCPA has been applied in spectral data analysis. Firstly, the binary matrix sampling method (BMS) is used to resample the sample space, and further combined with the exponential decay function (EDF) to eliminate variables unrelated to sample characteristics. The VCPA is usually combined with the partial least squares regression (PLSR) algorithm, which uses BMS to sample several sets of variable subsets from the sample variable space and calculates the probability of each wavelength point variable appearing in this iteration. By using the EDF to remove wavelength points with lower frequencies, the variable set space is reduced. The retained variables are repeated with BMS sampling and EDF removal. This process is repeated N times, and the remaining variables with higher frequencies are combined to form the final selected feature wavelength. In this study, the sampling frequency is 1000 and the iteration number is 50; no more than 15 candidate variables are selected during each iteration process, and the first few variables with higher frequencies are ultimately selected as the characteristic wavelength variables.

2.4. Classification Models

2.4.1. Random Forest

Random forest (RF) is a non-parametric and nonlinear classification algorithm first proposed by Tin Kam Ho and later improved by Breiman [33,34]. It utilizes the advantages of ensemble learning methods to quickly process high-dimensional data and effectively prevent overfitting. RF has been successfully applied to many neighborhoods, such as image classification, remote sensing image endpoint recognition, and hyperspectral data analysis. The main idea of RF is based on bootstrap-resampling technology, overcoming the weakness of single decision tree classification. Multiple classification decision trees are generated from the training variable set, forming a random forest to complete the regression classification process. The importance of wavelength is measured using the gradient descent of the Gini coefficient and the variable splitting results of all decision trees are jointly analyzed to reduce the correlation between each classification tree. Measuring the importance of classification variables improves the performance of the combined classifier, and ultimately the classification results are determined by the voting method. In this study, the range of the number of decision trees was set to 1–1000; the specific number of decision trees and the corresponding number of split variables were optimized using a 10-fold interactive validation method.

2.4.2. Extreme Learning Machine

The extreme learning machine (ELM) is a kind of machine learning system or method based on a feed-forward neural network, which can overcome the problems of slow training speed or over-fitting [35]. According to empirical risk minimization theory, the initialized input weight and offset of the network model can be set randomly and the corresponding output weight can be obtained through a one-step calculation. The ELM network model is also divided into three layers for training and learning, namely the input layer, hidden layer, and output layer. ELM is considered to have potential advantages in terms of learning speed and generalization ability over most methods. Some improved versions of ELM have obtained a deep structure, by introducing an auto-encoder to construct or stack hidden layers, and can carry out feature learning [22], which makes ELM more suitable than others for processing multi-class samples.

2.4.3. Soft Independent Modeling of Class Analogy

The soft independent modeling of class analogy (SIMCA) method is a common method for sample quality classification in chemometrics [36]. The main classification pattern of SIMCA is further developed based on principal component analysis of the dataset, and ultimately implemented as a supervised classification method based on pattern recognition. SIMCA first performs principal component analysis on the sample data of all classes in the calibration set, constructs a principal component mathematical model for each predicted class, and further fits and matches the spectral data of the unknown sample to the established principal component model of each class. The final analysis identified the category of the sample.

2.5. Model Evaluation

The performance of the model is mainly evaluated through the correct classification rate (CCR), which is the percentage of correctly classified samples (Nc) to the total number of samples (Nt). The formula is as follows:
C C R = N c N t × 100 %
In addition, sensitivity and specificity are also used to evaluate model performance [37]. Usually, the sensitivity and specificity indicators are close to one, which indicates that the performance of the model is better. The formula is:
S e n s i t i v i t y = T P F N + T P
S p e c i f i c i t y = T N F P + T N    
Among them, TP is the true positive class, which means that true samples are identified as true samples; FN is a false positive class, where true samples are identified as negative samples; TN is a true negative class, which means that negative samples are identified as pseudo samples; and FP is a false negative class, where false samples are identified as true samples.

3. Results and Discussion

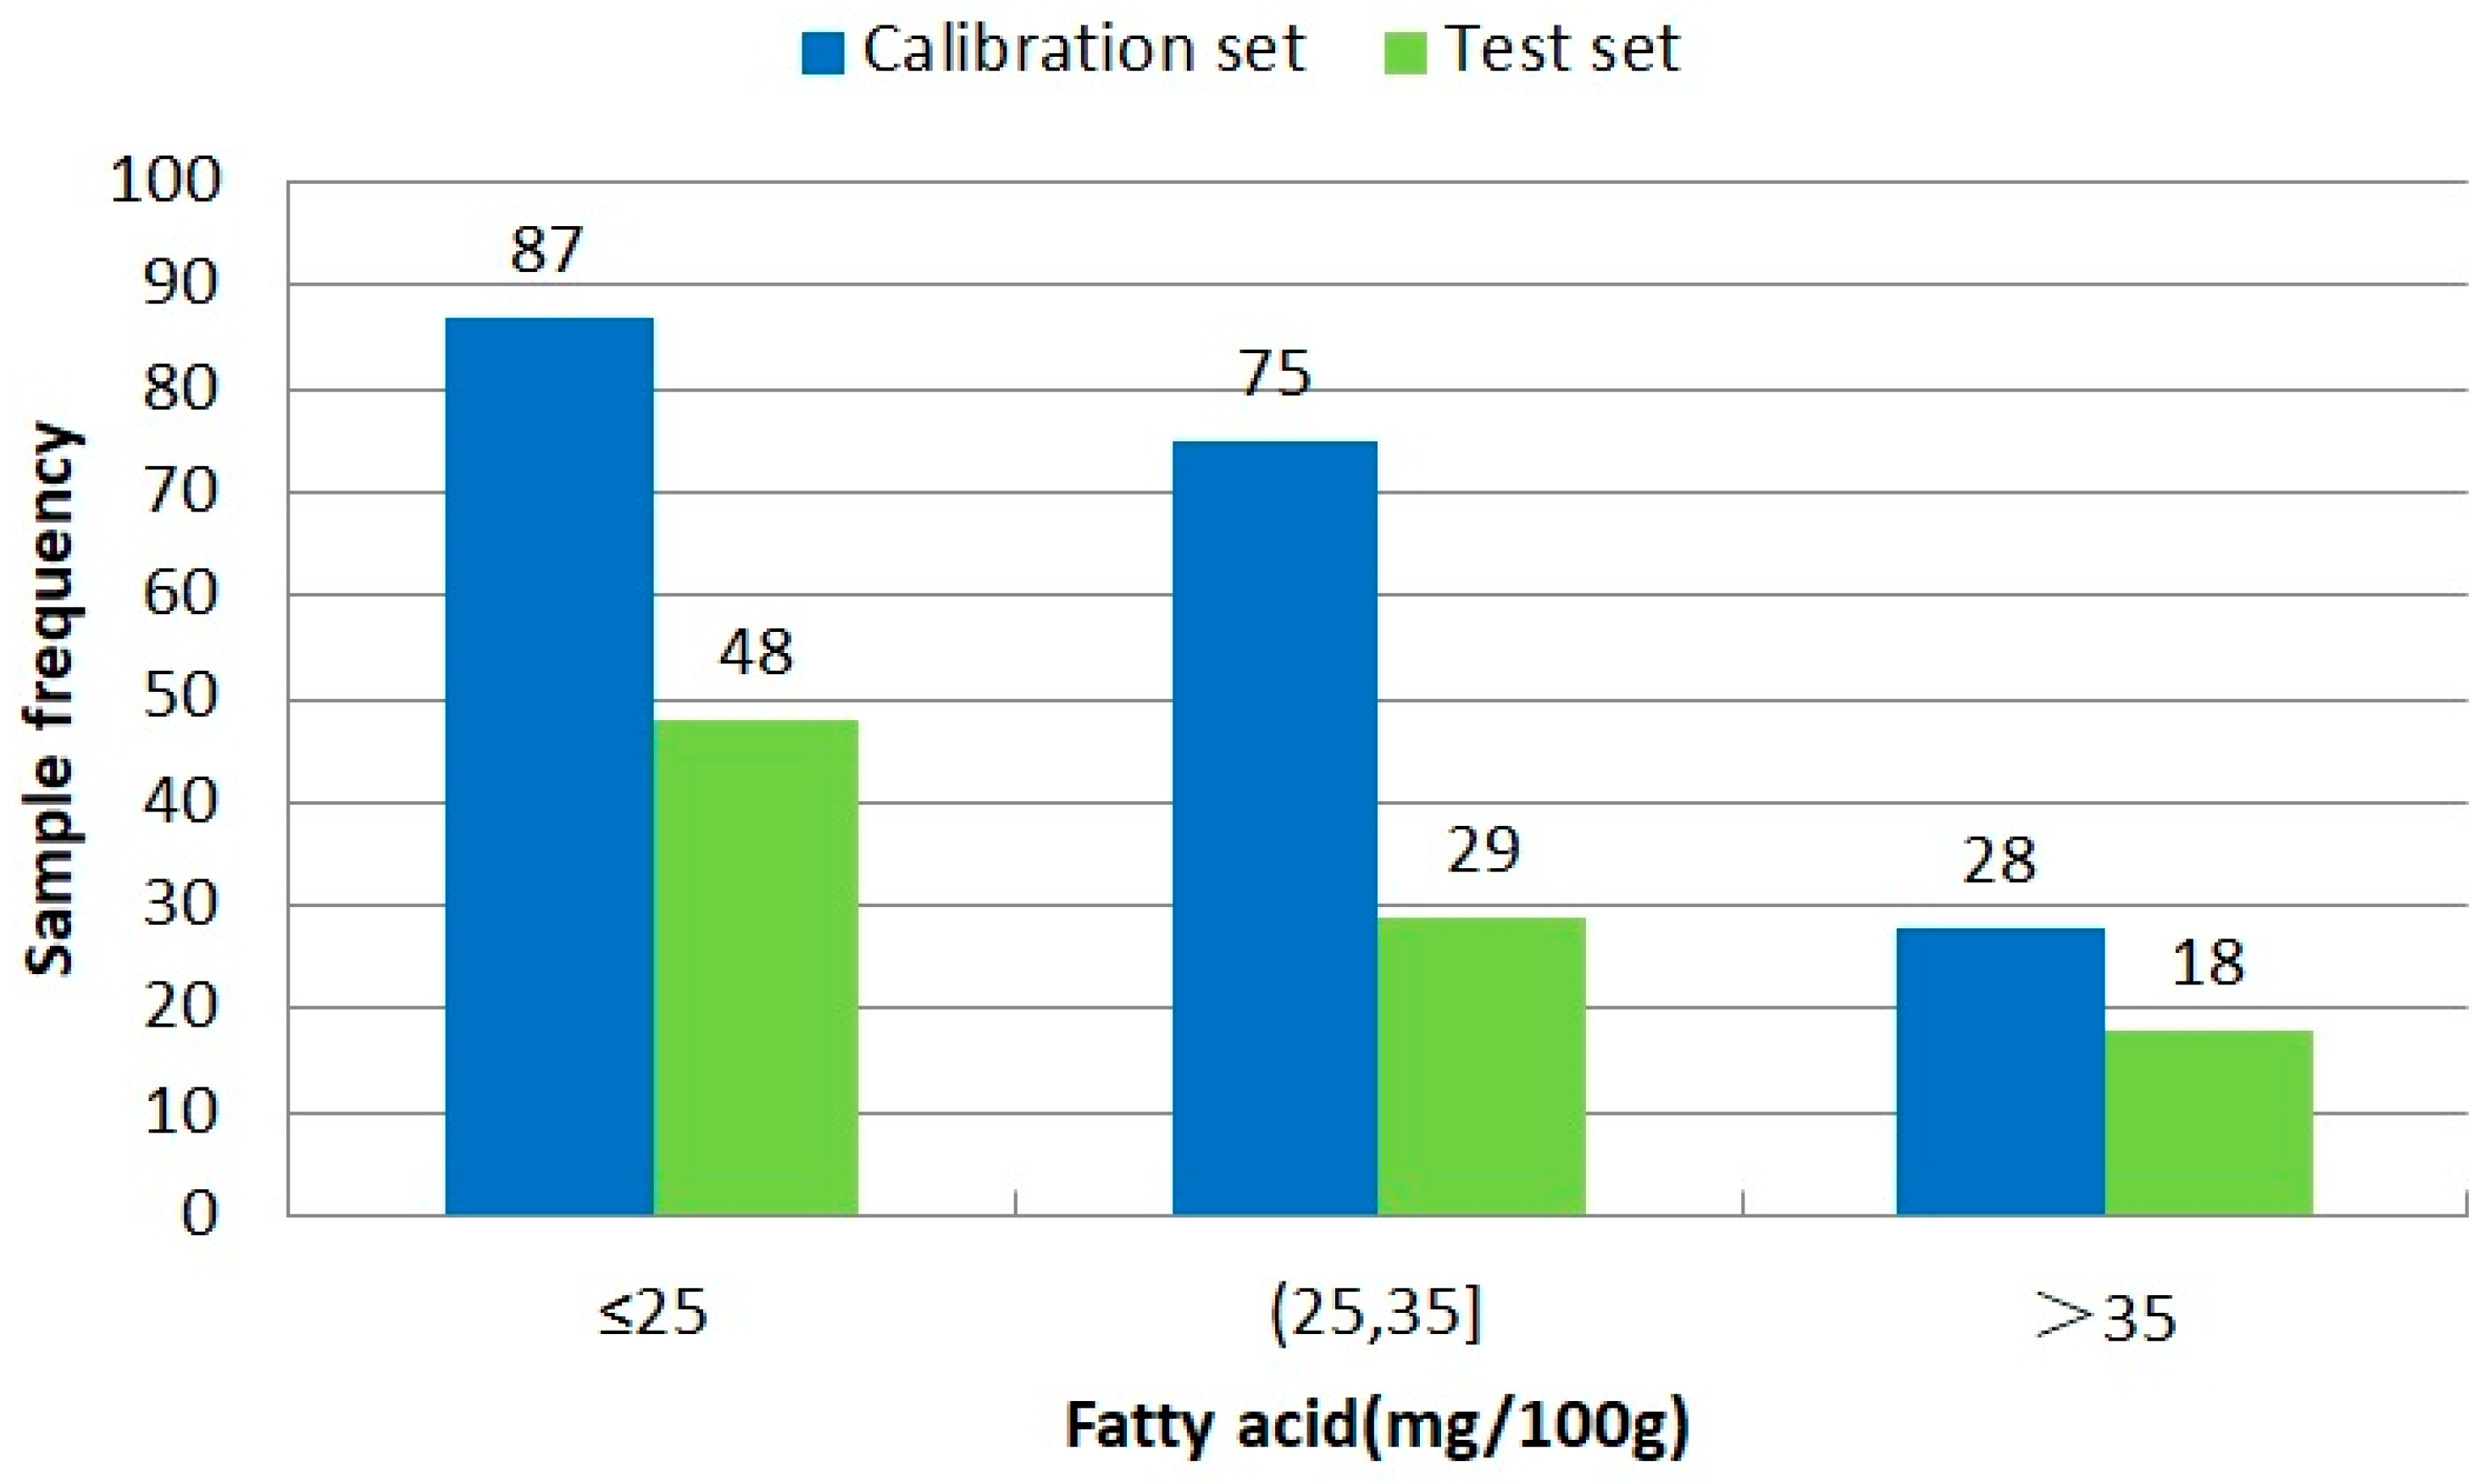
3.1. Analysis of Measured Fatty Acid

According to the statistics, 135 samples were classified as grade1 (suitable storage) and their fatty acid values were in the range of 12.11–25.0 mg/100 g; 104 samples were classified as grade2 (mildly unsuitable storage), and their values were in the range of 25.13–35.0 mg/100 g; and 46 samples were classified as grade3 (severely unsuitable storage), and their values were in the range of 35.15–67.90 mg/100 g. The statistical results of the measured fatty acid values of paddy are shown in Table 1. Among them, the mean and variance of the calibration set sample (n = 190) were 24.15 and 10.67 mg/100 g, while those of the test set sample (n = 95) were 22.47 and 9.27 mg/100 g, respectively. In terms of mean and variance, the results of the two datasets were relatively close, which indirectly indicated that the division of the dataset was more reasonable. In addition, the range of fatty acid content in the test set (12.98–60.21) was precisely covered by the calibration set range (12.11–67.90), which met the basic modeling requirements, further indicating that the division of the sample dataset had a certain degree of rationality. Furthermore, the frequency plot of the samples of both the calibration and test sets based on their measured fatty acid values is shown in Figure 2. From Figure 2, it can be seen that most paddy samples were in a suitable or mildly unsuitable state for storage (≤25.0 mg/100 g), with only a small number of samples having a fatty acid value greater than 35.0 mg/100 g and being in a severely unsuitable state. The overall data distribution of the three class samples was significant and could serve as a reference for classification models. However, there were easily mixed status samples at the threshold edges of 25 mg/100 g and 35 mg/100 g, which may affect the performance of the model.

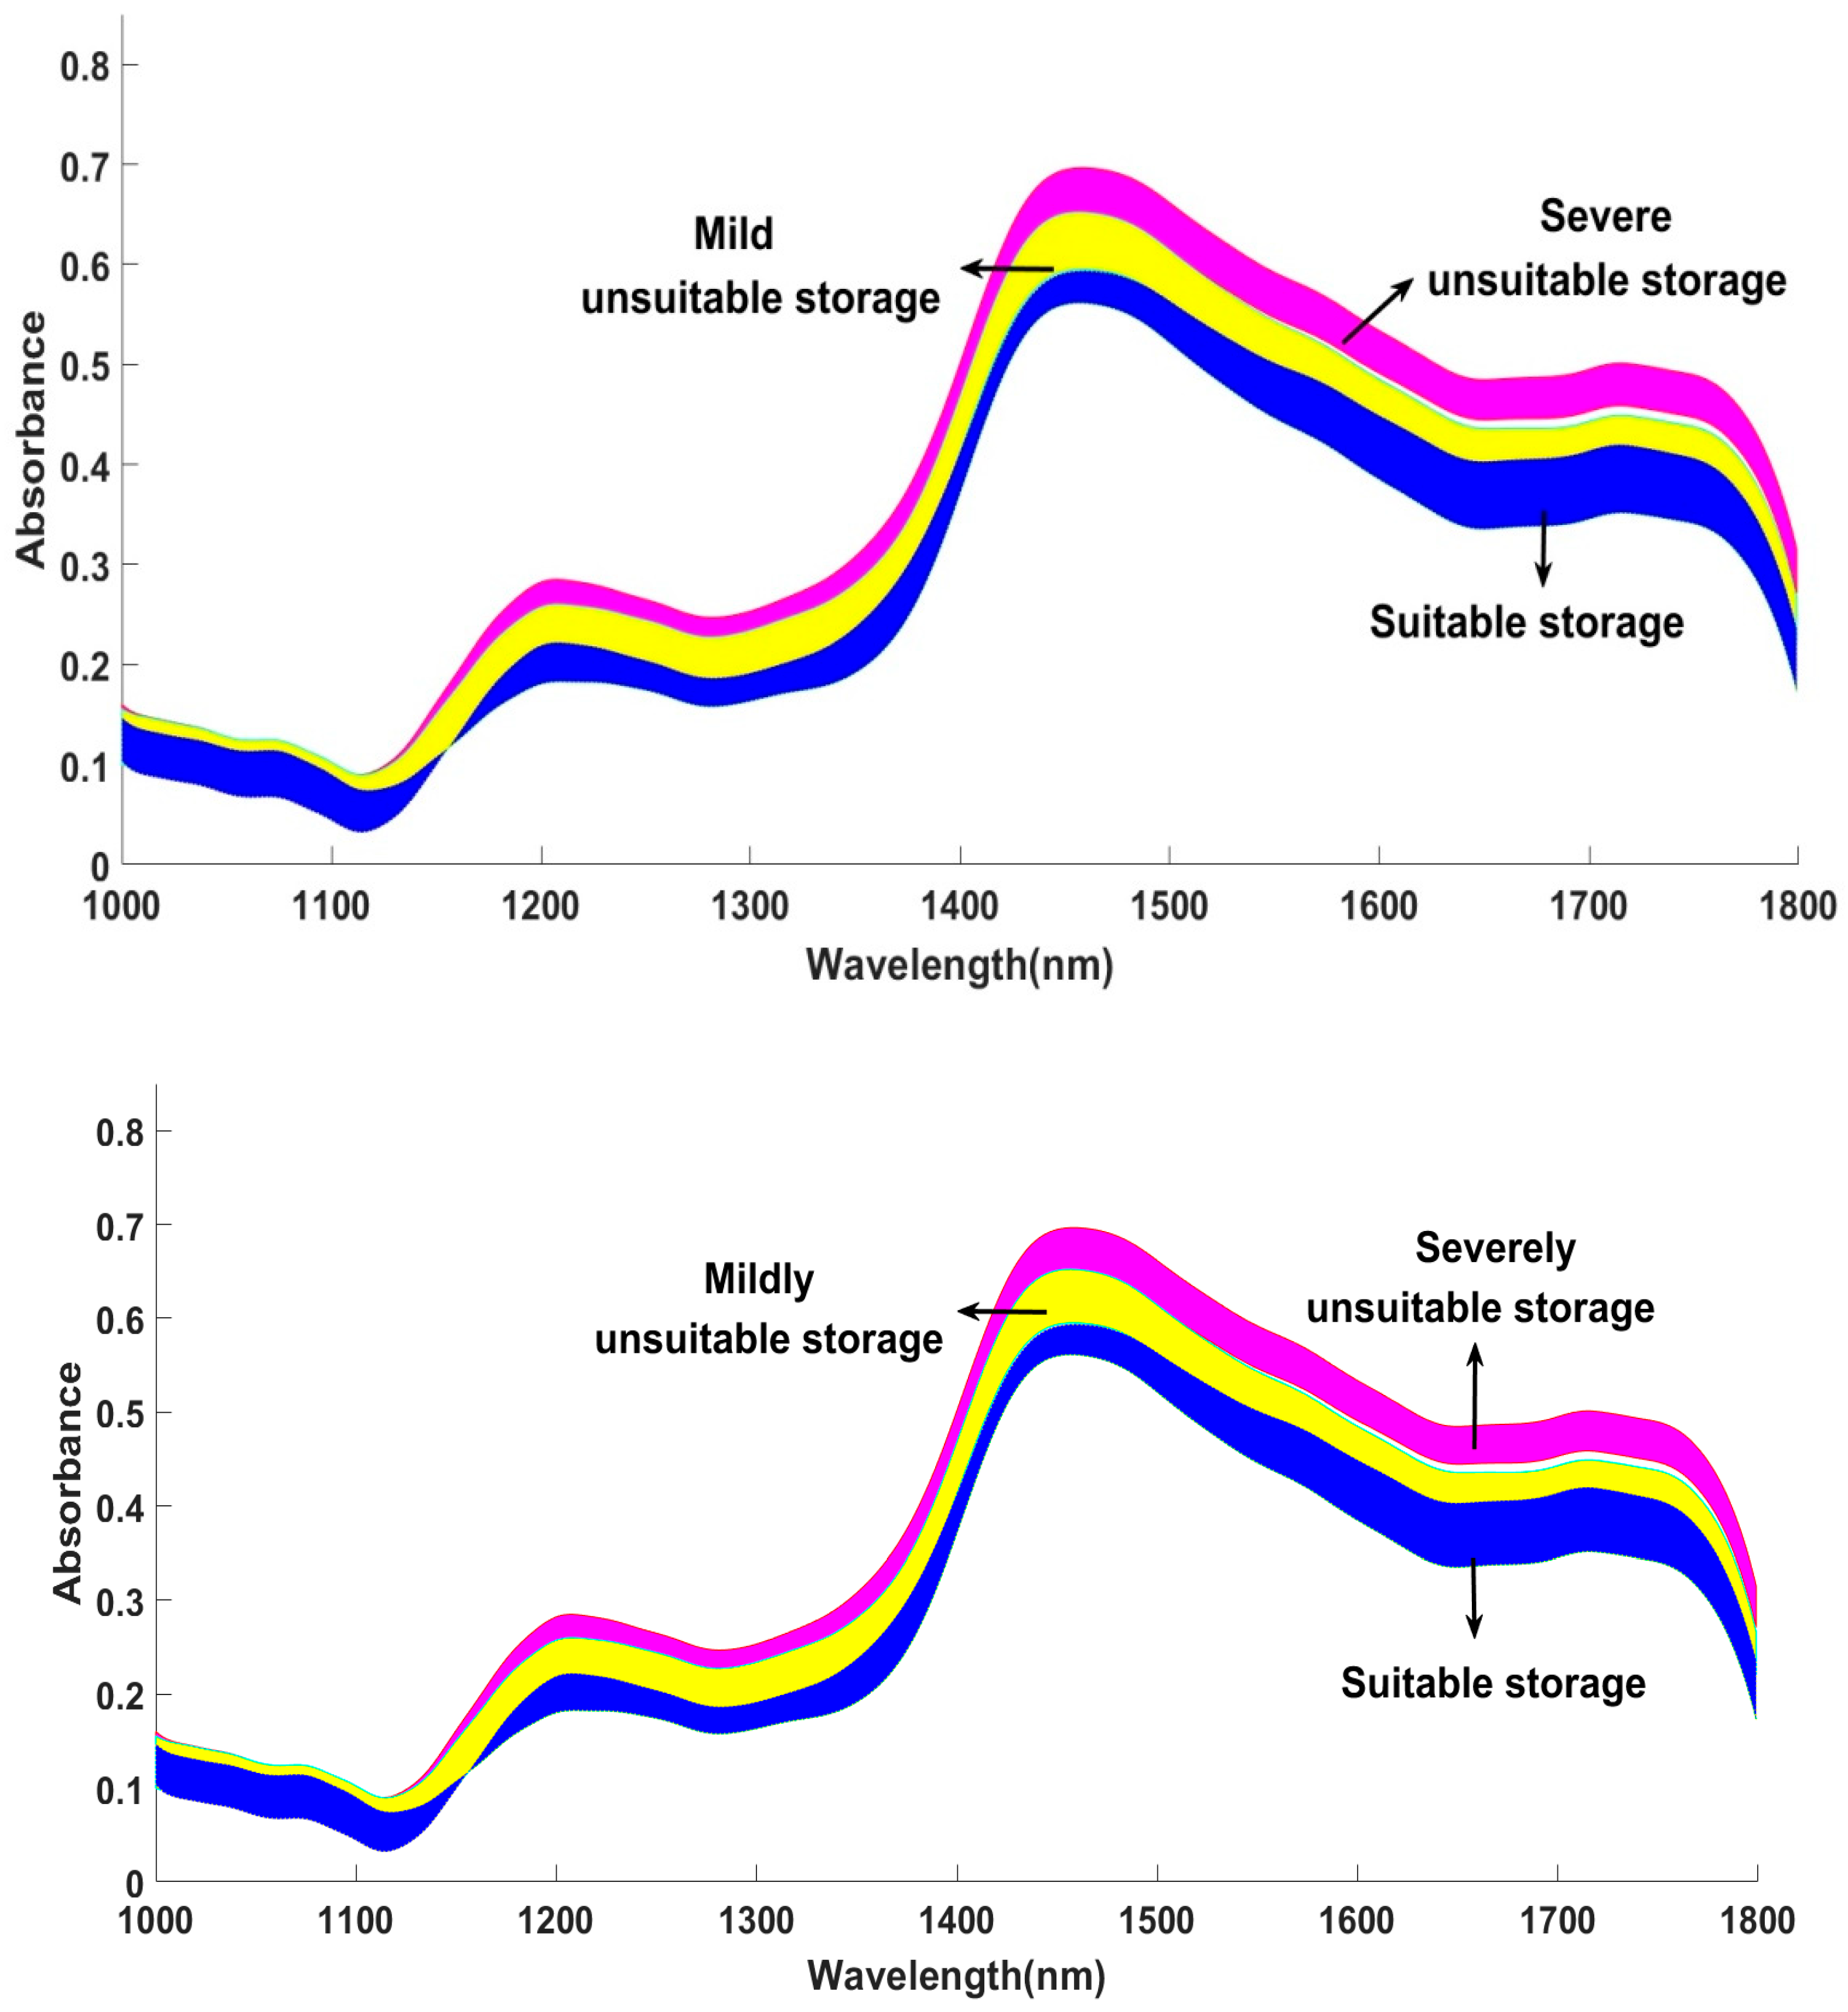
3.2. Analysis of Spectral Characteristics

The pretreatment spectrums by smoothing of all the paddy samples with different storage statuses are shown in Figure 3. Based on the picture above, it could be seen that the spectral curves distribution trends of all samples were basically consistent within the testing band of 1000–1800 nm, and they exhibited a gradient change trend with different fatty acid contents in the absorbance. With the fatty acid value of paddy increased, the corresponding absorbance displayed a trend from low to high, and the paddy storage status changed from suitable storage to severely unsuitable storage. In other words, the paddy with a high fatty acid value had a relatively strong ability to absorb light, which might be related to the loss of nutrients such as water, protein, starch, and the darkening of its surface color, because the increase in the fatty acid value of paddy indicated a decrease in its storage quality. Furthermore, the test spectrum contained multiple different absorption bands (1116 nm, 1264 nm, 1650 nm), which might be linked to the different internal components and contents of hydrogen groups, such as OH, CH, and NH, in the paddy [38,39]. Therefore, it is necessary to further analyze whether these spectral features can serve as the basis for establishing classification models for distinguishing the different storage statuses of paddy.

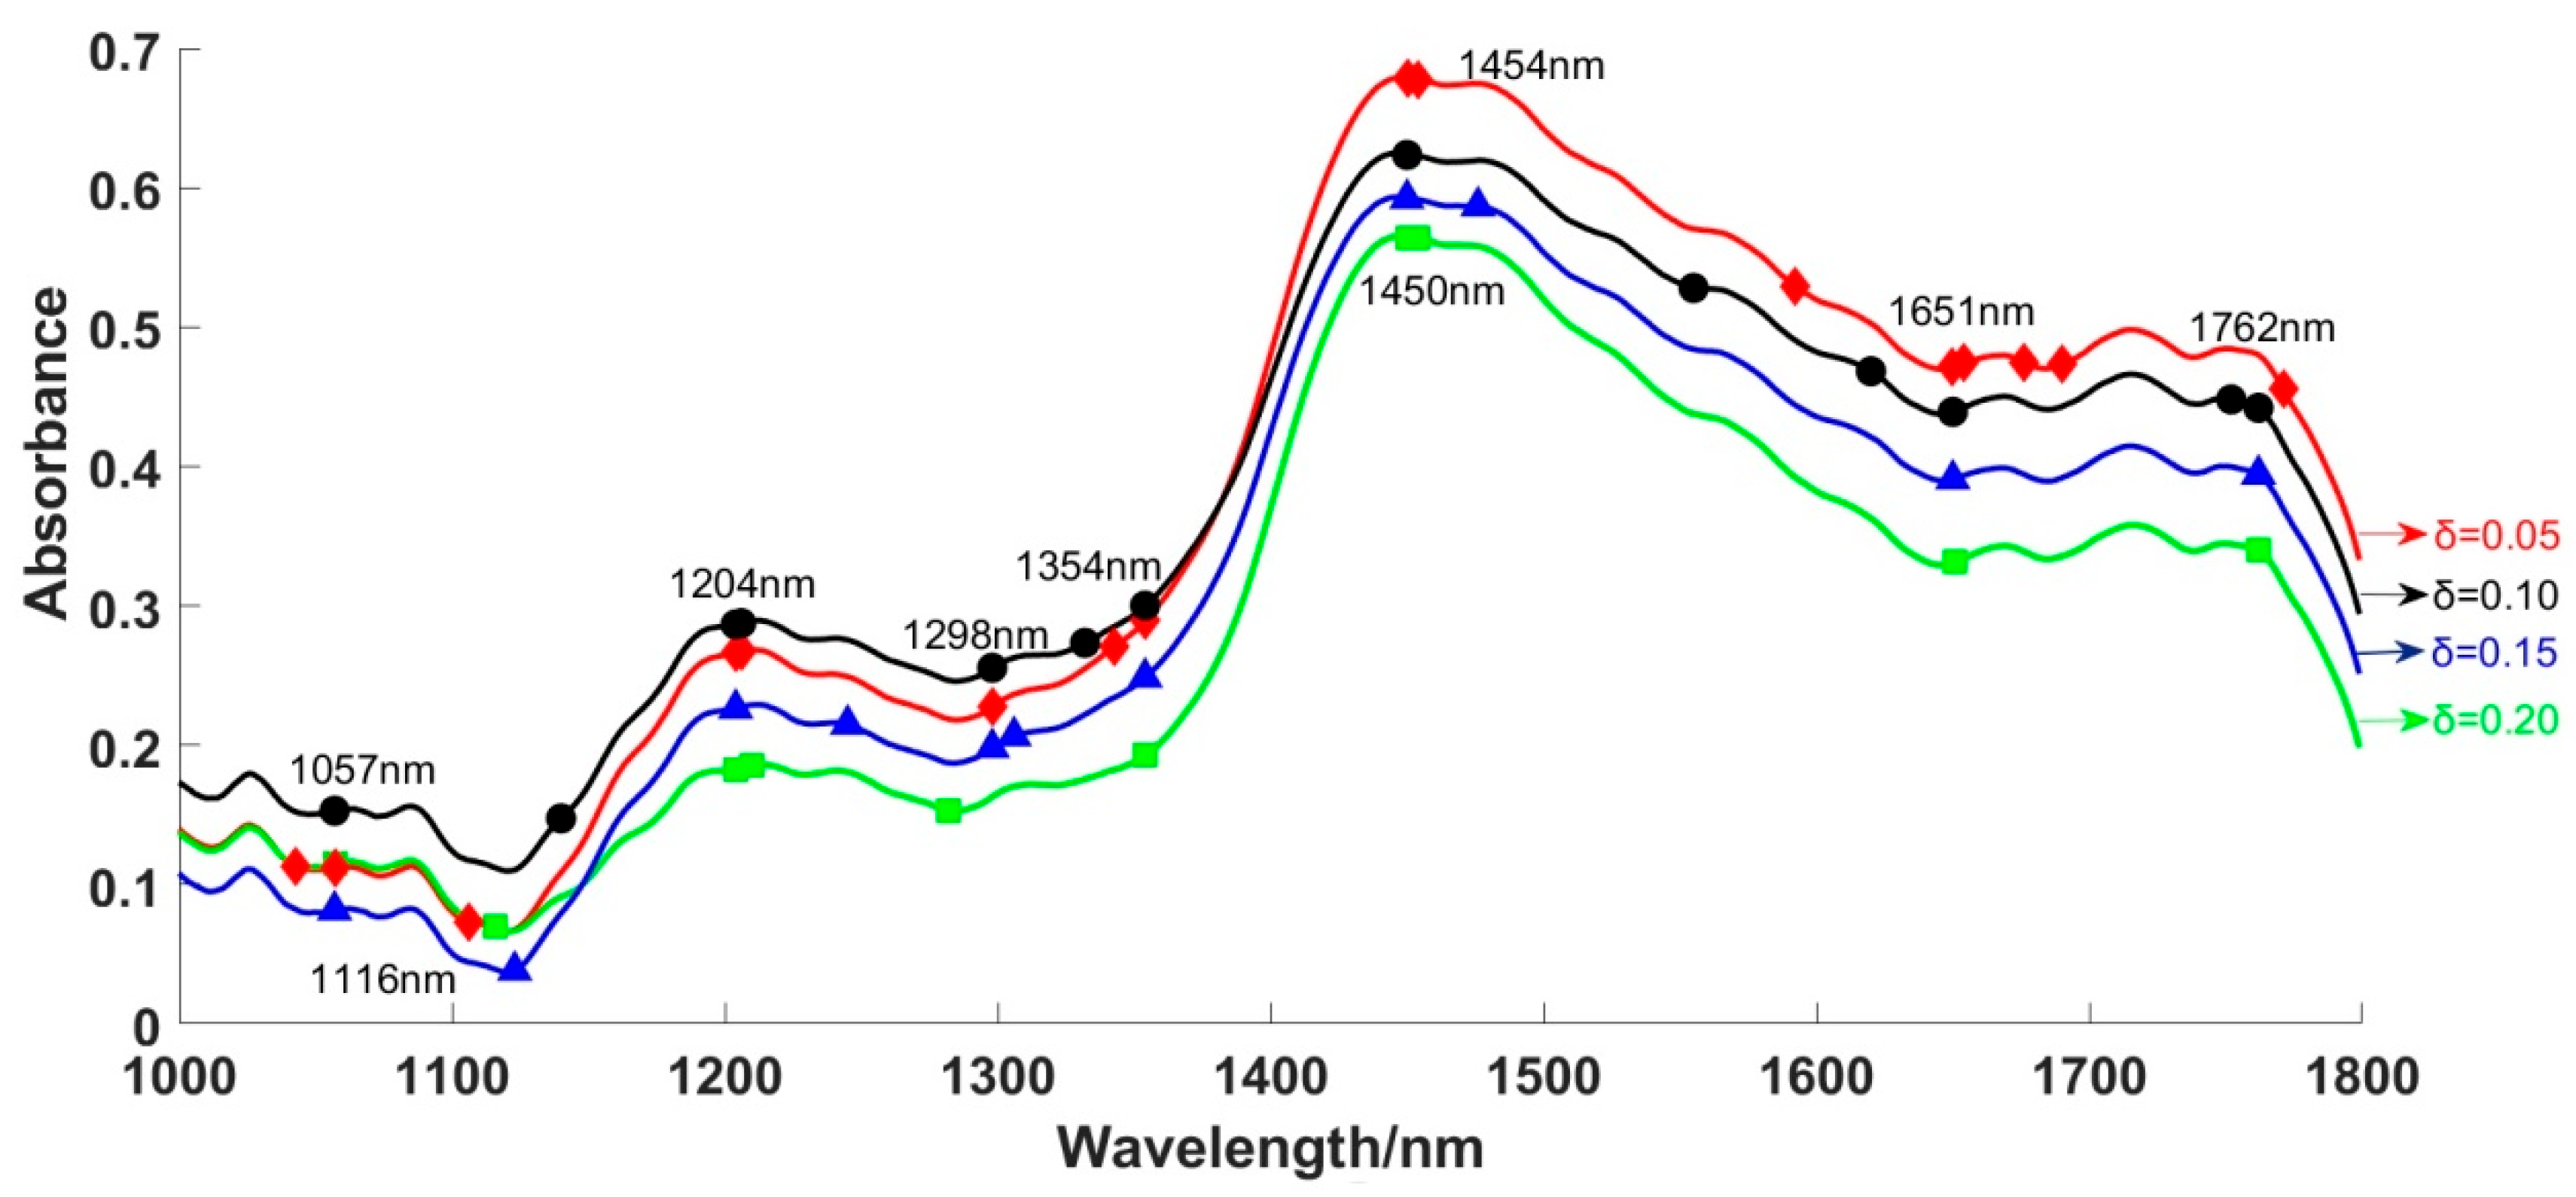
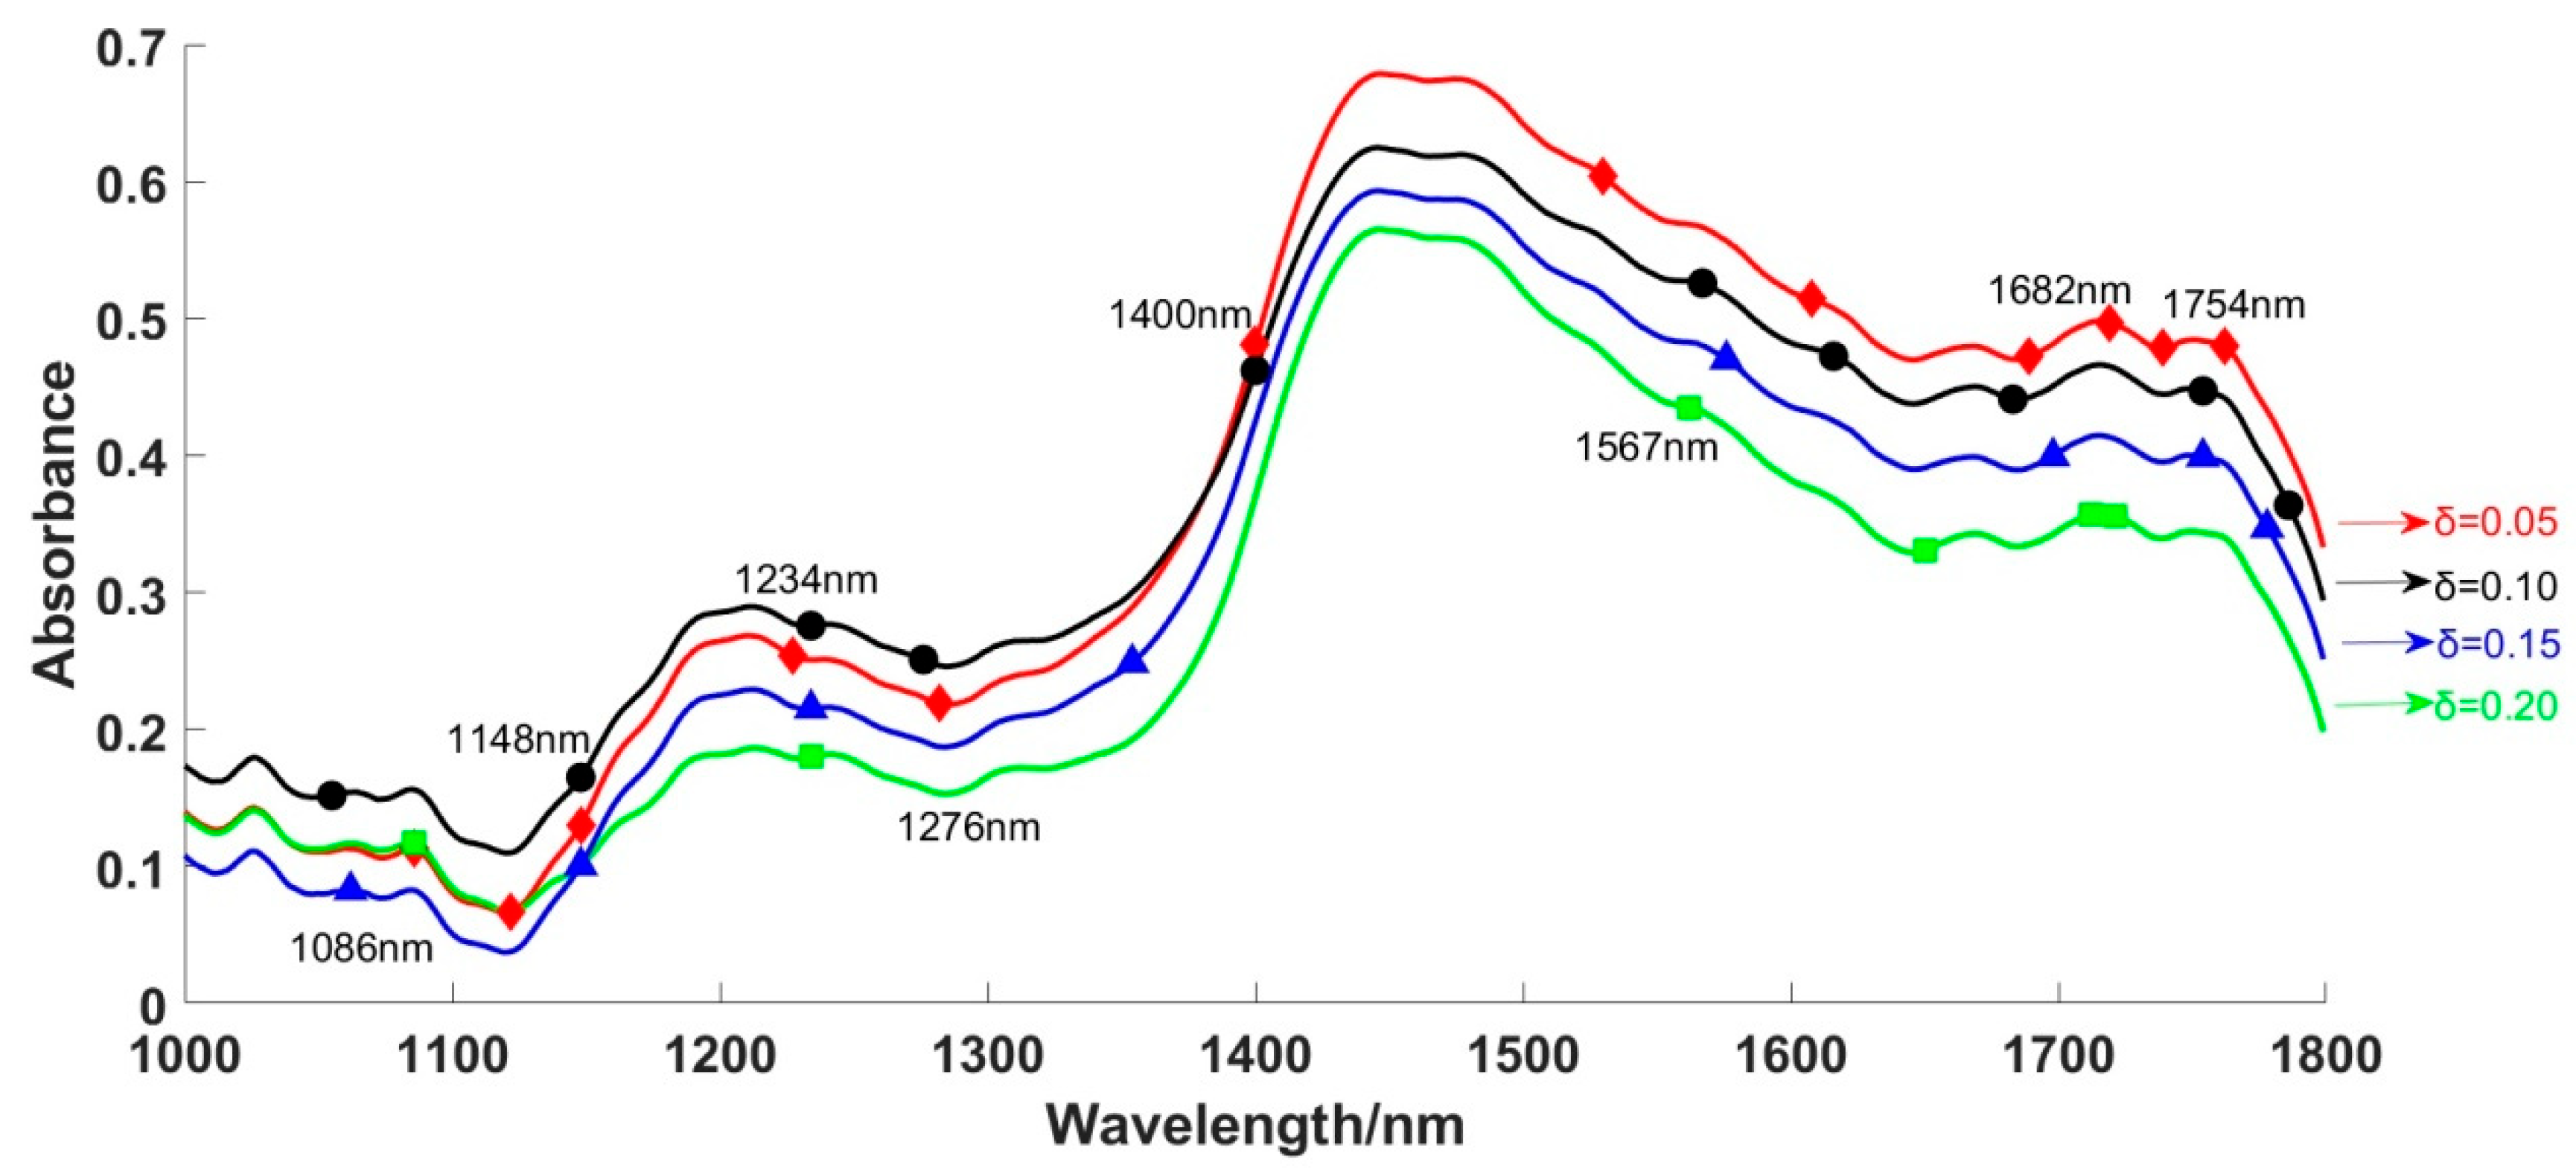
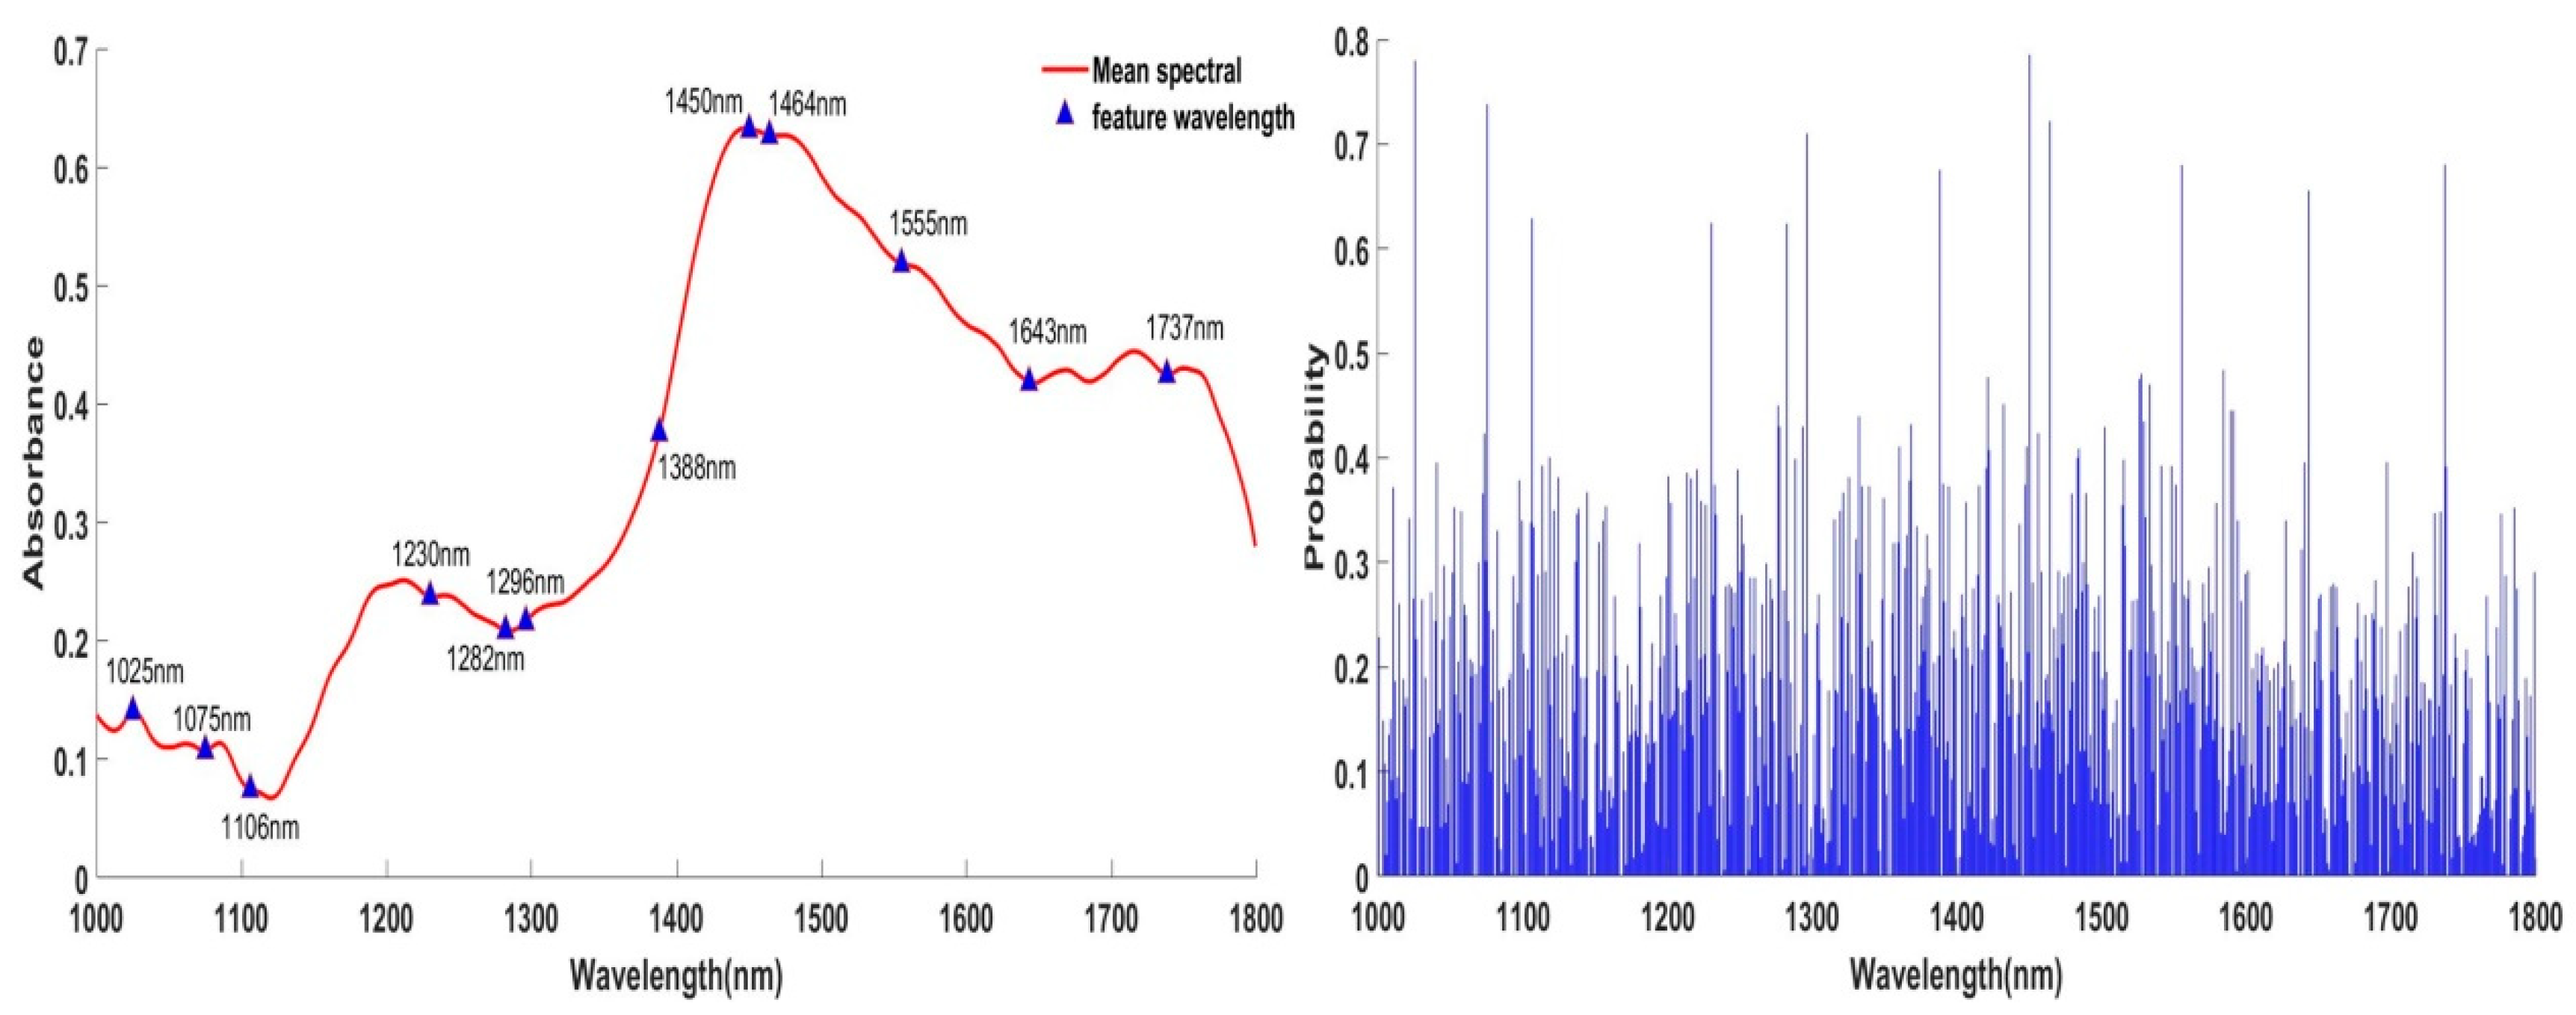
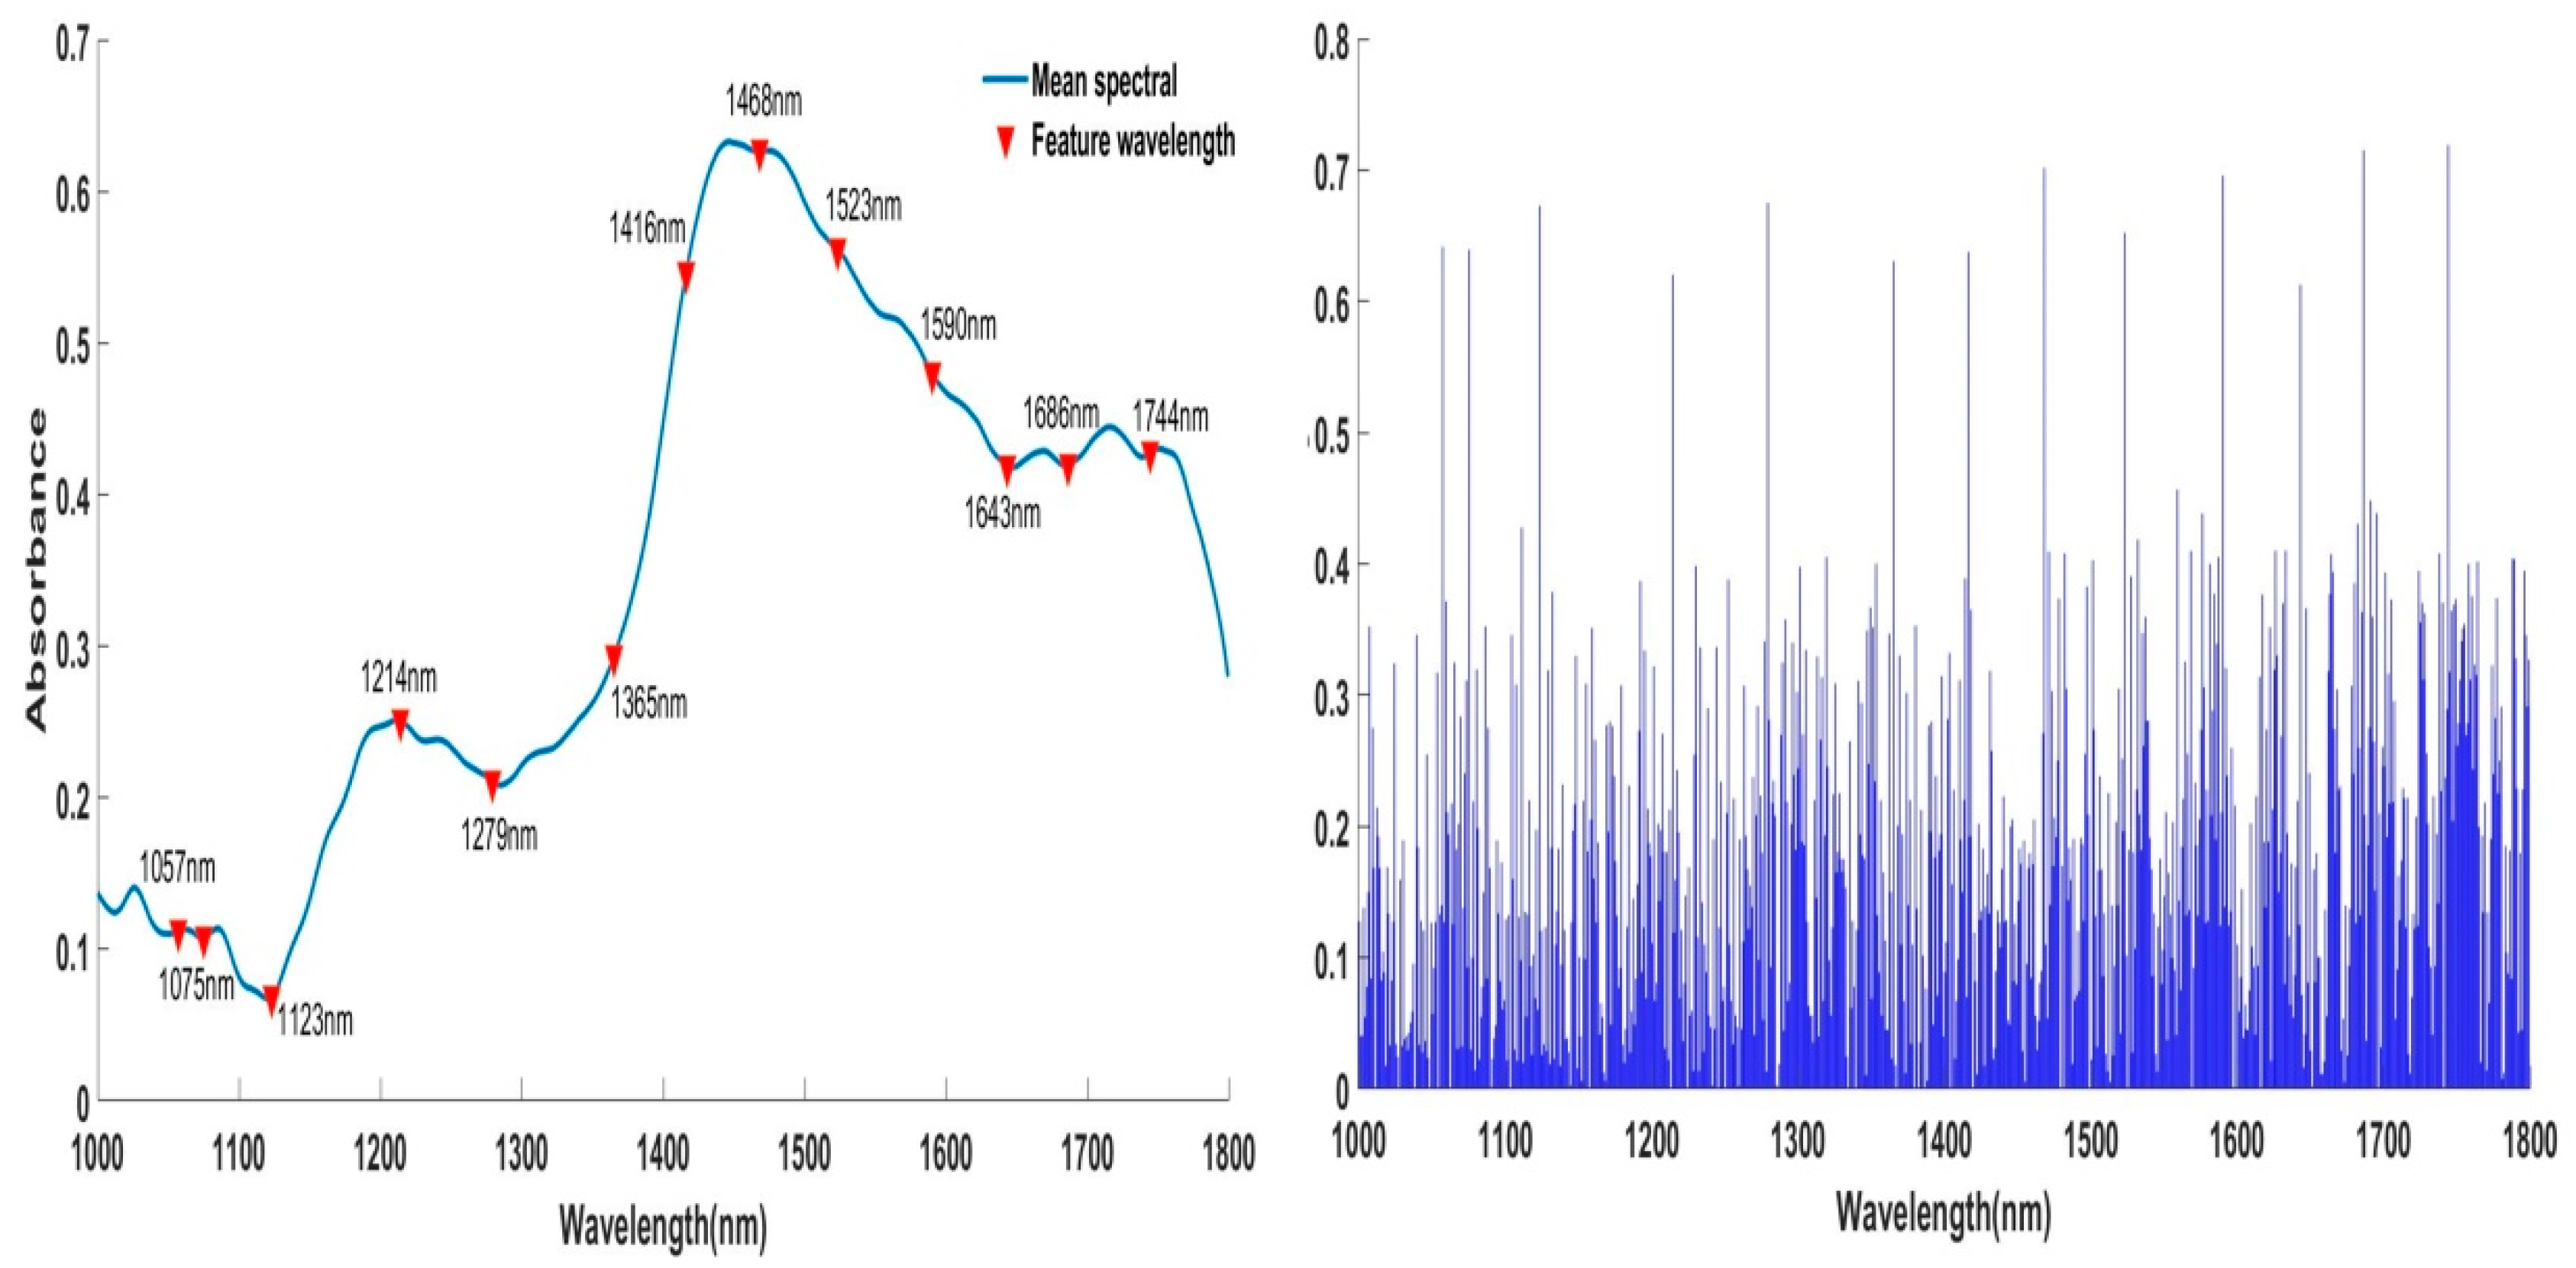
3.3. Feature Wavelengths Based on NRS

The neighborhood rough set (NRS) algorithm was used to optimize the spectral feature variables. It can be seen from reference [23] that the range of neighborhood size (δ) was from 0 to 1 and the step size was usually set as 0.05; the range of variable accuracy (β) was between 0.5 and 1, and the step size was set as 0.05 or 0.1. Based on the parameter values in reference [26], the combination of β = 0.75 and δ= (0.05, 0.10, 0.15, 0.20) was named NRS-a, and the combination of β = 0.85 and δ = (0.05, 0.10, 0.15, 0.20) was named NRS-b; these were used for optimizing characteristic wavelengths, and the results are shown in Table 2.
The 16, 13, 12, and 10 wavelength variables of different δ were selected by NRS-a and their distribution is shown in Figure 4. The analysis showed that the selected wavelengths were mostly distributed near the main absorption peaks and there were certain commonalities among them in different δ. Thus, the nine wavelength variables with common characteristics (1057 nm, 1116 nm, 1204 nm, 1298 nm, 1354 nm, 1450 nm, 1454 nm, 1651 nm, 1762 nm) were further refined based on the optimization results of NRS-a for the establishment of classification models.
For NRS-b, the 12, 10, 8, and 6 wavelength variables of different δ were selected separately and their distribution is shown in Figure 5. Through contrast analysis, the number of feature wavelengths selected by NRS-b had decreased and there were differences with the optimization results of NRS-a, but they were also distributed in the vicinity of the main absorption peak. In addition, the eight wavelength variables (1086 nm, 1148 nm, 1234 nm, 1276 nm, 1400 nm, 1567 nm, 1651 nm, 1754 nm) were condensed based on the optimization results of NRS-b for the establishment of classification models. It was necessary to further verify through the established classification model whether the selected characteristic wavelengths can express the storage state of paddy.

3.4. Feature Wavelengths Based on SPA and VCPA

The selected optimal wavelength variables using the SPA and VCPA algorithms are shown in Figure 6 and Figure 7, respectively. For SPA, the 12 optimal wavelengths (1025 nm, 1075 nm, 1106 nm, 1230 nm, 1282 nm, 1296 nm, 1388 nm, 1450 nm, 1464 nm, 1555 nm, 1643 nm, 1737 nm) were selected because they had a higher probability of being selected than other wavelengths (Figure 5). At the same time, the 13 optimal wavelengths (1057 nm, 1075 nm, 1123 nm, 1214 nm, 1279 nm, 1365 nm, 1416 nm, 1468 nm, 1523 nm, 1590 nm, 1643 nm, 1686 nm, 1744 nm) were selected by VCPA and they had the highest probability of being selected (Figure 6). The above two sets of spectral characteristic variables did not have completely consistent wavelengths, but they were all distributed near the main absorption peaks, which was similar to the optimization results of the NRS algorithm. Therefore, it was necessary to further compare and verify the representativeness of the selected bands by different algorithms through the ability of the established classification model.

3.5. Classification Model Construction

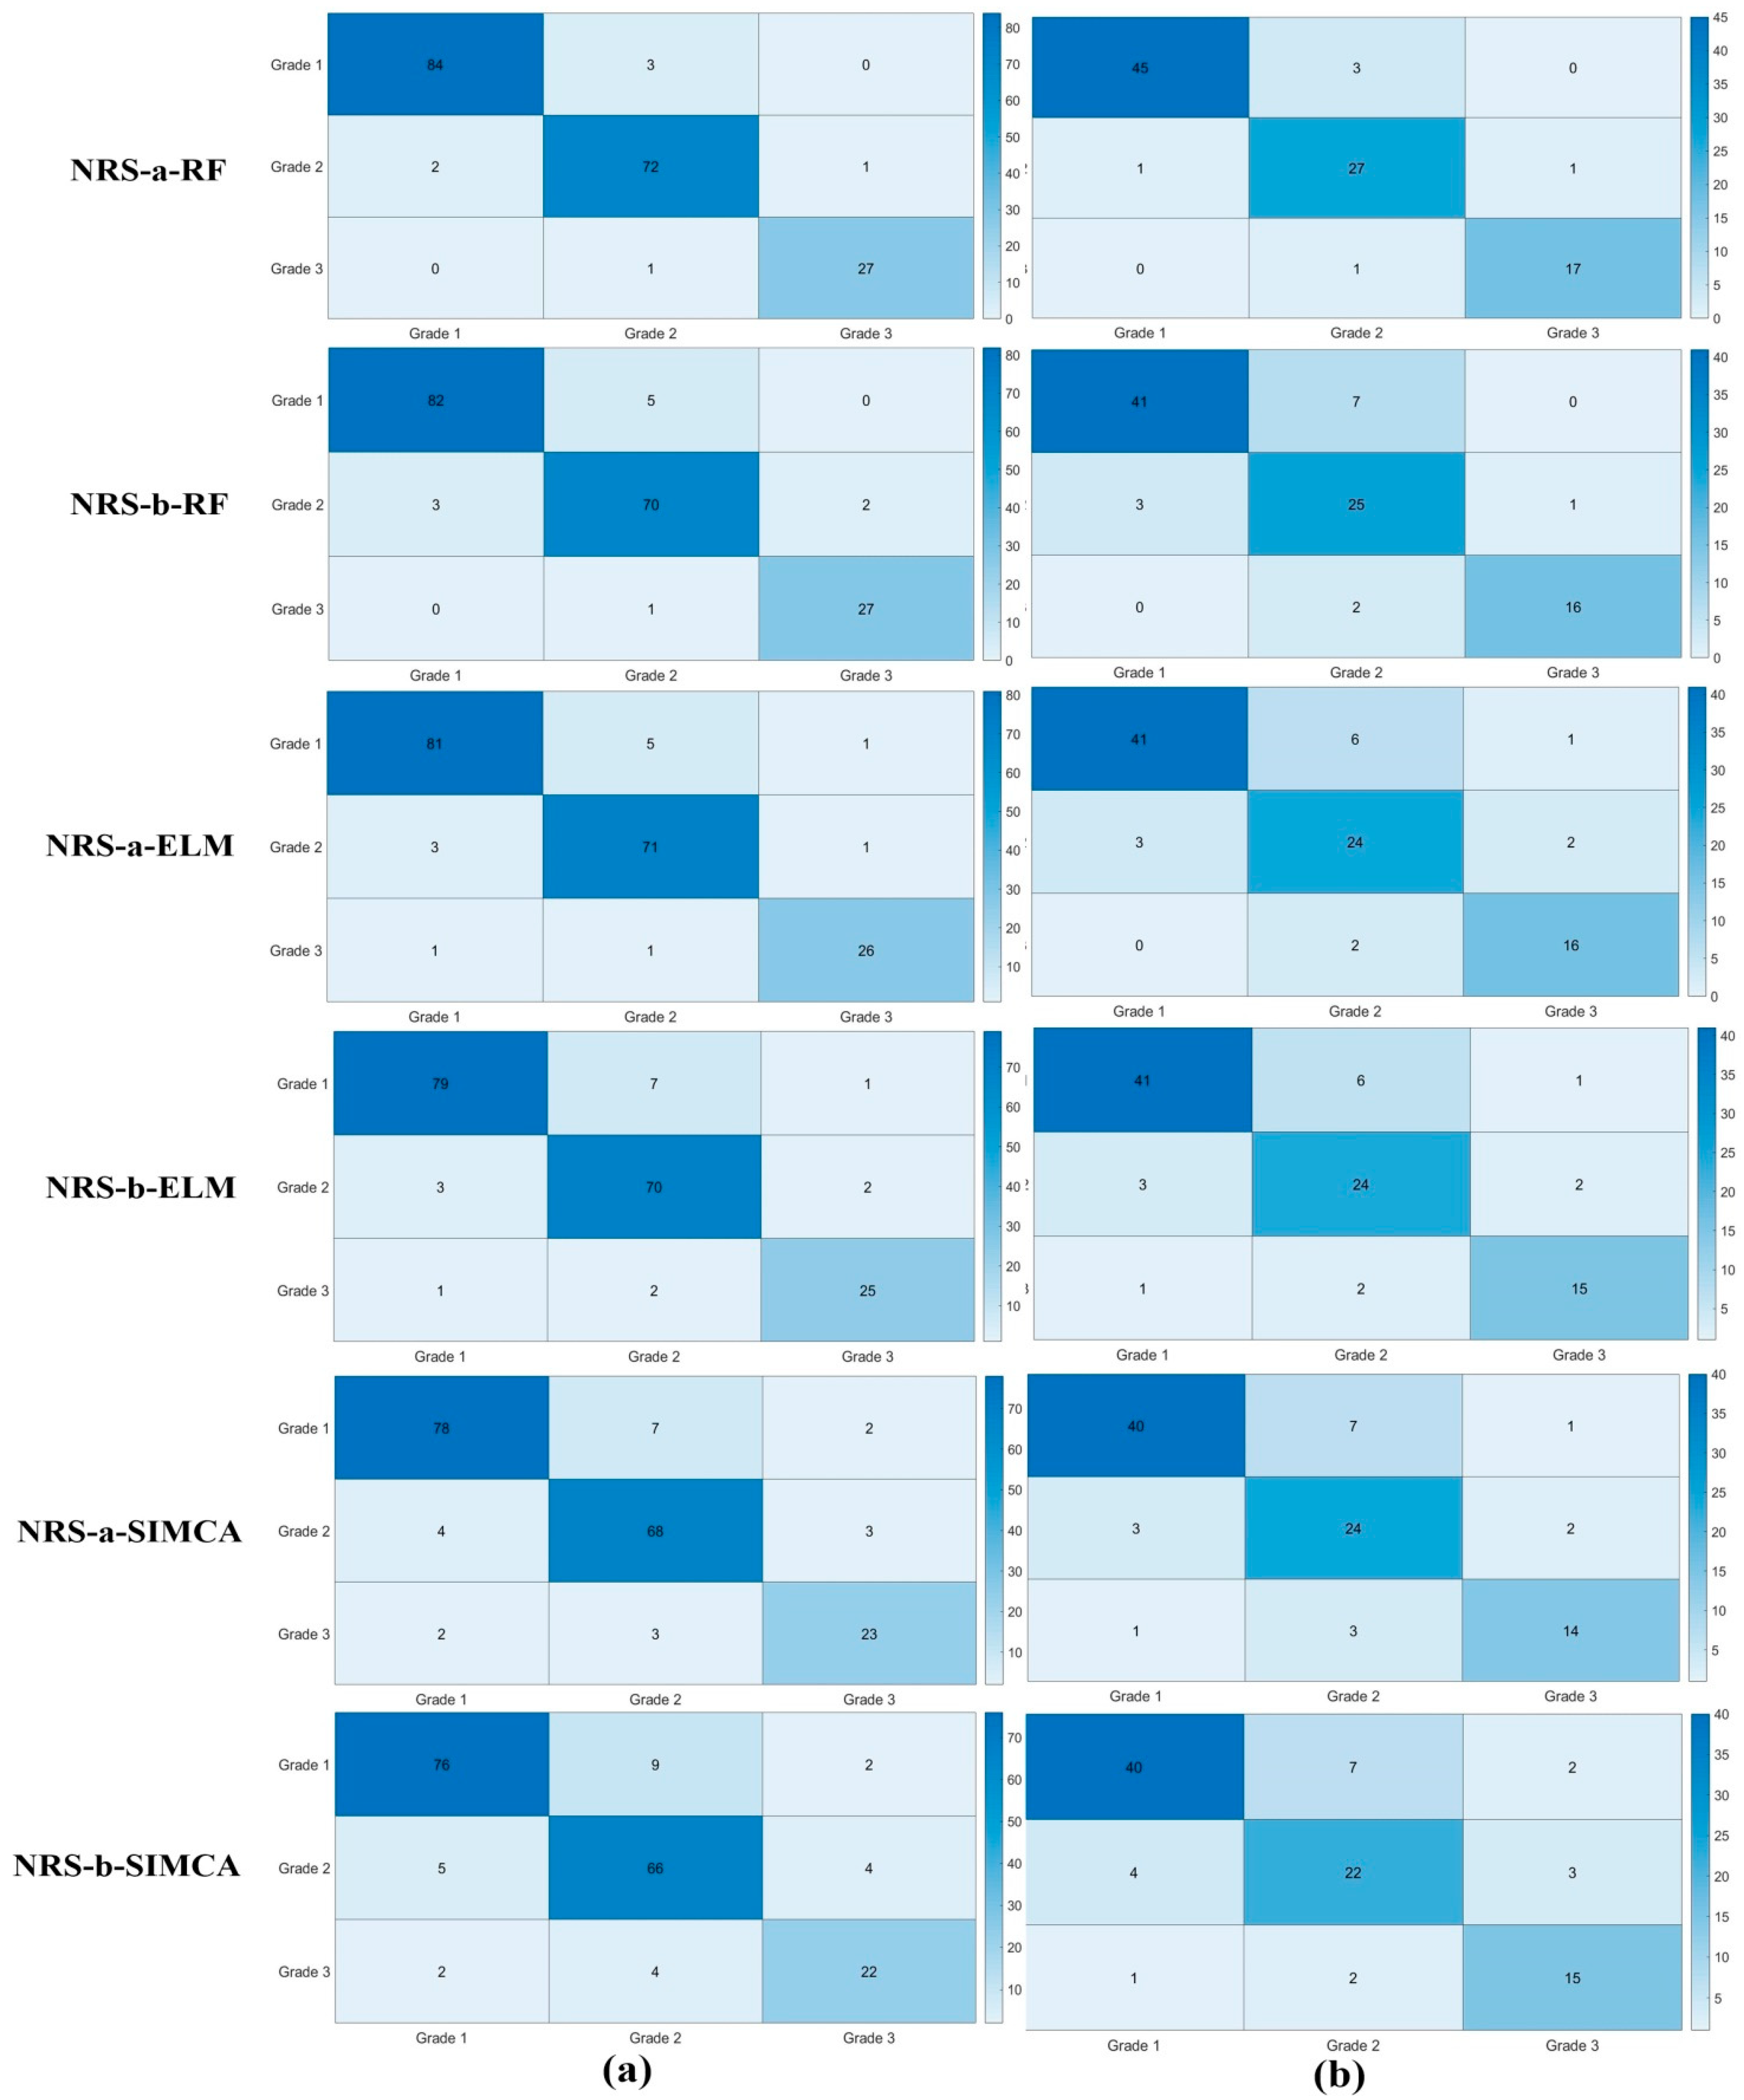
3.5.1. Identification Results Based on NRS with Classifiers

The selected feature wavelengths by NRS-a (nine spectral bands) and NRS-b (eight spectral bands) were combined with the three methods of RF, ELM, and SIMCA to establish different classification models; these were named NRS-a-RF, NRS-b-RF, NRS-a-ELM, NRS-b-ELM, NRS-a-SIMCA, and NRS-b-SIMCA. The classification accuracies of the different models are shown in Table 3. The confusion matrix of classification results of paddy storage status by NRS with different classifiers on the two data sets is shown in Figure 8. From Table 3 and Figure 8, the classification result of the NRS-a-RF model, with CCR of 96.31%, was slightly higher than that of the NRS-b-RF model (CCR of 94.21%) in the calibration set and only one misjudgment was made for the identification of grade3 paddy samples, severely unsuitable storage. However, there were significant differences in the test set, and the CCR of NRS-b-RF decreased from 94.21% to 86.31%, whereas the NRS-a-RF model only decreased by 2.63%. Therefore, the NRS-a-RF model had an ideal classification result in terms of accuracy and stability.
The CRR of the NRS-a-ELM model in both the calibration set (CRR of 93.68%) and test set (CRR of 85.26%) were higher than that of the NRS-b-ELM model with CCRs of 91.57% and 84.21%, and there was no significant difference in the discrimination results of individual grade samples between them. Furthermore, the whole performance of the NRS-a-ELM and NRS-b-ELM models was inferior to the NRS-a-RF and NRS-b-RF models, which meant that the classification ability of the RF method was better than the ELM method. Based on the SIMCA classifier, the whole identification ability of the NRS-a-SIMCA and NRS-b-SIMCA models was weaker than the NRS-a-ELM and NRS-b-ELM models and even worse than the NRS-a-RF and NRS-b-RF models. The CCRs of NRS-a-SIMCA, with 88.94% and 82.10%, and NRS-b-SIMCA, with 86.31% and 81.05% in both the calibration and test sets, were lower by 11.58% and 12.63% than that of the best NRS-a-RF model in the test set. It is feasible to use the selected feature wavelengths from the NRS algorithm to identify the different storage states of paddy, where the feature wavelength from the NRS-a algorithm was more representative and the performance of the RF classifiers was superior to others. Therefore, the NRS-a-RF model had great potential for detecting the quality and safety status of paddy during storage.

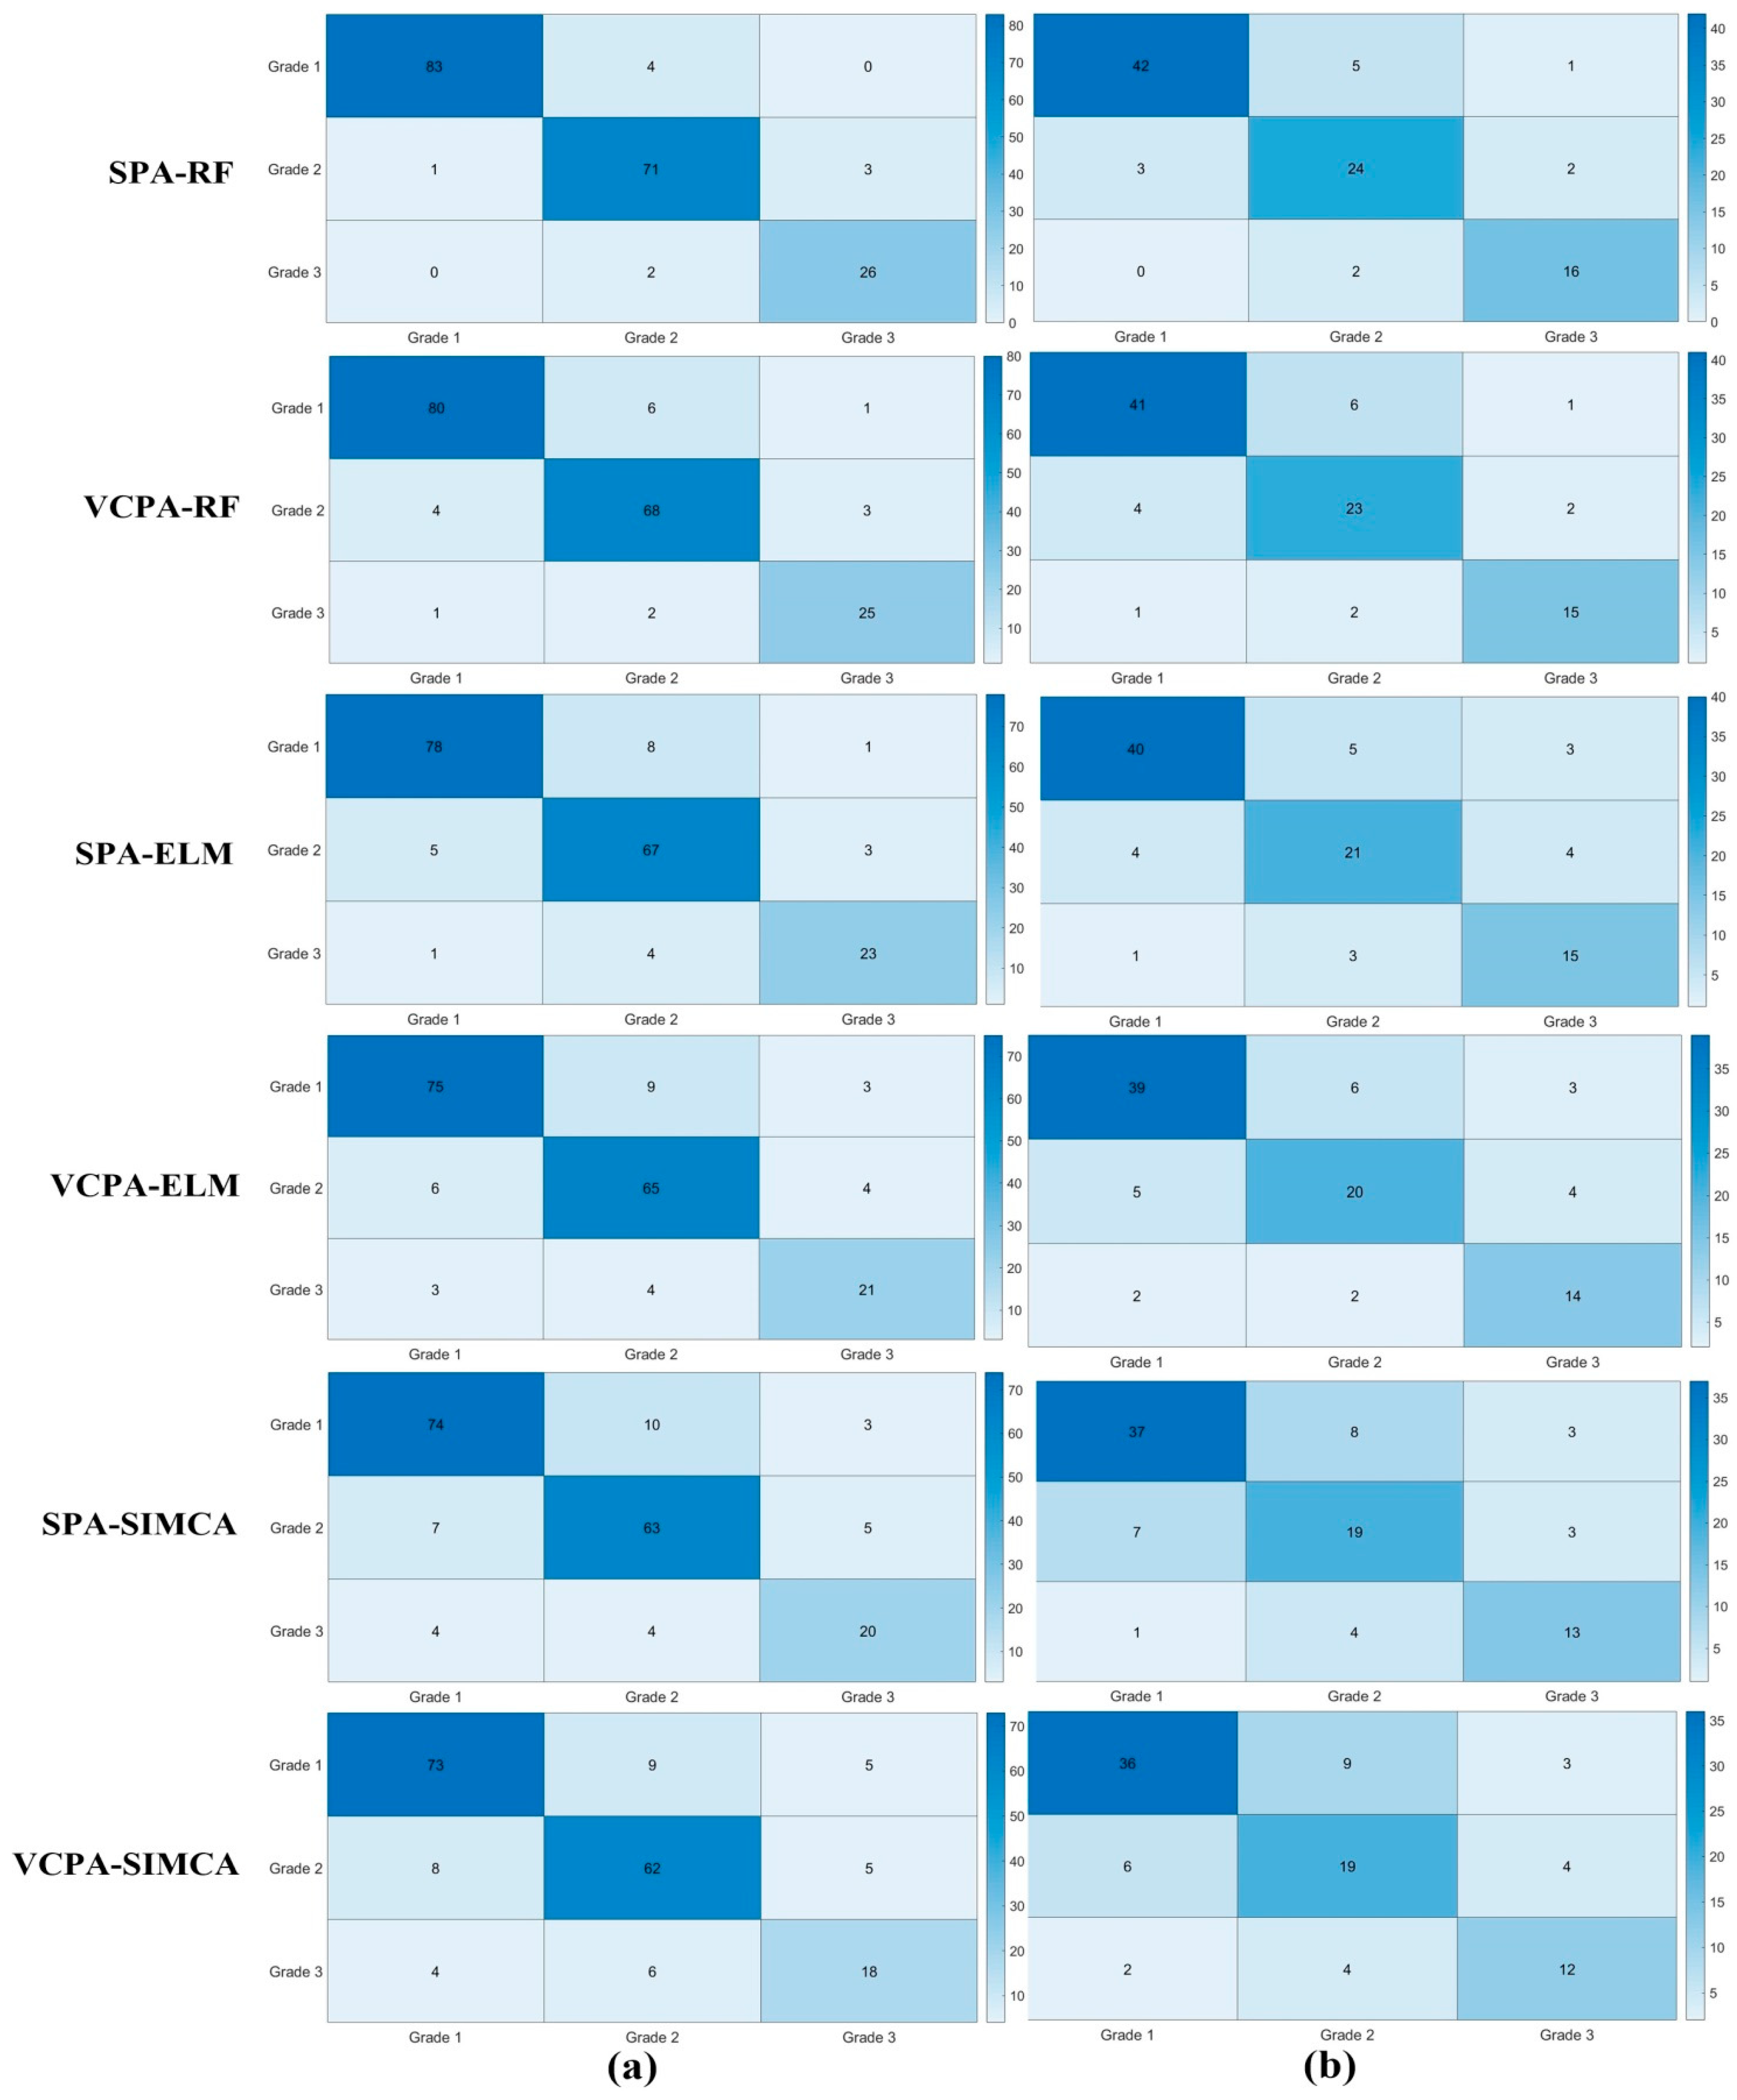
3.5.2. Identification Results Based on SPA and VCPA with Classifiers

To further compare the classification ability of extracted spectral features by NRS algorithms, the selected feature wavelengths by the SPA (12 spectral bands) and VCPA (13 spectral bands) methods were also combined with three classifiers of RF, ELM, and SIMCA to establish different identification models. These were named SPA-RF, SPA-RF, SPA-ELM, VCPA-ELM, SPA-SIMCA, and VCPA-SIMCA, and the classification accuracies of the different models are shown in Table 4. The confusion matrix of the classification results of paddy storage status by SPA and VCPA with different classifiers on both the data sets are shown in Figure 9.
The analysis showed that the whole performances of models based on feature wavelengths by the SPA and VCPA algorithms were inferior to classification models based on the NRS series methods. The classification ability of SPA-RF was higher than that of VCPA-RF and their CCRs exceeded 90% in the calibration set, at 94.73% and 91.05%, respectively. For the test set, their CCRs decreased to 86.31% and 83.15% and were lower by 7.37% and 10.53% than that of the best NRS-a-RF model, respectively. That is to say, the stability of the SPA-RF and VCPA-RF models still needed to be improved. The classification results of SPA-ELM and VCPA-ELM models showed a downward trend; their CCRs were 88.42% and 84.73% in the calibration set. For the test set, the number of misclassified samples increased to 19 and 22 and their CCRs were 80.0% and 76.84%, respectively. For the SPA-SIMCA and VCPA-SIMCA models, their classification results were unsatisfactory. In particular, the CCRs were only 72.63% and 70.52% in the test set, respectively. From the information mentioned above, it can be determined that the SIMCA method is probably not suitable for the classification of paddy storage status based on spectral feature information.
The best NRS-a-RF model and the SPA-RF model were selected to further compare the identification ability for different paddy samples through the indicators of sensitivity and specificity (Table 5). The analysis showed that the sensitivity and specificity indicators of the NRS-a-RF model were distributed within the range of 0.96–0.99 and the indicators of the SPA-RF model were within the range of 0.92–0.99 in the calibration set. Their performances were relatively ideal and there was no significant difference between them. For the test set, the evaluation indicators of the NRS-a-RF model were distributed between 0.93 and 0.98, which indicated a good stability for it. However, the classification accuracy and stability of the SPA-RF model showed a decreasing trend (a range of 0.83 to 0.95). From this, it could be seen that the overall classification performance of the SPA-RF model for the storage status of paddy samples was also inferior to the best NRS-a-RF model. Therefore, it was feasible to use the nine spectral feature wavelengths of the NRS-a algorithm combined with the RF classifier to establish the NRS-a-RF model for the identification of the storage status of paddy samples.

4. Conclusions

In this study, the accurate identification of the suitable storage status of paddy during storage using NIR (1000–1800 nm) technology combined with the feature selection algorithms of NRS, SPA, and VCPA was investigated. The storage statuses of paddy samples were divided into three grades (suitable storage, mildly unsuitable storage, severely unsuitable storage) based on the values of measured fatty acid as the reference. The different spectral feature wavelengths were extracted separately using NRS-a, NRS-b, SPA, and VCPA. Based on the feature wavelengths, three classifiers of RF, ELM, and SIMCA were used to establish the classification models for identifying the storage statuses of the paddy. The analysis showed that the nine spectral wavelengths selected by the NRS-a algorithm coupled with the RF classifier to build the NRS-a-RF model had the best classification ability, with high CCRs of 96.31% and 93.68% in the calibration and test sets, respectively. Additionally, the indicators of sensitivity and specificity were 0.93–0.99. Thus, the integrated NRS and RF algorithms based on NIR technology could effectively improve the identification ability for paddy storage status compared to other methods. This study is expected to provide theoretical guidelines and new ideas for the development of on-site rapid inspection technology for grain quality and safety.

Author Contributions

Modeling, data testing and validation, writing—original manuscript by D.Y.; software by Y.Z.; data collection and preprocessing by Y.J. and Q.L.; supervision and revision of manuscript by T.S. All authors have read and agreed to the published version of the manuscript.

Funding

This study was supported by the Special Scientific Research Surplus Fund of the Academy of National Food and Strategic Reserves Administration of China (Item No: JY2302).

Institutional Review Board Statement

The study did not require ethical approval.

Informed Consent Statement

The study did not involve humans.

Data Availability Statement

The datasets generated for this study are available on request to the corresponding author.

Conflicts of Interest

The authors declare no conflict of interest.

References

  1. Pei, P.; Xiong, K.; Wang, X.; Sun, B.; Zhao, Z.; Xu, J.; Jin, X.; Ye, H.; Xiao, J.; Kong, J. Modelling the effect of environmental factors on the growth of Aspergillus parasiticus and mycotoxin production in paddy during storage. J. Stored Prod. Res. 2021, 93, 101846. [Google Scholar] [CrossRef]
  2. Carvalho, M.O.; Fradinho, P.; Martins, M.J.; Magro, A.; Raymundo, A.; de Sousa, I. Paddy rice stored under hermetic conditions: The effect of relative humidity, temperature and storage time in suppressing Sitophilus zeamais and impact on rice quality. J. Stored Prod. Res. 2019, 80, 21–27. [Google Scholar] [CrossRef]
  3. Tao, L.; Qin, W.; Wei, Z.; Li, X.; Zhang, H. Effects of small-scale storage on the cooking property and fatty acid profile of sea rice paddy. Appl. Food Res. 2022, 2, 100175. [Google Scholar] [CrossRef]
  4. Chai, Q.; Li, Y.; Li, X.; Wu, W.; Peng, H.; Jia, R.; Sun, Q. Assessment of variation in paddy microbial communities under different storage temperatures and relative humidity by Illumina sequencing analysis. Food Res. Int. 2019, 126, 108581. [Google Scholar] [CrossRef] [PubMed]
  5. Covele, G.; Gulube, A.; Tivana, L.; Ribeiro-Barros, A.I.; Carvalho, M.O.; Ndayiragije, A.; Nguenha, R. Effectiveness of hermetic containers in controlling paddy rice (Oryza sativa L.) storage insect pests. J. Stored Prod. Res. 2020, 89, 101710. [Google Scholar] [CrossRef]
  6. Collins, P.J.; Falk, M.G.; Nayak, M.K.; Emery, R.N.; Holloway, J.C. Monitoring resistance to phosphine in the lesser grain borer, Rhyzopertha dominica, in Australia: A national analysis of trends, storage types and geography in relation to resistance detections. J. Stored Prod. Res. 2017, 70, 25–36. [Google Scholar] [CrossRef]
  7. Yu, L.; Li, G.; Li, M.; Xu, F.; Beta, T.; Bao, J. Genotypic variation in phenolic acids, vitamin E and fatty acids in whole grain rice. Food Chem. 2016, 197, 776–782. [Google Scholar] [CrossRef] [PubMed]
  8. Chen, Z.; Du, Y.; Mao, Z.; Zhang, Z.; Li, P.; Cao, C. Grain starch, fatty acids, and amino acids determine the pasting properties in dry cultivation plus rice cultivars. Food Chem. 2022, 373, 131472. [Google Scholar] [CrossRef]
  9. Samaranayake, M.D.W.; Abeysekera, W.K.S.M.; Hewajulige, I.G.N.; Somasiri, H.P.P.S.; Mahanama, K.R.R.; Senanayake, D.M.J.B.; Premakumara, G.A.S. Fatty acid profiles of selected traditional and new improved rice varieties of Sri Lanka. J. Food Compos. Anal. 2022, 112, 104686. [Google Scholar] [CrossRef]
  10. Hu, X.; Fang, C.; Zhang, W.; Lu, L.; Guo, Z.; Li, S.; Chen, M. Change in volatiles, soluble sugars and fatty acids of glutinous rice, japonica rice and indica rice during storage. LWT 2023, 174, 114416. [Google Scholar] [CrossRef]
  11. Mittal, S.; Dutta, M.K.; Issac, A. Non-destructive image processing based system for assessment of rice quality and defects for classification according to inferred commercial value. Measurement 2019, 148, 106969. [Google Scholar] [CrossRef]
  12. Yang, D.; He, D.; Lu, A.; Ren, D.; Wang, J. Combination of spectral and textural information of hyperspectral imaging for the prediction of the moisture content and storage time of cooked beef. Infrared Phys. Technol. 2017, 83, 206–216. [Google Scholar] [CrossRef]
  13. Awanthi, M.G.G.; Jinendra, B.M.S.; Navaratne, S.B.; Navaratne, C.M. Adaptation of visible and short wave Near Infrared (VIS-SW-NIR) common PLS model for quantifying paddy hardness. J. Cereal Sci. 2019, 89, 102795. [Google Scholar] [CrossRef]
  14. Feng, H.; Zhang, Z.; Gao, X.; Guo, X.; Li, Y.; Li, Z.; Hu, Y.; Li, W. Rapid quality assessment of Succus Bambusae oral liquid based on near infrared spectroscopy and chemometrics. Ind. Crops Prod. 2022, 189, 115862. [Google Scholar] [CrossRef]
  15. Song, Y.; Cao, S.; Chu, X.; Zhou, Y.; Xu, Y.; Sun, T.; Zhou, G.; Liu, X. Non-destructive detection of moisture and fatty acid content in rice using hyperspectral imaging and chemometrics. J. Food Compos. Anal. 2023, 121, 105397. [Google Scholar] [CrossRef]
  16. Díaz, E.O.; Iino, H.; Koyama, K.; Kawamura, S.; Koseki, S.; Lyu, S. Non-destructive quality classification of rice taste properties based on near-infrared spectroscopy and machine learning algorithms. Food Chem. 2023, 429, 136907. [Google Scholar] [CrossRef] [PubMed]
  17. Anderson, J.V.; Wittenberg, A.; Li, H.; Berti, M.T. High throughput phenotyping of Camelina sativa seeds for crude protein, total oil, and fatty acids profile by near infrared spectroscopy. Ind. Crops Prod. 2019, 137, 501–507. [Google Scholar] [CrossRef]
  18. Arslan, M.; Zareef, M.; Elrasheid Tahir, H.; Xiaodong, Z.; Rakha, A.; Ali, S.; Shi, J.; Xiaobo, Z. Simultaneous quantitation of free fatty acid in rice by synergetic data fusion of colorimetric sensor arrays, NIR, and MIR spectroscopy. Spectrochim. Acta Part A Mol. Biomol. Spectrosc. 2023, 292, 122359. [Google Scholar] [CrossRef] [PubMed]
  19. Jiang, H.; Liu, T.; Chen, Q. Dynamic monitoring of fatty acid value in rice storage based on a portable near-infrared spectroscopy system. Spectrochim. Acta Part A Mol. Biomol. Spectrosc. 2020, 240, 118620. [Google Scholar] [CrossRef] [PubMed]
  20. He, X.; Zhao, T.; Shen, F.; Liu, Q.; Fang, Y.; Hu, Q. Online detection of naturally DON contaminated wheat grains from China using Vis-NIR spectroscopy and computer vision. Biosyst. Eng. 2021, 201, 1–10. [Google Scholar] [CrossRef]
  21. Hu, L.; Yin, C.; Ma, S.; Liu, Z. Rapid detection of three quality parameters and classification of wine based on Vis-NIR spectroscopy with wavelength selection by ACO and CARS algorithms. Spectrochim. Acta Part A Mol. Biomol. Spectrosc. 2018, 205, 574–581. [Google Scholar] [CrossRef] [PubMed]
  22. Yang, D.; Yuan, J.; Chang, Q.; Zhao, H.; Cao, Y. Early determination of mildew status in storage maize kernels using hyperspectral imaging combined with the stacked sparse auto-encoder algorithm. Infrared Phys. Technol. 2020, 109, 103412. [Google Scholar] [CrossRef]
  23. Liu, Y.; Yang, J.; Chen, Y.; Tan, K.; Wang, L.; Yan, X. Stability analysis of hyperspectral band selection algorithms based on neighborhood rough set theory for classification. Chemom. Intell. Lab. Syst. 2017, 169, 35–44. [Google Scholar] [CrossRef]
  24. Zhang, X.; Mei, C.; Chen, D.; Li, J. Feature selection in mixed data: A method using a novel fuzzy rough set-based information entropy. Pattern Recognit. 2016, 56, 1–15. [Google Scholar] [CrossRef]
  25. Liu, Y.; Xie, H.; Chen, Y.; Tan, K.; Wang, L.; Xie, W. Neighborhood mutual information and its application on hyperspectral band selection for classification. Chemom. Intell. Lab. Syst. 2016, 157, 140–151. [Google Scholar] [CrossRef]
  26. Zhu, Q.; Huang, M.; Zhao, G. Apple Mealiness Detection Based on Neighborhood Rough Set and Hypersepctral Scattering Image. Trans. Chin. Soc. Agric. Mach. 2011, 42, 154–157. [Google Scholar]
  27. Dong, Y.; Xiang, B.; Geng, Y.; Yuan, W. Rough set based wavelength selection in near-infrared spectral analysis. Chemom. Intell. Lab. Syst. 2013, 126, 21–29. [Google Scholar] [CrossRef]
  28. Liu, Y.; Cao, X.; Meng, X.; Wu, T.; Yan, X.; Luo, Q. Impact of class noise on performance of hyperspectral band selection based on neighborhood rough set theory. Chemom. Intell. Lab. Syst. 2019, 188, 37–45. [Google Scholar] [CrossRef]
  29. An, A.; Shan, N.; Chan, C.; Cercone, N.; Ziarko, W. Discovering rules for water demand prediction: An enhanced rough-set approach. Eng. Appl. Artif. Intell. 1996, 9, 645–653. [Google Scholar] [CrossRef]
  30. Yang, X.; Chen, H.; Li, T.; Wan, J.; Sang, B. Neighborhood rough sets with distance metric learning for feature selection. Knowl.-Based Syst. 2021, 224, 107076. [Google Scholar] [CrossRef]
  31. Li, J.; Zhang, H.; Zhan, B.; Zhang, Y.; Li, R.; Li, J. Nondestructive firmness measurement of the multiple cultivars of pears by Vis-NIR spectroscopy coupled with multivariate calibration analysis and MC-UVE-SPA method. Infrared Phys. Technol. 2020, 104, 103154. [Google Scholar] [CrossRef]
  32. Yun, Y.-H.; Wang, W.-T.; Deng, B.-C.; Lai, G.-B.; Liu, X.-b.; Ren, D.-B.; Liang, Y.-Z.; Fan, W.; Xu, Q.-S. Using variable combination population analysis for variable selection in multivariate calibration. Anal. Chim. Acta 2015, 862, 14–23. [Google Scholar] [CrossRef] [PubMed]
  33. Breiman, L. Bagging Predictors. Mach. Learn. 1996, 24, 123–140. [Google Scholar] [CrossRef]
  34. Breiman, L. Random Forests. Mach. Learn. 2001, 45, 5–32. [Google Scholar] [CrossRef]
  35. Huang, G.B.; Zhou, H.; Ding, X.; Zhang, R. Extreme Learning Machine for Regression and Multiclass Classification. IEEE Trans. Syst. Man Cybern. Part B 2012, 42, 513–529. [Google Scholar] [CrossRef] [PubMed]
  36. De Braekeleer, K.; De Maesschalck, R.; Hailey, P.A.; Sharp, D.C.A.; Massart, D.L. On-line application of the orthogonal projection approach (OPA) and the soft independent modelling of class analogy approach (SIMCA) for the detection of the end point of a polymorph conversion reaction by near infrared spectroscopy (NIR). Chemom. Intell. Lab. Syst. 1999, 46, 103–116. [Google Scholar] [CrossRef]
  37. Parikh, R.; Mathai, A.; Parikh, S.; Sekhar, G.C.; Thomas, R. Understanding and using sensitivity, specificity and predictive values. Indian J. Ophthalmol. 2008, 56, 45–50. [Google Scholar] [CrossRef] [PubMed]
  38. Wu, N.; Jiang, H.; Bao, Y.; Zhang, C.; Zhang, J.; Song, W.; Zhao, Y.; Mi, C.; He, Y.; Liu, F. Practicability investigation of using near-infrared hyperspectral imaging to detect rice kernels infected with rice false smut in different conditions. Sens. Actuators B Chem. 2020, 308, 127696. [Google Scholar] [CrossRef]
  39. Miao, X.; Miao, Y.; Gong, H.; Tao, S.; Chen, Z.; Wang, J.; Chen, Y.; Chen, Y. NIR spectroscopy coupled with chemometric algorithms for the prediction of cadmium content in rice samples. Spectrochim. Acta Part A Mol. Biomol. Spectrosc. 2021, 257, 119700. [Google Scholar] [CrossRef]
Figure 1. Flow chart of spectral data collection of paddy samples.
Applsci 13 11357 g001
Figure 2. Frequency plot of paddy samples in calibration and test set.
Applsci 13 11357 g002
Figure 3. Spectral curves of paddy samples for different storage statuses.
Applsci 13 11357 g003
Figure 4. Selection of optimal wavelengths by NRS-a.
Applsci 13 11357 g004
Figure 5. Selection of optimal wavelengths by NRS-b.
Applsci 13 11357 g005
Figure 6. The optimal wavelengths and probabilities by SPA.
Applsci 13 11357 g006
Figure 7. The optimal wavelengths and probabilities by VCPA.
Applsci 13 11357 g007
Figure 8. The confusion matrix of classification results of paddy storage status by NRS with different classifiers. (a) Calibration set; (b) Test set.
Applsci 13 11357 g008
Figure 9. The confusion matrix of classification results of paddy storage status by SPA and VCPA with different classifiers. (a) Calibration set; (b) Test set.
Applsci 13 11357 g009
Table 1. Measured values of fatty acid in paddy based on the calibration and test sets.
ParametersCalibration Set
(n = 190)
Test Set
(n = 95)
Mean 24.1522.47
Variance10.679.27
Maximum67.9060.21
Minimum12.1112.98
Range12.11~67.9012.98~60.21
Table 2. Selection results of optimal wavelengths by NRS-a and NRS-b.
βδNumbersOptimal Wavelengths/nm
0.750.05161043, 1057, 1106, 1204, 1206
1298, 1343, 1354, 1450, 1454, 1592
1651, 1654, 1676, 1690, 1771
0.10131057, 1140, 1204, 1206
1298, 1332, 1354, 1450, 1555
1620, 1650, 1752, 1762
0.15121057, 1123, 1204
1245, 1298, 1306, 1354, 1450
1458, 1476, 1651, 1762
0.20101057, 1116, 1204
1210, 1282, 1354, 1450
1454, 1651, 1762
0.850.05121086, 1122, 1148, 1227, 1282
1400, 1530, 1608, 1689, 1719, 1739, 1762
0.10101055, 1148, 1234, 1276, 1400
1567, 1616, 1682, 1754, 1786
0.1581062, 1148, 1234, 1354
1576, 1698, 1754, 1778
0.2061086, 1234, 1562
1650, 1712, 1721
Table 3. Classification accuracy of paddy storage status by NRS with different classifiers.
Models Calibration SetTest Set
CCR (%)CCR (%)
NRS-a-RF96.3193.68
NRS-b-RF94.2186.31
NRS-a-ELM93.6885.26
NRS-b-ELM91.5784.21
NRS-a-SIMCA88.9482.10
NRS-b-SIMCA86.3181.05
Table 4. Classification accuracy of paddy storage status by SPA and VCPA with different classifiers.
ModelsCalibration SetTest Set
CCR (%)CCR (%)
SPA-RF94.7386.31
VCPA-RF91.0583.15
SPA-ELM88.4280.0
VCPA-ELM84.7376.84
SPA-SIMCA82.6372.63
VCPA-SIMCA80.5270.52
Table 5. The results of sensitivity and specificity based on NRS-a-RF and SPA-RF models.
ModelsActual
Grade
Calibration SetTest Set
SensitivitySpecificitySensitivitySpecificity
NRS-a-RFGrade10.960.980.930.97
Grade20.960.960.930.93
Grade30.960.990.940.98
SPA-RFGrade10.950.990.870.93
Grade20.940.940.830.89
Grade30.920.980.880.95
Disclaimer/Publisher’s Note: The statements, opinions and data contained in all publications are solely those of the individual author(s) and contributor(s) and not of MDPI and/or the editor(s). MDPI and/or the editor(s) disclaim responsibility for any injury to people or property resulting from any ideas, methods, instructions or products referred to in the content.

