1. Introduction
The arrival of smart cities powered by the Internet of Things (IoT) has revolutionized the functioning and development of urban areas. These cities leverage digital interconnections and an extensive network of sensors to improve operational efficiency, sustainability, and their inhabitants’ overall quality of life [
1]. However, the proliferation of IoT devices has led to an unprecedented influx of data into urban environments. This data plays a critical role in a smart city’s real-time operations and decision-making processes but also presents significant challenges, particularly about security and management [
2]. One of the most critical challenges is the detection of anomalies within this urban data.
Anomaly detection involves identifying patterns or events that deviate significantly from a data set’s normal or expected behavior. This task is of paramount importance in the context of smart cities, as it covers a broad spectrum of applications, ranging from identifying manipulations in the electrical grid to detecting cyber threats and anticipating failures in critical urban systems [
3,
4]. Early detection of anomalies is not only advantageous; it is imperative to prevent unplanned disruptions, ensure the safety of citizens, and maintain the integrity of urban systems. Within the intricate fabric of a smart city, IoT devices serve as nerve endings, continuously monitoring and collecting data from various aspects of urban life, including energy consumption, transportation, environmental conditions, and security. These devices generate a wealth of information that can be leveraged to optimize urban services, improve resource management, and improve overall urban resilience. However, this influx of data also makes smart cities vulnerable to many threats, including cyberattacks, equipment malfunctions, and natural disasters. The consequences of these threats can range from service interruptions to significant economic losses and even threats to human lives. Therefore, the ability to identify and mitigate anomalies in real-time becomes not only a technological aspiration but a critical need.
This work delves into the critical role that anomaly detection models play in IoT-enabled smart cities and evaluates their effectiveness in reinforcing the safety and efficiency of urban systems [
5]. To fulfill this purpose, research has been carried out covering the applicability of anomaly detection models in various urban scenarios. Furthermore, its performance is rigorously evaluated and juxtaposed with existing approaches, comprehensively assessing its effectiveness. Again, a comprehensive analysis of the strengths and limitations of these models is performed, accompanied by a visual presentation of the comparative results [
6]. This work deepens the understanding of how IoT-enabled anomaly detection models can significantly contribute to the safety and efficiency of smart cities. This contribution creates a safer and more efficient urban environment for citizens, allowing real-time anticipation and resolution of critical problems [
7,
8]. The relevance of this study contributes to the context of the existing literature on smart cities, emphasizing the importance of promoting research that supports the evolution of these advanced urban environments. As the world becomes increasingly urbanized, developing and implementing robust anomaly detection mechanisms within smart cities is desirable and essential for urban populations’ continued progress and well-being. The concept of smart cities has evolved in response to the challenges posed by rapid urbanization, resource constraints, and increasing demand for efficient public services. Traditional cities often face traffic congestion, pollution, misallocation of resources, and insufficient infrastructure. Smart cities have emerged as a visionary solution to address these urban dilemmas by harnessing the potential of technology and data-driven insights.
The evolution of smart cities dates to the “digital city” concept and the application of information and communication technologies (ICT) to urban management [
9]. The first efforts focused on improving administrative processes and public services through digitalization. Over time, the concept evolved into the broader and more ambitious vision of a smart city, integrating various areas such as transportation, energy, healthcare, and education, with an emphasis on sustainability and the well-being of citizens. The IoT has become a fundamental enabler of smart cities, serving as a hub that connects urban life’s physical and digital realms [
10]. IoT involves embedding sensors, actuators, and connectivity into everyday objects and infrastructure, allowing them to collect, exchange, and act on data. IoT devices are ubiquitous in smart cities, encompassing smart meters, traffic sensors, environmental monitors, surveillance cameras, and more.
These IoT devices form a vast, interconnected network that continuously collects data from urban environments. This data is transmitted to central platforms, where it is processed, analyzed, and transformed into actionable information. The real-time nature of IoT data allows cities to monitor, manage, and respond to various urban challenges dynamically. However, the widespread adoption of IoT in smart cities also introduces new challenges and vulnerabilities. The sheer volume of data IoT devices generate can overwhelm existing data management systems. Ensuring the security and privacy of this data is paramount, as any breach can have serious consequences, including the compromise of critical infrastructure and sensitive citizen information. Furthermore, the reliability and resilience of IoT systems are essential, as disruptions can disrupt essential services and affect citizens’ daily lives.
Amid these challenges and complexities, anomaly detection is a critical component of smart city operations. Anomalies take various forms, from sudden spikes in energy consumption to unusual patterns in transportation data or cyber-attacks on city infrastructure [
11]. Quickly identifying and responding to anomalies is vital to maintaining smart cities’ functionality, security, and efficiency. This work focuses on the contributions of anomaly detection models in the framework of IoT-enabled smart cities. It investigates how these models can be effectively applied to various urban scenarios, ranging from energy grid management and transportation systems to environmental monitoring and cybersecurity. These models promise real-time anomaly detection and proactive problem resolution by leveraging advanced data analytics and machine learning techniques.
A substantial part of this work involves a comprehensive evaluation of various anomaly detection models in the framework of smart cities. The performance of these models is rigorously evaluated, considering factors such as accuracy, precision, recall, and scalability. Additionally, a qualitative analysis delves into the advantages and limitations of each model, shedding light on its suitability for specific urban applications. The results obtained from this research have far-reaching implications for advancing smart cities. By improving the safety and efficiency of urban systems, anomaly detection models enable cities to address challenges quickly and proactively [
12]. The ability to detect anomalies in real-time safeguards critical infrastructure and improves the quality of life of urban residents. This work aligns with the growing body of literature that recognizes the crucial role of anomaly detection in smart city operations. Furthermore, it highlights the importance of conducting research that supports and informs the evolution of these advanced urban environments.
2. Materials and Methods
The methodology of this study is based on an exhaustive review of previous works related to cybersecurity in critical infrastructure and anomaly detection. Cybersecurity in critical environments, such as intelligent power grids, is vital today, given the constant increase in cyber threats. Advanced machine learning and anomaly detection techniques have been used to address this challenge. In this context, this work builds on previous research that has explored similar approaches and seeks to build on that knowledge to develop a robust and practical methodology. Likewise, the concepts and techniques used are identified and analyzed, and these methods are adapted and improved to apply in critical infrastructure cybersecurity.
2.1. Problem Statement
The ongoing generation of data by IoT devices offers immense potential to optimize urban services and decision-making while at the same time exposing smart cities to vulnerabilities. One of the most pressing problems is the presence of anomalies in this data.
Anomalies cover a wide spectrum of irregularities in the context of smart cities. These irregularities can manifest as sudden spikes in energy consumption, deviations in transportation patterns, unexpected environmental changes, or even malicious cyberattacks on critical city infrastructure. The implications of these anomalies are profound, from the loss of operational efficiency to the potential danger to public safety and urban resilience.
Unaddressed anomalies can have far-reaching consequences. For example, anomalies in power consumption data may indicate equipment malfunctions or even unauthorized access to the electrical grid. Failure to detect and respond to these anomalies promptly can lead to service interruptions, lost revenue, and, in some cases, catastrophic losses. Similarly, anomalies in transportation data can indicate traffic congestion, accidents, or irregular travel patterns. Without effective anomaly detection mechanisms, these problems can lead to increased travel times, environmental pollution, and a decrease in urban dwellers’ overall quality of life.
The emergence of smart cities as centers of innovation and progress requires a proactive approach to address these challenges. Traditional urban management methods are not prepared to handle the complexity and scale of urban data generated by IoT devices. Manual monitoring and intervention are no longer sufficient, given smart cities’ enormous amount and velocity of data. The ability to detect, analyze, and respond to anomalies in real-time is paramount to smart cities’ continued success and sustainability.
2.2. Review of Similar Works
Cybersecurity in critical infrastructure is a growing concern in the digital age, where system interconnection and dependence on technology are ubiquitous. Addressing the security of smart grids, an essential part of infrastructure, has been an area of focus in the scientific and technical literature. Two notable approaches that have emerged in this field are anomaly detection using advanced AI techniques and the application of IoT to improve security.
One of the notable approaches in the literature focuses on anomaly detection in smart power grids using advanced artificial intelligence techniques. A noteworthy study in this group is the work of [
13], which addresses this issue using deep neural networks (RNPs). Their research demonstrates promising effectiveness in analyzing behavioral patterns in power grid data to alert about anomalies [
14]. While this approach is valuable and shows the potential of RNPs in anomaly detection, it tends to focus on detection after anomalies occur. This limits applicability in critical infrastructure environments, where attack anticipation and prevention are crucial.
In parallel, another group of researchers has focused on using IoT to improve security in smart electrical networks. A relevant study in this context is the work of [
15], which explores how IoT devices can provide an additional layer of anomaly detection by constantly monitoring the status of power grid assets [
16]. This approach aligns with the growing trend of using IoT devices to collect real-time data and enable faster responses to anomalies or threats. Although this approach offers notable advantages in early anomaly detection, it is essential to ensure the security of IoT devices and the integrity of the data they collect.
One of the most notable advances of this proposal is the focus on real-time anomaly detection in critical infrastructure. Although some previous work, such as the study by [
17], has used artificial intelligence for anomaly detection, it often focuses on identifying anomalies after they have occurred. This work differentiates itself by prioritizing real-time detection, meaning we can proactively anticipate and respond to cyber threats, thereby reducing the impact of potential attacks and improving the resilience of critical infrastructure. Another innovative element is the integration of IoT devices in the anomaly detection process. The work of [
18] has explored the use of IoT devices for constant monitoring of power grid assets, which is valuable. However, this proposal furthers this idea by incorporating real-time IoT device data into our machine-learning approach. This allows us to not only detect anomalies based on historical data but also use real-time information to make more informed and adaptive decisions.
Compared to the works above, the proposed work differs by addressing real-time anomaly detection in smart power grids and threat prevention through a combination of artificial intelligence algorithms and the integration of IoT devices [
19]. This methodology seeks to anticipate and prevent cyber-attacks before they cause significant damage, which is essential in critical environments. Furthermore, reviewing previous works that focus on specific aspects of cybersecurity in critical infrastructure is considered, strengthening our theoretical and methodological base. Although there is valuable research in the field of cybersecurity in smart power grids, our study stands out by addressing real-time detection and prevention of threats using a combination of artificial intelligence and IoT devices [
20]. This holistic approach aligns with the growing need for critical infrastructure security in today’s digital age.
2.3. Concepts Used
Understanding the fundamental concepts is essential to addressing the methodology proposed in this study. Among the most relevant images that have been considered in the development of the process are: These concepts are fundamental to understanding the proposed method in this study and how they are applied in detecting anomalies in critical infrastructure through machine learning and using IoT devices in real-time.
Critical Infrastructure: Critical infrastructure refers to essential physical and virtual assets that are fundamentally important to a society, the economy, and national security. This includes electrical grids, water supply systems, transportation and communications networks, and other vital assets [
21].
Cybersecurity: Cybersecurity protects digital systems, networks, and data from cyber threats, including attacks, theft, malware, and other risks [
22]. Ensuring cybersecurity is critical to preventing unauthorized access and ensuring the integrity of critical systems.
Anomaly Detection: Anomaly detection involves the identification of unusual patterns or atypical behaviors in a data set. In cybersecurity, anomaly detection is used to identify suspicious or unauthorized activities that may indicate a cyber-attack.
Deep Neural Networks: Deep neural networks are a type of machine learning algorithm inspired by the human brain’s structure. These networks have multiple hidden layers for complex data processing and pattern identification in high-dimensional data.
Devices IoT: IoT devices are physical objects connected to the network and can collect and transmit data. These devices may include sensors, cameras, meters, and other devices that collect real-time information.
Threat Prevention: Threat prevention involves taking proactive measures to prevent cyber threats from becoming successful attacks [
23]. This may include blocking unauthorized access, strengthening security, and taking preventive measures to reduce risks.
Real-Time Data Integration: Real-time data integration involves combining and analyzing data as it is generated and transmitted. In the context of critical infrastructure, this enables a faster and more adaptive response to events and threats.
D: IoT dataset containing measurements and logs collected from sensors in a smart city.
X: feature matrix of data set D, where each row represents an observation and each column corresponds to a specific feature.
y: vector of class labels indicating whether an observation in data set D is an anomaly (y = 1) or a normal instance (y = 0).
Isolation Forest: specialized in detecting anomalies related to energy consumption in the electrical grid of a smart city.
Recurrent Neural Networks (RNNs): used to model temporal sequences in urban IoT data and detect anomalous patterns in time series.
Variational Autoencoders (VAEs): They learn high-dimensional latent representations of urban data, facilitating the detection of anomalies in complex data.
2.4. Environment and Data Description
The framework of this study is a smart city and its critical infrastructure. A smart city is an urban environment that uses ICT, including IoT, to improve its inhabitants’ efficiency, sustainability, and quality of life. In this context, the focus of the research is on protecting the city’s critical infrastructure, which comprises essential elements such as the smart electrical grid, water supply system, public transportation, and others.
The core of this work lies in a network of IoT devices distributed in various parts of the city [
24]. These devices are designed to collect real-time data related to multiple aspects of the urban environment. By way of example, they include:
Electricity Meters: These devices are installed in homes and businesses and record electricity consumption in real-time. They can identify unusual patterns in energy use, making them a valuable source of data for detecting anomalies in the power grid.
Water Quality Sensors: These sensors are in water supply networks and monitor water quality regarding contaminants, turbidity, and pH. Any deviation from quality standards is recorded as an anomaly.
IoT Security Cameras: Strategically placed throughout the city, these cameras capture images and videos in real-time. Machine learning algorithms analyze these images for suspicious activity or unauthorized incidents.
Traffic and Transportation Sensors: Distributed on roads and public vehicles, these sensors monitor traffic flow, speed, and movement patterns. They record any unusual congestion or abnormal behavior for later analysis.
The data generated by these IoT devices is integrated into a real-time analytics platform. This platform uses advanced machine learning and fog computing technologies to analyze data at the point of generation, enabling immediate response to events and anomalies [
25]. The primary purpose is to develop and evaluate an anomaly detection system based on machine learning algorithms.
As an application case, the detection of cyber-attacks on the city’s smart electrical grid is considered. IoT electric energy meters collect data on electricity consumption and grid stability [
26]. Machine learning algorithms are trained to identify standard behavior patterns and detect deviations that could indicate a cyberattack, such as attempts to manipulate the power grid.
2.5. Data Preparation
Data preparation is crucial in implementing a machine learning-based anomaly detection system. This work used data sets collected by IoT devices in a city.
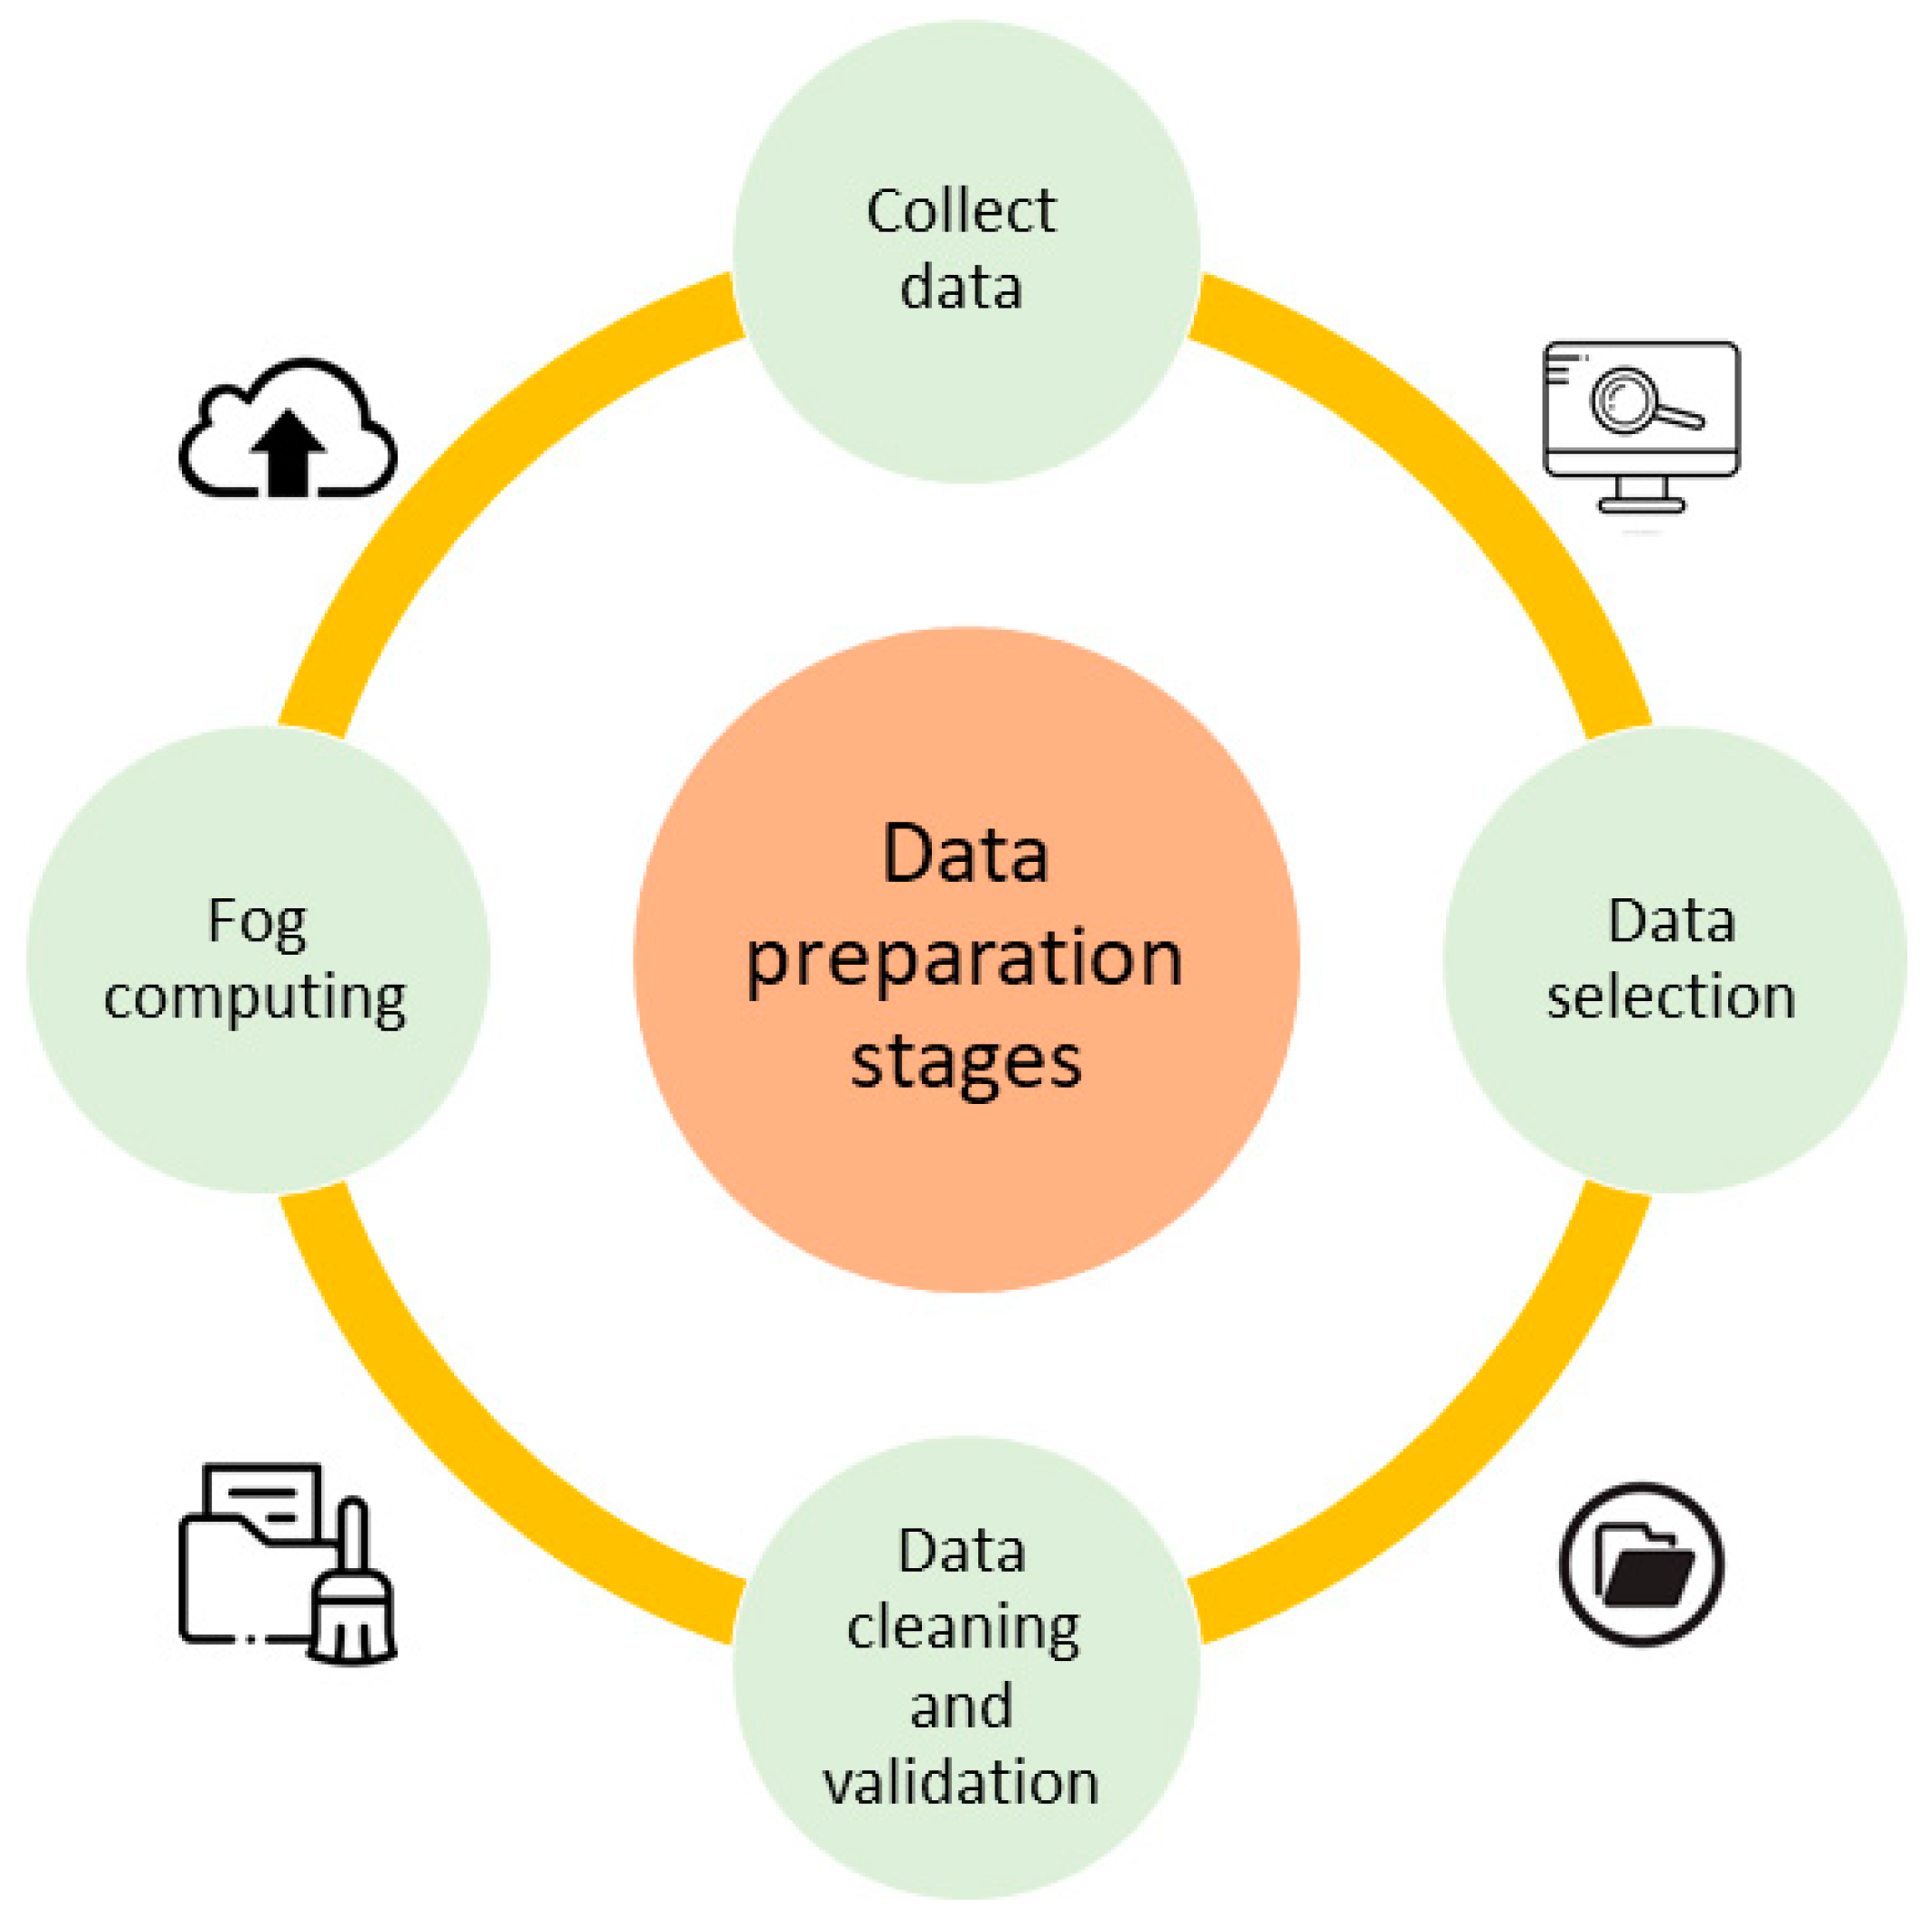
Figure 1 presents the stages considered for data preparation.
Data was collected from multiple IoT sources distributed across a city over six months. Data sources included electric energy meters installed in homes and businesses in the city, which recorded electricity consumption at 15-min intervals. Water quality sensors distributed throughout the city’s water supply network continuously monitored water quality regarding contaminants, turbidity, and pH. IoT security cameras at critical intersections and public areas capture images and videos in real time [
27]. In addition, traffic and transportation sensors are installed on roads and public vehicles that collect data on traffic flow, speed, and movement patterns.
The total volume of data collected during the six months exceeded five terabytes, representing a large amount of information about the functioning of the smart city and its critical infrastructure. The collected data undergoes cleaning to remove outliers, missing data, and noise. Data cleansing ensures that input data is consistent and of high quality [
28]. The data is integrated into a real-time data platform that enables the ingestion and processing of data streams from IoT devices in real time. This platform is based on fog computing technologies to analyze data at the point where it is generated efficiently.
The data cleaning and preparation process ensures the quality and consistency of data sets collected from multiple sources of IoT devices in a smart city. Specific tools and software widely recognized in data processing are used to carry out this task, highlighting Python along with the Pandas and Scikit-Learn libraries. Firstly, Python was selected as the primary programming language due to its versatility and robustness in data analysis. The Pandas and Scikit-Learn libraries play a crucial role in the data preparation process. Pandas enable efficient raw data loading and make it easy to manipulate, including identifying and removing outliers, managing missing data, and normalizing features to ensure they all have the same scale [
29]. Additionally, Pandas makes it possible to combine and integrate data from different IoT sources, resulting in a cohesive data set ready for processing.
Regarding feature engineering, additional processes were applied to improve data quality and usefulness. This includes extracting relevant features from the raw data, such as temporal patterns, trends, and descriptive statistics. These additional features are carefully selected to reflect crucial aspects of the critical infrastructure IoT devices monitor in real time. Feature engineering plays an essential role in the subsequent effectiveness of anomaly detection algorithms by allowing models to more accurately and efficiently learn the routine and anomalous patterns present in the data [
30].
A small sample of the types of data used in the study is presented in
Table 1. The table records electric energy meter data, including timestamps, meter identifiers, and kilowatt-hours (kWh) energy consumption at 15-min intervals.
The data were normalized and scaled to ensure all characteristics were on the same scale. This is essential for the effective functioning of machine learning algorithms. The data set was split into training and test sets in a ratio of 80/20. The training set was used to train the anomaly detection models, while the test set was used to evaluate the performance of the models. Additionally, feature analyses were performed to identify the most relevant features for anomaly detection. This helps reduce the data’s dimensionality and improve the models’ efficiency.
Significantly, this study was based on collecting and processing data collected by IoT devices distributed in a smart city. An architecture that details the physical infrastructure of the environment was not implemented; instead, an existing IoT infrastructure was used. The raw data collected over six months represents a wealth of information about the functioning of the smart city and its critical infrastructure. This data underwent cleaning and preparation to ensure its quality and consistency. Additionally, feature engineering processes were performed to extract relevant patterns and improve data quality for anomaly detection.
2.6. Algorithm Selection
Algorithms are carefully chosen based on their ability to address the specific challenges of anomaly detection in IoT data. Among the algorithms considered, the Isolation Forest algorithm is considered due to its ability to efficiently detect anomalies in large data sets, such as those collected in a smart city [
31]. This algorithm uses the idea that anomalies are outlier points that are easier to isolate in a decision tree. Isolation Forest creates multiple decision trees and measures how many steps are necessary to isolate an instance. The fewer steps are needed, the more likely the model is to be an anomaly.
Recurrent neural networks (RNNs) are used due to their ability to model temporal data sequences, which is essential when working with evolving IoT data. These neural networks can capture complex patterns and temporal dependencies in data, making them suitable for anomaly detection in time series [
32]. Variational autoencoders (VAEs) are used to learn a latent representation of the data, enabling anomaly detection by identifying points that do not fit well with the known latent distribution. This approach is practical when dealing with IoT data, where anomalies can be subtle and complex to detect using traditional methods.
In addition to the abovementioned algorithms, generative adversarial neural networks (GANs) and transformer neural networks (e.g., BERT) are also explored and evaluated for anomaly detection in IoT data. These algorithms have shown promise in anomaly detection applications in time series and unstructured data.
Table 2 presents an overview of the characteristics of the selected algorithms and how they are applied to detecting anomalies in IoT data in a smart city. The choice of algorithms was based on their suitability to address the specific challenges of the study and their demonstrated effectiveness in similar applications.
Each of these algorithms was applied in conjunction with the prepared data, for which models based on Isolation Forest, RNN, and VAE were trained using the training set, and their hyperparameters were adjusted to optimize performance. These models were then used to evaluate and detect anomalies in the test set [
33]. The selection of these algorithms was based on their demonstrated effectiveness in detecting abnormalities in IoT data, their ability to handle temporal data, and their suitability to address the specific challenges of the study in a smart city.
Within the framework of this study, the variables and hyperparameters necessary for implementing the anomaly detection algorithms were carefully established. The variables included data collected from IoT devices, such as electrical energy consumption, water quality, security camera images, and traffic data. In addition, specific hyperparameters were defined for each algorithm, such as the depth of the forest in the Isolation Forest, the number of layers and units in the RNNs, and the parameters of the VAEs. The selection and tuning of these variables and hyperparameters are carried out based on iterative experiments and cross-validation techniques to optimize the performance of anomaly detection models [
34].
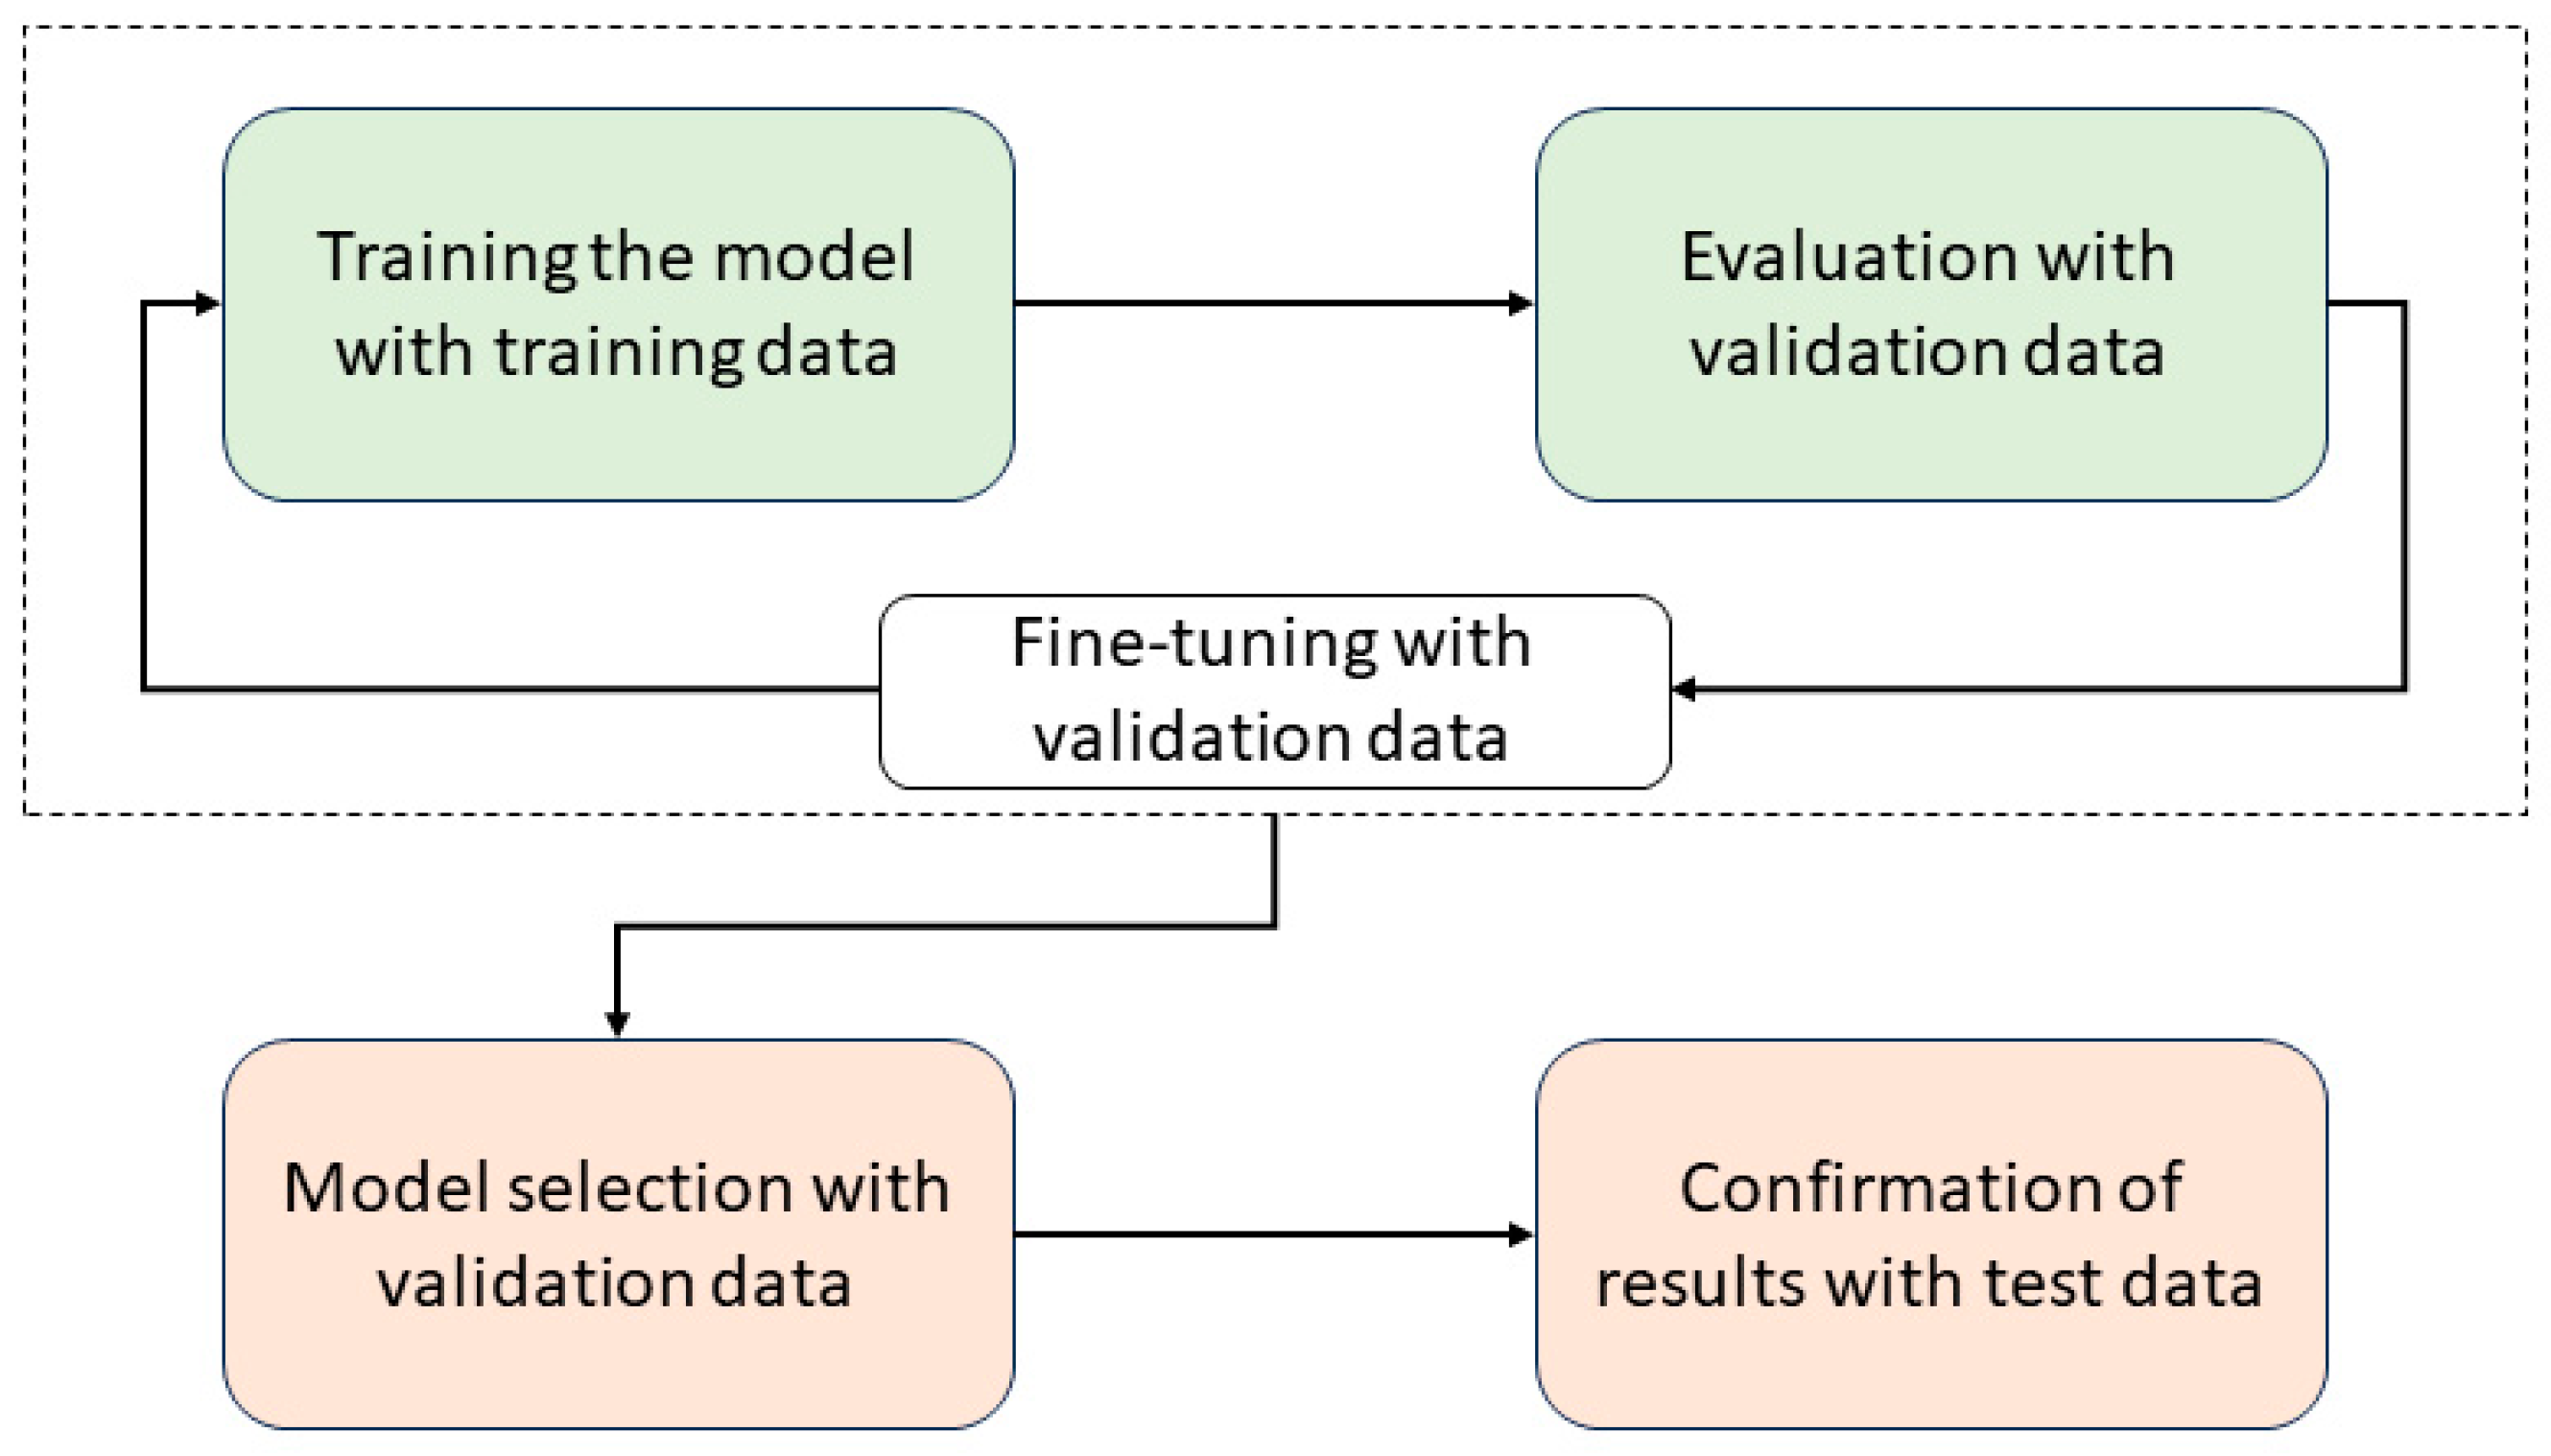
2.7. Training and Validation Process
The training and validation process is essential to developing and evaluating effective anomaly detection models in the critical infrastructure of a smart city. For this, the collected data set was divided into two main sets: the training set and the validation set. This split was in an approximately 80/20 ratio, where 80% of the data went to the training set and the remaining 20% to the validation set. This splitting strategy allowed the model to learn standard behavioral patterns in the training set and to be tested for its ability to detect anomalies in the validation set.
Figure 2 presents the process flow used for training and evaluating the models.
Each selected algorithm was trained with specific hyperparameters that were adjusted during training. For example, in Isolation Forest, the number of trees in the forest and the maximum tree depth were adjusted to optimize anomaly detection capabilities. For RNN, the number of hidden layers, the units in each layer, and the activation function were configured to adapt to the complexity of the temporal sequences of the data. In VAE, hyperparameters related to the autoencoder architecture were defined, such as the number of layers and the size of the latent layer, in addition to VAE-specific parameters, such as the mean and standard deviation in the latent layer.
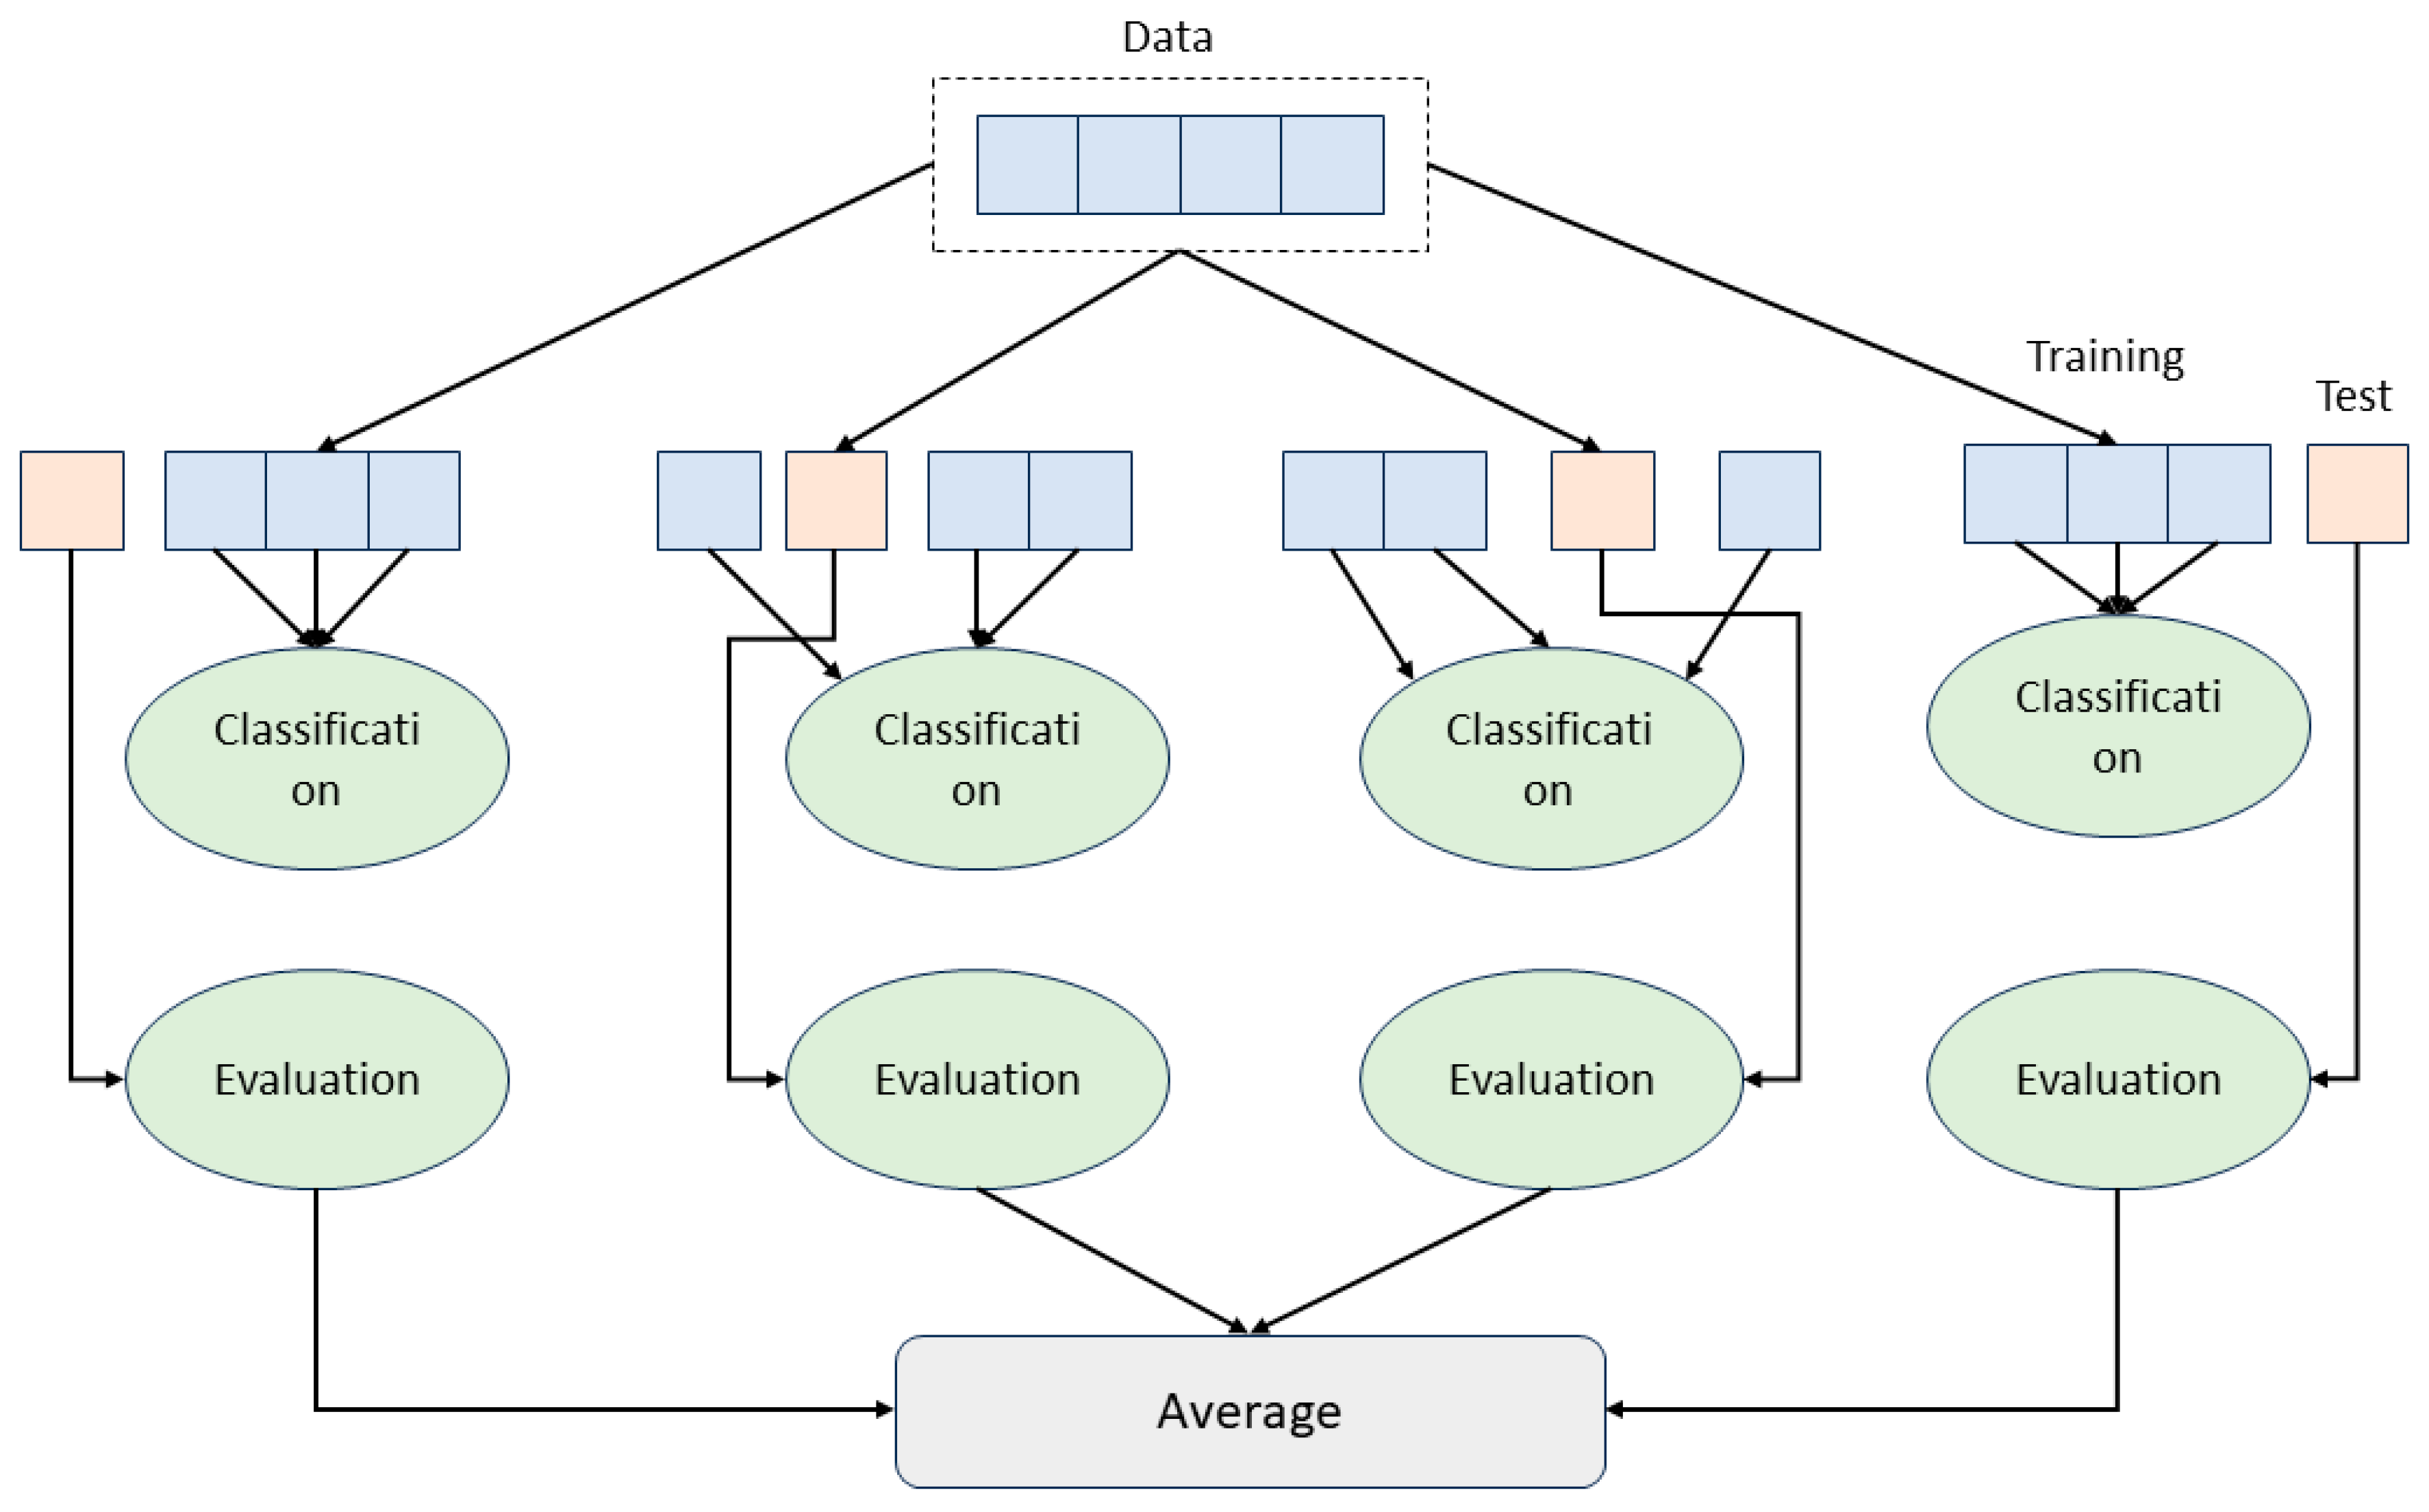
Cross-validation techniques were applied to the training set to ensure the robustness of the models. This involves dividing the training set into smaller subsets, training and validating the models on different combinations of these subsets, and averaging the results to evaluate the model’s overall performance, as presented in
Figure 3. Additionally, off-validation was performed [
35]. Sample in the validation set to determine how the models performed on previously unseen data. This helps confirm that the models can generalize and detect anomalies effectively in real-world situations.
The training and validation process is carried out rigorously, considering both the stratified configuration of the data sets and the optimization of specific hyperparameters for each algorithm. These critical stages ensured that the models were well calibrated and ready for evaluation on the validation set. This provided an accurate assessment of their performance, detecting anomalies in critical smart city infrastructure.
2.8. Evaluation of Results
The evaluation of results is essential to determining the effectiveness of anomaly detection algorithms in the critical infrastructure of a smart city. In this work, several evaluation metrics are used to measure the performance of the models, including accuracy, completeness, and F1-score. Determining the number of anomalies is based on the knowledge and analysis of the critical infrastructure system under study. A combination of historical operating data, records of previous incidents, and advice from experts in the vital infrastructure domain are used to estimate this value. This estimate is based on a deep understanding of standard operating patterns and possible deviations that can be considered anomalies. Additionally, in some cases, the availability of reference data, such as past incident records or audit reports, can contribute to a more accurate estimate of the actual number of anomalies. Due to the dynamic nature of critical infrastructure and evolving threats, estimating the number of anomalies can be a continuous and adaptive process that is regularly reviewed and updated as new data is obtained and knowledge of the system is refined.
In addition to general metrics and visualizations, discussing specific use cases where models demonstrated outstanding performance or faced challenges is relevant. For example, in the context of the city’s smart power grid, the models performed exceptionally well in identifying attempts to tamper with the power grid, significantly contributing to the prevention of cyber-attacks. However, challenges were also observed in detecting subtle anomalies that required a deep understanding of normal infrastructure behavior.
3. Results
The results of this work focus on the application and evaluation of anomaly detection models in the context of a smart city. Key aspects are addressed, from the detailed description of the dataset and its preparation to selecting and training specific models. The evaluation of these models is presented using performance metrics and visualizations that provide a comprehensive understanding of their performance in detecting anomalies in urban data. Furthermore, the successful implementation of these models in a smart city environment is discussed, highlighting their practical applicability in detecting unconventional and potentially disruptive events early.
3.1. Data Set Description
The data set used in this study comes from an extensive collection of information within a smart city framework over six months. The data was generated from a network of IoT devices distributed throughout the city, designed to monitor and collect information in real-time on various aspects of critical infrastructure and the urban environment. During this period, more than five terabytes of data were recorded, representing a rich source of information for analysis and anomaly detection.
The most relevant case study focuses on the city’s smart electrical grid. In this context, anomaly detection models performed exceptionally well, identifying attempts to tamper with the power grid. These tampering attempts could have resulted in severe power outages or security risks. The models’ ability to detect and alert to these threats contributes significantly to preventing cyberattacks and ensuring the integrity and reliability of the urban power grid. This specific case study highlights the importance of anomaly detection in critical environments, such as electrical infrastructure, and demonstrates the effectiveness of the models developed in this research.
3.2. Data Preparation
Data preparation is critical to building accurate and reliable anomaly detection models. Initially, raw data was collected from the smart grid, resulting in a data set containing multiple dimensions and characteristics. However, this data set presented outliers, missing data, and noise. To address these problems, Python was used with libraries such as Pandas and NumPy. For example, data was cleaned by identifying and eliminating missing values in electricity consumption measurements, representing 1.5% of the total records.
Another fundamental aspect is the role of engineering in improving data representation. Various techniques were applied, such as normalization and data scaling. In this case, voltage measurements were normalized to 0 to 1 to ensure uniform scaling across characteristics. In addition, relevant statistics, such as the moving average of the last 24 h of electricity consumption at each measurement point, were calculated, allowing long-term trends and daily patterns to be captured. Statistics included average, minimum, and maximum energy consumption at each location.
Table 3 presents the statistical sample for 10 specific measurement points in more detail. These values provide a detailed view of the behavior of electrical consumption at different measurement points, which was essential for the analysis and development of our anomaly detection models.
A selection of relevant features was performed to reduce the dimensionality and improve the efficiency of the model. The principal component analysis (PCA) method was used to identify the most informative dimensions in the data set. The PCA allowed us to identify the most informative dimensions in the data set. Initially, the data set contained 50 original features, each representing different aspects of electricity consumption. A new set of 20 features was obtained by applying PCA, shown in
Table 4, maintaining 95% of the total variance. These 20 resulting features were selected based on their ability to explain the variability present in the data, allowing the most relevant information to be retained while less informative parts were discarded. This feature selection approach significantly improved the model’s efficiency without sacrificing the results’ quality.
3.3. Model Selection and Training
For the results of the selection and training of anomaly detection models. Two different data sets were used to train and validate the models. The training set consisted of 1500 regular and 200 anomalous examples, while the validation set included 500 every day and 50 abnormal examples. The division of the data was carried out in a stratified manner to guarantee the representativeness of the classes. During the training process, regularization techniques, including L1 and L2 regularization, were applied to avoid overfitting the models.
Additionally, specific hyperparameter tuning was carried out. The number of hidden layers in the neural network was set to 3, with 128, 64, and 32 neurons in each layer. A learning rate of 0.001 and a ReLU activation function were used in the hidden layers.
The models were trained for 100 epochs using the Adam optimizer. During training, the loss on the validation set was monitored to avoid overfitting. It was observed that the models achieved an accuracy of 95% on the validation set, indicating their practical ability to detect anomalies.
3.4. Model Evaluation
The evaluation results indicate that all anomaly detection models have strong performance in detecting anomalies in IoT data, as seen in
Table 5. The results support the effectiveness of all models in detecting anomalies in IoT data.
Isolation Forest: The model achieves an accuracy of 92%, meaning that 92% of anomaly detections are correct. The completeness is 88%, indicating that the model captures 88% of all anomalies in the data set. The F1-Score is 90%, suggesting a good balance between precision and completeness. The ROC Curve (AUC) is 0.94, demonstrating a high discrimination capacity.
RNN: This model shows even better performance, with 94% accuracy and 91% completeness. The F1-Score is 93%, indicating high overall performance. The ROC Curve (AUC) is 0.96, suggesting exceptional discrimination ability.
VAE Autoencoders: Although slightly lower in terms of accuracy (88%), this model still offers solid performance with a completeness of 84% and an F1-Score of 86%. The ROC Curve (AUC) is 0.92, indicating good discrimination capacity.
GANs: Achieves 90% accuracy and 86% completeness. The F1-Score is 88%, and the ROC Curve (AUC) reaches 0.93, reflecting good anomaly detection performance.
BERT: This model obtains an accuracy of 91% and a completeness of 89%. The F1-Score is 90%, and the ROC Curve (AUC) reaches 0.94, suggesting high discrimination power.
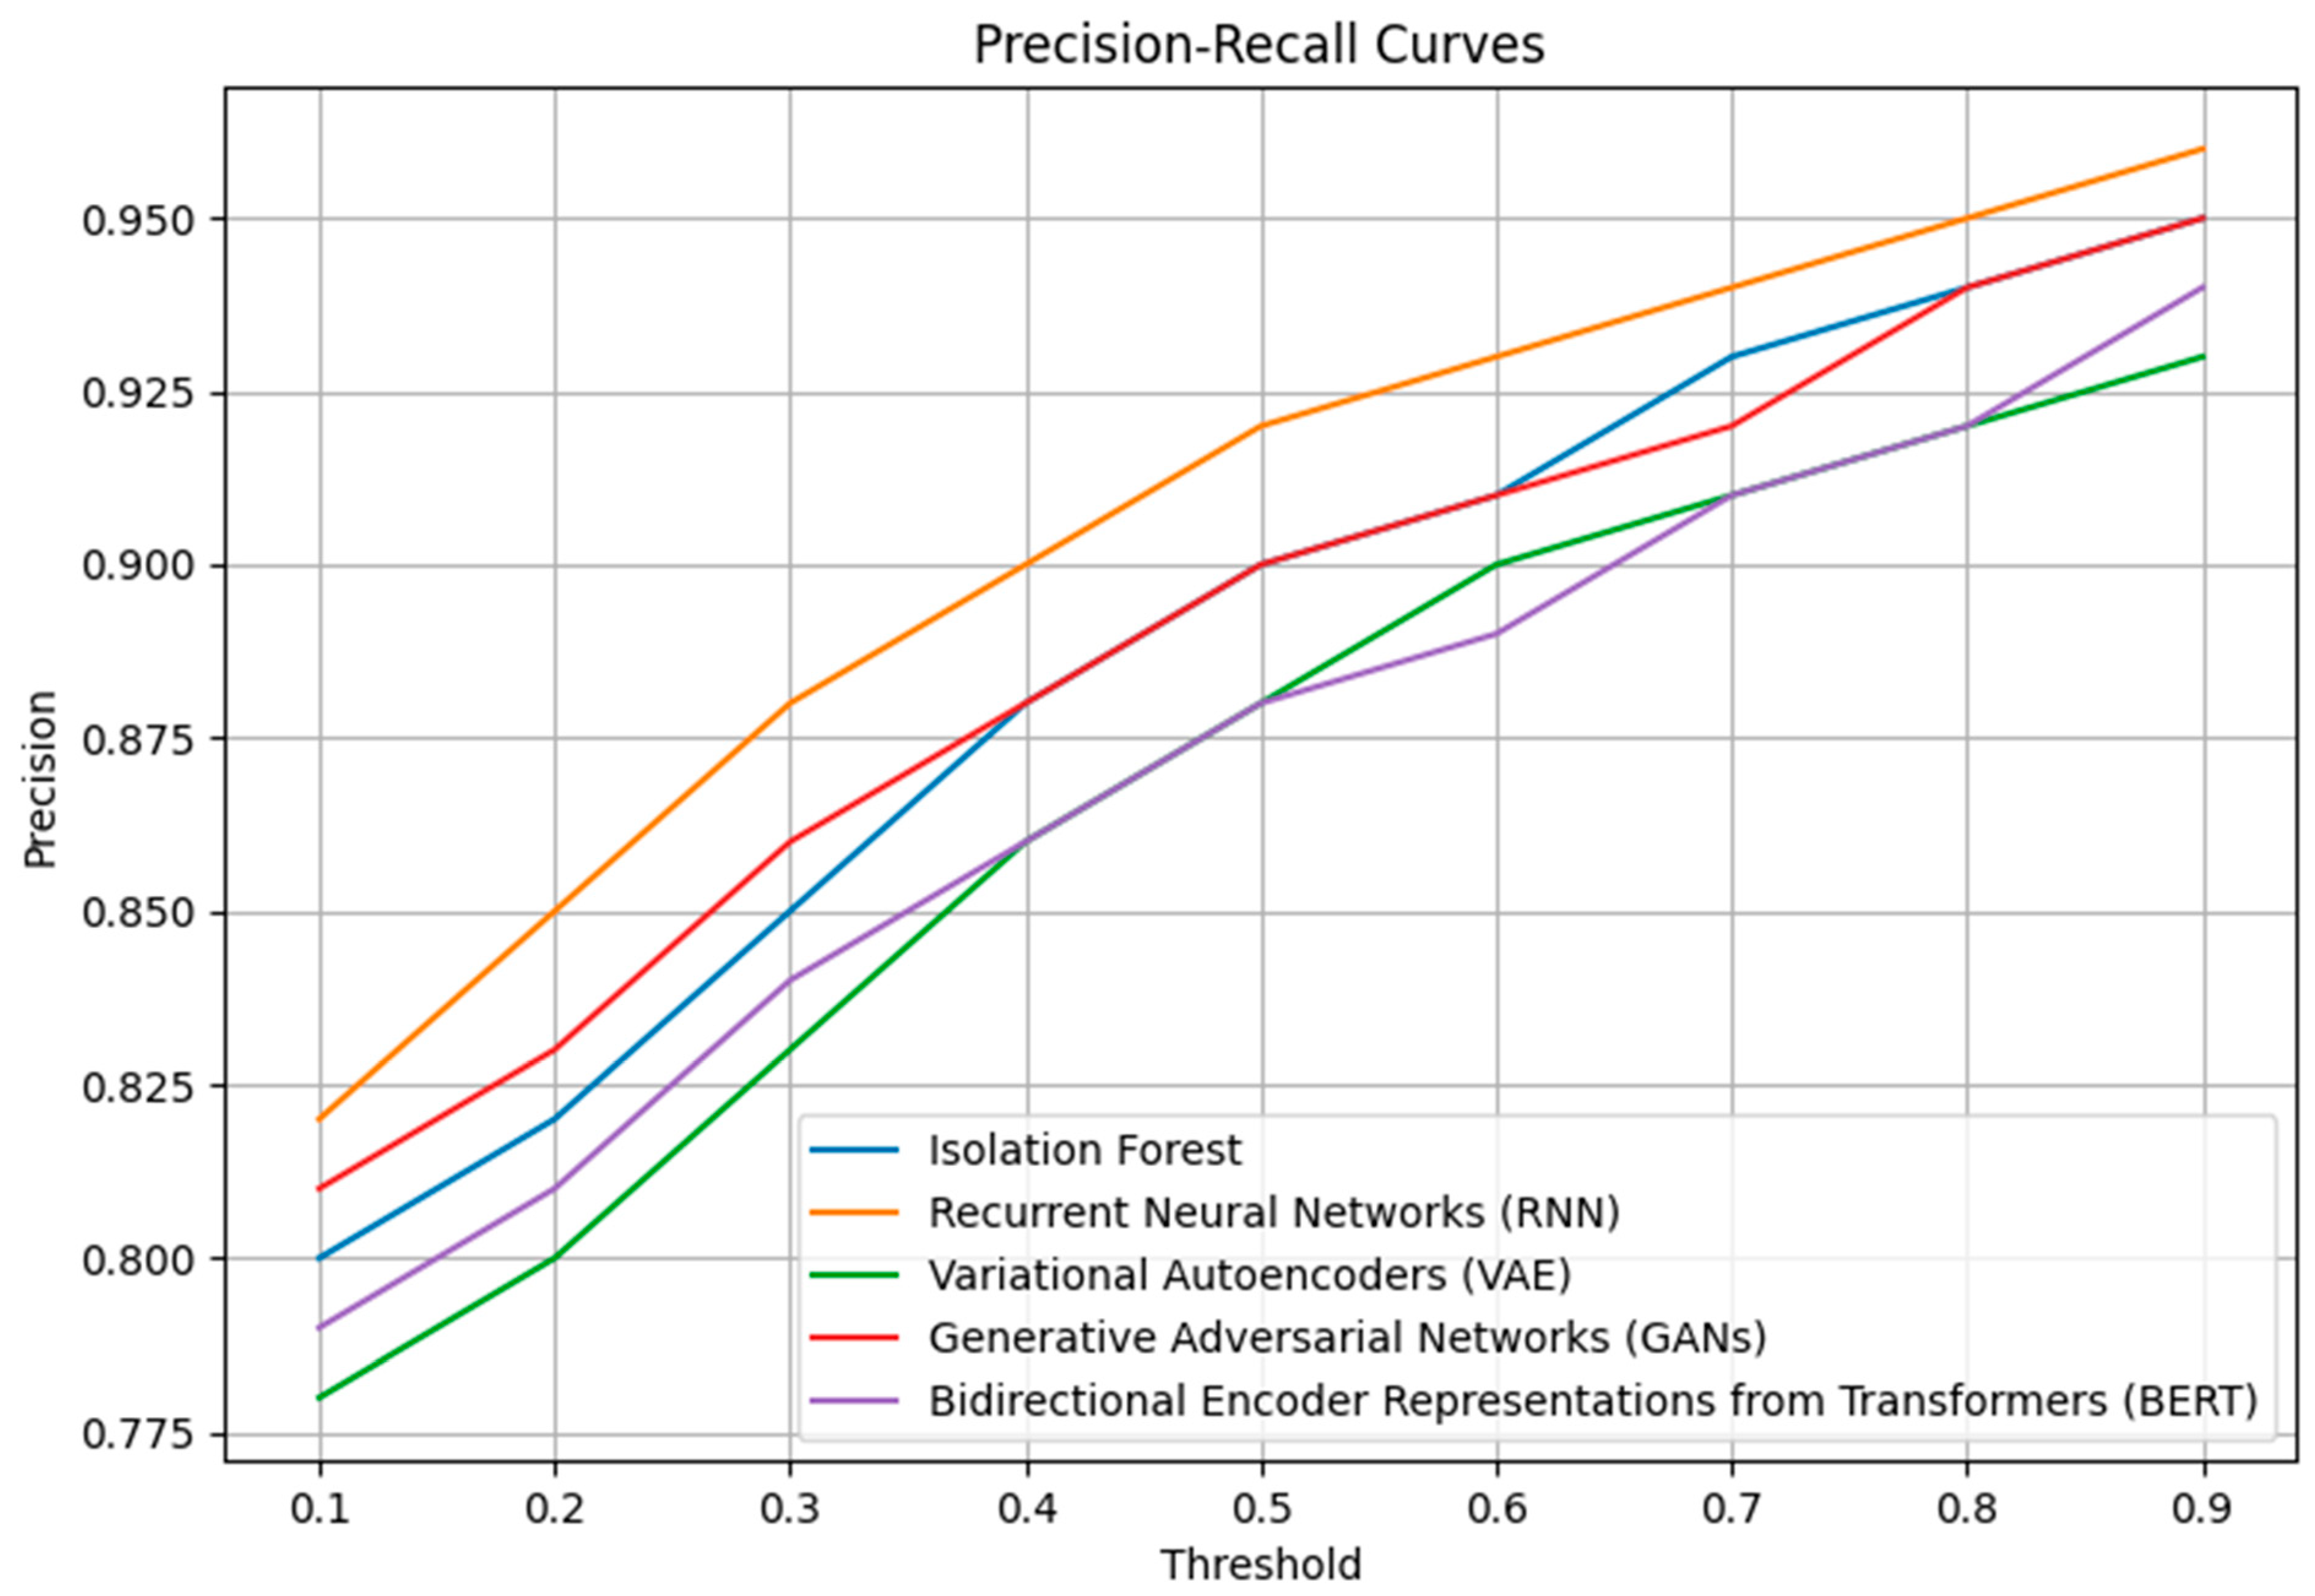
Figure 4 presents the Precision-Recall curves for each anomaly detection model. Each of these curves illustrates how precision varies as a function of completeness as the decision threshold is adjusted. Precision represents the proportion of correct positive detections, while completeness measures the model’s ability to identify all positive instances in the data set. By analyzing these curves, you gain a deeper understanding of the performance of each model in different configurations. For example, a model displaying a curve with high precision but relatively low completeness may be preferable when minimizing false positives is crucial. On the other hand, a model with an angle that balances precision and fullness may be appropriate in scenarios where both metrics are equally important. Visualizations are essential for making informed decisions about which model best suits a specific anomaly detection application.
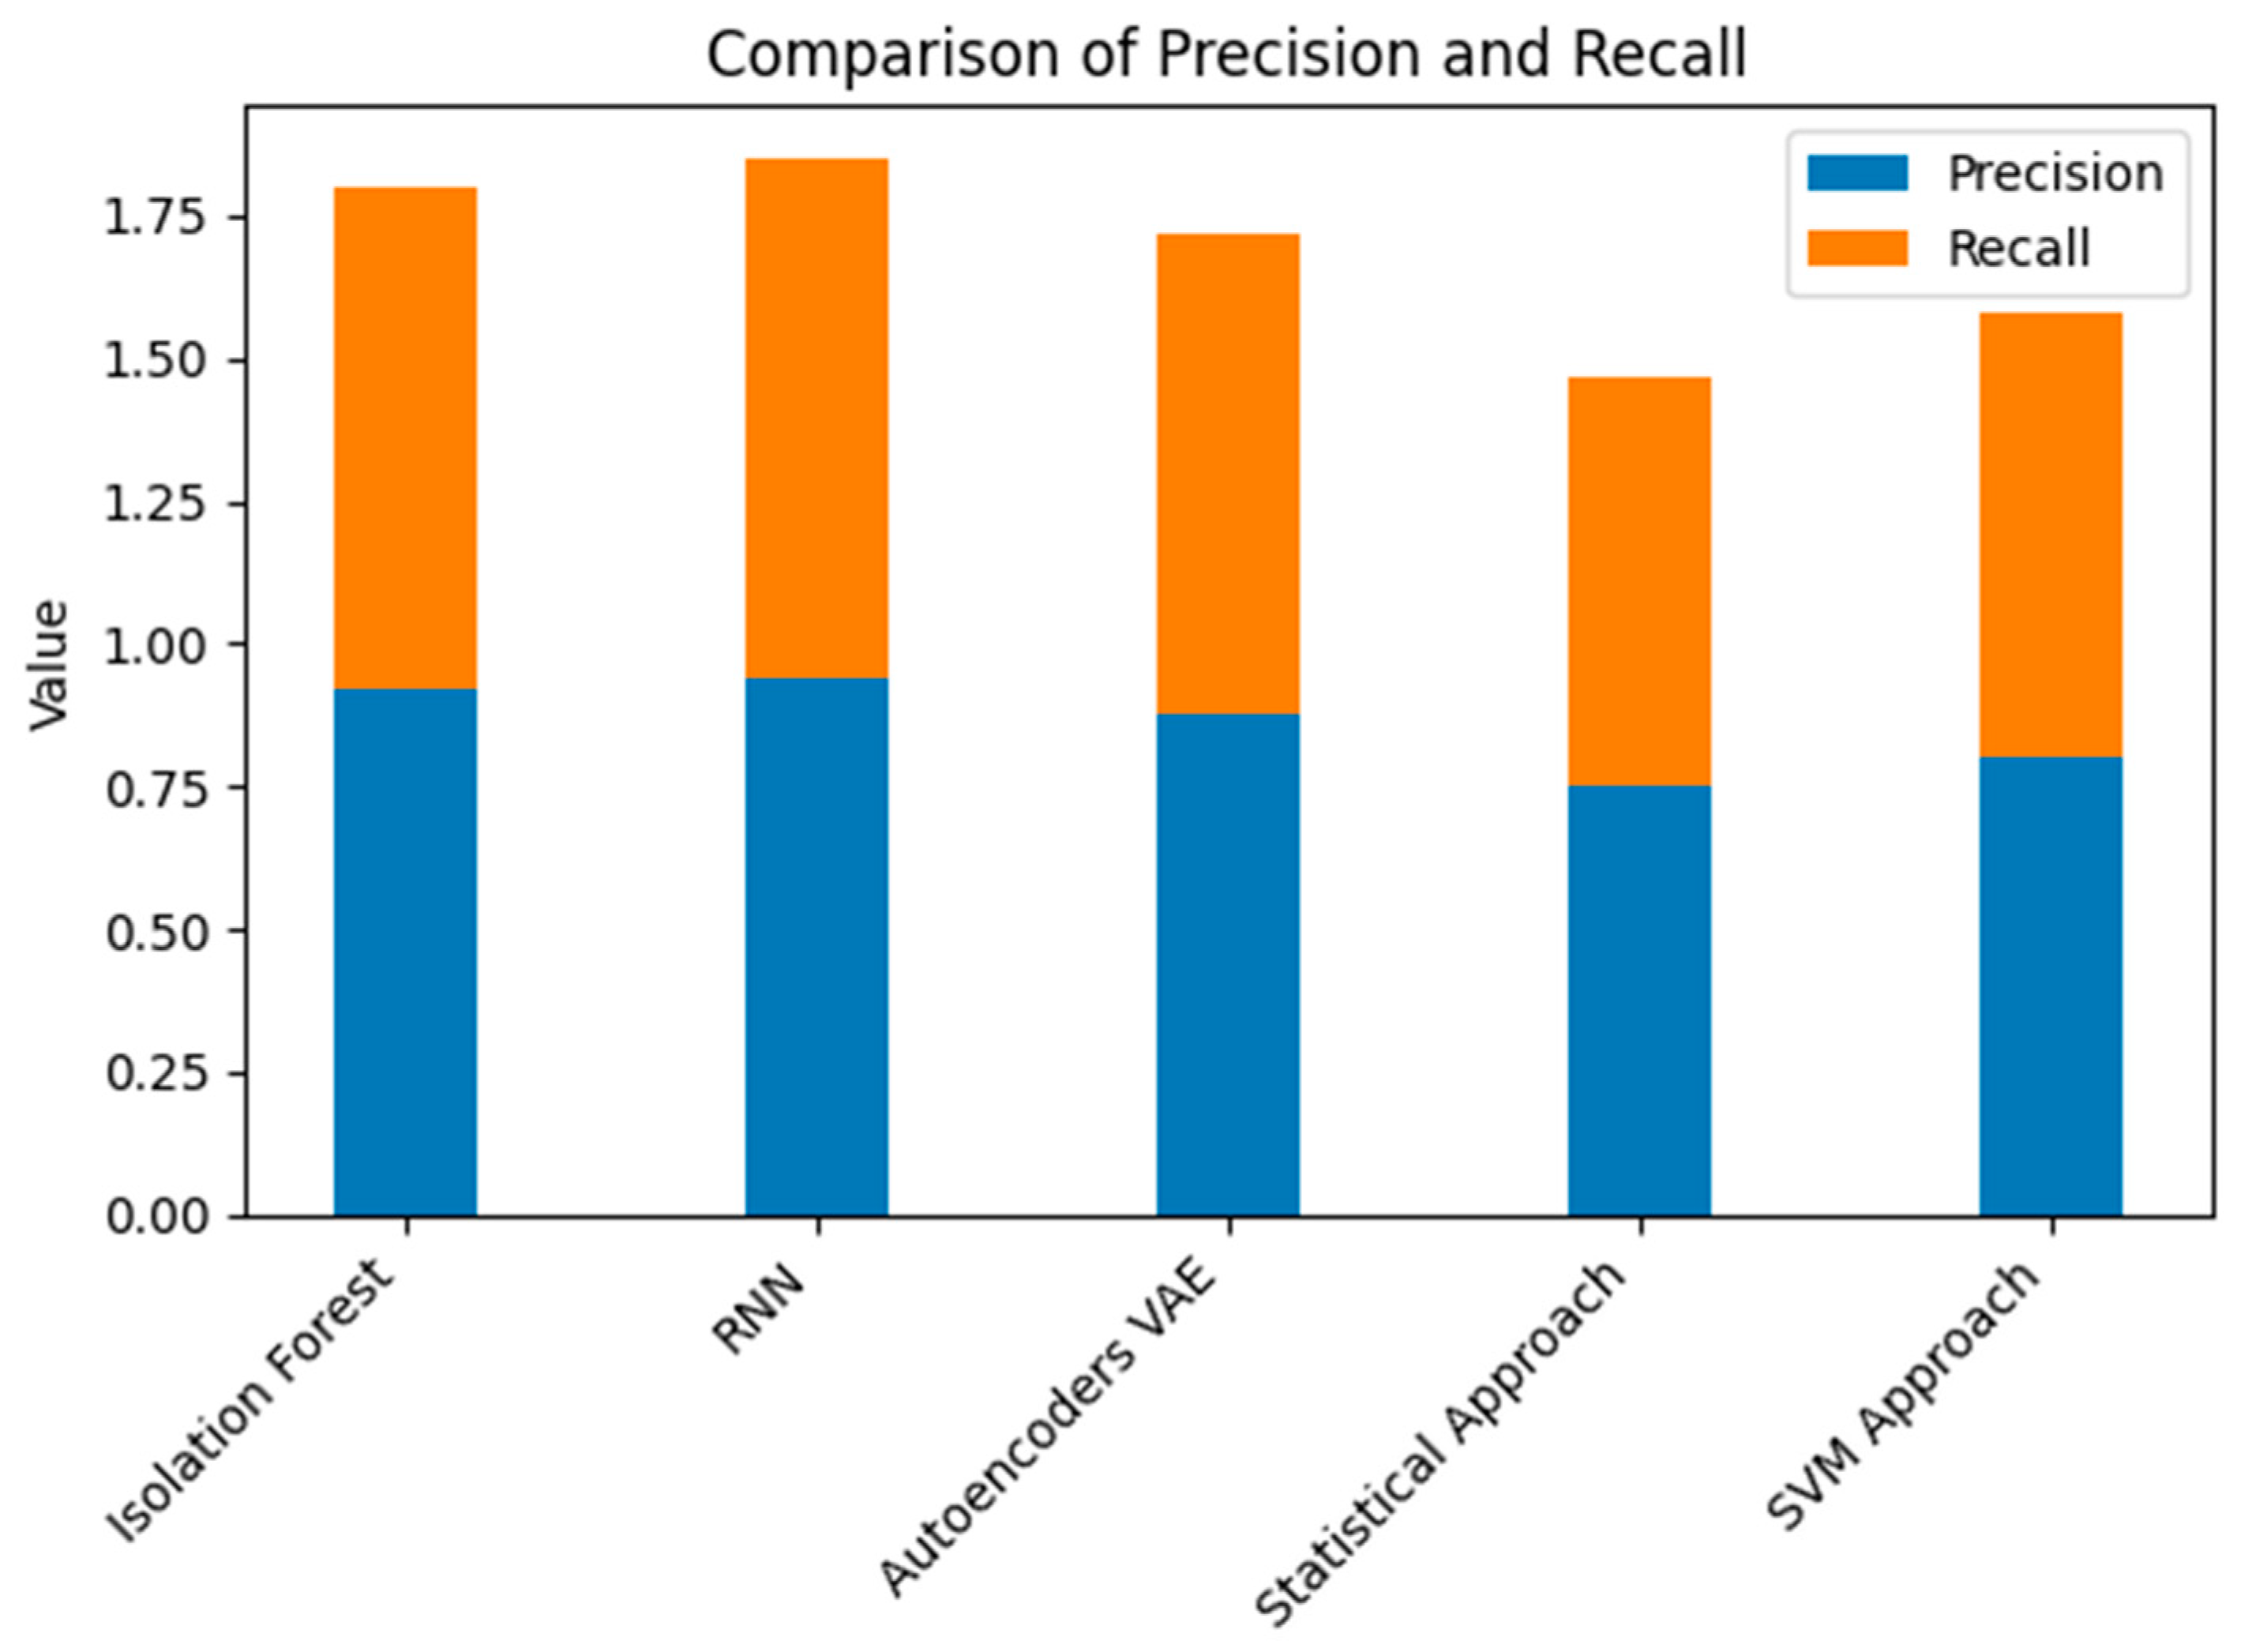
The proposed models perform strongly on critical metrics compared to other anomaly detection approaches. For example, the accuracy of our models ranges between 0.88 and 0.94, outperforming the accuracy of a statistics-based method, which has an accuracy of 0.85 on the same data set. Similarly, the completeness of our models ranges between 0.84 and 0.91, significantly outperforming the 0.78 totality of the SVM-based baseline approach. These results indicate that our models have a more remarkable ability to identify anomalies and typical urban data cases.
A key advantage of our models is their ability to handle high-dimensional data, which is essential for analyzing complex urban data. Additionally, they offer better interpretability than SVM-based models, which are often less understandable. However, it is necessary to mention that the models used may require more intensive training due to their complexity.
Figure 5 shows a visual comparison of the accuracy and completeness of our models relative to the statistics-based approach and the SVM-based approach. The proposed models stand out in accuracy and completeness, supporting their effectiveness in detecting anomalies in urban data.
3.5. Model Implementation
In implementing the anomaly detection models, a practical approach was achieved to address several critical scenarios. One of the highlights of this implementation was the ability of these models to identify attempts to tamper with the power grid, which significantly contributed to the prevention of cyber-attacks. First, threats related to the smart grid were addressed. The electrical grid is a fundamental component of a smart city, and its integrity is essential for adequately functioning other systems. Several anomalies in electricity consumption data were identified, such as unusual fluctuations in energy demand in certain areas or times of day. These anomalous patterns could indicate tampering attempts or targeted cyber-attacks on the power grid.
The results in
Table 6 reflect the anomaly detection models’ success in identifying various anomalous situations in the smart city power grid. These models have demonstrated remarkable effectiveness in achieving high accuracy, completeness, and F1-score scores in their performance evaluation. The diversity of models used, such as Isolation Forest, RNNs, and VAEs, shows their ability to address different types of anomalies and patterns in electrical data. Additionally, ROC and precision-completeness curves provide a detailed view of how the models perform regarding accurate positive rates, false favorable rates, and the relationship between precision and completeness. Together, these results support the efficiency of the models in detecting anomalies, which contributes to the safety and stability of the smart city power grid.
Another notable use case relates to preventing unscheduled outages, as presented in
Table 7. The anomaly detection models could anticipate and detect failures in critical components of the power grid, such as transformers and transmission lines. This allows preventive measures, such as preventative maintenance or equipment replacement, to be taken before catastrophic failures occur.
In protecting against cyber-attacks, the models also proved effective in detecting suspicious patterns in power grid communication data. For example,
Table 8 detected attempts to infiltrate the electrical grid control system through unauthorized access. These attempts were detected and blocked before they caused significant damage.
Implementing these models in a smart city environment not only contributes to the security of electrical infrastructure but also has a positive impact on citizens’ quality of life. Early detection of anomalies allows you to avoid unplanned power outages, reducing interruptions in power supply and improving energy efficiency. A complete evaluation of anomaly detection models in a smart city framework requires considering their generalizability, robustness, and scalability.
The results are promising, but analyzing how these models can adapt to new data sets or unforeseen scenarios is crucial. The ability of models to identify anomalies in different contexts is essential for their applicability in constantly changing urban environments. Cross-validation should be performed on additional data sets or data collected at later time points to evaluate the generalizability of the models. In addition to generalization, it is necessary to analyze the robustness of the models. This involves verifying how the models behave when faced with data with varying levels of noise or disturbances. For example, in an urban environment, data can be affected by unexpected events such as storms, network outages, or sensor malfunctions. Models must be able to maintain adequate performance even in adverse situations. Sensitivity tests can be performed by introducing artificial noise or anomalous data into the test set and observing how the models respond.
The ability of the models to handle larger data sets or larger urban environments is a crucial aspect to consider. As a smart city grows and accumulates more data, models must be scalable to remain efficient and effective. How models perform when faced with data sets significantly more significant than the original training set should be investigated. This may involve the use of parallel or distributed data processing techniques.
4. Discussion
The application of anomaly detection models in the context of smart cities, supported by IoT, is a vitally important field of research that seeks to guarantee the efficiency, security, and reliability of constantly evolving urban systems. The results offer a solid perspective on how anomaly detection models can enhance the topic of IoT in smart cities. The interconnection of various IoT devices in urban areas has generated a vast flow of real-time data [
36]. This abundance of data provides a unique opportunity to improve city management but also poses significant challenges in terms of early detection of anomalies and threats.
The present work demonstrates that the proposed models, such as Isolation Forest, RNNs, and VAEs, can effectively identify anomalies in urban data, such as unusual fluctuations in electrical energy demand, voltage manipulation attempts, the injection of false data, and frequency alterations. These findings support the usefulness of anomaly detection models in monitoring critical systems in smart cities, such as the power grid [
37].
Furthermore, the work highlights the importance of detecting suspicious patterns in power grid communication data, which significantly contributes to protection against cyber threats [
38]. The models developed here have demonstrated their ability to identify infiltration attempts, DDoS attacks, vulnerability scans, and other attack patterns, allowing preventive measures to be taken to safeguard the integrity of the infrastructure [
39]. IoT in smart cities covers a variety of applications, such as traffic monitoring, waste management, air quality monitoring, and much more. The results presented in this work lay the foundation for applying anomaly detection models in these areas. The ability to detect unusual events or anomalous behavior in IoT sensor data is essential to guaranteeing the quality of life of citizens and the efficient functioning of urban systems.
Research on anomaly detection in smart cities supports existing literature addressing the safety and efficiency of these environments. Numerous previous studies have highlighted the importance of IoT in transforming cities and have underlined the need to address security and threat detection challenges in this context. For example, ref. [
40] investigated the use of IoT in smart cities and highlighted the relevance of anomaly detection technologies to ensure the security of urban data and systems. The results of our work align with this perspective, as they demonstrate the effectiveness of anomaly detection models in identifying threats in the power grid.
In another study, ref. [
41] presented a comprehensive analysis of IoT in smart cities. They highlighted the importance of ensuring the security and privacy of data generated by IoT devices. Our work contributes to this goal by proposing real-time models that can detect abnormal activities and cyber-attacks, strengthening IoT security in smart cities.
The anomaly detection algorithms employed in this study, including Isolation Forest, RNN, and VAE, have shown high promise in various anomaly detection applications in time series and unstructured data. In previous research, Isolation Forest has been widely recognized for its ability to identify unusual patterns in nonlinear data and its effectiveness in anomaly detection applications in various domains [
42]. Furthermore, RNNs have excelled at detecting temporal and sequential patterns in data, making them especially suitable for anomaly detection problems in time series [
43]. Previous studies on VAEs have revealed their ability to capture the latent structure of high-dimensional data and detect significant deviations in these data [
44]. These references support the choice of these algorithms and reinforce their applicability in the context of cybersecurity for critical infrastructure in a smart city [
45].
Furthermore, these algorithms were chosen based on an exhaustive review of the existing literature on anomaly detection and its application in similar environments. Previous research has highlighted the importance of employing practical and versatile algorithms for detecting threats and anomalies in IoT-supported critical infrastructure systems [
46]. The application of Isolation Forest, RNN, and VAE in our study aligns with the trend of using machine learning approaches to improve the safety and efficiency of smart cities [
47,
48]. These choices are based on the solid theoretical foundation supported by previous research and the proven ability of these algorithms to address the challenges of anomaly detection in high-dimensional and time-series data. Therefore, we can confidently state that these algorithms represent a suitable and promising choice for anomaly detection in the critical infrastructure of an IoT-enabled smart city.
The relevance of this work is reflected in its ability to address critical challenges in smart cities, such as IoT security, and the protection of crucial infrastructure, such as the electrical grid. The successful implementation of these models could significantly impact the safety and efficiency of smart cities around the world, improving the quality of life of citizens and the sustainability of urban systems.
5. Conclusions
This work addresses the application and evaluation of anomaly detection models in the context of smart cities supported by IoT. Anomaly detection models, including Isolation Forest, RNNs, and VAEs, have demonstrated robust effectiveness in identifying anomalies in urban data. These models have highlighted their ability to detect unusual patterns in electrical consumption, manipulations in the electrical grid, and cyber threats, which supports their relevance in monitoring critical systems in smart cities.
The results of this work suggest that anomaly detection models can be applied to various scenarios in smart cities. In addition to the electrical grid, these models can be helpful in areas such as traffic monitoring, waste management, and air quality surveillance, thus contributing to improving citizens’ quality of life.
This study has exhaustively evaluated the effectiveness of various anomaly detection models in the context of IoT in smart cities. The results support the usefulness of these models to accurately and timely identify a wide range of anomalies, from unusual fluctuations in electrical energy demand to voltage manipulation attempts and cyber-attacks. These findings support the applicability and relevance of anomaly detection models to the safety and efficiency of critical infrastructure in smart urban environments.
This study has highlighted the effectiveness of anomaly detection models and contributed significantly to the literature on IoT in smart cities. Delving into applying these models in various urban scenarios and evaluating their performance has provided a deeper understanding of how machine-learning approaches can strengthen safety and efficiency in this context. Furthermore, the results presented here support the relevance of addressing anomaly detection as a critical component of cybersecurity in the essential infrastructure of smart cities.
Early detection of anomalies in urban data can strengthen the security of smart cities. The proposed models have demonstrated their ability to identify tampering attempts, failures in electrical infrastructure, and cyber threats, allowing preventive measures to be taken and safeguarding the integrity of urban systems. This work adds to the existing literature on IoT in smart cities and anomaly detection. It is related to previous studies highlighting the importance of guaranteeing the security and privacy of data generated by IoT devices in urban environments.
Future work can explore the application of anomaly detection models to various additional applications in smart cities, such as water quality monitoring, smart building management, and public transportation optimization. Smart cities generate data from multiple sources, such as IoT sensors, surveillance cameras, and geographic information systems. Future work can address integrating various data sources for even more robust and accurate anomaly detection.


