Article

A Multivariate Model of Drinking Water Quality Based on Regular Monitoring of Radioactivity and Chemical Composition

by
Cecilia Ionela Tăban
1,2,
Ana Maria Benedek
3,
Mihaela Stoia
4,*,
Maria Denisa Cocîrlea
2 and
Simona Oancea
2,*
1
Radiation Laboratory, Directorate of Public Health, 2 Pompeiu Onofreiu Street, 550166 Sibiu, Romania
2
Faculty of Agricultural Sciences, Food Industry and Environmental Protection, “Lucian Blaga” University of Sibiu, 7-9 Dr. Ion Rațiu Street, 550024 Sibiu, Romania
3
Faculty of Sciences, “Lucian Blaga” University of Sibiu, 5-7 Raţiu Street, 550012 Sibiu, Romania
4
Faculty of Medicine, “Lucian Blaga” University of Sibiu, 2A Lucian Blaga Street, 550172 Sibiu, Romania
*
Authors to whom correspondence should be addressed.
Appl. Sci. 2023, 13(18), 10544; https://doi.org/10.3390/app131810544
Submission received: 20 August 2023 / Revised: 15 September 2023 / Accepted: 20 September 2023 / Published: 21 September 2023
(This article belongs to the Special Issue Sustainable Environment and Water Resource Management)

Abstract

:
From a public health perspective, the monitoring of water quality intended for human consumption belongs to the operational and audit management of the supply zones. Our study explores the spatial and temporal patterns of the parameters of drinking water in Sibiu County, Romania. We related the relevant physical-chemical parameters (ammonia, chlorine, nitrates, Al, Fe, Pb, Cd, Mn, pH, conductivity, turbidity, and oxidizability) and radioactivity (gross alpha activity, gross beta activity, and radon-222 content) from a 5-year survey to the water source (surface water and groundwater, which may be of subsurface or deep origin), space (sampling locality) and time (sampling month and year). We conducted a combined evaluation using the generalized linear mixed models (GLMMs), Pearson correlation analysis of the physical-chemical parameter, multivariate linear redundancy analysis (RDA), t-value biplots construction, and co-inertia analysis. The obtained regional model shows that the source, locality, and month of sampling are significant factors in physical-chemical parameters’ variation. Fe and turbidity have significantly higher values in surface water, and nitrates and conductivity in groundwater. The highest values are recorded in January (nitrates), March (Cl, ammonia, pH) and August (Fe, turbidity). The RDA ordination diagram illustrates the localities with particular or similar characteristics of drinking water, two of which (rural sources) being of concern. The water source is the best predictor for radioactivity, which increases from surface to ground. The gross alpha and beta activities are significantly and positively correlated, and are both correlated with conductivity. In addition, the gross alpha activity is positively correlated with nitrates and negatively with pH, while the gross beta activity is positively correlated with Mn and negatively with Fe; these relationships are also revealed by the co-inertia analysis. In conclusion, our model using multilevel statistical techniques illustrates a potential approach to short-term dynamics of water quality which will be useful to local authorities.

1. Introduction

The development of safe drinking water supplies relies on two key factors, namely, quantity and quality [1]. In European countries, the risk assessment associated with water consumption is based on monitoring programs for bodies of water that provide more than 100 m3 a day on average [2]. In Romania, the quality of drinking water is surveyed through the national program for monitoring the environmental and occupational risk factors. An effective drinking water monitoring is highly required in order to reduce the impact of water pollution on human health, particularly on the development of cancer, gastrointestinal, and childhood diseases [3]. While water-borne diseases are well documented, such as diarrheal disease on which a published study estimated that 34% out of 58% of all cases of diarrhea was due to inadequate drinking water in low- and middle-income countries for the year 2012 [4], the health impact of water radioactivity and chemical contamination remains an issue of concern. It was found that cancer risks arise from disinfection by-products, arsenic, and alpha particle radiation [5]. Consistent evidence supports that arsenic level above a certain threshold in drinking water increases the risk for bladder cancer [4]. Heavy metals, pesticides, hydrocarbons, or persistent organic pollutants may cause reduced reproduction, abnormal behavior (mercury), and damages to the nervous system, liver, and kidneys [6]. Recently, lithium concentration in tap water has become a debatable issue since maternal prenatal exposure to natural water sources in Denmark was associated with autism risk in the offspring, as lithium levels increased [7]. On the other hand, the presence of lithium at very low concentrations was associated with reduced suicide rates, and water supplementation with lithium was proposed for discussion as a public policy [8].
The sources of chemical hazards that are of health significance in drinking water are as follows: naturally occurring (source of Ba, B, As, Cd, F, and uranium in the final water), industrial and human dwellings (source of Cd, Hg, benzene, styrene, toluene, carbon tetrachloride, nitrilotriacetic acid, and 1,4-dioxane in the final water), agricultural activities (source of nitrates, nitrites, and pesticides in the final water), water treatment or materials in contact with drinking water (source of disinfectants such as chlorine, monochloramine, and sodium dichloroisocyanurate, and of piping materials such as Cu, Pb, Ni, and vinyl chloride in the final water), and pesticides used in water for public health—vector control (source of DDT and larvicide) [9]. Radioactive substances (radionuclides) occur naturally (e.g., the decay series of uranium and thorium) and artificially (e.g., Caesium-134, Iodine-131, Tritium, or Strontium-90) and are not routinely monitored to detect potential exceeding of the screening level—the total radioactivity in the form of alpha and beta radiation. Drinking water sources from groundwater may also contain radon, which is a radioactive gas of a great health concern [10,11]. Radon substantially contributes to the natural human exposure to radiation via inhalation and direct digestion, causing lung or stomach cancer [12].
Using advanced computing techniques, several models have been developed for the prediction of water quality components, and, recently, artificial intelligence (AI) techniques showed suitable performance in this field [13]. For detailed information on machine learning algorithms, readers are invited to refer to the study of Zhu et al. [14]. It is worth mentioning two of the predictive models using meaningful physical, chemical, and microbial indicators, namely, the Adaptive Frequency Analysis proposed to solve scalability in the time domain [15], and the LASSO (Least Absolute Shrinkage and Selection Operator) regression model proposed to predict the biological risk [16]. Moreover, computational intelligence techniques are developed and tested on a small scale, aiming to achieve smart water management systems [17]. On the other hand, when large training sets cannot be provided in water supply systems, statistic modelling of data remains a useful tool, i.e., for depicting regional models of drinking water quality. Maiolo et al. [18] provide the multivariate analysis of 18 physical-chemical parameters for some water supply systems in the Emilia-Romagna region of Italy, using PCA (principal component analysis), CA (cluster analysis), and the KMO (Kaiser–Meyer–Olkin) test. Techniques such as multivariate statistics, water quality identification index, positive matrix factorization, or the Soil Water Assessment Tool were applied to examine the spatiotemporal variation in water quality, to determine the major pollution sources in rivers, and to optimize the management practices for environmental risk factors [19,20,21]. Recently, Schreiber et al. [22] reviewed the statistical methods used in 580 randomly selected papers on water quality assessment and monitoring in river ecosystems. They found that most papers rely only on descriptive statistics and do not perform any tests. Among the statistical methods, the multilevel models (linear mixed models (LMMs) and generalized mixed models (GLMMs)) have increasingly been used in the last two decades. The authors suggest these models to be the default statistical approach in ecological research, because they better address analyses of datasets when conventional statistical assumptions, namely, data independence and normal distribution, are not met [22]. For a large number of response variables, constructing models for each variable is not only statistically incorrect (due to the inflation of type I error), but it also may miss patterns that occur at higher levels, for which all variables need to be analyzed together, in multivariate analyses, such as the ordination methods. Principal component analysis (PCA) has been intensively used over the last 35 years in papers on water quality monitoring [22], and recently studies have also been increasingly conducted using its constrained counterpart, redundancy analysis (RDA), which relates the response variables matrix (the parameters of water quality) to the explanatory variables matrix (spatiotemporal and environmental variables) [23,24,25,26,27].
The aim of this paper was to propose a dynamic model of drinking water quality for a geographically defined area, relating physical-chemical and radioactivity parameters to water source and spatiotemporal variables. This model can be further developed by increasing the training dataset and adding new explanatory variables, which may be useful for short-term dynamics and continuous monitoring for operational and audit management.

2. Materials and Methods

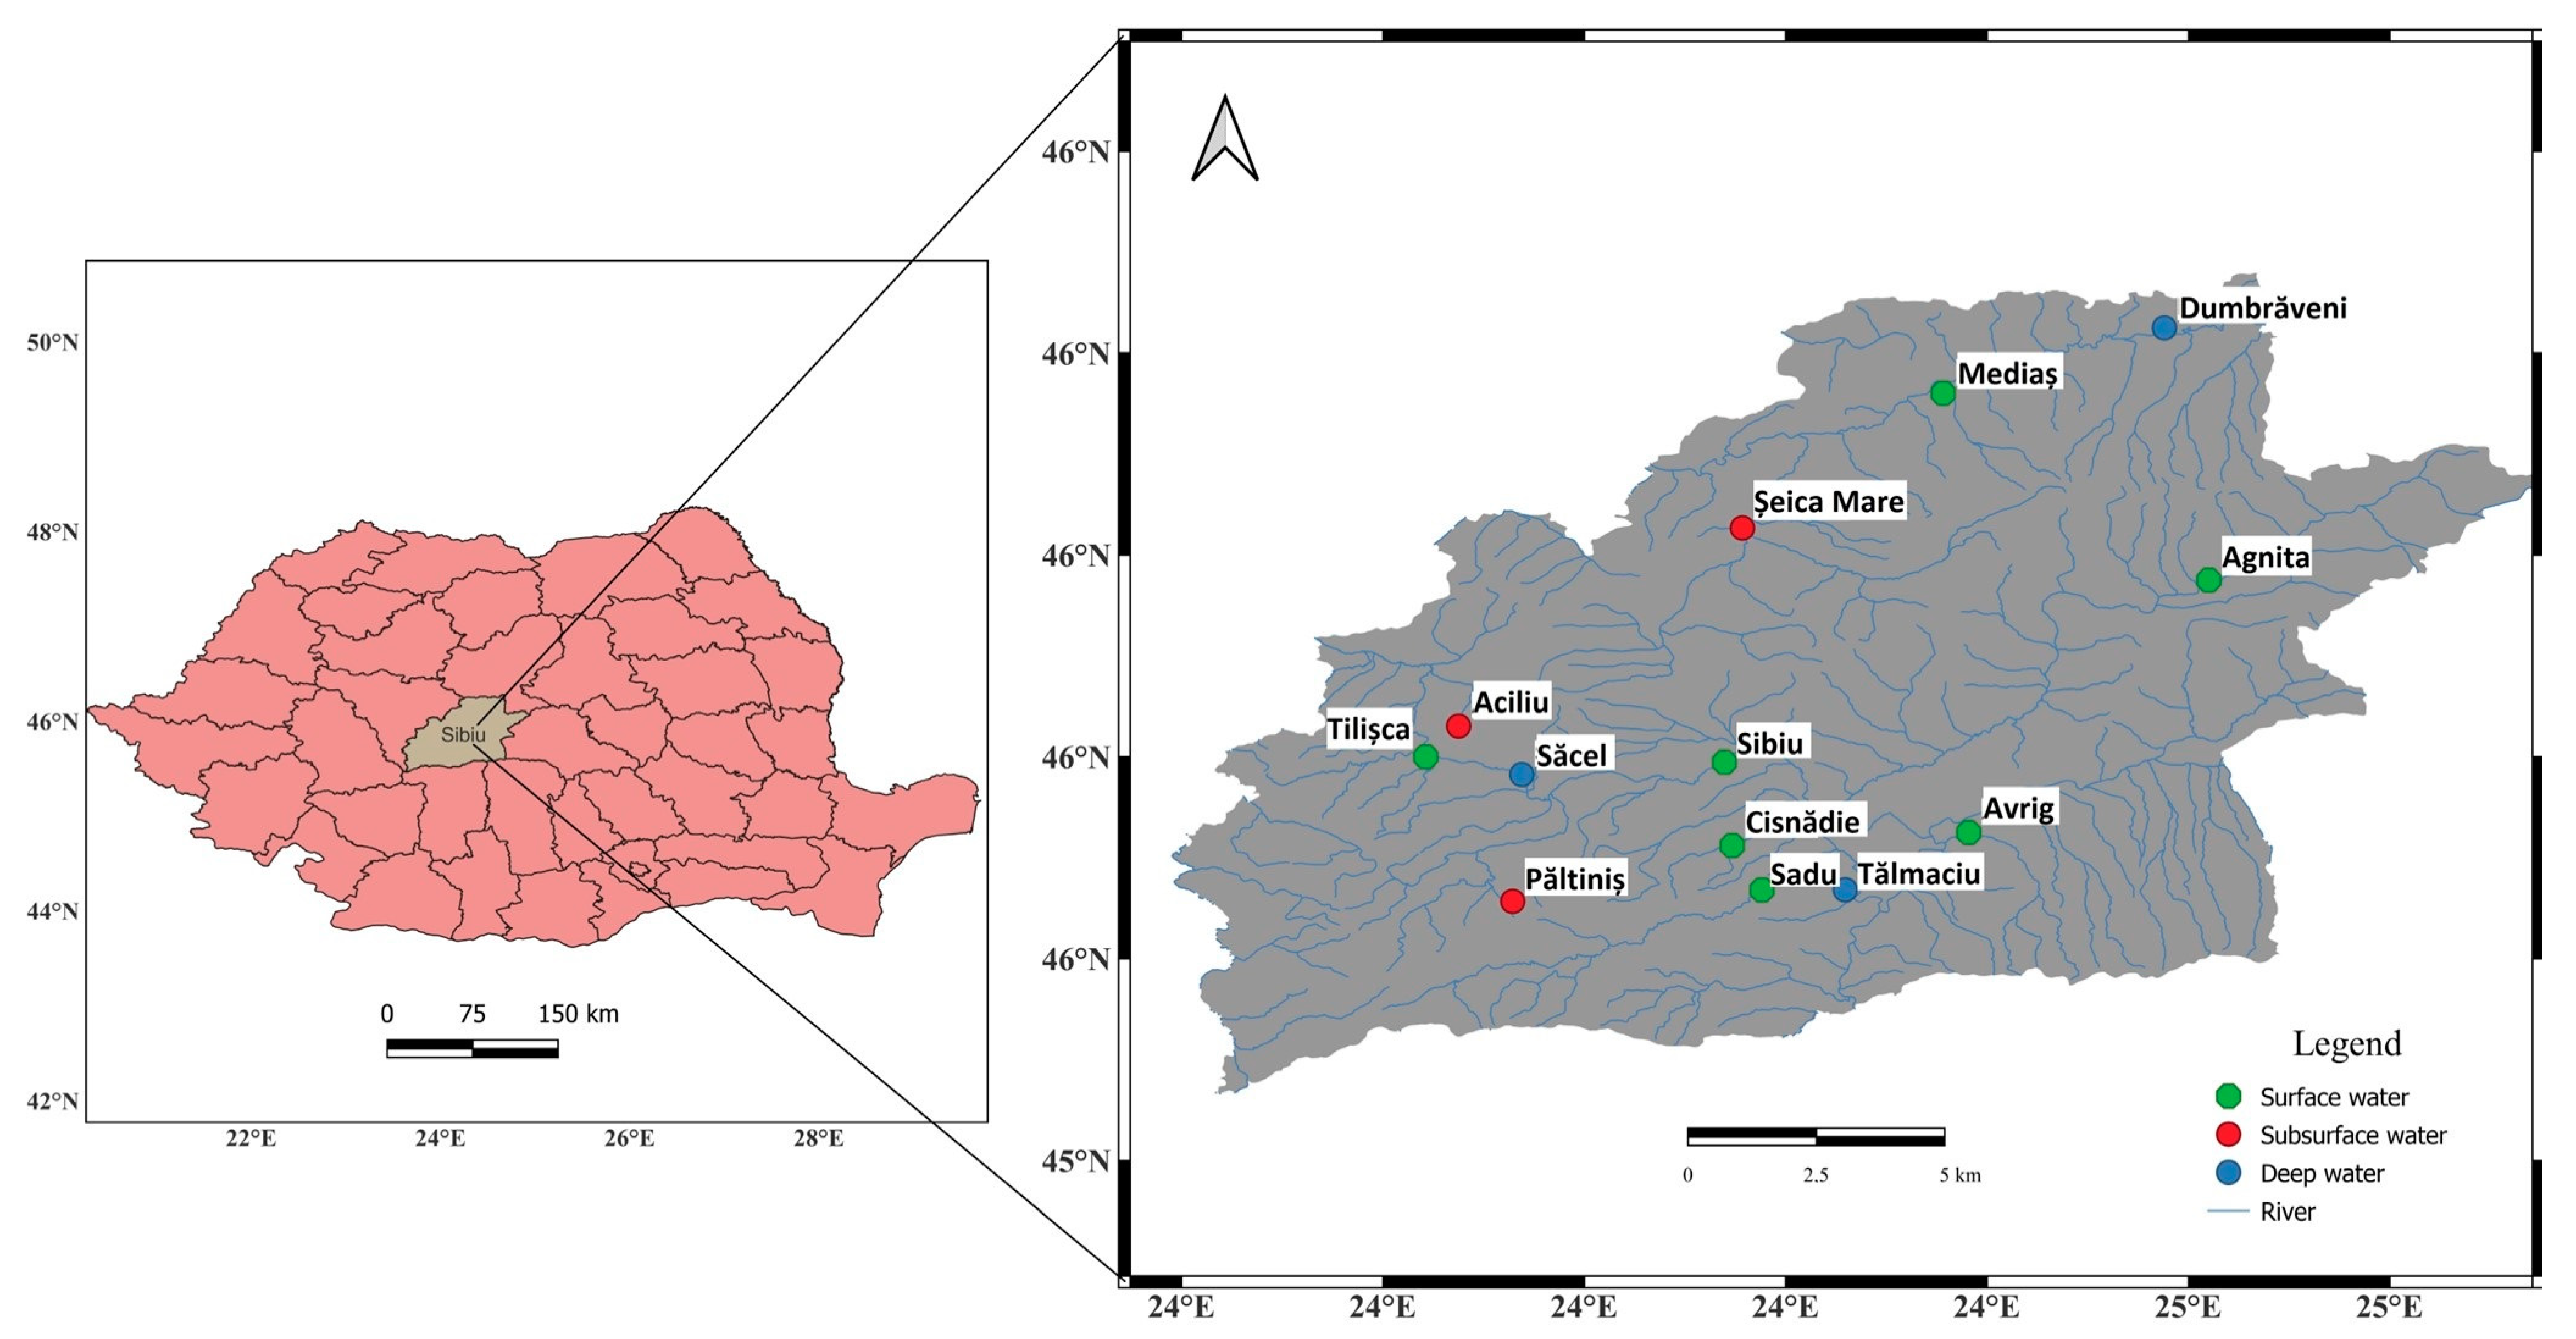
2.1. Study Area, Water Sources, and Sample Collection

The water samples were collected from Sibiu county in Romania, which is located in the Transylvanian Depression, crossed in part by the Southern Carpathians [28]. In the mountainous area of the county, the geological substratum is dominated by the presence of crystalline shales, while in other areas gravels, sands, clays, marls, limestones and tuffs can be found, with landslides occurring frequently [28,29]. The relief is highly diversified, comprising mountain massifs and hills, which are predominant [28], but also glacial valleys, foothills, depressions, and stepped plains [28,29]. Erosion, torrentiality, and surface runoff are processes frequently encountered in the subalpine and alpine areas [28]. The region is rich in deposits of salt, methane gas, chloride, bromide and iodide mineral waters, and various building rocks [28,29]. The average annual rainfall is between 606.7 and 1300 mm [28]. A moderate continental climate predominates, but in some parts of the county a mountain climate is also encountered [28].
In Sibiu County, regular monitoring of the water quality intended for human consumption is carried out by the Public Health Directorate through its own accredited laboratories, in order to meet the national and international legal requirements. The audit and control monitoring of the authorized suppliers include the establishment of sampling points, sample collection, transportation, and analysis which are performed by specialized personnel. An extensive database was extracted from lab reports between 2017 and 2021, namely, 65 samples analyzed from surface (54%) and groundwater (23% subsurface and 23% deep sources). Samples were collected annually from 13 locations illustrated in Figure 1, between January and November. The diversity of water sources within the supply zones and the pre-established periodicity of sampling were considered eligible criteria for the present study. In this respect, the following drinking water sources were selected: surface water from the Cibin River (Sibiu); surface water from the Avrig River (Avrig); surface water from the Târnava Mare River (Agnita, Mediaș); surface water from the Sadu River (Cisnădie, Sadu); surface water from the Tilișcuța River (Tilișca); water from captured springs (Aciliu, Păltiniș); water from drilled wells (Săcel, Tălmaciu, Dumbrăveni); and water from mixed sources: captured springs and drilled wells (Șeica-Mare).
The investigated 65 samples selected for the present study meet the requirements of data synchronization in terms of time, location, and water quality indicators (physical, chemical, and radiological).

2.2. Monitoring of Water Radioactivity and Physical-Chemical Parameters

The Romanian drinking water standards expressing the maximum allowable values for chemicals and radioactivity are based on public health considerations [30,31]. The details of the experimental measurements performed on the 65 investigated water samples are summarized in Table 1. This table also includes the maximum allowable limits of the measured physical-chemical parameters. Microbiological issues were not the subject of the present work.
Water quality monitoring and a physical-chemical parameter evaluation of the 65 investigated samples were performed in the laboratories of the Directorate of Public Health of Sibiu, Romania, which are accredited by the national accreditation body (RENAR), using Romanian standards (SR), which adopted the European or International standards for analytical methods, such as European Norms (EN) or standards issued by the International Organization for Standards (ISO). The validation of the analytical methods, quality assurance, and control of the methods for drinking water, are carried out in accordance with the analytical performance characteristics laid down by the Law No. 458/2002 [32]. The gross alpha activity of water samples was measured using the alpha spectrometer Tennelec TC 256, USA, calibrated with Am-241, based on the described standard method [33]. The gross beta activity was measured using the beta spectrometer Robotron 20050, Germany, calibrated with Sr-90/Y-90, based on the described standard method [34]. The determined minimum detectable activities for gross alpha and beta measurements, were of 0.007 Bq and 0.06 Bq, respectively, calculated based on the ISO 11929-4: 2022 method [35]. The measurement of radon concentration in the water samples was conducted using the Alpha Guard DF 2000 radon monitor with the additional equipment AquaKit, based on the method SR EN ISO 13164-3: 2020 [36]. In accordance with the specific analytical method applied for each physical-chemical parameter as described in Table 1, the following equipment was used: Specord 200 Plus spectrophotometer/Analytik Jena; GBC Savant AAS Atomic Absorption Spectrometer; HQ40D Dual Channel Meter with conductivity cell CDC401 + PHC series pH electrode; and Hach 2100Q Portable Turbidimeter. The traceability of measurements is achieved and maintained through periodic calibrations, in accordance with SR EN ISO/IEC 17025:2018 [37].
Table 1. The applied methodology for monitoring radioactivity and the physical and chemical parameters of the investigated water sources intended for human consumption, and parametric limit values.
ParameterAnalytical MethodWHO Guideline ValueUS-EPA Limit ValueEU
Limit Value
National Limit ValueRef.
Radon
(Rn-222, 222Rn)
Alpha spectroscopy (pulse-counting ionization chamber)100 Bq/L11.1 Bq/L100 Bq/L100 Bq/L[38]
[39]
[40]
[32]
Gross alpha activityAlpha spectrometry0.5 Bq/L≤0.1 Bq/L0.1 Bq/L
0.5 Bq/L
0.1 Bq/L[33]
[41]
[42]
[43]
[40]
[32]
Gross beta activityBeta spectrometry with scintillation detector1 Bq/L0.15 Bq/L1 Bq/L1 Bq/L[34]
[41]
[43]
[40]
[32]
AmmoniaUV-VIS spectrophotometry0.5 mg/L0.3 mg/L0.5 mg/L0.5 mg/L[44]
[45]
[46]
[47]
Free chlorine residualUV-VIS spectrophotometry0.6–1 mg/L ≥0.1–≤0.5 mg/L[48]
[38]
[32]
NitratesUV-VIS spectrophotometry50 mg/L50 mg/L50 mg/L50 mg/L[49]
[38]
[45]
[47]
[32]
Al, FeUV-VIS spectrophotometry200 µg/L200 µg/L (Al),
300 µg/L (Fe)
200 µg/L200 µg/L[50]
[51]
[45]
[47]
[32]
[31]
Pbatomic absorption spectrometry10 µg/L10 µg/L10 µg/L10 µg/L[52]
[38]
[45]
[47]
[32]
CdAtomic absorption spectrometry3 µg/L5 µg/L5 µg/L5 µg/L[52]
[38]
[45]
[47]
[32]
[31]
MnAtomic absorption spectrometry100 µg/L50 µg/L50 µg/L50 µg/L[52]
[38]
[45]
[47]
pHElectrode method≥6.5–≤9.5≥6.5–≤9.5≥6.5–≤9.5≥6.5–≤9.5[53]
[9]
[45]
[47]
[32]
[31]
ConductivityElectrode method2500 µS/cm at 20 °C2500 µS/cm at 20 °C2500 µS/cm
at 20 °C
2500 µS/cm
at 20 °C
[53]
[9]
[45]
[47]
[31]
[31]
TurbidityNephelometric methodAcceptableAcceptableAcceptable≤5 UNT
Acceptable
[54]
[9]
[45]
[47]
OxidizabilityVolumetric method5 mgO2/L5 mg O2/L5 mg O2/L5 mg O2/L[55]
[9]
[45]
[47]

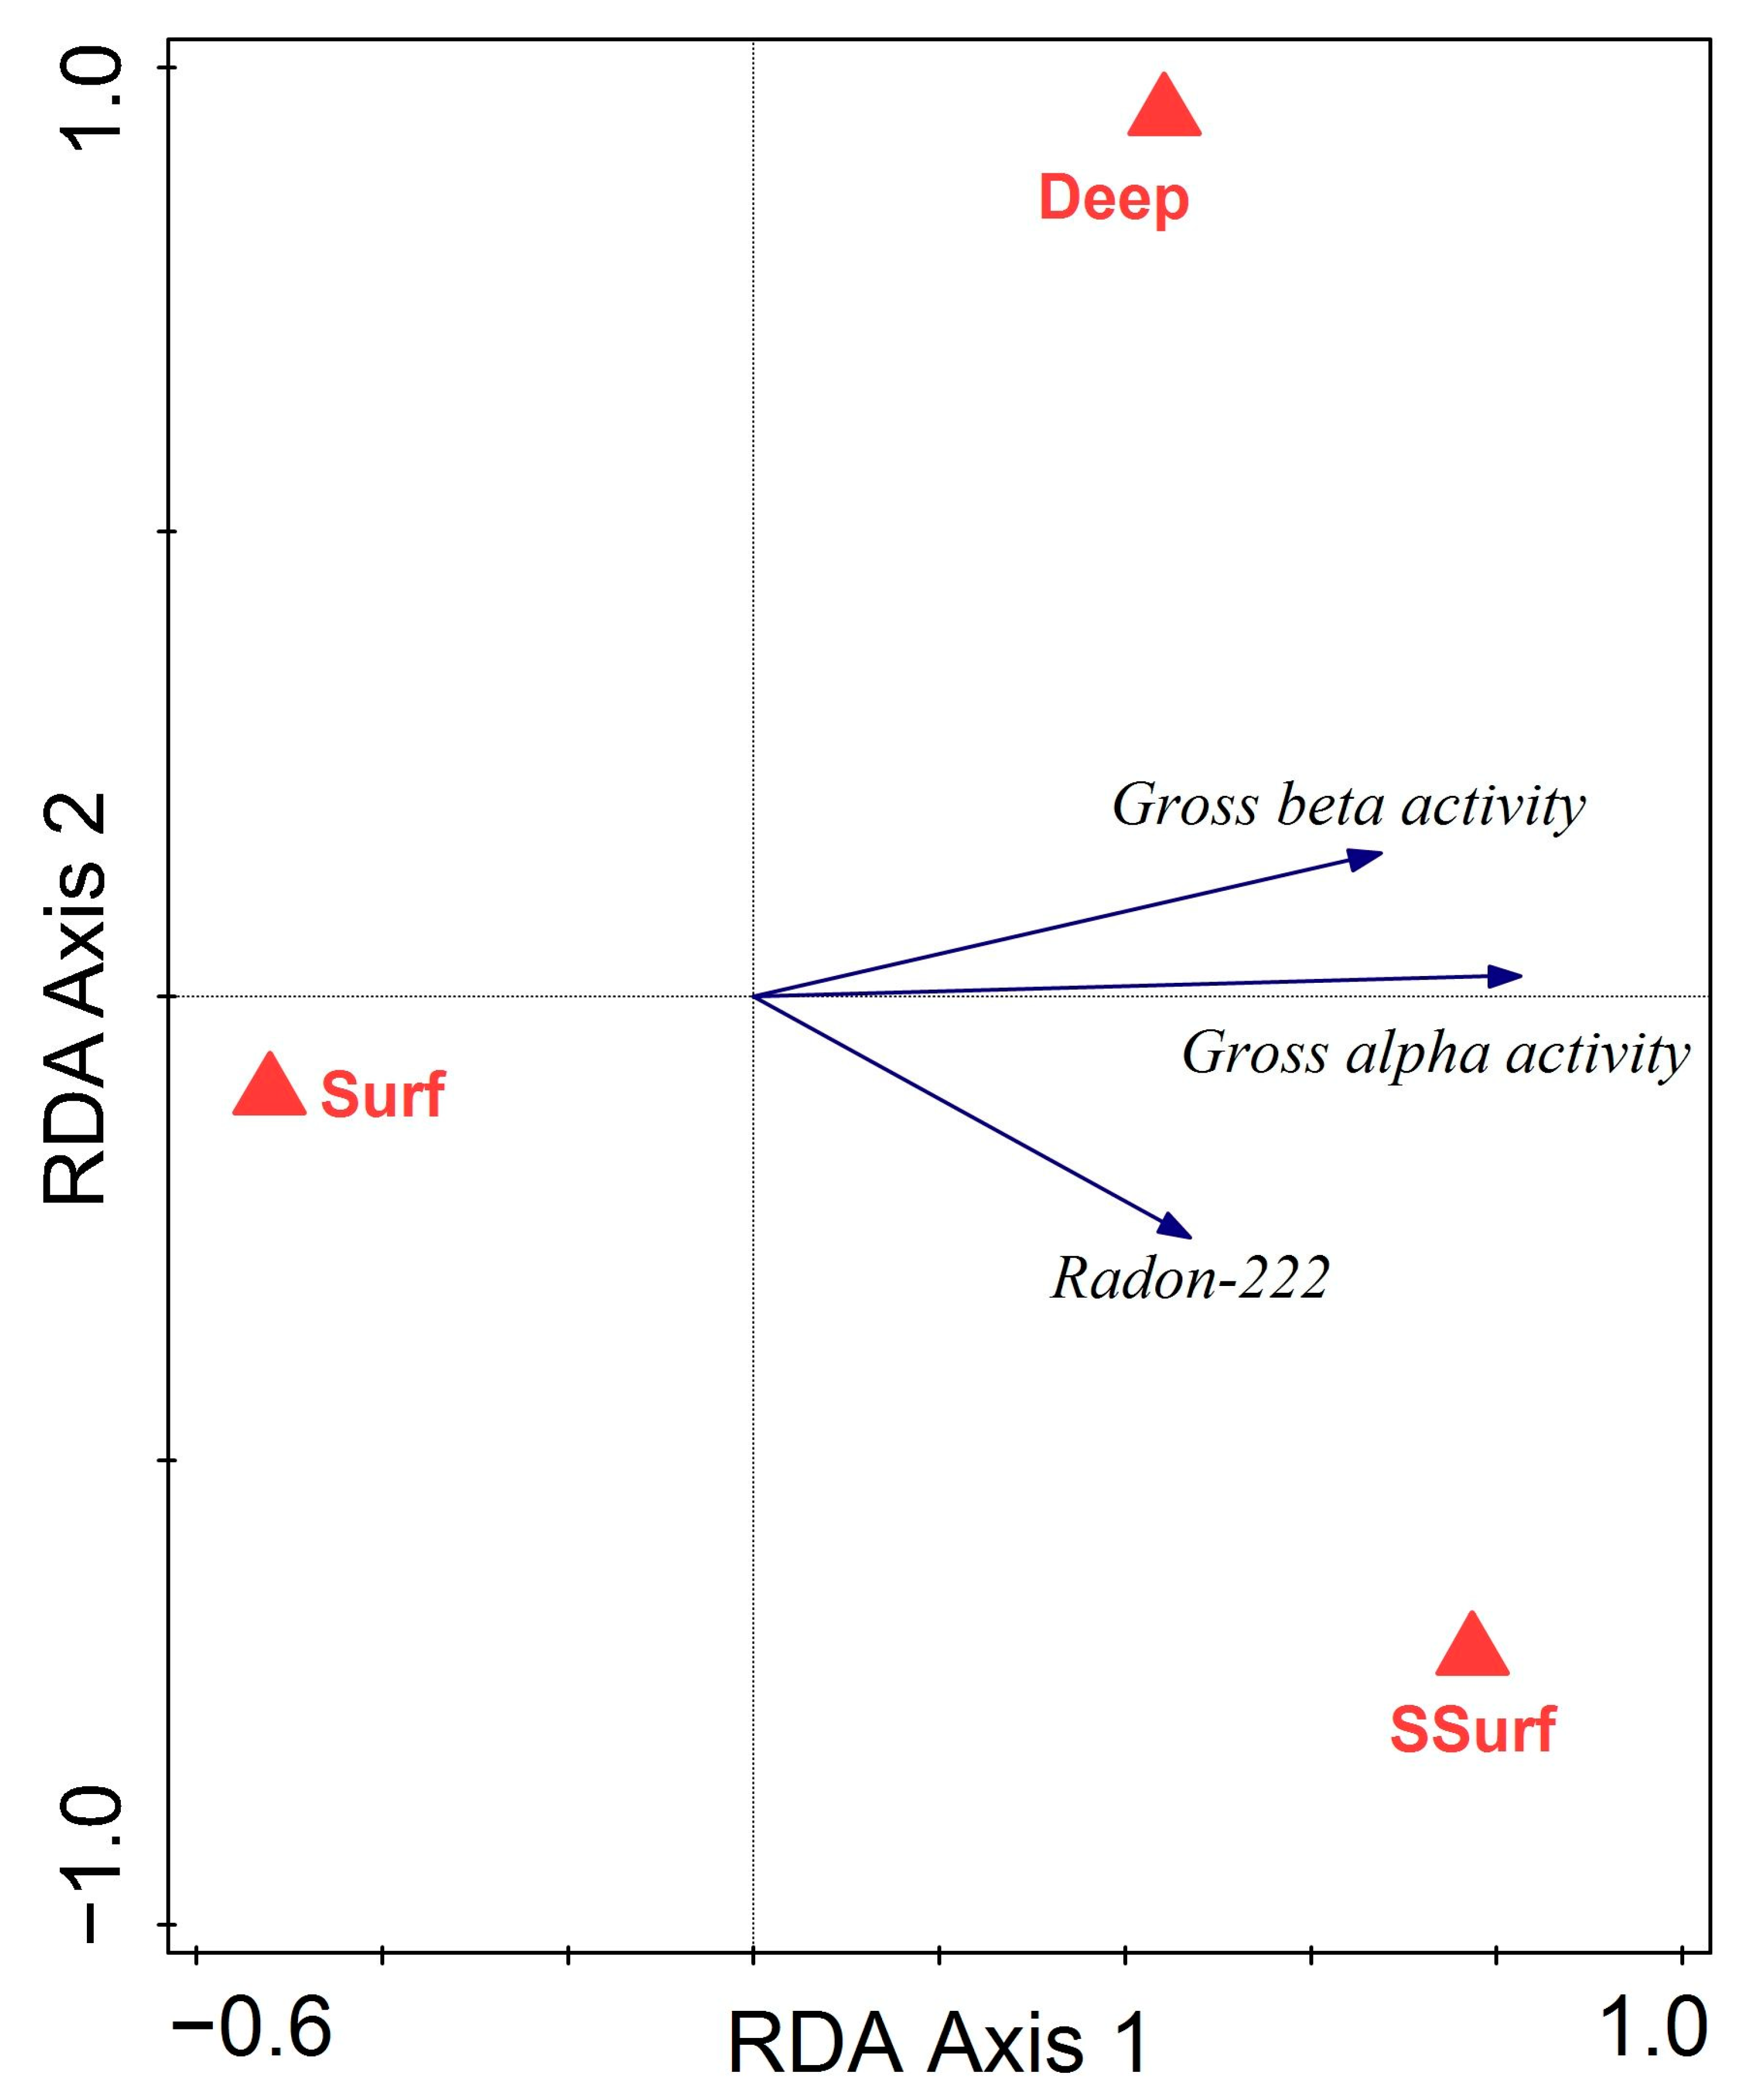
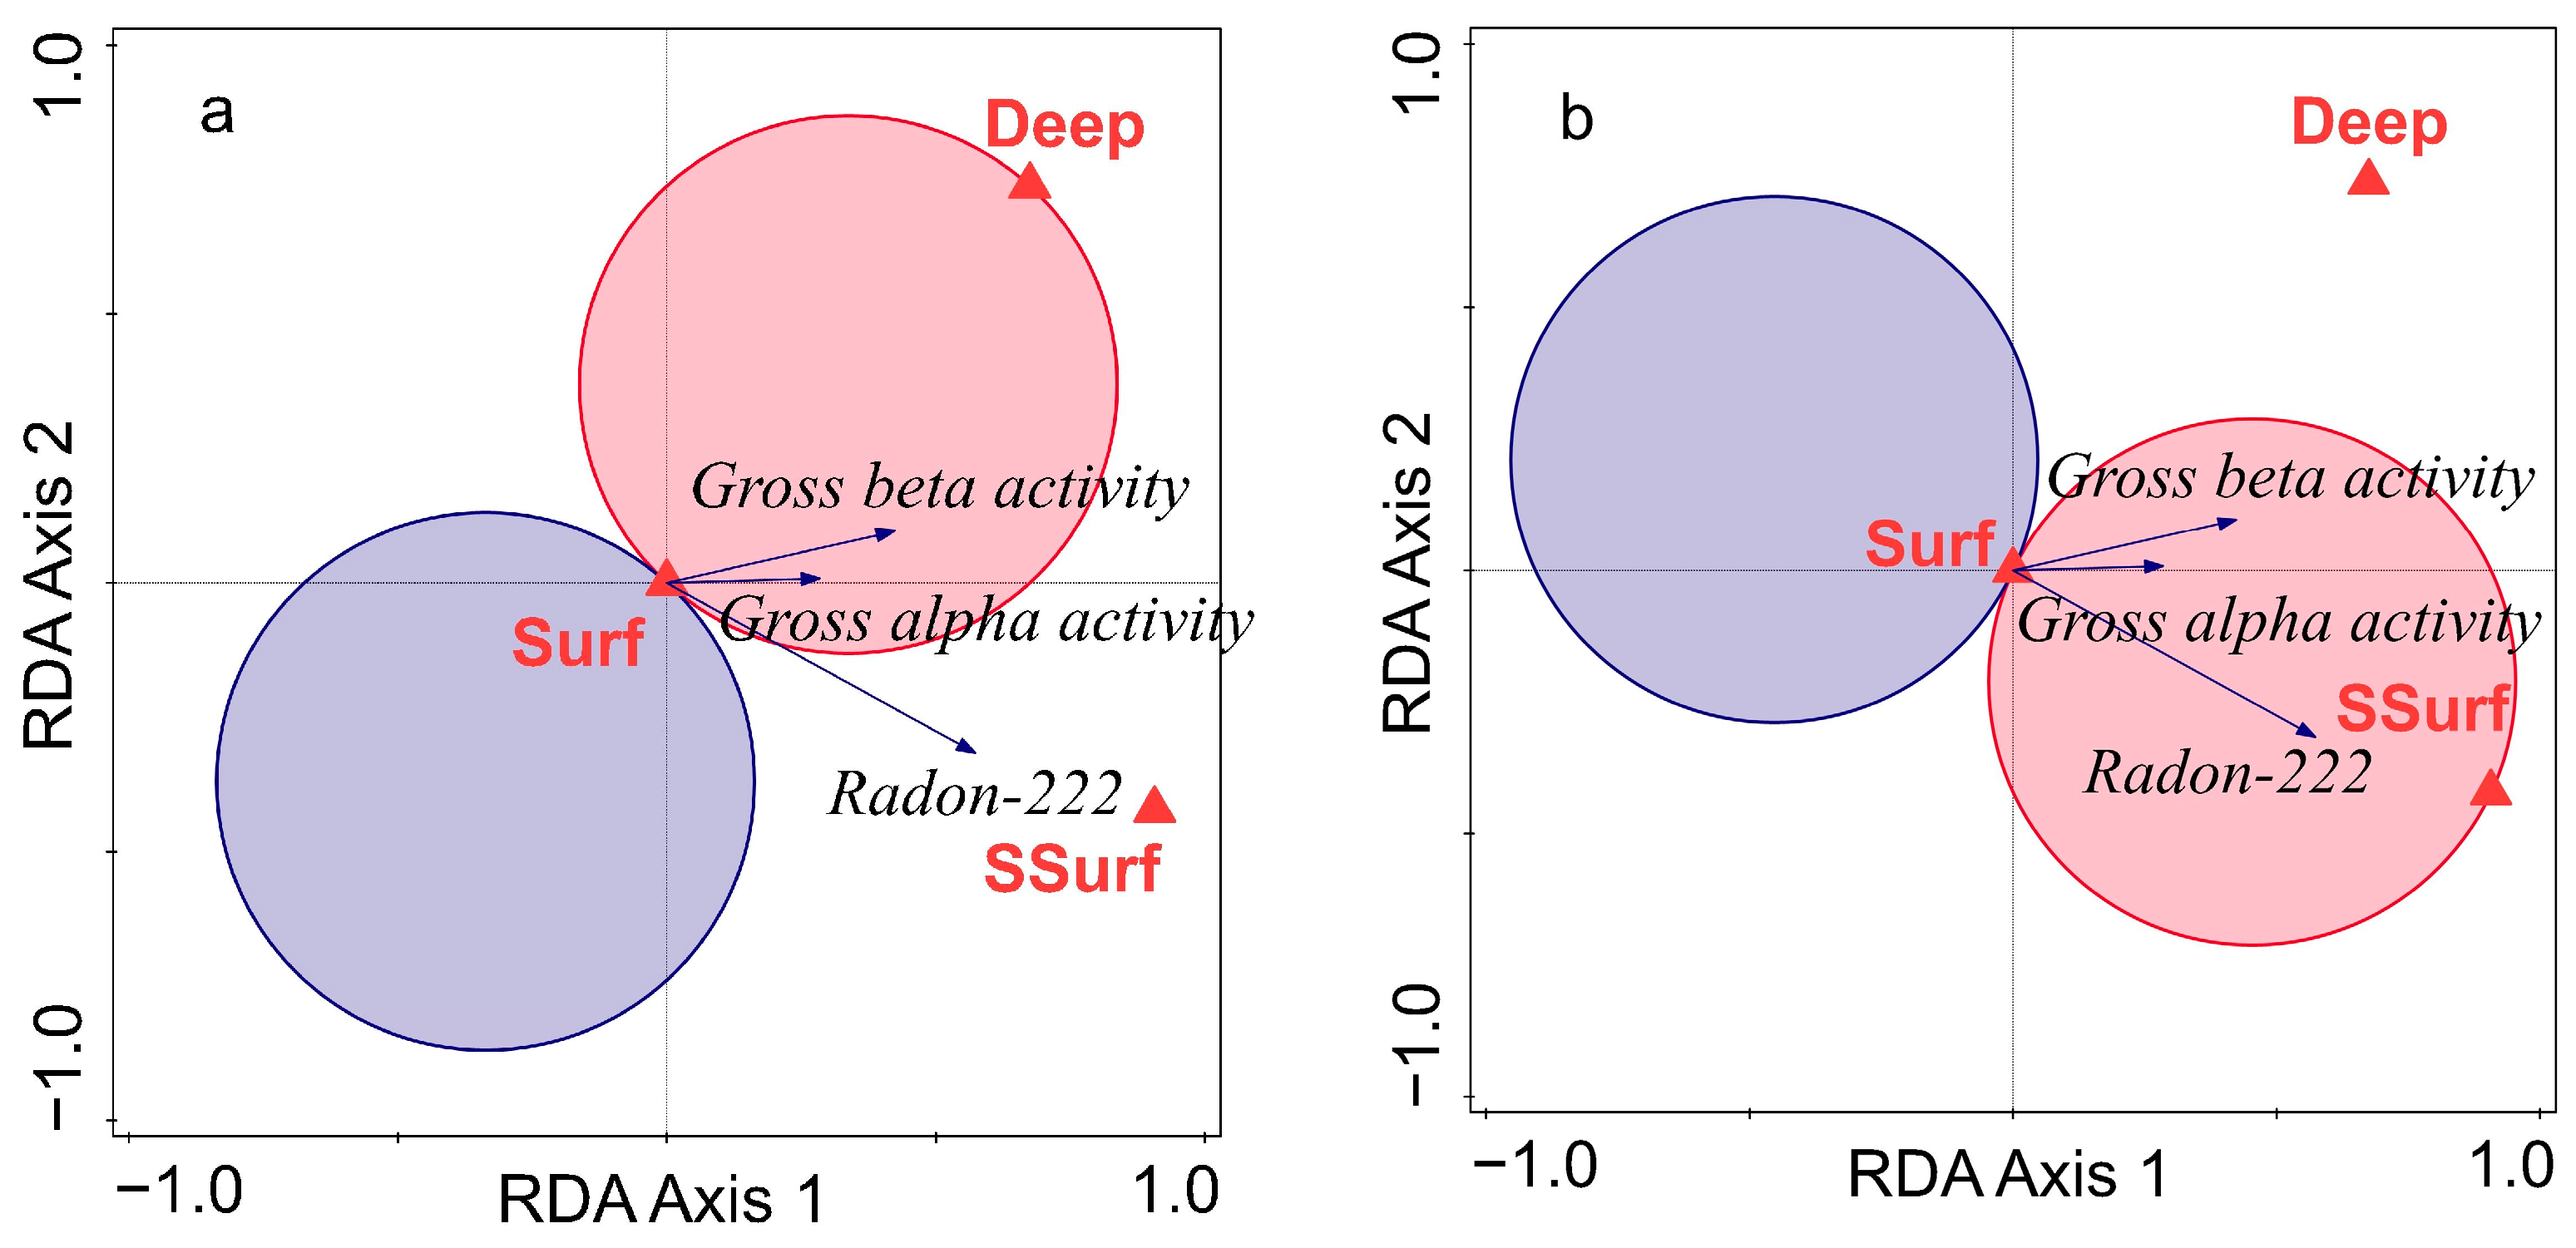
2.3. Statistical Modeling

The effect of the water source type and year of measurement on the gross alpha and gross beta activity and radon-222 content considering local variations was evaluated. Because the differences between deep (Deep) and subsurface (SSurf) water were not significant, we considered the water source as a factor with two levels, groundwater (Ground) and surface (Surf). The year of measurement was considered as a numeric variable starting with 2017 (the beginning of the study), because we proposed to test the potential linear trend of the radiation level. We used the GLMM with gamma distribution (the data were overdispersed and residuals were not normally distributed) and logarithmic link function, including locality as a random factor, because of repeated sampling. When the effect of the random factor was not significant, we reported the results of the corresponding generalized linear model (GLM). The explained variation in GLMs was expressed as the explained deviation. In GLMMs the partition of the variation explained by the fixed and random effects was carried out using the marginal and conditional lognormal R squared.
The correlation between water physical-chemical parameters was evaluated based on the repeated measures (within localities) correlation coefficient calculated with package mrcorr [56] in R version 4.1.0 [57], using bootstrapping with 100 resamples. We ran the correlation analyses both with and without the outliers, and reported all results when significant (or marginally significant).
To evaluate the overall response of physical-chemical parameters to water source and sampling year, we used multivariate linear redundancy analysis (RDA), performed using the Canoco 5.12 software [58]. In the RDA, multiple numerical response variables (in our case the physical-chemical parameters and, separately, the radioactivity level) are regressed against one or, more often, several predictors (explanatory variables) that may be of different type (numerical or categorical—in our case, water source and sampling locality, year and month), which are combined in independent (orthogonal) constrained ordination axes (usually the first two are represented in the ordination diagrams) which explain most variation in the response variables, their explanatory power decreasing gradually. In the ordination diagrams the response variables are represented by arrows. The longer the arrow, the better the response variable is explained by the predictors. The projection of the arrowhead on the axes gives the degree of dependence of the response variable to the constrained axis. The angle between arrows indicates the correlation between the response variables (positive for acute angles and negative for obtuse ones). Numerical predictors are also represented by arrows and their projection on the axes illustrates their contribution to those axes. However, in our case the numerical predictor (the year) was not significant in the multivariate models. Levels of factors are represented by the centroids of the data points corresponding to each level. Their effect on the response variables is given by the projection on the arrows. When the differences between deep and subsurface water were significant, we considered the water source as a factor with all three levels (Deep, Ssurf, and Surf). The significance of ordination axes was tested by the Monte Carlo permutation test with 999 unrestricted permutations per test [59]. The significance of physical-chemical parameters’ responses (either positive or negative) to individual predictors was evaluated visually, constructing the t-value biplots (with van Dobben circles). To evaluate the relationship between radioactivity and the other physical-chemical parameters, we performed a co-inertia analysis using the Canoco software [58]. The co-inertia analysis is a symmetrical analysis of the covariance of two sets of variables, plotting them in the same ordination space.
Statistical models are developed to explain and predict patterns in observed phenomena. However, the evaluation of the predictive value of models requires dividing the data into a training and a testing dataset, which was not possible because of the limited number of observations.
Because Rn-222 measurements were carried out only in 2020 and 2021, models including radon are based on 26 samples (from 2020 and 2021), while models without radon are based on all 65 samples.

3. Results and Discussion

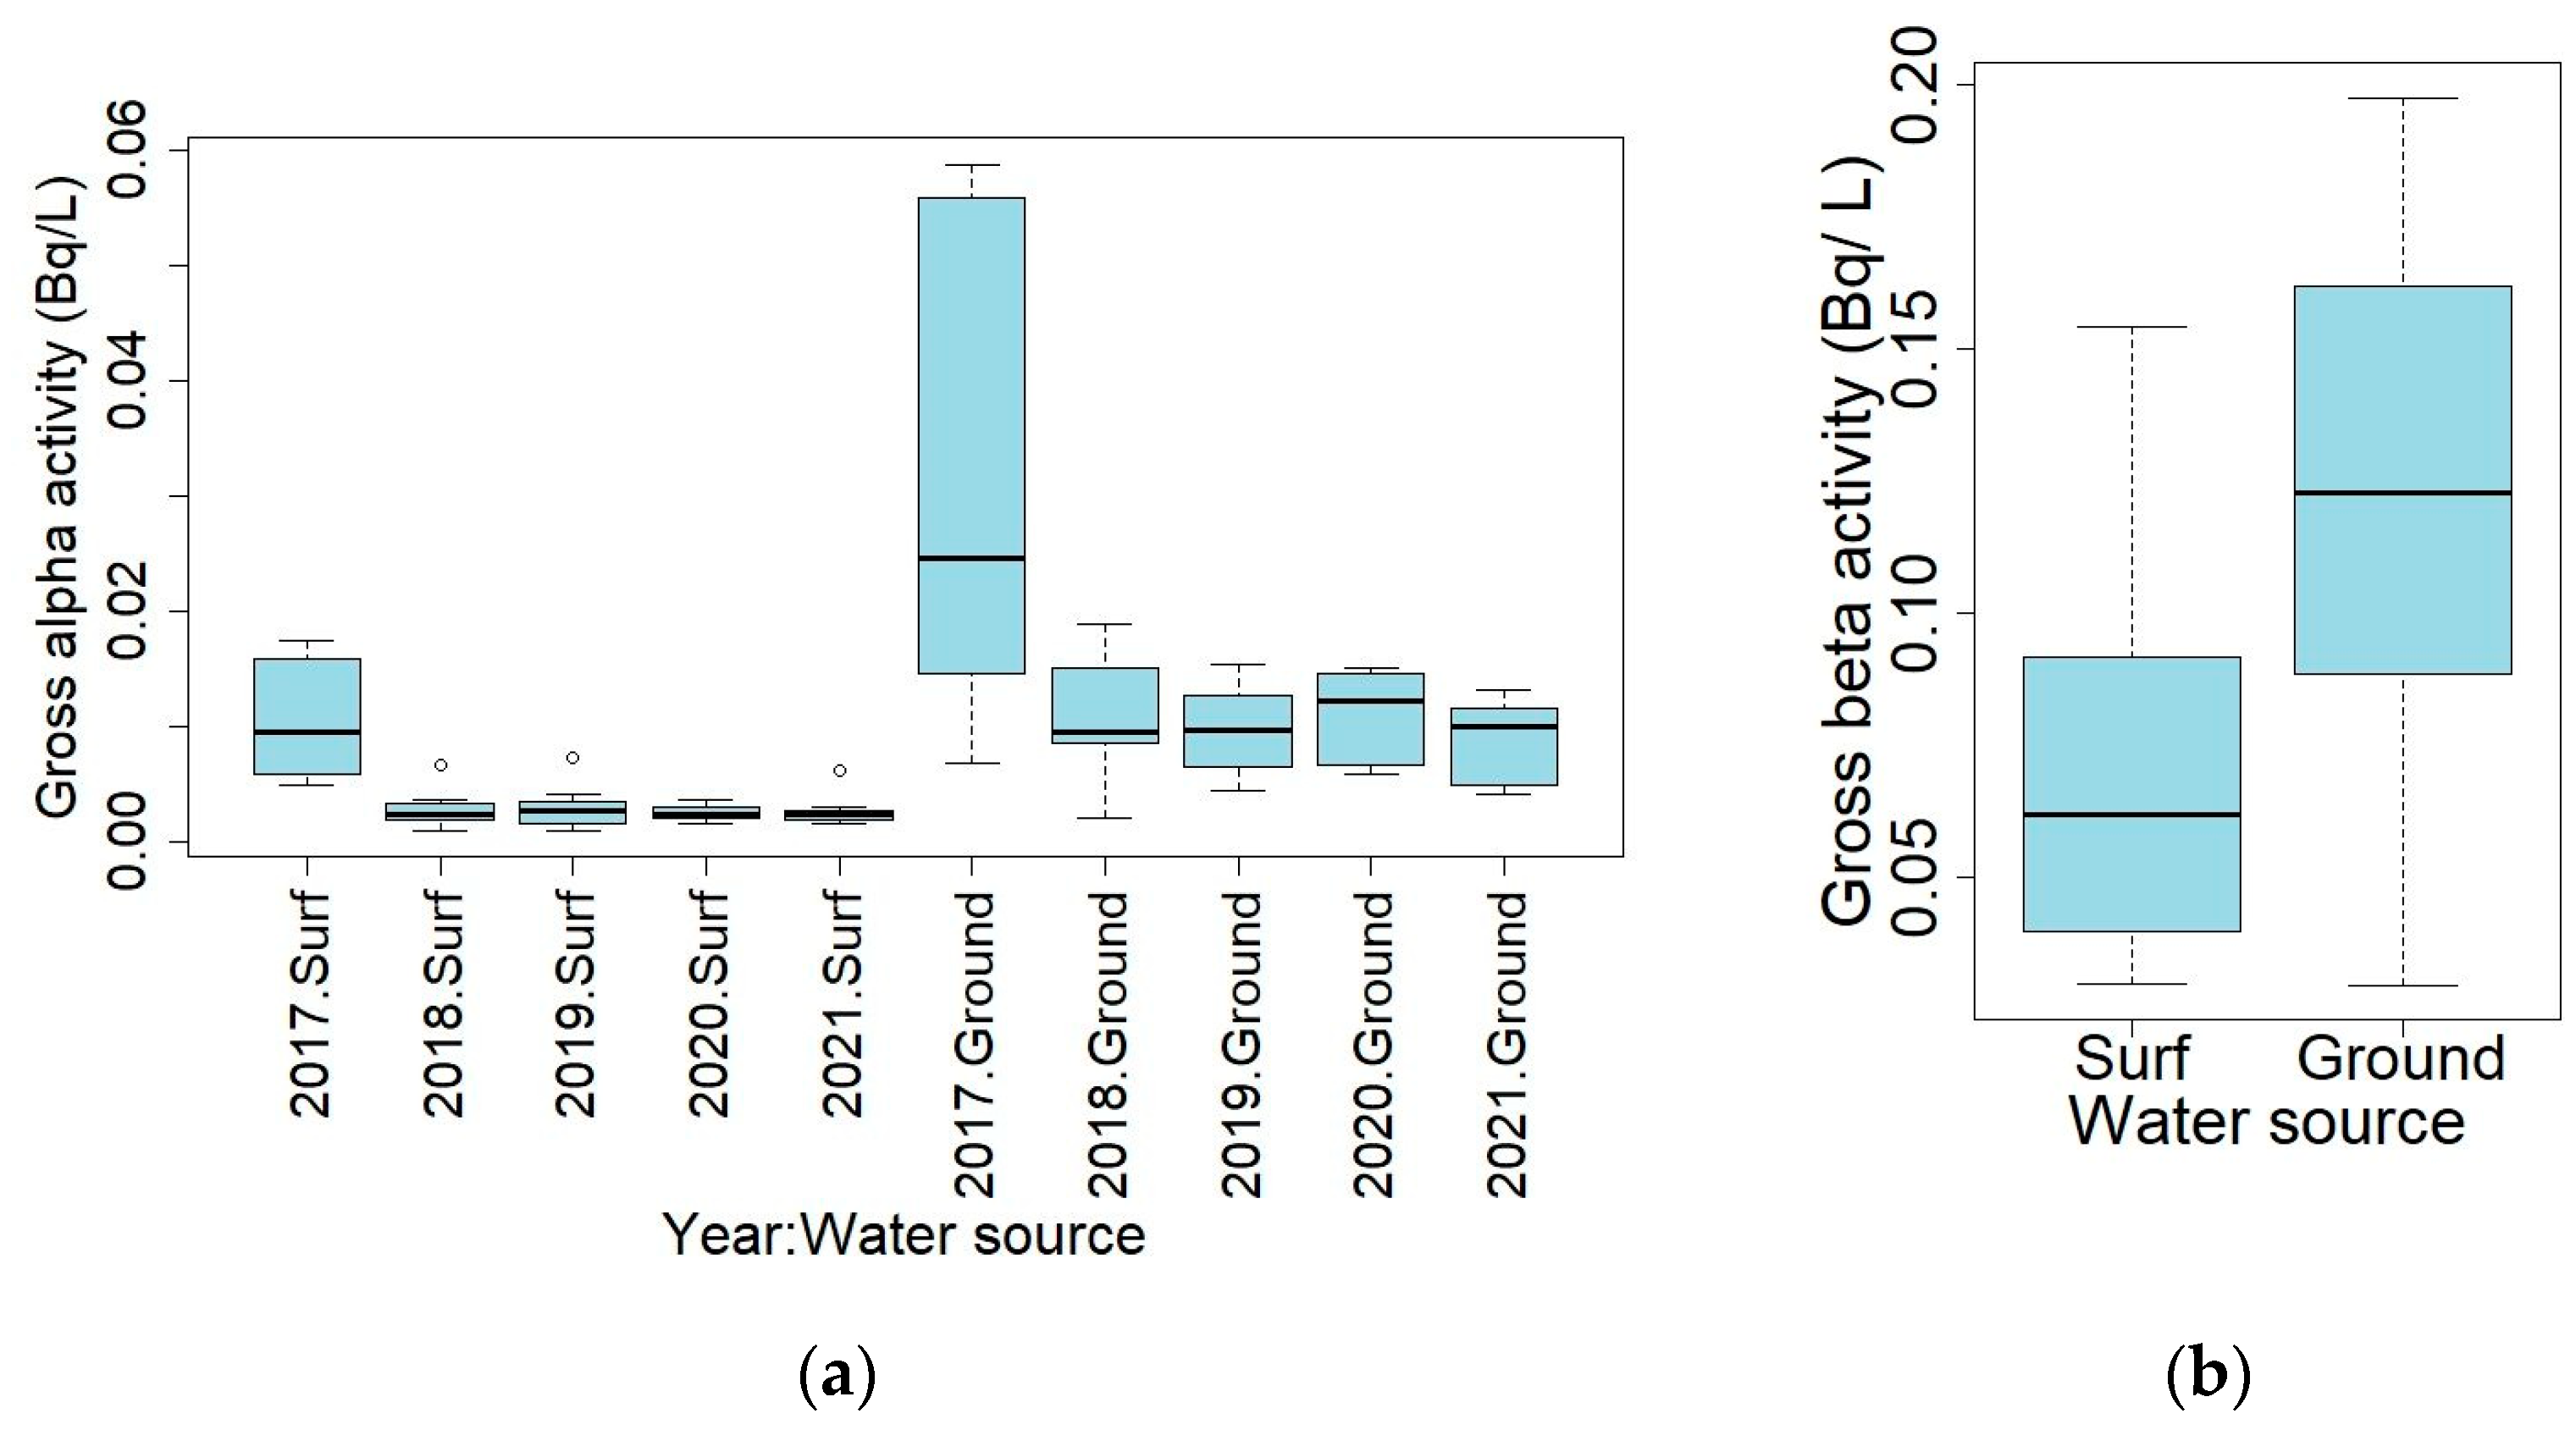
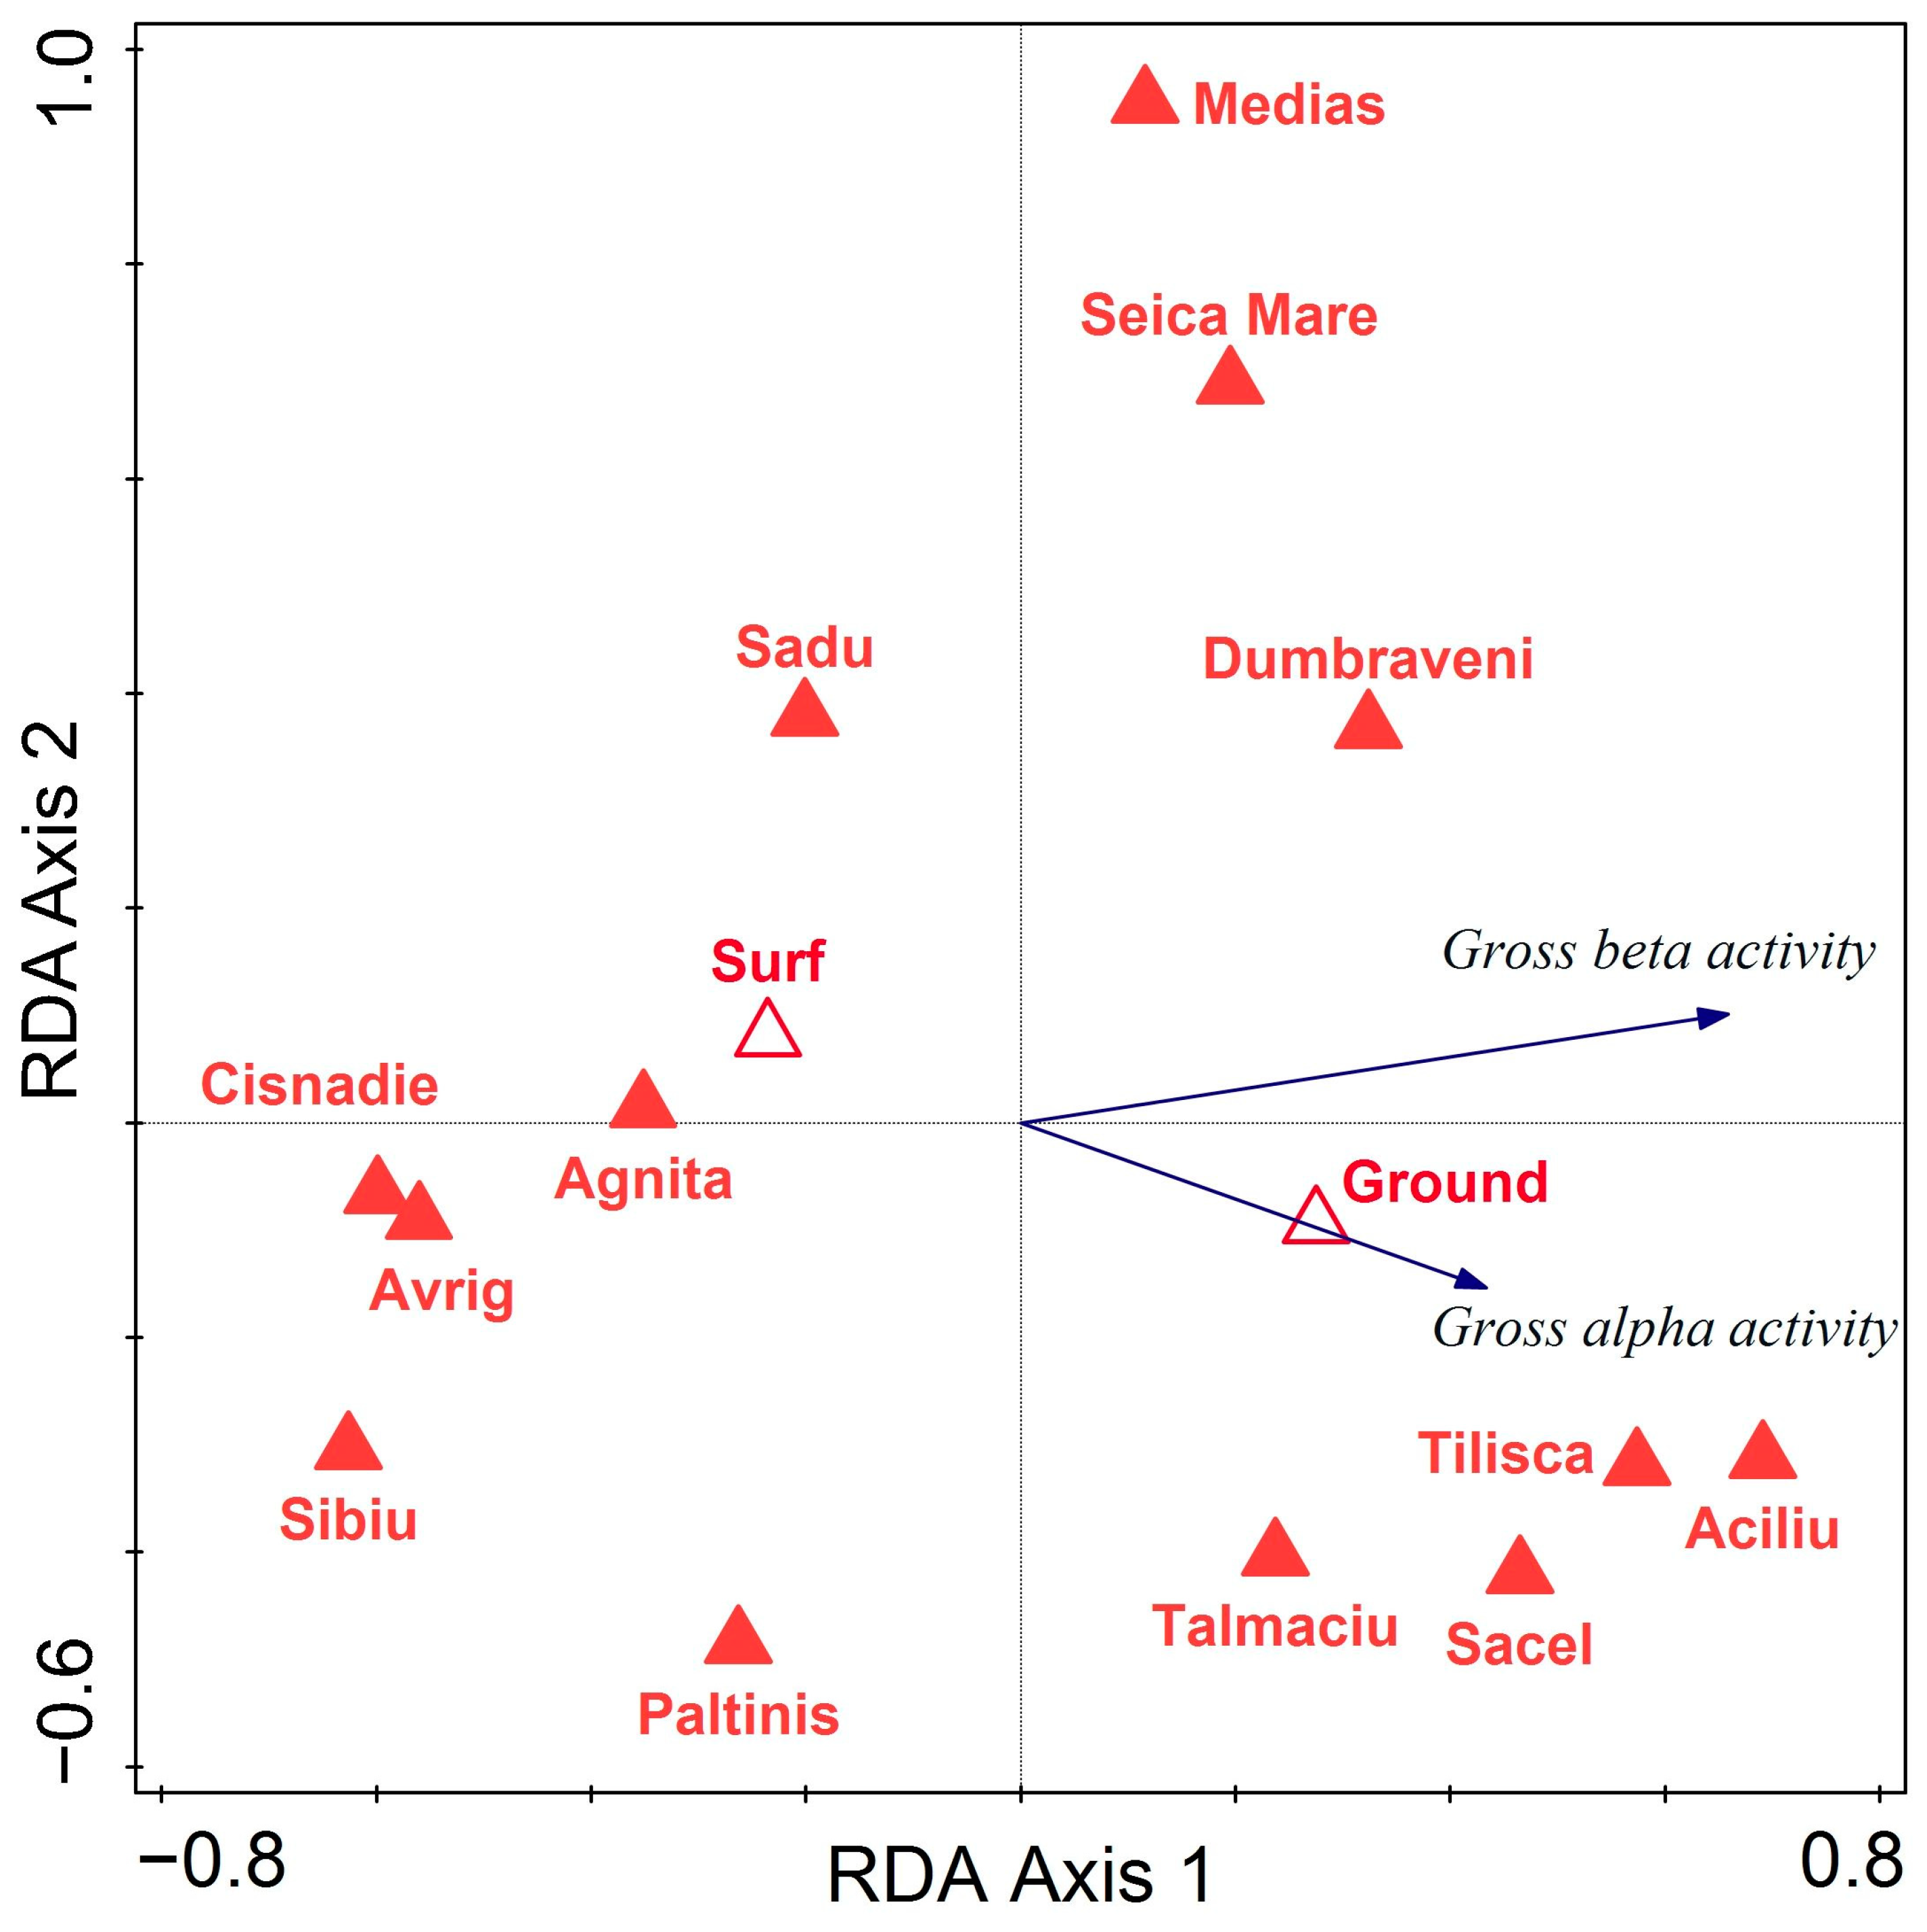
3.1. Radioactivity Parameters of Drinking Water in the Studied Area

All measured values of gross alpha and beta activities and radon-222 were situated within the allowable values.
The gross alpha activity increased during the study period from 2017 to 2021 and varied between sources, being higher in groundwater (Ground) than in surface water (Surf).
The best fitted model for gross alpha activity and gross beta activity after removing the outlier (sample 61—Tilișca 2017) was the GLM with gamma distribution. By including the locality as a random effect (in mixed models) the quality of the model did not increase, which means that there were no significant differences among localities that were not explained by source. The mean gross alpha activity for the first year of study, 2017, in the localities with groundwater was 0.03 Bq/L. Each year the mean value of this parameter decreased by 25% (χ2 = 29, df = 1, p < 0.001), and in localities with surface water the mean gross alpha activity was 71% lower compared to that of groundwater (χ2 = 49.17, df = 1, p < 0.001) (Figure 2a). The explained deviation of the gross alpha activity model was 60.8%. The mean gross beta activity of groundwater was 0.122 Bq/L; it was 0.05 lower in surface waters, the difference showing significance (t = −5.24, df = 62, p < 0.001) (Figure 2b), and the explained variation being 29.6%.
The value of radon-222 from Păltiniș source was considered an outlier, with a mean value of 40.4 Bq/L, while the mean value for the other localities was 1.1 Bq/L; therefore, we excluded Păltiniș from the data analysis by this statistical modeling. The best fitted model was a GLMM with gamma error distribution. The variance of radon-222 concentration among localities was 1.54 and the mean value for localities with Ground was 1.89. In localities with Surf, the mean radon-222 concentration was 96% lower and the difference was highly significant (t = −8.83, df = 22, p < 0.001).
Most of the variation explained by the model was attributed to differences in the water source (0.91), and only a small part was represented by the local variations among the localities (0.05).
The three types of water source were the best predictors of the radiation parameters (pseudo-F = 10.8, p = 0.001), explaining 48.4% (43.9% adjusted) of the variation in the response variables. The comparison between constrained and unconstrained analyses showed a high efficiency of the first constrained (RDA) axis, which summarized 75.7% of the variation explained by the homologous unconstrained (PCA) axis, the correlation between these axes being 0.87. The first constrained axis was the only one significant (pseudo-F = 9.5, p = 0.001), extracting 93.7% of the explained variation. This axis was defined mainly by the opposition between surface and groundwater sources. Along this axis all radioactivity parameters increased from Surf to Deep and SSurf (Figure 3). The gross alpha and beta activities were higher in Deep compared to Surf (Figure 4a), while all three radioactivity parameters were significantly higher in SSurf compared to Surf (Figure 4b).
However, the high level of variation explained by this model is given mainly by the particularly high radon-222 values of water from Păltiniș, which has a SSurf water source. By considering only the gross alpha and beta activities, along with the locality, the model was still significant (pseudo-F = 2.1, p = 0.012), but the explained variation was lower, namely, 32.7% (17.3% adjusted). The localities were scattered in the ordination space (Figure 5).
The first ordination axis, which was the only significant one (pseudo-F = 2, p = 0.012), was given by the opposition between Surf and Ground water sources, with gross alpha and beta activities increasing in localities with Ground water sources. The radioactivity level of Sibiu and other large towns (Cisnădie, Avrig) using Surf water was lowest, while some smaller localities (Aciliu, Tilișca, Săcel) using Ground water, with the exception of Tilișca, showed the highest radioactivity level (Figure 5). Tilișca, which uses Surf water, is close to Aciliu, and the geology of the site may explain the particular radioactivity of this source. In the underground of the Tilișca locality, Dordea [60] mentioned the presence of gneiss rocks, exploited as a valuable resource for the construction industry [61]. Otoo et al. [46] observed that due to its properties (density, durability, and water absorption capacity), this rock stores many natural radionuclides, including 226Ra [61,62], which contributes significantly to the gross alpha activity [63], and 40K [61], which plays an important role in the gross beta activity [63], also showing a significant positive correlation with 222Rn abundance [61]. Other rocks described as being associated with high radon levels, especially in groundwater, are granite [62,64,65], shale, and phyllite [64]. Thus, the presence of such rock types could contribute to the unexpected high levels of water gross alpha and beta activities from the three localities. Furthermore, in the case of wells, Knutsson and Olofsson [66] explained that the way these are used and the type of technical plant of groundwater extraction can influence the amount of radon in the water.
Regarding the Aciliu locality, Ion [67] mentioned the frequency of landslides in the Aciliu-Apoldu area, a fact that can be associated with the reduction in surface and underground water quality [68], but also with higher amounts of radionuclides [69,70].
Although the locality of Săcel is known for its industrial limestone [60], the presence of this mineral cannot explain the higher radioactivity of the water, as it is usually associated with a lower quantity of radionuclides [71], but the activities related to its extraction and industrial use [72] could support the increase of the gross alpha and beta activities.
According to the national report, in 2021 the radioactivity parameters of drinking water in Romania were situated below the allowable values. Compared to the national level, Sibiu County belongs to the areas with the lowest values of gross alpha and beta activities [73]. The maximal value of Rn-222 in the sample from Păltiniș (43.3 Bq/L) could be explained by the geology (crystalline schist) of the study site—Cindrel Mountains in the Southern Carpathians. Regarding the radioactivity of groundwater, similar results were reported in the Galati region of Romania, the highest gross alpha and beta activities being found in samples collected from drilled wells [74]. Recently, a radiological investigation of 64 samples of natural carbonated water originating from four Romanian counties, namely, Covasna, Harghita, Bistrița-Năsăud, and Maramureș revealed that 53.5% and 26% of the investigated samples exceeded the allowed values for gross alpha activity and gross beta activity, respectively, which was attributed to the presence of volcanic rocks in the studied area [75].
Table 2 highlights the radioactivity parameters (mean values) measured in drinking water from different areas of Romania. In this respect, regional models of water radioactivity parameters relating to the water sources as the best predictor should support more action from the local public health authorities.

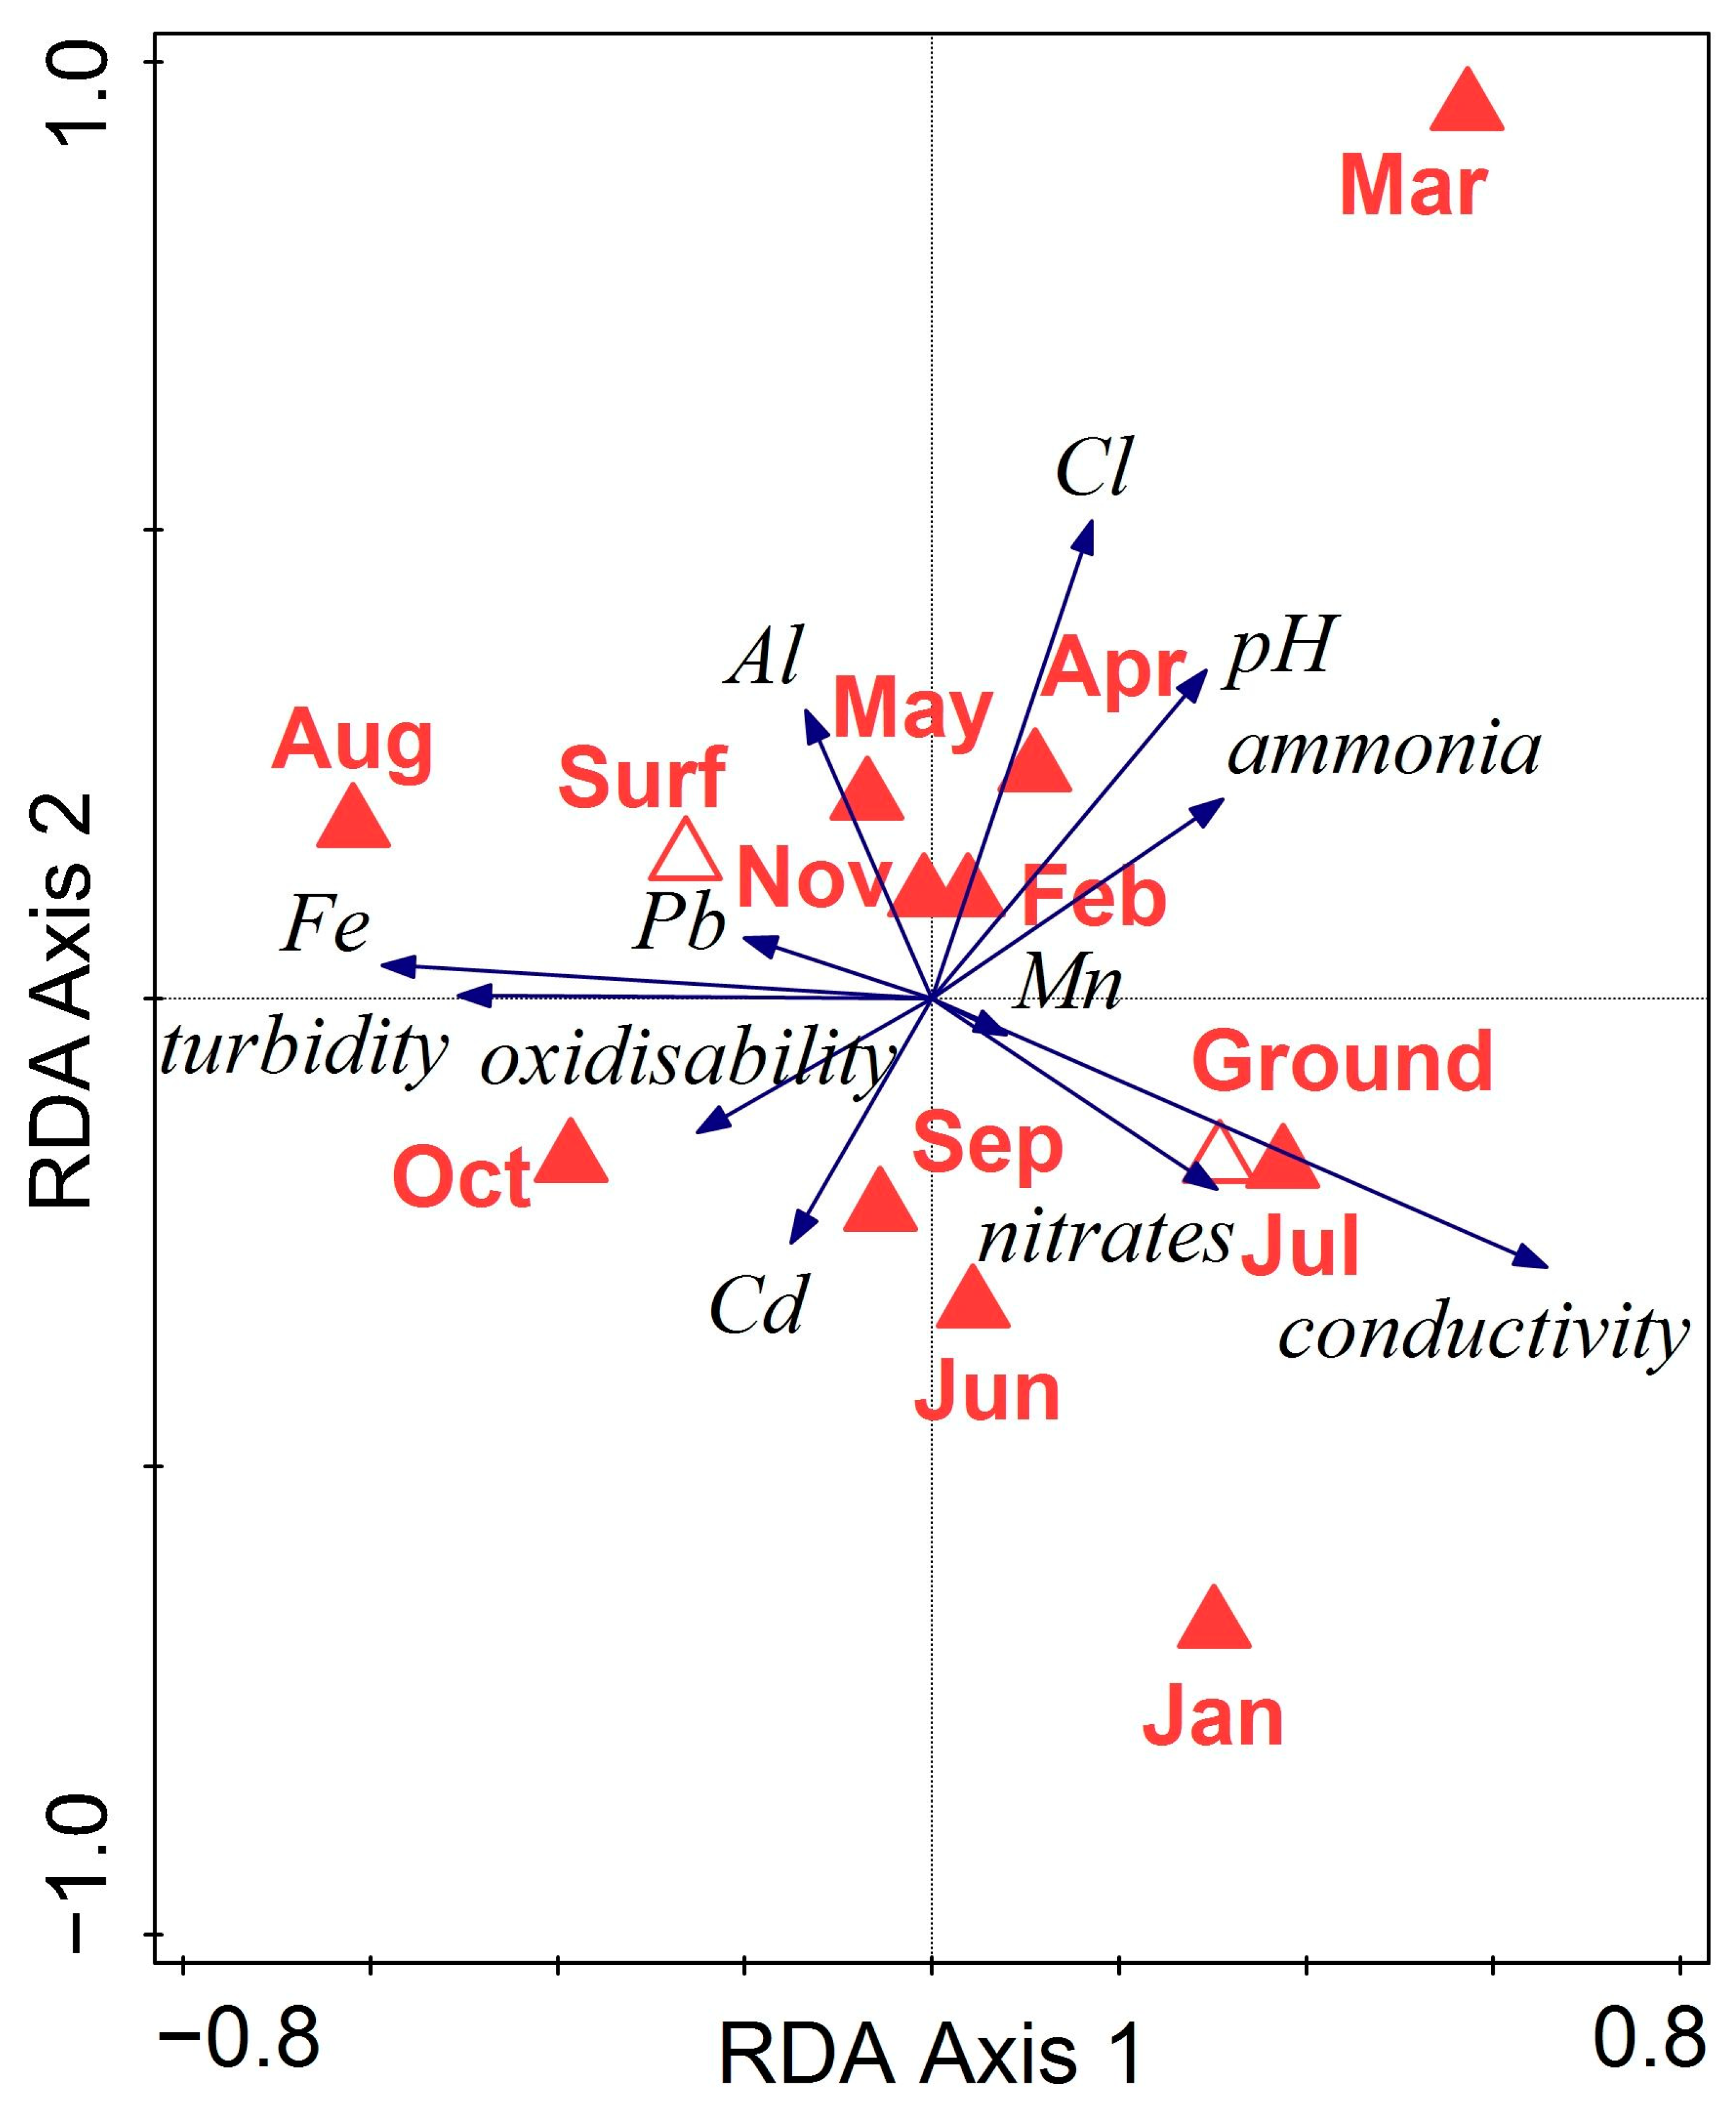
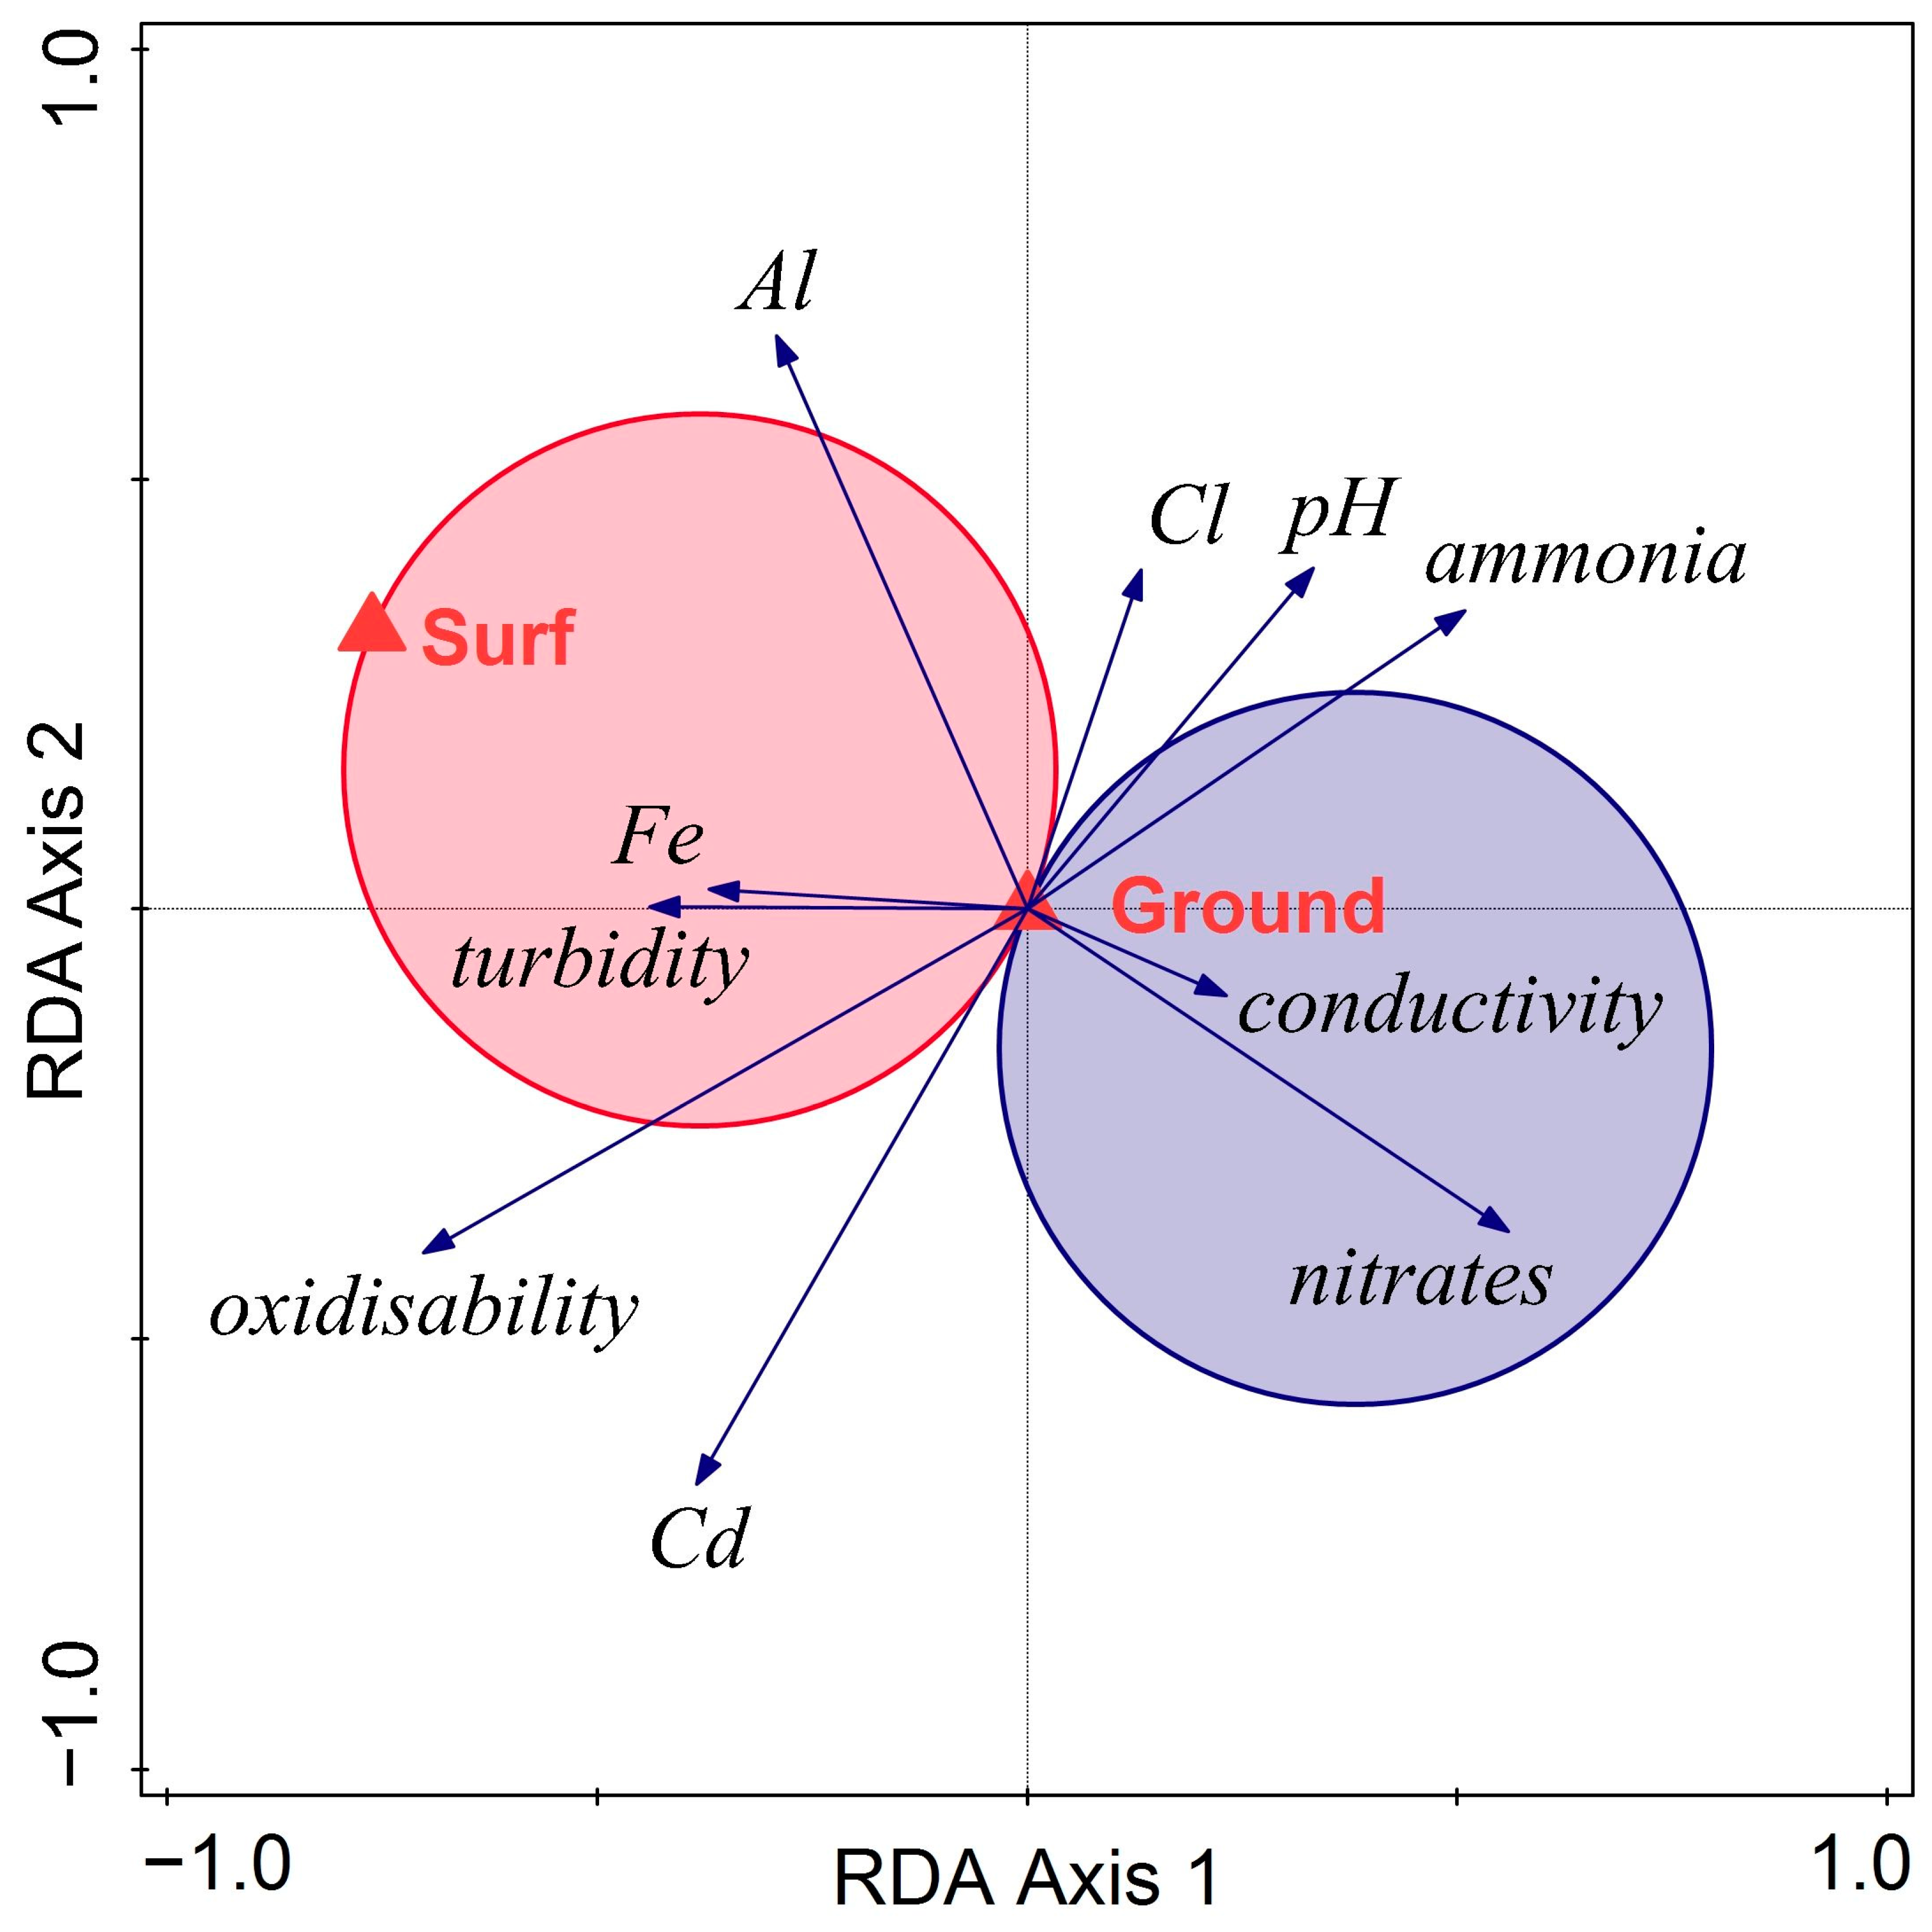
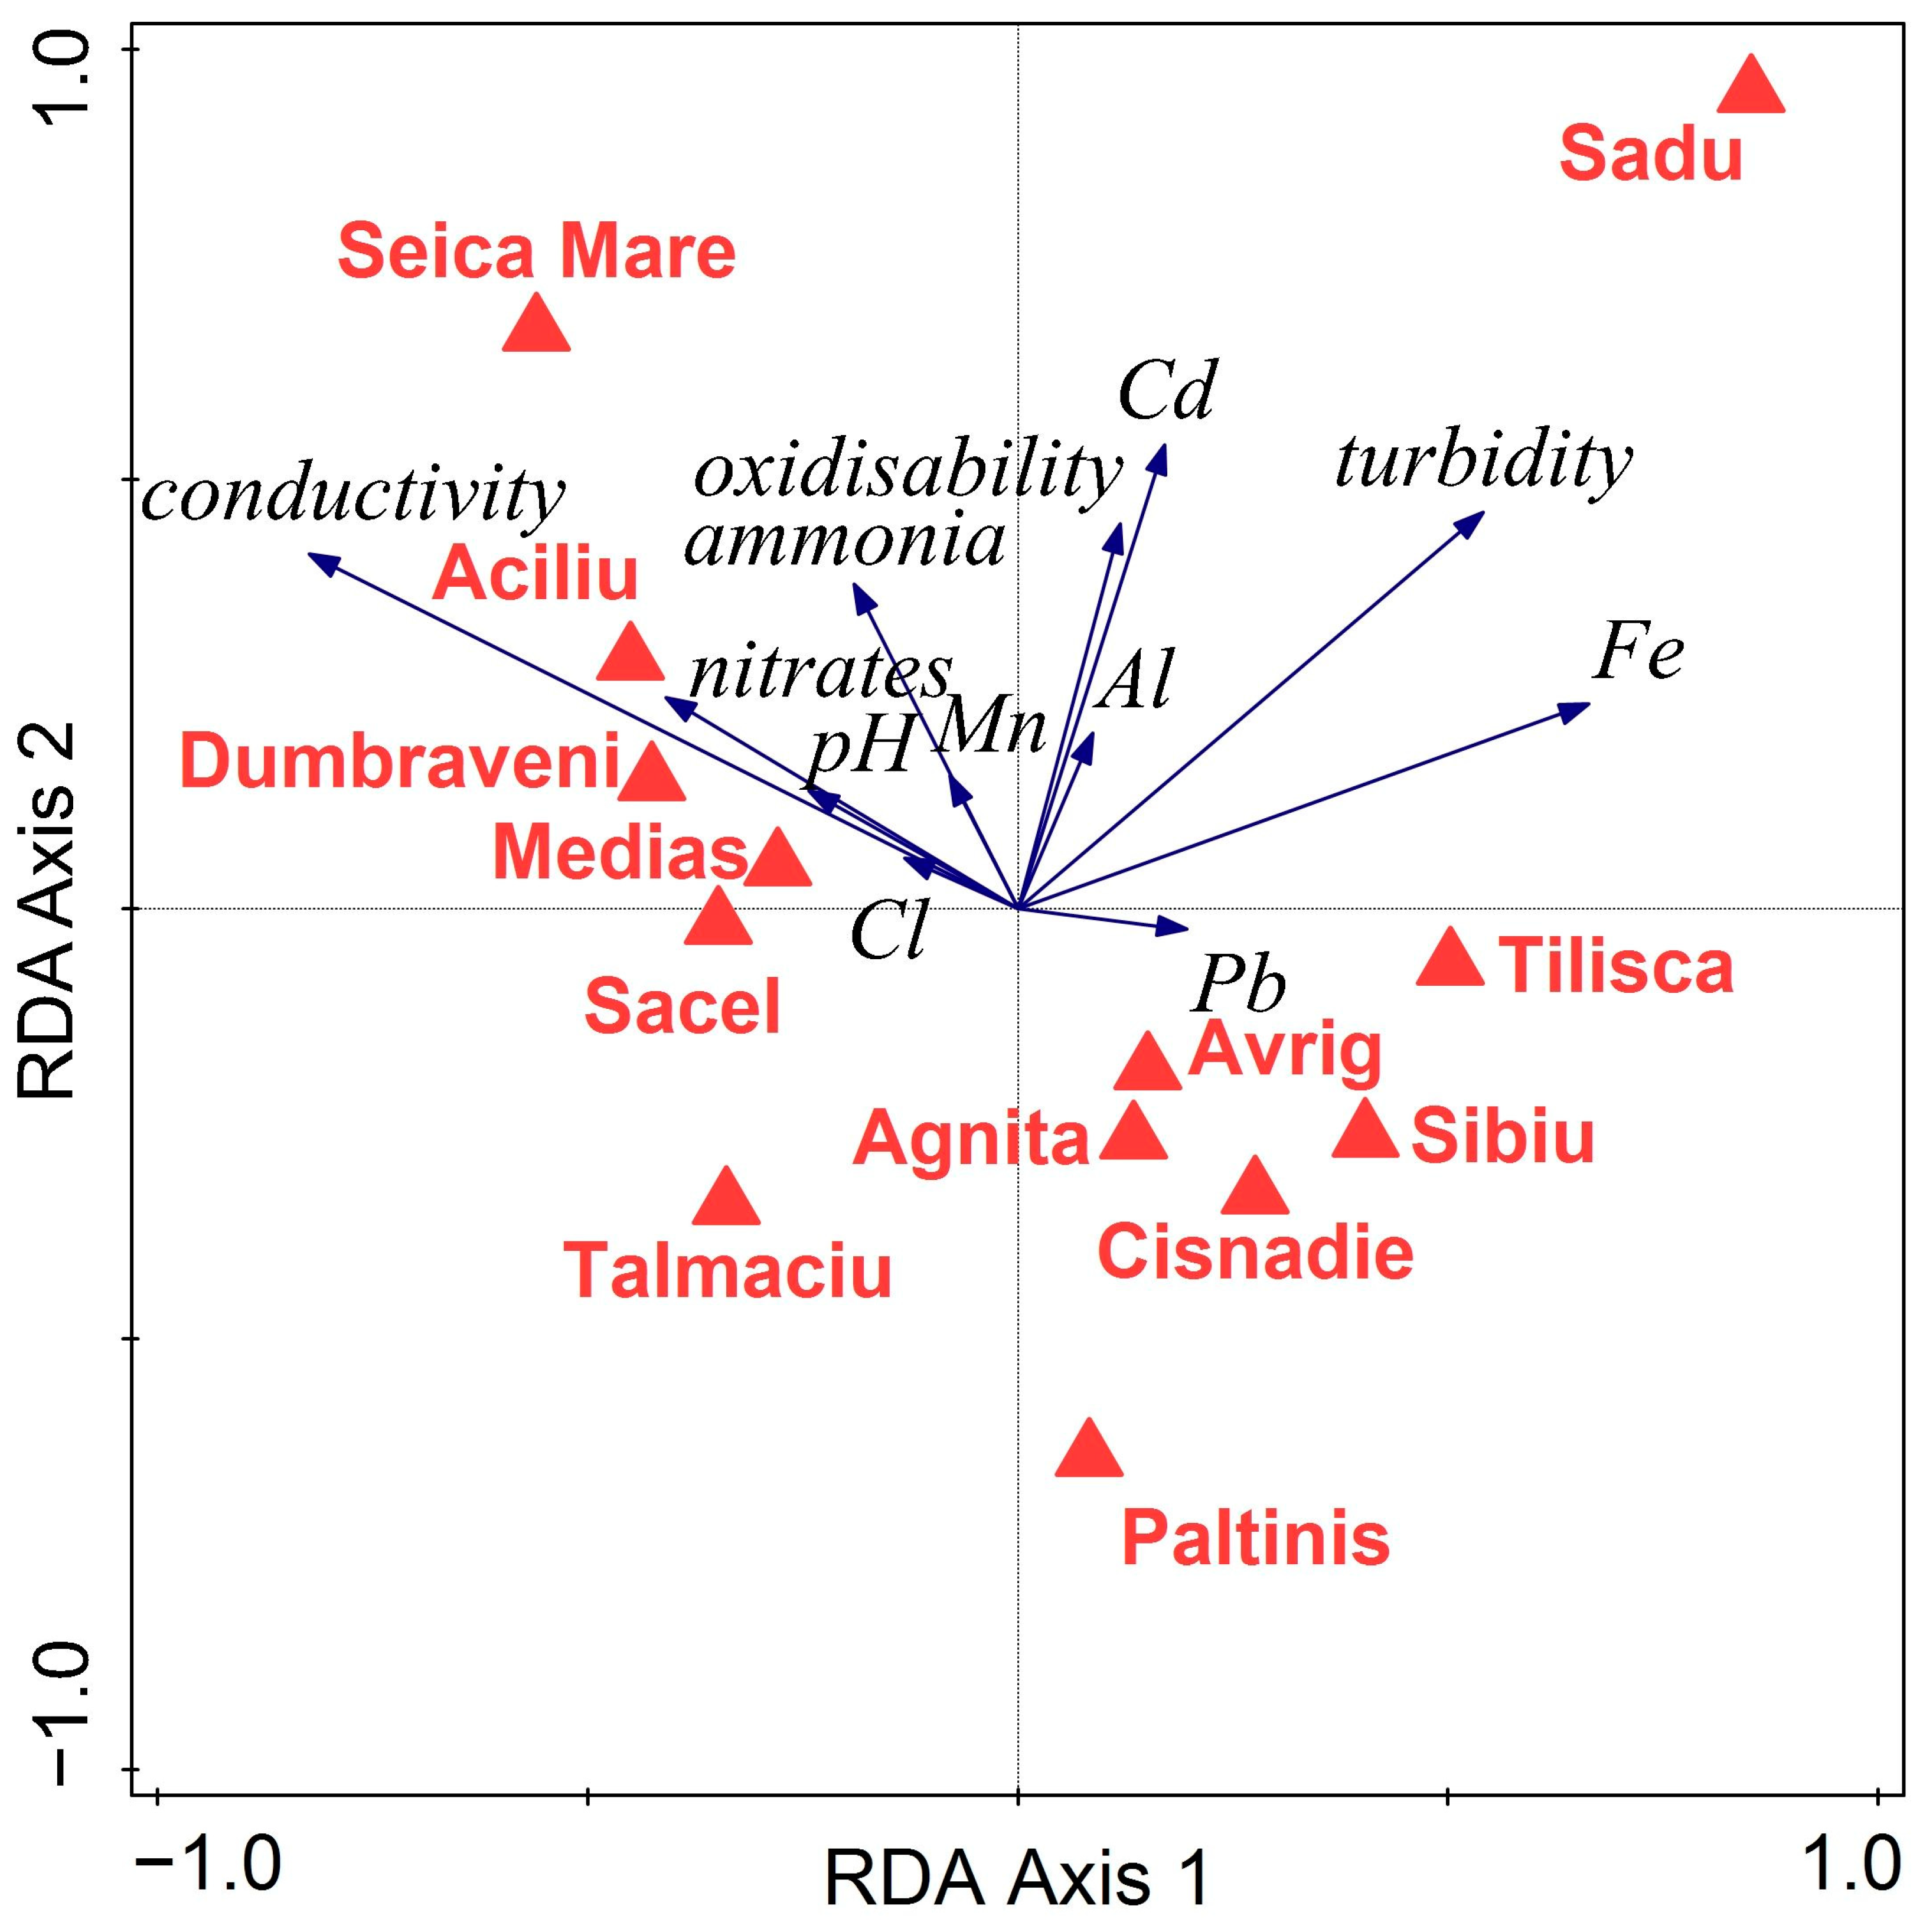
3.2. Physical-Chemical Parameters of Investigated Drinking Water Samples

Among the 65 investigated water samples, 16 samples exceeded the allowed values for Fe, ammonia, and residual free chlorine (Table 3). The appearance of free chlorine residue is associated to a certain extent with the treatment of water with chlorine, its used amount being increased above the well-established minimum values in isolated cases such as the possibility of transmitting a disease through water [78]. However, the level of residual free chlorine in the water can be more definitely increased in the case of organic contamination, for example, with the droppings of farm animals [79].
The geological substrate, the level of anthropic impact, the existence of some industrial activities that use iron, and the contamination with household sewage residues can lead to increased values of iron in the water [80,81]. Similarly, the high level of ammonium can also come from anthropogenic [82,83] and industrial [83] activities, from animal droppings [79,83], and from the use of chemical fertilizers for agriculture [83,84], or it can be influenced by the pH and temperature in the environment [82].
Regarding chemical composition, the water sources from Avrig, Cisnădie, Dumbrăveni, Păltiniș, and Tălmaciu meet all quality criteria within the studied period.
Physical parameters (pH, conductivity, turbidity, and oxidizability) were found within the allowed values for the 5-year study period. Significant correlations were found between some of the chemical parameters (Table 4).
The water sources (Surf and Ground) and sampling month explained 29.1% (14.4%) of the variation in the physical and chemical parameters (pseudo-F = 2, p = 0.004). The first constrained axis was the only one significant (pseudo-F = 0.7, p = 0.002), extracting 42.5% of the explained variation. This axis was defined mainly by the opposition between Surf and Ground water sources but also by some monthly variation. Along this axis, turbidity and Fe showed the highest values in Surf samples, while conductivity, nitrates, ammonia, and pH showed the highest values in Ground samples (Figure 6), the response to the water source being significant for Fe, turbidity, conductivity, and nitrates (Figure 7). Among the sampling months, August was characterized by high values of Fe level and turbidity, March by high pH and concentrations of residual chlorine and ammonia, and January by high values of conductivity and nitrates but also Cd and oxidizability (Figure 6).
The locality explained 37.6% (23.2%) of the variation in the physical and chemical parameters (pseudo-F = 2.6, p = 0.001), the first two constrained axes being significant, accounting for 39.6% (pseudo-F = 0.8, p = 0.001) and 27.1% (pseudo-F = 0.7, p = 0.002) of the explained variation (Figure 8). Along the first axis, conductivity and ammonia were negatively correlated with Fe and turbidity. Along the second axis, all response variables were positively correlated. The locality with the most distinctive chemical composition of water was Sadu. It was characterized by the highest values of turbidity, Fe, Cd, Al, and oxidizability, but also of ammonia and Mn. Șeica-Mare also showed distinct water characteristics, with high values of conductivity, nitrates, pH, residual chlorine, ammonia, and Mn. On the other hand, Păltiniș showed the lowest values of Cd, Al, oxidizability, ammonia, and Mn. Sibiu and the other large towns had similar water physical-chemical characteristics, with low values of conductivity, nitrates, pH, and residual chlorine.
The national report highlights Mn, Fe, ammonia, and nitrates as the main chemical parameters exceeding the allowed values for some chemicals, from 15% for Mn to 7.8% for nitrates, of all samples collected in 2021 from small supply zones all over the country [73]. Similarly, other countries like Iran reported Fe and Mn as dominant metals exceeding allowed values [85]. According to the Council Directive 98/83/EC [86], a parameter’s variability and the long-term trend of its concentration should determine the location and frequency of sampling.
In our spatiotemporal model of analysis, the variation of physical and chemical parameters is explained by the water sources (Surf and Ground), sampling month, and locality. In the past, the city of Medias was polluted with heavy metals from a neighboring metallurgic plant, but recent research performed on local drinking water sources indicates a low level of pollution with Cd, Ni, Cr, Pb, and As [87]. In certain situations, chemical heterogeneity may refer to inadequate treatment in water plants, or post-treatment contamination in the distribution pipes, explaining the high concentrations of Mn, Fe, and nitrates [88]. Nitrates and nitrites, often associated with anthropogenic activities, are involved in the maintenance and development of microorganisms which can influence water turbidity [89,90]. Thus, new methods for a combined evaluation of physical-chemical parameters and microbiome data have been developed [91].
In other countries, Spain for example, it has been found that the total water hardness, potassium, and pH influenced radioactivity levels [92].
The co-inertia analysis between radioactivity and physical-chemical parameters showed a negative correlation between the gross alpha activity and nitrates, oxidizability, and conductivity, and a positive correlation with turbidity and residual chlorine. The gross beta activity was positively correlated with conductivity, Cd, and Mn, and negatively correlated with Fe (Figure 9).
Multivariate statistical techniques were used by other researchers to evaluate the spatial and temporal variations in the raw water quality, mostly as ecological studies [93,94,95,96] and less as public health studies on drinking water supplies [97]. Thus, the present study provides a method of multivariate modeling of data of relevant parameters periodically analyzed in all supply zones of the study area from a public health perspective. This model cannot be generalized, given the different environmental conditions and the complex interactions among the water quality indicators. This approach integrates parameters (routinely monitored), geography, and periodicity of sampling. It provides a multivariate analysis perspective to find the relationship between meaningful parameters susceptible to long-term health consequences and their predictions. The seasonal/monthly significant variation of some chemical contaminants may support the adjustment of the monitoring plan in terms of sampling frequency, and this is one of the most important aspects revealed by this method.

4. Conclusions

The spatiotemporal multivariate evaluation of drinking water from different supply zones located in Sibiu County, Romania, provides a comprehensive view and allows observations on the correlations and variability of quality parameters in relationship with the water source, location, and period of sampling. The validity of the hereby applied statistical techniques was confirmed by results.
For all radioactivity parameters, the water source was the best predictor in the fitted model of GLM with gamma distribution (for gross alpha activity and gross beta activity, respectively), and GLMM with gamma error distribution (for Rn-222 content). According to the RDA results, water radioactivity increased from surface to deep and subsurface sources. The co-inertia analysis between radioactivity and physical-chemical parameters showed a positive correlation of the gross alpha activity with turbidity and residual chlorine, while the gross beta activity was positively correlated with conductivity, Cd, and Mn. Water radioactivity in Sibiu County is low, compared to other investigated areas, but further studies are required for examining groundwater sources used by small communities.
Certain chemical contaminants such as ammonia and Fe may be of concern, especially ammonia in rural localities due to agricultural practices and the pastoral character of the area. The variability of the physical-chemical parameters and 5-year trend is explained (RDA) by the water source, month of sampling, and locality. Results are significant for turbidity and Fe level in surface water (with highest values in August), and for conductivity and nitrates level in ground water (with high values in January). High pH and concentrations of residual chlorine and ammonia were characteristic for March. This monthly variation of contaminants may be useful for more efficient operational management and population awareness, with particular interest for the rural localities of Sadu and Șeica-Mare. The present model highlights that the water source from the mountain resort Păltiniș was the best drinking water in the studied interval in terms of quality, according to the Romanian, European, and WHO requirements.
Our model illustrates a potential approach to water monitoring programs. It may be further optimized by using a more comprehensive dataset from a longer survey period, and also a larger number of predictors describing the environment, which would increase its applicability for local authorities to draw appropriate water quality management measures.

Author Contributions

Conceptualization, C.I.T., S.O., M.S., A.M.B. and M.D.C.; methodology, C.I.T. and A.M.B.; investigation, C.I.T.; resources, S.O. and A.M.B.; data curation, S.O., A.M.B. and M.S.; writing—original draft preparation, M.S., C.I.T. and A.M.B.; writing—review and editing, M.S., A.M.B., S.O. and M.D.C.; supervision, S.O.; funding acquisition, S.O. All authors have read and agreed to the published version of the manuscript.

Funding

The project was financed by the Lucian Blaga University of Sibiu (Knowledge Transfer Center) and Hasso Plattner Foundation research grants LBUS-HPI-ERG-2023-04.

Institutional Review Board Statement

Not applicable.

Informed Consent Statement

Not applicable.

Data Availability Statement

All data are contained within the article.

Acknowledgments

We wish to acknowledge the help provided by Alexandra Sandu in drawing up the map of sample collection points and water sources.

Conflicts of Interest

The authors declare no conflict of interest.

References

  1. Spellman, F.R. The Drinking Water Handbook, 3rd ed.; CRC Press: Boca Raton, FL, USA; Taylor & Francis Group: Abingdon, UK, 2017; p. 2. [Google Scholar]
  2. EC (European Commission). Directive 2000/60/EC of the European Parliament and of the Council of 23 October 2000 establishing a framework for Community action in the field of water policy. J. Eur. Commun. 2000, 327, 1–72. [Google Scholar]
  3. Lin, L.; Yang, H.; Xu, X. Effects of Water Pollution on Human Health and Disease Heterogeneity: A Review. Front. Environ. Sci. 2022, 10, 880246. [Google Scholar] [CrossRef]
  4. Prüss-Üstün, A.; Bartram, J.; Clasen, T.; Colford, J.M.; Cumming, O.; Curtis, V.; Bonjour, S.; Dangour, A.D.; De France, J.; Fewtrell, L.; et al. Burden of disease from inadequate water, sanitation and hygiene in low- and middle-income settings: A retrospective analysis of data from 145 countries. Trop. Med. Int. Health 2014, 19, 894–905. [Google Scholar] [CrossRef] [PubMed]
  5. DeFelice, N.B.; Leker, H.G.; MacDonald Gibson, J. Annual cancer risks from chemicals in North Carolina community water systems. HERA 2017, 23, 974–991. [Google Scholar] [CrossRef]
  6. Muralikrishna, I.M.; Manickam, V. Chapter I: Water Pollution. In Environmental Management: Science and Engineering for Industry; BS Publications: Delhi, India, 2017; pp. 1–4. [Google Scholar]
  7. Liew, Z.; Meng, Q.; Yan, Q.; Schullehner, J.; Hansen, B.; Kristiansen, S.M.; Voutchkova, D.D.; Olsen, J.; Ersbøll, A.K.; Ketzel, M.; et al. Association between Estimated Geocoded Residential Maternal Exposure to Lithium in Drinking Water and Risk for Autism Spectrum Disorder in Offspring in Denmark. JAMA Pediatr. 2023, 3, e230346. [Google Scholar] [CrossRef]
  8. Araya, P.; Martínez, C.; Barros, J. Lithium in Drinking Water as a Public Policy for Suicide Prevention: Relevance and Considerations. Front. Public Health 2022, 10, 805774. [Google Scholar] [CrossRef]
  9. World Health Organization (WHO). Chapter 8: Chemical aspects. In Guidelines for Drinking-Water Quality: First Addendum to the Fourth Edition; WHO: Geneva, Switzerland, 2017; pp. 176–191. [Google Scholar]
  10. Cothern, C.R. Radon, Radium, and Uranium in Drinking Water; CRC Press: Boca Raton, FL, USA, 2014. [Google Scholar]
  11. World Health Organization (WHO). Chapter 9: Radiological aspects. In Guidelines for Drinking-Water Quality: First Addendum to the Fourth Edition; WHO: Geneva, Switzerland, 2017; pp. 209–211. [Google Scholar]
  12. Shahbazi-Gahrouei, D.; Gholami, M.; Setayandeh, S. A review on natural background radiation. Adv. Biomed. Res. 2013, 2, 65. [Google Scholar] [CrossRef]
  13. Haghiabi, A.H.; Nasrolahi, A.H.; Parsaie, A. Water quality prediction using machine learning methods. Water Qual. Res. 2018, 53, 3–13. [Google Scholar] [CrossRef]
  14. Zhu, M.; Wang, J.; Yang, X.; Zhang, Y.; Zhang, L.; Ren, H.; Wu, B.; Ye, L. A review of the application of machine learning in water quality evaluation. Eco-Environ. Health 2022, 2, 107–116. [Google Scholar] [CrossRef]
  15. Wu, D.; Wang, H.; Mohammed, H.; Seidu, R. Quality Risk Analysis for Sustainable Smart Water Supply Using Data Perception. IEEE Trans. Sustain. Comput. 2020, 3, 377–388. [Google Scholar] [CrossRef]
  16. Sokolova, E.; Ivarsson, O.; Lilliestrom, A.A.; Speicher, N.K.; Rydberg, H.; Bondelind, M. Data-driven models for predicting microbial water quality in the drinking water source using E. coli monitoring and hydrometeorological data. Sci. Total Environ. 2022, 802, 149798. [Google Scholar] [CrossRef]
  17. Hangan, A.; Chiru, C.-G.; Arsene, D.; Czako, Z.; Lisman, D.F.; Mocanu, M.; Pahontu, B.; Predescu, A.; Sebestyen, G. Advanced Techniques for Monitoring and Management of Urban Water Infrastructures—An Overview. Water 2022, 14, 2174. [Google Scholar] [CrossRef]
  18. Maiolo, M.; Pantusa, D. Multivariate Analysis of Water Quality Data for Drinking Water Supply Systems. Water 2021, 13, 1766. [Google Scholar] [CrossRef]
  19. Shrestha, S.; Kazama, F. Assessment of surface water quality using multivariate statistical techniques: A case study of the Fuji River basin, Japan. Environ. Model. Softw. 2007, 22, 464–475. [Google Scholar] [CrossRef]
  20. Wang, Q.; Wu, X.; Zhao, B.; Qin, J.; Peng, T. Combined multivariate statistical techniques, water pollution index (WPI) and daniel trend test methods to evaluate temporal and spatial variations and trends of water quality at Shanchong River in the Northwest Basin of Lake Fuxian, China. PLoS ONE 2015, 10, e011859. [Google Scholar] [CrossRef] [PubMed]
  21. Geng, R.; Geng, R.Z.; Yin, P.H.; Sharpley, A.N. A coupled model system to optimize the best management practices for nonpoint source pollution control. J. Clean. Prod. 2019, 220, 581–592. [Google Scholar] [CrossRef]
  22. Schreiber, S.G.; Schreiber, S.; Tanna, R.N.; Roberts, D.R.; Arciszewski, T.J. Statistical tools for water quality assessment and monitoring in river ecosystems—A scoping review and recommendations for data analysis. Water Qual. Res. 2022, 57, 40. [Google Scholar] [CrossRef]
  23. Dou, J.; Xia, R.; Chen, Y.; Chen, X.; Cheng, B.; Zhang, K.; Yang, C. Mixed spatial scale effects of landscape structure on water quality in the Yellow River. J. Clean. Prod. 2022, 368, 133008. [Google Scholar] [CrossRef]
  24. Hu, Y.; Yin, S.; Xiao, W.; Hou, B.; Zhang, X. Spatial scale effects of landscape patterns on water quality changes in drinking water source protection areas: A case study in the Guishui River Basin, China. Arab. J. Geosci. 2022, 15, 685. [Google Scholar] [CrossRef]
  25. Ding, H.; Niu, X.; Zhang, D.; Lv, M.; Zhang, Y.; Lin, Z.; Fu, M. Spatiotemporal analysis and prediction of water quality in Pearl River, China, using multi-variate statistical techniques and data-driven model. Environ. Sci. Pollut. Res. 2023, 30, 63036–63051. [Google Scholar] [CrossRef]
  26. Wang, D.; Huang, G.; Ding, H.; Zhang, X.; Wang, H.; Zhang, Z.; Li, D.; Zhao, J. Effects of Hydrological Season on the Relationship between Land Use and Surface Water Quality. Water 2023, 15, 2351. [Google Scholar] [CrossRef]
  27. Havlíková, P.; Mrkva, L.; Chuman, T.; Janský, B. Surface water quality in the rural catchment of the Šlapanka River, Czechia: Change over time. Environ. Earth Sci. 2023, 82, 379. [Google Scholar] [CrossRef]
  28. Drăgulescu, C. Cormoflora Judetului Sibiu, 2nd ed.; Editura Universității Lucian Blaga Sibiu: Sibiu, Romania, 2010; pp. 9–22. [Google Scholar]
  29. Badea, L.; Caloianu, N.; Dragu, G. Județul Sibiu; Editura Academiei Republicii Socialiste România: București, Romania, 1971; pp. 7–36. [Google Scholar]
  30. Parliament of Romania. Law No. 301/2015 on Establishing the Requirements for Protection of Human Health as Regards Radioactive Substances in Drinking Water. Official Gazette No. 904. 2015. Available online: http://www.legex.ro/Legea-301-2015-143944.aspx (accessed on 11 August 2023).
  31. The Government of Romania. Ordinance No. 7/2023 on the Quality of Water Intended for Human Consumption. Official Gazette No. 63. 2023. Available online: https://legislatie.just.ro/Public/DetaliiDocument/264337 (accessed on 11 August 2023).
  32. Parliament of Romania. Law No. 458/2002 (**Republished**) on Drinking Water Quality. Official Gazette No. 875. 2011. Available online: https://legislatie.just.ro/Public/DetaliiDocument/37723 (accessed on 11 August 2023).
  33. SR ISO 9696/2013; Calitatea Apei. Măsurarea Activităţii alfa Globale la Apa Nesalină. Metoda Prin Reziduu (Water Quality. Global Alpha Activity. Residue Test Method). ASRO: Bucharest, Romania, 2013.
  34. SR ISO 9697:2013; Calitatea Apei. Măsurarea Activităţii Beta Globale la Apa Nesalină. Metoda Prin Reziduu. ASRO: Bucharest, Romania, 2013.
  35. ISO 11929-4:2022; Determination of the Characteristic Limits (Decision Threshold, Detection Limit and Limits of the Coverage Interval) for Measurements of Ionizing Radiation—Fundamentals and Application. ISO: Geneva, Switzerland, 2020.
  36. SR EN ISO 13164-3:2020; Calitatea Apei. Radon-222. Partea 3: Metoda de Încercare Utilizând Emanometria. ASRO: Bucharest, Romania, 2020.
  37. SR EN ISO/IEC 17025:2018; Cerințe Generale Pentru Competența Laboratoarelor de Încercări și Etalonări. ASRO: Bucharest, Romania, 2018.
  38. World Health Organization. Guidelines for Drinking-Water Quality Third Edition Incorporating the First and Second Addenda Volume 1, Guidance on Radon in Drinking, 3rd ed.; World Health Organization: Geneva, Switzerland, 2008. [Google Scholar]
  39. United States Environmental Protection Agency (US EPA). Radon in Drinking Water Health Risk Reduction and Cost Analysis; Federal Register: Washington, DC, USA, 1999; Volume 64, pp. 9559–9599.
  40. Directive, C. Council Directive 2013/51/EURATOM of 22 October 2013: Laying down requirements for the protection of the health of the general public with regard to radioactive substances in water intended for human consumption. J. Eur. Union 2013, 7, 56. [Google Scholar]
  41. World Health Organization (WHO). Guidelines for Drinking-Water Quality: Fourth Edition Incorporating the First and Second Addenda. 2022. Available online: https://www.who.int/publications/i/item/9789240045064 (accessed on 11 August 2023).
  42. World Health Organization. Chapter 9: Radiological Aspects. In Guidelines for Drinking-Water Quality, 4th ed.; Library Cataloguing-in-Publication Data NLM Classification; World Health Organization: Geneva, Switzerland, 2011. [Google Scholar]
  43. United States Environmental Protection Agency (US EPA). EPA Drinking Water Advice Note Advice Note No. 16: Guidance on the Enforcement of the European Union (Radioactive Substances in Drinking Water) Regulations 2016; S.I. 160 of 2016 Version 1 Issued: 10 December 2016. National Primary Drinking Water Regulations; Radionuclides; Rinal Rule. Part II. 40 CFR Parts 9, 141, and 142; USEPA: Washington, DC, USA, 2000.
  44. SR ISO 7150-1:2001; Calitatea Apei. Determinarea Conţinutului de Amoniu. Partea 1: Metoda Spectrometrică Manuală (Water Quality. Determination of Ammonium Content). ASRO: Bucharest, Romania, 2001.
  45. United States Environmental Protection Agency (US EPA). 40 CFR Ch.1 Part 143—National Secondary Drinking Water Regulations; USEPA: Washington, DC, USA, 2003.
  46. World Health Organization (WHO). Drinking Water Parameter Cooperation Project: Support to the Revision of Annex I Council Directive 98/83/EC on the Quality of Water Intended for Human Consumption (Drinking Water Directive); WHO: Geneva, Switzerland, 2017. [Google Scholar]
  47. Directive (EU) 2020/2184 of the European Parliament and of the Council of 16 December 2020 on the Quality of Water Intended for Human Consumption. Available online: http://data.europa.eu/eli/dir/2020/2184/oj (accessed on 11 August 2023).
  48. SR EN ISO 7393-2:2002; Calitatea Apei. Determinarea Clorului Liber şi Clorului Total. Partea 2: Metoda Colorimetrică cu N,N-dietilfenilen-1,4-diamina, Destinată Controlului de Rutină (Water Quality. Determination of Free Chlorine and Total Chlorine. Part 2: Colorimetric Method with N,N-diethylphenylene-1,4-diamine for Routine Control). ASRO: Bucharest, Romania, 2002.
  49. SR ISO 7890-1:1998; Calitatea Apei. Determinarea Conţinutului de Azotaţi (Water Quality. Determination of Nitrogen Content. Part 1: Spectrometric Method with 2,6-dimethylphenol). ASRO: Bucharest, Romania, 1998.
  50. SR EN ISO 10566:2001; Calitatea Apei. Determinarea Conţinutului de Aluminiu. Metoda Spectrometrică cu Violet de Pyrocatechol (Determination of Aluminum Content. Pyrocatechol Violet Spectrophotometric Method). ASRO: Bucharest, Romania, 2001.
  51. SR EN ISO 6332:1996/C91:2006; Calitatea Apei. Determinarea Conţinutului de Fier. Metoda Spectrometrică cu 1,10—Fenantrolină (Determination of Iron Content. Spectrophotometric Method with 1–10 Phenanthroline). ASRO: Bucharest, Romania, 2006.
  52. SR EN ISO 15586:2004; Calitatea Apei. Determinarea Elementelor în Urme Prin Spectrometrie de Absorbţie Atomică cu Cuptor de Grafit (Water Quality. Determination of Trace Elements by Atomic Absorption Spectrometry with a Graphite Furnace). ASRO: Bucharest, Romania, 2004.
  53. SR EN ISO 10523:2012; Calitatea Apei. Determinarea pH-Ului (Water Quality. Determination of pH, 2012). ASRO: Bucharest, Romania, 2012.
  54. SR EN 27888:1997; Calitatea Apei. Determinarea Conductivităţii Electrice (Water Quality. Determination of Electrical Conductivity). ASRO: Bucharest, Romania, 1997.
  55. SR EN ISO 8467:2001; Calitatea Apei. Determinarea Indicelui de Permanganate (Water Quality. Determination of the Permanganate Index (Oxidability). ASRO: Bucharest, Romania, 2001.
  56. Bakdash, J.Z.; Laura, R. Marusich. Repeated Measures Correlation. Front. Psychol. 2017, 8, 456. [Google Scholar] [CrossRef] [PubMed]
  57. R Core Development Team. R: A Language and Environment for Statistical Computing; R Foundation for Statistical Computing: Vienna, Austria, 2021; Available online: https://www.R-project.org/ (accessed on 18 May 2021).
  58. Ter Braak, C.J.F.; Šmilauer, P. Canoco for Windows Version 5.10; Biometris—Plant Research International: Wageningen, The Netherlands, 2018. [Google Scholar]
  59. Šmilauer, P.; Lepš, J. Multivariate Analysis of Ecological Data Using CANOCO 5; Cambridge University Press: Cambridge, UK, 2014. [Google Scholar]
  60. Dordea, D. Resursele minerale ale României–o binefacere sau o povară? Collegium mediense. Comun. Ştiinţ. 2017, 7, 207–218. [Google Scholar]
  61. Otoo, F.; Darko, E.O.; Garavaglia, M.; Adukpo, O.K.; Amoako, J.K.; Tandoh, J.B.; Inkoom, S.; Nunoo, S.; Adu, S. Assessment of natural radioactivity and radon exhalation rate associated with rock properties used for construction in greater Accra region, Ghana. J. Radioanal. Nucl. Chem. 2021, 328, 911–923. [Google Scholar] [CrossRef]
  62. Nagaraju, K.M.; Chandrashekara, M.S.; Rani, K.P.; Rajesh, B.M.; Paramesh, L. Radioactivity measurements in the environment of Chamaraja Nagar area, India. Radiat. Prot. Environ. 2013, 36, 10. [Google Scholar] [CrossRef]
  63. Sarvajayakesavalu, S.; Lakshminarayanan, D.; George, J.; Magesh, S.B.; Anilkumar, K.M.; Brammanandhan, G.M.; Chandrasekara, A.; Ravikumar, M. Geographic Information System mapping of gross alpha/beta activity concentrations in ground water samples from Karnataka, India: A preliminary study. Groundw. Sustain. Dev. 2018, 6, 164–168. [Google Scholar] [CrossRef]
  64. Bourai, A.A.; Gusain, G.S.; Rautela, B.S.; Joshi, V.; Prasad, G.; Ramola, R.C. Variations in radon concentration in groundwater of Kumaon Himalaya, India. Radiat. Prot. Dosim. 2012, 152, 55–57. [Google Scholar] [CrossRef]
  65. Adithya, V.S.P.; Chidambaram, S.; Prasanna, M.V.; Venkatramanan, S.; Tirumalesh, K.; Thivya, C.; Thilagavathi, R. Health risk implication and spatial distribution of radon in groundwater along the lithological contact in south India. Arch. Environ. Contam. Toxicol. 2021, 80, 308–318. [Google Scholar] [CrossRef]
  66. Knutsson, G.; Olofsson, B. Radon content in groundwater from drilled wells in the Stockholm region of Sweden. Nor. Geol. Unders. 2002, 439, 79–85. [Google Scholar]
  67. Ion, S. Intramoesian fault in the Făgăraş mountains area. Olten.-Stud. Comun. Ştiinţ. Nat. 2017, 33, 12. [Google Scholar]
  68. Gorsevski, P.V.; Gessler, P.E.; Foltz, R.B.; Elliot, W.J. Spatial prediction of landslide hazard using logistic regression and ROC analysis. Trans. GIS 2006, 10, 395–415. [Google Scholar] [CrossRef]
  69. Ramola, R.C.; Choubey, V.M.; Negi, M.S.; Prasad, Y.; Prasad, G. Radon occurrence in soil–gas and groundwater around an active landslide. Radiat. Meas. 2008, 43, 98–101. [Google Scholar] [CrossRef]
  70. Li, F.; Torgoev, I.; Zaredinov, D.; Li, M.; Talipov, B.; Belousova, A.; Kunze, C.; Schneider, P. Landslide-induced mass transport of radionuclides along transboundary Mailuu-Suu river networks in Central Asia. Remote Sens. 2021, 13, 698. [Google Scholar] [CrossRef]
  71. Duong, H.V.; Le, H.L.; Nguyen, D.T.; Vu, N.M.; Duong, T.H.; Hegedűs, M.; Peka, A.; Kovács, T. Gross alpha/beta activity concentrations in spa and mineral waters in North Vietnam. J. Radioanal. Nucl. Chem. 2020, 326, 1511–1517. [Google Scholar] [CrossRef]
  72. Kumar, E.; Subramani, T.; Li, P.; Karunanidhi, D. Quantification of health and environmental risks due to radionuclides in limestone mining regions of Ariyalur, South India. Hum. Ecol. Risk Assess. Int. J. 2022, 28, 243–264. [Google Scholar] [CrossRef]
  73. The National Institute of Public Health (INSP). The Report for Health and Environment 2021. Available online: https://insp.gov.ro/rapoarte-si-studii/ (accessed on 11 August 2023).
  74. Pintilie, V.; Ene, A.; Georgescu, L.P.; Moraru, L.; Iticescu, C. Measurements of Gross Alpha and Beta Activity in Drinking Water from Galati Region, Romania. Rom. Rep. Phys. 2016, 68, 1208–1220. [Google Scholar]
  75. Begy, R.-C.; Savin, C.-F.; Süle, D.-K.; Nuhanovic, M.; Giagias, E.; Kovács, T. Radiological investigation of natural carbonated spring waters from Eastern Carpathians, Romania. J. Radioanal. Nucl. Chem. 2022, 331, 1439–1450. [Google Scholar] [CrossRef]
  76. Cucoș, A.L.; Moldovan, M.C.; Burghele, B.D.; Dicu, T.; Moldovan, O.T. Radiological Risk Assessment for Karstic Springs Used as Drinking Water in Rural Romania. Atmosphere 2021, 12, 1207. [Google Scholar] [CrossRef]
  77. Moldovan, M.; Benea, V.; Niţă, D.C.; Papp, B.; Burghele, B.D.; Bican-Brişan, N.; Cosma, C. Radon and radium concentration in water from North-West of Romania and the estimated doses. Radiat. Prot. Dosim. 2014, 162, 96–100. [Google Scholar] [CrossRef] [PubMed]
  78. Crider, Y.; Sultana, S.; Unicomb, L.; Davis, J.; Luby, S.P.; Pickering, A.J. Can you taste it? Taste detection and acceptability thresholds for chlorine residual in drinking water in Dhaka, Bangladesh. Sci. Total Environ. 2018, 613, 840–846. [Google Scholar] [CrossRef] [PubMed]
  79. Sasakova, N.; Gregova, G.; Takacova, D.; Mojzisova, J.; Papajova, I.; Venglovsky, J.; Szaboova, T.; Kovacova, S. Pollution of surface and ground water by sources related to agricultural activities. Front. Sustain. Food Syst. 2018, 2, 42. [Google Scholar] [CrossRef]
  80. Raju, N.J. Iron contamination in groundwater: A case from Tirumala-Tirupati environs, India. Researcher 2006, 1, 28–31. [Google Scholar]
  81. Kumar, V.; Bharti, P.K.; Talwar, M.; Tyagi, A.K.; Kumar, P. Studies on high iron content in water resources of Moradabad district (UP), India. Water Sci. 2017, 31, 44–51. [Google Scholar] [CrossRef]
  82. Norrman, J.; Sparrenbom, C.J.; Berg, M.; Dang, D.N.; Jacks, G.; Harms-Ringdahl, P.; Nhan, P.Q.; Rosqvist, H. Tracing sources of ammonium in reducing groundwater in a well field in Hanoi (Vietnam) by means of stable nitrogen isotope (δ15N) values. Appl. Geochem. 2015, 61, 248–258. [Google Scholar] [CrossRef]
  83. Du, Y.; Ma, T.; Deng, Y.; Shen, S.; Lu, Z. Sources and fate of high levels of ammonium in surface water and shallow groundwater of the Jianghan Plain, Central China. Environ. Sci. Process. Impacts 2017, 19, 161–172. [Google Scholar] [CrossRef]
  84. Kurosawa, K.; Egashira, K.; Tani, M.; Jahiruddin, M.; Moslehuddin, A.Z.M.; Zulfikar Rahman, M. Variation in arsenic concentration relative to ammonium nitrogen and oxidation reduction potential in surface and groundwater. Commun. Soil Sci. Plant Anal. 2008, 39, 1467–1475. [Google Scholar] [CrossRef]
  85. Ravanipour, M.; Hadi, M.; Rastkari, N.; Borji, S.H.; Nasseri, S. Presence of heavy metals in drinking water resources of Iran: A systematic review and meta-analysis. Environ. Sci. Pollut. Res. Int. 2021, 28, 26223–26251. [Google Scholar] [CrossRef]
  86. European Union. 5AD European Union Council Directive 98/83/EC of 3 November 1998 on the Quality of Water Intended for Human Consumption (Council Directive). Off. J. Eur. Communities 1998, 330, 32–54. [Google Scholar]
  87. Resz, M.-A.; Roman, C.; Senila, M.; Török, A.I.; Kovacs, E. A Comprehensive Approach to the Chemistry, Pollution Impact and Risk Assessment of Drinking Water Sources in a Former Industrialized Area of Romania. Water 2023, 15, 1180. [Google Scholar] [CrossRef]
  88. Khalil, M.A.; Salem, Z.E.-S.; Gheda, S.F.; El-Sheekh, M.M. Quality Assessment of Drinking Water in Tanta City, Egypt. J. Environ. Eng. Sci. B 2013, 2, 257–275. [Google Scholar]
  89. Parvizishad, M.; Dalvand, A.; Mahvi, A.H.; Goodarzi, F. A review of adverse effects and benefits of nitrate and nitrite in drinking water and food on human health. Health Scope 2017, 6, e14164. [Google Scholar] [CrossRef]
  90. Martiny, A.; Albrechtsen, H.; Arvin, E.; Molin, S. Identification of bacteria in biofilm and bulk water samples from a non-chlorinated model drinking water distribution system: Detection of a large nitrite-oxidizing population associated with Nitrospira spp. Appl. Environ. Microbiol. 2005, 71, 8611–8617. [Google Scholar] [CrossRef]
  91. Maguvu, T.E.; Bezuidenhout, C.C.; Kritzinger, R.; Tsholo, K.; Plaatjie, M.; Molale-Tom, L.G.; Mienie, C.M.; Coertze, R.D. Combining physicochemical properties and microbiome data to evaluate the water quality of South African drinking water production plants. PLoS ONE 2020, 15, e0237335. [Google Scholar] [CrossRef] [PubMed]
  92. Dueñas, C.; Fernandez, M.C.; Liger, E.; Cañete, S.; Fernandez, A.; Perez, R. Radioactivity levels and physical-chemical properties of public water supplies in Malaga. J. Radioanal. Nucl. Chem. 2007, 274, 15–25. [Google Scholar] [CrossRef]
  93. Liu, J.; Zhang, D.; Tang, Q.; Xu, H.; Huang, S.; Shang, D.; Liu, R. Water quality assessment and source identification of the Shuangji River (China) using multivariate statistical methods. PLoS ONE 2021, 16, e0245525. [Google Scholar] [CrossRef]
  94. Ma, X.; Wang, L.; Yang, H.; Li, N.; Gong, C. Spatiotemporal Analysis of Water Quality Using Multivariate Statistical Techniques and the Water Quality Identification Index for the Qinhuai River Basin, East China. Water 2020, 12, 2764. [Google Scholar] [CrossRef]
  95. Singh, K.P.; Malik, A.; Mohan, D.; Sinha, S. Multivariate statistical techniques for the evaluation of spatial and temporal variations in water quality of Gomti River (India)—A case study. Water Res. 2004, 38, 3980–3992. [Google Scholar] [CrossRef]
  96. Singh, K.P.; Malik, A.; Sinha, S. Water quality assessment and apportionment of pollution sources of Gomti river (India) using multivariate statistical techniques—A case study. Anal. Chim. Acta 2005, 538, 355–374. [Google Scholar] [CrossRef]
  97. Kormoker, T.; Idris, A.M.; Khan, M.M.; Tusher, R.T.; Proshad, R.; Islam, M.S.; Khadka, S.; Rahman, S.; Kabir, M.H.; Kundu, S. Spatial distribution, multivariate statistical analysis, and health risk assessment of some parameters controlling drinking water quality at selected primary schools located in the southwestern coastal region of Bangladesh. Toxin Rev. 2022, 41, 247–260. [Google Scholar] [CrossRef]
Figure 1. Location of sample collection points and water sources.
Applsci 13 10544 g001
Figure 2. Box-and-whisker plots of gross alpha activity (a) and gross beta activity (b) as a function of water source (Surf—surface water, Ground—groundwater), within the 2017–2021 interval. The circles represent outlier observations.
Applsci 13 10544 g002
Figure 3. The biplot of redundancy analysis (RDA) relating the three radioactivity parameters (radon-222, gross alpha and beta activity) to the water sources. Deep—deep water source, SSurf—subsurface water source, Surf—surface water source. The first two constrained axes are illustrated, but the second axis is not significant.
Applsci 13 10544 g003
Figure 4. The t-value biplots for the radioactivity parameters (radon-222, gross alpha and beta activities) of surface water (Surf) in relation to deep water Deep (a) and subsurface water SSurf (b). The pink circle delimits the ordination space for significant positive response to the considered variable, while the blue circle marks the negative response.
Applsci 13 10544 g004
Figure 5. The biplot of redundancy analysis (RDA) relating the gross alpha and beta activity parameters to the localities and the surface (Surf) and groundwater (Ground) sources. The names of localities are written in full. The first two constrained axes are illustrated, but the second axis is not significant.
Applsci 13 10544 g005
Figure 6. The biplot of redundancy analysis (RDA) relating the physical and chemical parameters to surface (Surf) and groundwater (Ground) sources and sampling month. Months are abbreviated by the first three letters. The first two constrained axes are illustrated, but the second axis is not significant.
Applsci 13 10544 g006
Figure 7. The t-value biplots for the physical and chemical parameters in relation to surface (Surf) and groundwater (Ground). The pink circle delimits the ordination space for significant positive response to the considered variable, while the blue circle marks the negative response.
Applsci 13 10544 g007
Figure 8. The biplot of redundancy analysis (RDA) relating the physical and chemical parameters to the localities. The names of localities are written in full. The first two constrained axes are illustrated, both being significant.
Applsci 13 10544 g008
Figure 9. Biplot of the co-inertia analysis between radioactivity (gross alpha and gross beta activities) and physical-chemical parameters.
Applsci 13 10544 g009
Table 2. Drinking water radioactivity parameters (mean values) in different regions of Romania.
AreaWater SourceGross Alpha Activity
(Bq/L)
Gross Beta Activity
(Bq/L)
Rn-222
(Bq/L)
Ref.
Sibiu
(Southern Transylvania)
mixed0.010.094.1Present study
Galati (S-E region)mixed0.020.07Not measured[74]
Eastern Carpathianssprings1.031.14[75]
Western CarpathiansspringsNot measured7[76]
N-W region of Transylvaniamixed15.9[77]
Table 3. Water sources and locations of samples showing the chemical contaminants found above the allowed concentration values.
LocationSource of WaterChemical ParameterSampling Year
AmmoniaResidual Free ChlorineFe
Sadusurfacex x2017, 2018, 2019
Tilișca x2018, 2021
Agnita x2020
Mediaș x 2021
Sibiu x2018, 2019, 2021
Săceldeepxx 2018
Șeica-Maresubsurfacexx 2017, 2021
Aciliux 2021
Table 4. Coefficients of the correlation between radioactivity and physical and chemical parameters. Only significant (p < 0.05, shown in bold) or marginally significant (0.05 < p < 0.1) results are shown. Values given in parentheses are for data without the outliers.
Gross Alpha
Activity
Gross Beta
Activity
FeClCdMnpHAmmonia
Gross beta activity0.709
(0.327)
Nitrates(0.344)
Fe −0.34
Mn (0.285)
pH−0.276
Ammonia 0.303
Al 0.2690.237
Oxidizability 0.238 −0.2590.234
Conductivity0.4970.527 −0.263
Turbidity (0.257)0.338 0.236
Disclaimer/Publisher’s Note: The statements, opinions and data contained in all publications are solely those of the individual author(s) and contributor(s) and not of MDPI and/or the editor(s). MDPI and/or the editor(s) disclaim responsibility for any injury to people or property resulting from any ideas, methods, instructions or products referred to in the content.

