Article

Channel Pruning-Based YOLOv7 Deep Learning Algorithm for Identifying Trolley Codes

School of Mechanical and Power Engineering, Zhengzhou University, Zhengzhou 450001, China
*
Author to whom correspondence should be addressed.
Appl. Sci. 2023, 13(18), 10202; https://doi.org/10.3390/app131810202
Submission received: 13 August 2023 / Revised: 3 September 2023 / Accepted: 7 September 2023 / Published: 11 September 2023
(This article belongs to the Special Issue Applications of Machine Learning in Image Recognition and Processing)

Abstract

:
The identification of trolley codes poses a challenge in engineering, as there are often situations where the accuracy requirements for their detection cannot be met. YOLOv7, being the state-of-the-art target detection method, demonstrates significant efficacy in addressing the challenge of trolley coding recognition. Due to the substantial dimensions of the model and the presence of numerous redundant parameters, the deployment of small terminals in practical applications is constrained. This paper presents a real-time approach for identifying trolley codes using a YOLOv7 deep learning algorithm that incorporates channel pruning. Initially, a YOLOv7 model is constructed, followed by the application of a channel pruning algorithm to streamline its complexity. Subsequently, the model undergoes fine-tuning to optimize its performance in terms of both speed and accuracy. The experimental findings demonstrated that the proposed model exhibited a reduction of 32.92% in the number of parameters compared to the pre-pruned model. Additionally, it was observed that the proposed model was 24.82 MB smaller in size. Despite these reductions, the mean average precision (mAP) of the proposed model was only 0.03% lower, reaching an impressive value of 99.24%. We conducted a comparative analysis of the proposed method against five deep learning algorithms, namely YOLOv5x, YOLOv4, YOLOv5m, YOLOv5s, and YOLOv5n, in order to assess its effectiveness. In contrast, the proposed method considers the speed of detection while simultaneously ensuring a high mean average precision (mAP) value in the detection of trolley codes. The obtained results provide confirmation that the suggested approach is viable for the real-time detection of trolley codes.

1. Introduction

Trolley codes in engineering are presently identified through manual means. However, conventional methods of manual detection face challenges in meeting the necessary criteria due to worker fatigue, suboptimal efficiency, and elevated costs. The automated identification of shopping cart codes has the potential to enhance the precision and effectiveness of detection. In the 1980s, Papageorgious et al. [1] introduced a framework for target detection that aimed to acquire the relevant features directly from samples, without relying on any prior knowledge or a pre-existing model. Lowe [2] introduced the scale-invariant feature transform [3], while Dalal et al. [4] proposed the histogram of oriented gradients (HOG) as a solution for the identification of pedestrians in static images. Felzenszwalb et al. (2010) integrated the Histogram of Oriented Gradients (HOG) feature descriptor with the Support Vector Machine (SVM) algorithm, introducing the Deformable Part Model (DPM) [3]. In recent years, deep learning has gained significant popularity and has been extensively applied in various domains such as speech recognition, image analysis, and natural language processing [5]. It has been of significant importance in the field of image processing [6]. AlexNet, a deep convolutional neural network (DCNN), was developed by Krizhevsky et al. in 2012 [7]. It gained significant attention for achieving record-breaking accuracy in image classification during the ImageNet Large Scale Visual Recognition Challenge (ILSRVC). Since then, several deep learning-based approaches for target detection have been developed [8,9,10]. Convolutional neural networks are widely regarded as the preferred method for addressing challenges in image recognition and detection. For instance, in their study, Kumar et al. [11] introduced the mask region-based convolutional neural networks (MRCNN) model, which accurately identifies the precise location of powdery mildew disease and its extent of infection on individual wheat plant images. Sanguansub et al. [12] introduced a convolutional neural network (CNN) model to classify the emotional category of songs. The YOLO series models also incorporate numerous convolutional layers, which are extensively employed in target recognition research. Z Ji et al. [13] introduced a novel YOLOv5-CASP model for the detection of lung nodules in medical images. In a similar vein, Hu et al. [14] proposed an effective defect-detection model, named Sim-YOLOv5s, specifically designed for lithium battery steel shells. However, it is worth noting that convolutional neural networks often suffer from the presence of redundant parameters [15], which can negatively impact their real-time performance. This presents a notable obstacle to their implementation in models designed to detect small vehicles with specific markings on them.
Given the intricate operational conditions of trolleys, this study presents a novel approach for trolley code identification using YOLOv7 and a channel pruning algorithm. The proposed method aims to address the challenges associated with time-consuming manual detection, inaccurate identification, and model size reduction. The proposed method underwent testing using images that were captured at different points in time, with varying lighting conditions and distances between the camera and the trolley. The YOLOv7 detection model was initially trained to achieve precise and efficient detection of trolley codes. The trained model underwent a channel pruning algorithm to streamline its structure and parameters, while ensuring the preservation of high accuracy.
The method proposed in this study makes a significant contribution to thermal imaging image algorithms by effectively reducing the redundant channels in the model, thereby achieving lightweighting and optimization. This approach not only decreases the computational complexity, but also enhances real-time performance. Additionally, it effectively mitigates overfitting by addressing the challenges posed by complexity and noise in thermal image data. The motivation behind this study is rooted in the necessity to enhance efficiency in resource-limited settings and to address the unique challenges associated with thermal imaging images. This optimized approach enables the attainment of more precise and efficient solutions in the realm of thermal imaging image analysis.

2. Development of the Algorithm

2.1. Dataset Creation

The object of research used in this study is a rectangular block of iron that simulates a trolley under normal working conditions. We used a Dahua A3504MG100 industrial camera to capture images of the workpiece. We drew a horizontal line parallel to the longest side of the rectangular iron block and marked six points at 5 cm intervals. To create the desired configuration, it is necessary to create a large hole with a diameter of 2 cm at the initial point, and smaller holes with a diameter of 1 cm at subsequent points along the horizontal line. Alternatively, no holes should be made. As depicted in Figure 1, a large hole should be punched at the first point, while small holes should be punched at the second, third, and sixth points. No holes are required at the fourth and fifth points. Consequently, the distance between the small holes at the third and sixth points measures 15 cm.
The study consists of four samples, namely 01111N, 01111L, 01111S, and 0111. Among these samples, 01111L and 01111S exhibit variations in the locations of small holes. Additionally, these two samples differ in length. The sample images can be observed in Figure 2. Detailed information regarding the collected dataset is presented in Table 1. A total of 1559 images were captured for four artifacts, with 423 images for sample 01111N, 426 images for sample 01111L, 302 images for sample 01111S, and 408 images for sample 0111. The resolution of these images was 778 pixels (horizontal) × 583 pixels (vertical). Eighty percent of the dataset, consisting of 1248 images, was allocated as the training set for the YOLOv7 object detection algorithm. The remaining 20% of the dataset, comprising 311 images, was designated as the test set to evaluate and validate the algorithm’s performance.
The dataset utilized in this study possessed the following attributes: it consisted of images of four distinct workpieces that were captured for the purpose of target selection. This was to ensure that the proposed method had the capability to detect various trolley codes, thereby demonstrating its adaptability. Additionally, the lighting, lens, and position of the workpiece were consistently modified during the process of image acquisition. This deliberate adjustment resulted in a dataset comprising images with varying light intensities and the target positioned at different distances from the camera. The purpose of this approach was to ensure the method’s adaptability to different illumination conditions and workpieces of varying sizes. The process of manually labeling the large and small holes in all images was conducted using the LabelMe tool. It was ensured that the holes were accurately positioned at the center of the bounding box during the labeling process. The label box used for this purpose was rectangular in shape and categorized into two distinct categories. One category of boxes with red labels designates large holes, while another category of boxes with green labels designates small holes. The corresponding text file was generated, and Figure 3 illustrates the markers present in one image within the dataset.

2.2. Training Environment and Evaluation Indicators

All training and testing in this study were performed on an Intel(R) Core(TM) i7-7700 CPU operating at a frequency of 3.60 GHz, with a total of 32 GB of RAM. The system utilized a 64-bit operating system, an NVIDIA GeForce GTX 1050 Ti graphics card, and Windows 10 as the operating system. The text lacks clarity and coherence. The current version of the Compute Unified Device Architecture (CUDA) is 11.2, and the deep learning framework employed is PyTorch 1.7.0. The algorithm was developed using Python 3.9.
In order to make the experiment more objective and rigorous, we used three metrics to assess the performance of the model: precision, recall, and the mAP [16]. Precision refers to the proportion of objects detected by the model that are correct holes, and recall refers to the proportion of all holes detected by the model. The calculation formula of the precision rate and recall rate is shown in Equations (1) and (2), where TP represents the number of correctly identified holes, FP represents the number of holes that are incorrectly identified as holes, and FN is the number not correctly detected as holes.
  p r e c i s i o n = T P T P + F P
r e c a l l = T P T P + F N
The calculation formula for the mean average precision (mAP) is presented in Equations (3) and (4). The area under the precision-recall curve (PR curve) is commonly referred to as AP, while the average value of AP across different categories is denoted as mAP. N represents the total number of test sample classes. The car encoding data set contains both large and small holes, resulting in an N value of 2.
A P = 0 1 P ( R ) d R
m A P = 1 N 0 1 P ( R ) d R N

2.3. YOLOv7 Algorithm

2.3.1. Technical Details

Figure 4 illustrates the technical methods employed to ensure the efficient and precise identification of trolley codes during regular operational circumstances. The dataset underwent initial manual annotation using LabelImg, followed by training the YOLOv7 network to recognize trolley codes. The YOLOv7 model underwent a channel pruning algorithm to eliminate redundant channels and weights of its parameters. This process aimed to simplify the model’s structure and reduce its parameter count, while preserving its accuracy.

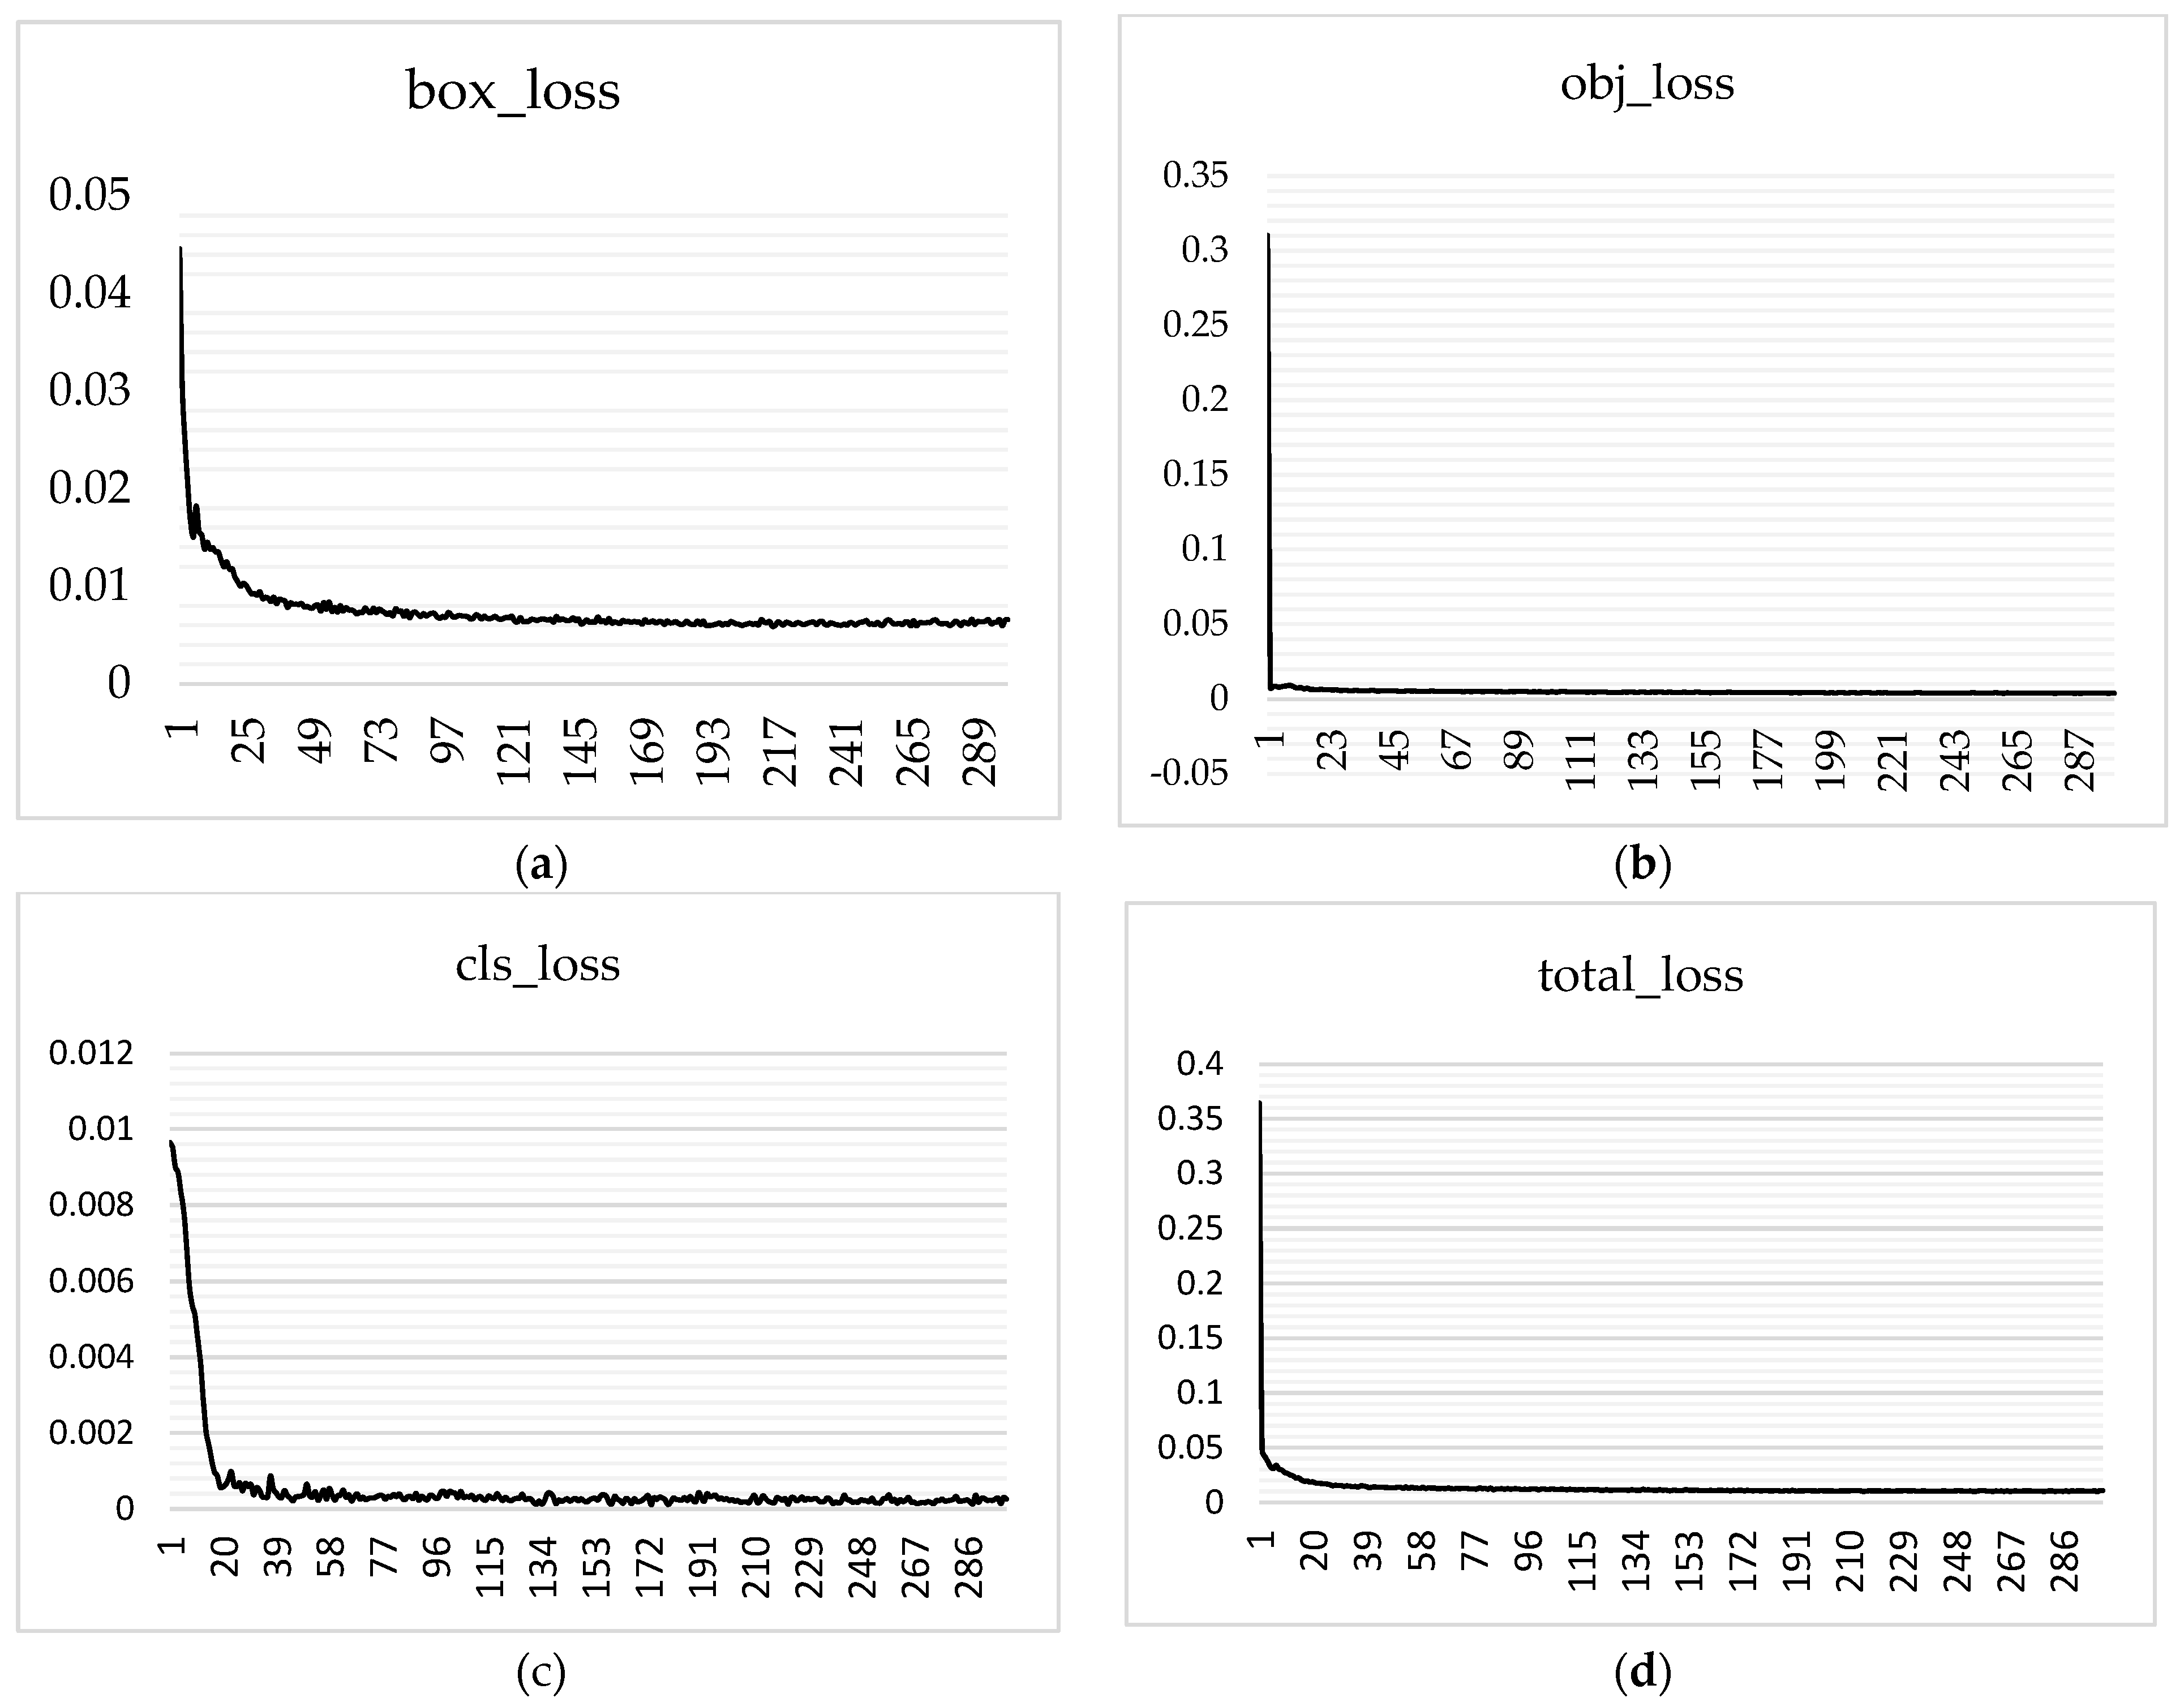
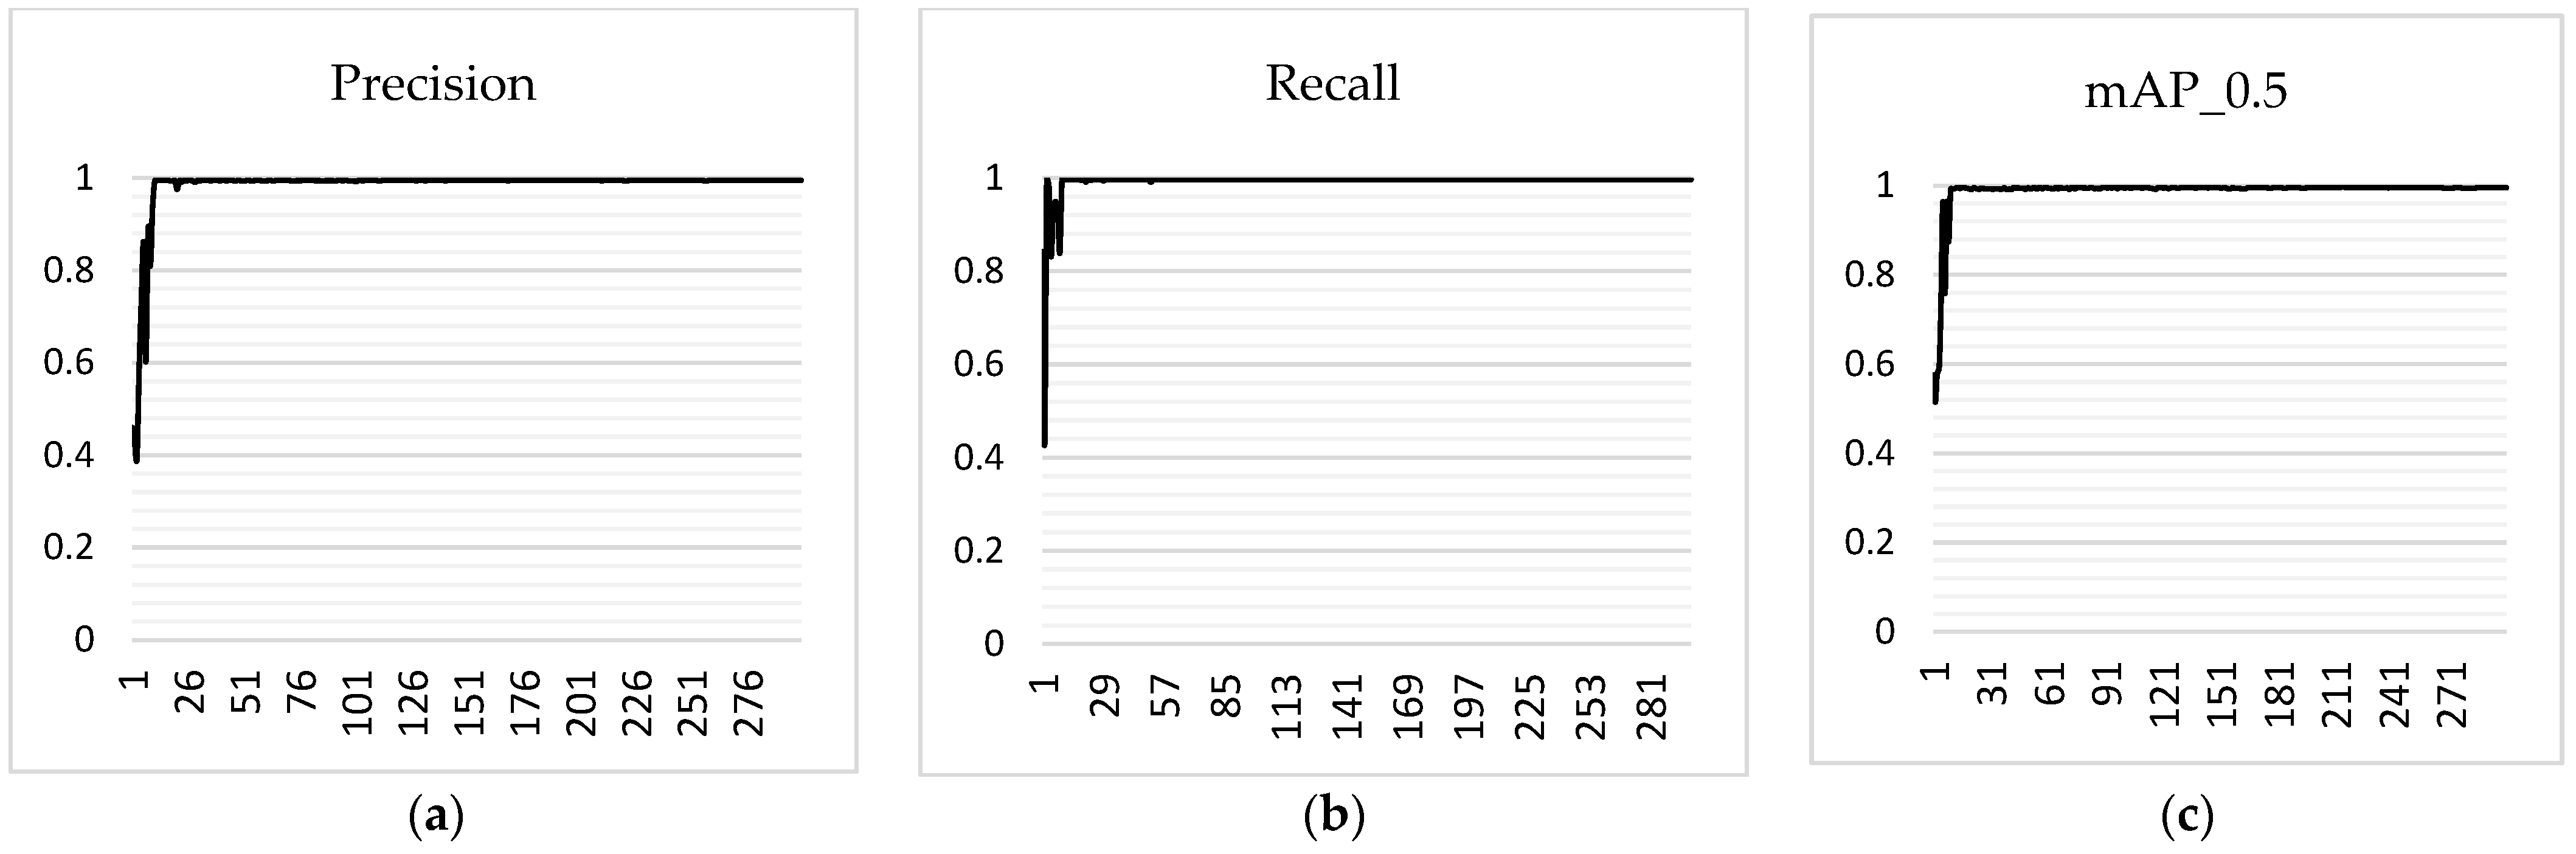
2.3.2. Identifying Trolley Codes Based on YOLOv7

In order to mitigate the negative impact of background variations and changes in illumination caused by constant changes in lighting conditions and the position of the workpiece during image acquisition, we employed a deep learning-based approach for object detection. This method allows us to accurately identify trolley codes [17,18] and enhance the algorithm’s robustness.
The You-Only-Look-Once (YOLO) network is an algorithm for target detection that operates in a single stage [19]. It utilizes convolutional kernels of sizes 1 × 1 and 3 × 3 and is built upon the architecture of GoogleNet [17]. The proposed approach employs a singular convolutional neural network (CNN) to analyze the image, enabling simultaneous computation of both classification outcomes and object coordinates. The speed of YOLO is greatly improved by employing end-to-end target localization and classification techniques [19]. YOLO has gained widespread popularity in the domain of target recognition due to its exceptional real-time performance and ability to detect multiple targets [20,21,22,23,24]. Compared to its predecessors in the YOLO series, YOLOv7 incorporates the ELAN network architecture, which enhances the model’s ability to understand image content and consequently improves detection accuracy. YOLOv7 incorporates a multi-scale detection mechanism, which enables target detection on feature maps of varying scales. This integration enhances the model’s ability to detect objects of different sizes, including both small and large objects. Additionally, YOLOv7 incorporates a wider range of complex data augmentation techniques, including CutMix and Mosaic. These strategies aim to augment the diversity of the training data, thereby enhancing the model’s generalization capability [25].
As depicted in Figure 5, the preprocessed image is fed into the backbone network. According to the three-layer output in the backbone network, the head layer consistently generates three layers of feature maps with varying sizes through the backbone network. After the implementation of the RepVGG block and convolution, the model is capable of performing three types of image detection tasks, namely classification, front and rear background classification, and border detection. The final results are then generated based on these tasks.
The basis of our research lies in the thorough collection of data, encompassing a diverse range of real-world images that feature tram codes in different environmental conditions and scenarios. After the completion of data collection, the data set is labeled using LabelMe 4.5.13 software, and the resulting labels are saved in a txt format. The annotated dataset was divided into two subsets, namely a training set consisting of 1248 images and a test set consisting of 311 images. The ratio between the training and testing sets was maintained at 4:1.
For the purpose of object detection, we have selected the well-established YOLOv7 model, renowned for its exceptional performance in various object detection tasks. To leverage the benefits of transfer learning, we initiated the training process by utilizing the YOLOv7 model that had been pre-trained on the COCO dataset. However, in order to tailor the model to our particular task of tram code recognition, we implemented parameter modifications. Key adjustments encompass modifying the batch size, altering the number of iterations, fine-tuning the learning rate, and specifying object classes.
Before commencing the training of the model, the images were resized to a standardized input size of 640 × 640 pixels, ensuring their compatibility with the model’s input specifications. The model’s learning rate is set at 0.01, and the number of iterations is determined to be 300 rounds. Taking into consideration the image characteristics and GPU performance of the car encoding dataset, we initially chose a batch size of 16. Throughout the training procedure, it was observed that the training speed was relatively sluggish, the utilization of memory resources was not substantial, and the loss function exhibited significant fluctuations. According to the Batch Size Doubling Strategy, the batch size was adjusted to 32. The GPU’s parallel performance was fully utilized, resulting in a significant acceleration of the model’s training speed and a notable reduction in the fluctuation of the loss function. In order to enhance the training process and identify the most suitable batch size, we made an adjustment to the batch size, setting it to 64. However, the training was unsuccessful due to limited memory resources. After conducting a series of experiments, we determined that the optimal batch size for training is 32. This decision was influenced by the specific characteristics of the dataset’s images and the GPU’s capabilities, in order to achieve the most favorable training outcome. The parameters of YOLOv7 used in this study are presented in Table 2.
In terms of loss function, YOLOv7 is similar to YOLOv5. As shown in Equation (5), YOLOv7 is divided into classification loss (cls_loss), bounding box position loss (box_loss), and confidence loss (obj_loss).
L t o t a l _ l o s s = L o b j _ l o s s + L b o x _ l o s s + L c l s _ l o s s
Confidence loss and classification loss use BCE cross-entropy loss. The calculation formula of BCE cross-entropy loss is displayed as Equations (6) and (7), where σ ( x n ) represents the sigmoid function, w n represents the average of the results, and y n represents the real sample label.
L n = w n y n log σ ( x n ) + ( 1 y n ) log ( 1 σ ( x n ) )
σ ( x n ) = 1 1 + e x
The bounding box position loss adopts C I o U loss, and the calculation formula is represented by Equations (8)–(12), where A represents the predicted frame, B represents the real frame, α is the weight function, and ν is used to measure the consistency of the aspect ratio. w g t and h g t are the width and height of the ground truth bounding box, while w and h represent the width and height of the predicted bounding box. ρ 2 ( b , b g t ) is the center point distance between two bounding boxes, and c is the diagonal distance of a bounding box that can at least enclose the two bounding boxes.
I o U = A B A B
α = ν 1 I o U + ν
ν = 4 π 2 ( a r c t a n w g t h g t a r c t a n w h ) 2
C I o U = I o U ρ 2 ( b , b g t ) c 2 + α ν
L b o x _ l o s s = 1 C I o U
Figure 6 illustrates the loss curves for box_loss, obj_loss, cls_loss, and total_loss throughout the training process. After 300 iterations, the values of box_loss, obj_loss, cls_loss, and total_loss were 0.006604, 0.003979, 0.0002599, and 0.01084, respectively. It is evident from the analysis of Figure 6 that the model demonstrated efficient learning capabilities, as indicated by the rapid convergence of the training curves during the initial stage of training. As the training advanced, the rate of change of the curve gradually diminished. The learning efficiency of the model reached a plateau after 50 iterations.
The outcomes of trolley code identification using the YOLOv7 algorithm, which has been trained, are depicted in Figure 7. The algorithm demonstrated the capability to precisely detect both small holes and big holes in the images of samples 01111N, 01111L, 01111S, and 0111. This step establishes the foundation for the process of model pruning.

2.3.3. Pruning YOLOv7 Model

Although the YOLOv7 model, which has been trained, demonstrates accurate identification of trolley codes, its extensive parameterization necessitates significant computational resources. We pruned the model in order to decrease the number of parameters and, consequently, its complexity. This was to enable deployment on devices with limited computational capabilities [26].
The channel pruning algorithm was employed to decrease the size and parameter count of the model by eliminating redundant parameters [27]. The simultaneous reduction in both the amount of necessary computation and the number of parameters is more advantageous compared to compression techniques that only decrease the number of parameters without affecting the actual number of model operations [28].
As depicted in Figure 8, the gamma coefficients of the Batch Normalization (BN) layer were employed in the channel pruning algorithm to assess the individual contributions of the channels. Channels that made significant contributions (blue channels) were retained, while channels that made minimal contributions (orange channels) were eliminated. This decision was made by considering the distribution of the gamma coefficients and the rate at which the channel pruning algorithm pruned the channels.
The steps of the channel pruning algorithm are as follows:
  • In order to incorporate structural sparsity into the YOLOv7 model, the L1 regularization technique was utilized. Specifically, L1 regularization constraints were applied to the coefficients of the Batch Normalization (BN) layer within the YOLOv7 model. The objective of this phase was to fine-tune the model’s parameters by imposing L1 regularization.
  • Following the initial training phase, we proceeded to implement channel pruning. This crucial procedure entailed the elimination of branches or channels within the YOLOv7 model, in accordance with a predetermined pruning ratio. The pruning ratio plays a crucial role in determining the proportion of channels that will be preserved, leading to a more streamlined and storage-efficient model. By selectively removing channels, we were able to substantially decrease the storage demands of the model, rendering it more manageable and appropriate for environments with limited resources. This particular step played a crucial role in optimizing the size of the model while simultaneously preserving its effectiveness.
  • Following the process of channel pruning, our foremost objective was to mitigate any potential decrease in accuracy. We conducted a meticulous fine-tuning process to carefully adjust and retrain the pruned model. Throughout the fine-tuning phase, we diligently balanced the parameters of the model to guarantee that, while achieving a reduction in size, we did not compromise significantly on accuracy. This step was undertaken with the objective of optimizing the pruned model, with a focus on achieving both compactness and performance, as both factors are of utmost importance.
The total loss function of the channel pruning algorithm is shown in Equation (13):
L = ( x , y ) l ( f ( x , W ) , y ) + λ γ Γ g ( γ )
The first term on the right side of the equal sign is the loss function for network training; x and y are the training inputs and outputs, respectively. W is the training parameter of the network. The second term is the L 1 regular constraint term for the gamma coefficient of the BN layer; and λ is the penalty factor.
The parameter settings for the channel pruning process are shown in Table 3.
Initially, sparse training was conducted, followed by the application of a pruning rate of 0.8 to eliminate channels from the YOLOv7 model. The alterations in the channels within each layer following the process of pruning are depicted in Figure 9. The number of reduced channels in each layer ranged from 60 to 1,046,860, with an average reduction of 158,826 channels per layer. Furthermore, it can be observed from Figure 9 that the majority of the convolutional layers experienced a substantial reduction in the number of channels, suggesting the effectiveness of the pruning algorithm.
The findings presented in Table 4 demonstrate that the pruned model exhibited a reduction of 32.92% in the number of parameters compared to the original model. This reduction corresponded to a decrease in size of 24.82 MB. Additionally, the pruned model demonstrated a decrease in the time required for forward inferences by 7.6 ms. Despite these modifications, the pruned model only experienced a marginal decrease of 0.034% in its mAP (mean accuracy), resulting in an accuracy level that closely resembled that of the original model. Channel pruning simplifies the model while preserving its accuracy.

3. Results and Analysis

The proposed method was employed to detect both large and small holes in the 311 images of the test set in order to evaluate its performance. The outcomes of this evaluation are presented in Figure 10. The mean average precision (mAP), precision, and recall achieved values of 99.24%, 99.17%, and 99.71%, respectively. This observation demonstrates the high level of accuracy associated with the proposed method.

3.1. Comparison with Other Target Detection Algorithms

To assess the efficacy of the proposed method, a comparison was conducted with five widely used target detection algorithms, namely YOLOv5x, YOLOv4, YOLOv5m, YOLOv5s, and YOLOv5n. The findings are presented in Table 5.
The rapid and precise detection of both large and small openings can not only be used to identify trolley codes, but also to generate insights for the identification of other targets in the field of engineering. The results indicate that the mean average precision (mAP) values for the six target detection algorithms were 98.38%, 97.52%, 98.21%, 98.06%, 97.73%, and 99.24%. Additionally, the sizes of the corresponding models were 166 MB, 243.97 MB, 40.8 MB, and 141 MB. The sizes of the files were 2.87 MB, 3.87 MB, and 47.63 MB, and the durations of the forward inference processes were 114 ms, 163 ms, 33.9 ms, 18.8 ms, 8.6 ms, and 8.1 ms.
In relation to mean average precision (mAP), our proposed method demonstrates an outstanding achievement of 99.24% mAP, surpassing the performance of all five models. In contrast to YOLOv5x, YOLOv4, YOLOv5m, YOLOv5s, and YOLOv5n, our model demonstrates a significant improvement in accuracy for object detection tasks. Specifically, our model achieves a mAP increase of 0.86%, 1.72%, 1.03%, 1.18%, and 1.51% for YOLOv5x, YOLOv4, YOLOv5m, YOLOv5s, and YOLOv5n, respectively. This highlights the superior performance of our model in accurately detecting objects.
Moving forward to the inference time, the proposed method demonstrates exceptional performance with a mere 8.1 ms, thereby establishing a new benchmark among the five models. In comparison to YOLOv5x, YOLOv4, YOLOv5m, YOLOv5s, and YOLOv5n, our model demonstrates a significant reduction in inference time, with decreases of 105.9 ms, 154.9 ms, 25.8 ms, 10.7 ms, and 0.5 ms, respectively. This statement highlights the advantageous positioning of our model, enabling efficient processing of input images to meet the requirements of real-time applications and high-performance scenarios.
Regarding the size of the model, our proposed method is 122.37 MB and 196.34 MB smaller than YOLOv5x and YOLOv4, respectively. In contrast to YOLOv5s, YOLOv5m, and YOLOv5n, our model exhibits larger sizes of 8.27 MB, 6.83 MB, and 43.76 MB, respectively. However, it still maintains its advantage in terms of overall size efficiency. This indicates that our model is highly effective in minimizing storage space consumption, making it particularly well-suited for deployment in resource-constrained environments, such as small end devices.
In summary, our model demonstrates several advantages in terms of its model size, average accuracy, and forward inference time. Our model demonstrates superior performance compared to YOLOv5x and YOLOv4 in terms of model size. Additionally, it outperforms the other five models in terms of average accuracy and forward inference time. This implies that our model possesses a reduced model size, yet it maintains a high level of accuracy and low inference time. Consequently, it becomes more appropriate for implementation in compact end devices and environments with limited resources.

3.2. Comparison with Previous Studies

J M et al. [29] proposed an enhanced YOLOv3-based model for target detection. The model incorporates an up-sampling technique to increase the resolution of the feature map, which is initially downsampled by a factor of eight. This up-sampled feature map is then stitched together with a two-fold up-sampled feature map obtained from the output of the second residual block. Additionally, a target detection layer is constructed to fuse the features, resulting in a four-fold downsampling of the output. The model exhibits a notably elevated recall and average accuracy of detection in comparison to the original YOLOv3 model. However, despite exhibiting a 6.5% higher average accuracy compared to YOLOv3, the model fails to meet the engineering-related criteria necessary for its deployment on small terminals.
Mei et al. [30] introduced an enhanced R-CNN-based approach for detecting aerial targets. This R-CNN-based incorporates expansion-based accumulation, region amplification, local annotation, adaptive thresholding and consideration of the context. The proposed method addresses the limitation of the insensitivity of the Faster R–CNN [31] by improving its sensitivity towards targets, while also enhancing the detection speed accuracy. However, the precision of this approach fails to meet the demands of engineering applications. Additionally, the substantial size of the faster R-CNN model poses challenges for deployment on compact terminals even after optimization efforts have been made.
We utilized our dataset comprising images containing trolley codes to both train and evaluate the YOLOv7 model that was proposed. Subsequently, a pruning algorithm was employed to remove redundant parameters from the model, thereby simplifying it without compromising its detection accuracy. The implementation of this approach resulted in a significant reduction of 32.92% in the total number of parameters when compared to the original model. Additionally, the optimized model exhibited a reduction in size by 24.82 MB compared to the original model, while achieving a mean average precision (mAP) of 99.24%.
The detection method proposed in this research addresses the limitations of previous deep learning-based methods, including excessive model parameters, large size, slow detection speed, and low accuracy.

3.3. Discussion

The identification of codes on trolleys takes place in a complex environment, primarily due to the presence of significant interference levels. We conducted an analysis of the primary factors that impact the performance of the proposed method within an empirical setting.

3.3.1. Influence of Distance between Industrial Camera and Workpiece

We employed a range of distances between the target and the camera, spanning from 15 cm to 30 cm. Figure 11 illustrates an instance where the detection of a hole is incorrect.
When the camera-to-target distance varied between 15 cm and 25 cm, the proposed method successfully detected both large and small holes. When the distance was increased to 30 cm, erroneous decisions were made. In Figure 11a, the hole pattern located in the bottom left corner is identified as a large hole. Similarly, in Figure 11b, the pattern in the same corner is erroneously identified as both a large hole and a small hole in the workpiece is overlooked. The primary factor contributing to this issue is the significant shooting distance. At such distances, the small holes and the background exhibit similar color characteristics, while the large hole features resemble the hole pattern features of the background plate. Consequently, this similarity poses challenges in extracting the relevant features, ultimately resulting in the missed detection of certain large and small holes.
The distance between the trolley and the industrial camera lens was consistently maintained at a fixed distance of 20 cm during regular operational circumstances. The findings indicated that the proposed method exhibited superior accuracy in detecting small holes. However, it was observed that the accuracy of the method decreased as the distance between the camera and the workpiece increased to 1.5 times the distance observed under normal working conditions. When the distance between the lens and the workpiece varied between 15 cm and 25 cm, indicating non-standard working conditions, the proposed algorithm demonstrated the capability to accurately and efficiently detect both small and large holes. This finding demonstrates the robustness of the proposed method in relation to the distance at which the image is captured.
In order to enhance the model’s ability to accurately and efficiently identify holes of different sizes under diverse conditions, the merging and fusion of feature maps can be employed to extract more comprehensive information. For example, various techniques can be employed to achieve this, including element-wise addition, element-wise multiplication, channel concatenation, attention mechanisms [32], and other methods.

3.3.2. Effect of Light Intensity on Detection

Industrial cameras typically employ a stationary light source for capturing footage under standard operating conditions. However, fluctuations in natural lighting can lead to variations in the recorded images at different points in time.
When the light intensity was high, it resulted in a brighter appearance of the workpiece, which had an impact on the accuracy of feature extraction by the model. Conversely, when the light intensity was weak, the image appeared darker, making it challenging to distinguish between the large and small holes due to their similar color to that of the workpiece. This further complicated the process of feature extraction. Figure 12 presents the outcomes of code-based detection using the proposed method across varying levels of light intensity. Figure 12a,b demonstrate the successful identification of both small and large holes.
We made continuous adjustments to the intensity of light during the process of capturing images of the workpieces. The obtained results, which demonstrated an impressive mean average precision (mAP) of 99.24%, indicate the high accuracy of the proposed method in identifying marked trolleys within images.

4. Conclusions

Based on extensive research conducted on the yolov7 model, this paper utilizes the YOLOv7 architecture and integrates an optimized channel pruning algorithm to present a novel approach for accurately detecting trolley codes in real-time within standard operating scenarios. The primary purpose of this technology is to address the challenge of identifying trolley codes in real-world engineering applications. The primary outcomes of the study are succinctly outlined as follows:
  • The proposed method not only demonstrates a high level of accuracy, but also enables the efficient detection of trolley codes. By implementing the channel-pruning-based YOLOv7 deep learning algorithm, notable reductions in the number of parameters, model size, and forward inference time are achieved when compared to the unmodified model. Specifically, there is a decrease of 32.92% in the number of parameters, a reduction of 34.1% in model size, and a decrease of 48.8% in forward inference time. These enhancements have been implemented while ensuring accuracy is not compromised. Experiments have been conducted to demonstrate the method’s resistance to variations in factors such as the target camera distance and ambient lighting. These experiments aim to ensure consistent results under typical operating conditions. This demonstration of robustness further validates the practical viability of the proposed method.
  • The method presented in this study generates a simplified model that demonstrates the ability to accurately identify tram codes in typical operational environments. The experimental results exhibit a remarkable average precision (mAP) value of 99.24%, surpassing YOLOv5x, YOLOv4, YOLOv5m, YOLOv5s, and YOLOv5n by 0.86%, 1.72%, 1.03%, 1.18%, and 1.51%, respectively. In relation to the time taken for forward inference, the enhanced model achieved a duration of 8.1ms, representing a reduction of 7.6 ms compared to YOLOv7. The objective of this study was to offer valuable technical insights into the implementation of tram code recognition models in compact terminals and the potential integration of automatic target detection models in engineering applications. The aforementioned contribution serves as a fundamental basis for future investigations within this particular field. In subsequent research, it is recommended to explore the development of algorithms aimed at enhancing feature extraction. This can be achieved through the implementation of attention mechanisms or other multi-scale fusion algorithms. By improving the feature extraction capabilities of the model, the performance of trolley coding detection can be significantly enhanced.

Author Contributions

Conceptualization, J.Z.; methodology, J.Z.; software, R.Z.; validation, R.Z.; formal analysis, R.Z.; investigation, X.S.; resources, L.Y.; data curation, X.X.; writing—original draft preparation, R.Z.; writing—review and editing, R.Z.; visualization, J.Z.; supervision, J.Z.; project administration, J.Z. All authors have read and agreed to the published version of the manuscript.

Funding

This research received no external funding.

Institutional Review Board Statement

Not applicable.

Informed Consent Statement

Not applicable.

Data Availability Statement

Not applicable.

Conflicts of Interest

The authors declare no conflict of interest.

References

  1. Papageorgiou, C.P.; Oren, M.; Poggio, T. A general framework for object detection. In Proceedings of the Sixth International Conference on Computer Vision 2002, Bombay, India, 7 January 1998; pp. 555–562. [Google Scholar] [CrossRef]
  2. Lowe, D.G. Distinctive Image Features from Scale-Invariant Keypoints. Int. J. Comput. Vis. 2004, 60, 91–110. [Google Scholar] [CrossRef]
  3. Felzenszwalb, P.F.; Girshick, R.B.; McAllester, D.; Ramanan, D. Object Detection with Discriminatively Trained Part-Based Models. IEEE Trans. Pattern Anal. Mach. Intell. 2009, 32, 1627–1645. [Google Scholar] [CrossRef] [PubMed]
  4. Dalal, N.; Triggs, B. Histograms of Oriented Gradients for Human Detection. In Proceedings of the Computer Vision and Pattern Recognition, San Diego, CA, USA, 20–26 June 2005; pp. 886–893. [Google Scholar] [CrossRef]
  5. Chen, A.; Xie, Y.; Wang, Y.; Li, L. Knowledge Graph-Based Image Recognition Transfer Learning Method for On-Orbit Service Manipulation. Space Sci. Technol. 2021, 2021, 165–172. [Google Scholar] [CrossRef]
  6. Lv, W. Research on Black and White Image Coloring Algorithm Based on Deep Neural Network. Master’s Thesis, Jiangxi University of Technology, Nanchang, China, 2019. Available online: https://kns.cnki.net/KCMS/detail/detail.aspx?dbname=CMFD202001&filename=1019188350.nh (accessed on 16 June 2023).
  7. Krizhevsky, A.; Sutskever, I.; Hinton, G.E. Imagenet classification with deep convolutional neural networks. Adv. Neural Inf. Process. Syst. 2012, 25, 1097–1105. [Google Scholar] [CrossRef]
  8. Wang, W.; Fu, Y.; Dong, F.; Li, F. Infrared Ship Target Detection Method Based on Deep Convolution Neural Network. Acta Opt. Sin. 2018, 38, 0712006. Available online: https://www.opticsjournal.net/Articles/OJae7dbefc1e5afa10/Abstract (accessed on 22 May 2023). [CrossRef]
  9. Kumar, D.; Kukreja, V. MRISVM: A Object Detection and Feature Vector Machine Based Network for Brown Mite Variation in Wheat Plant. In Proceedings of the 2022 International Conference on Data Analytics for Business and Industry (ICDABI), Sakhir, Bahrain, 25–26 October 2022; pp. 707–711. [Google Scholar] [CrossRef]
  10. Zhang, G.; He, J.; Gao, W. Research on face recognition based on deep learning. Wirel. Connect. Technol. 2019, 16, 133–135. Available online: https://www.cnki.com.cn/Article/CJFDTOTAL-WXHK201919061.htm (accessed on 28 July 2023).
  11. Kumar, D.; Kukreja, V. Early Recognition of Wheat Powdery Mildew Disease Based on Mask RCNN. In Proceedings of the 2022 International Conference on Data Analytics for Business and Industry (ICDABI), Sakhir, Bahrain, 25–26 October 2022; pp. 542–546. [Google Scholar] [CrossRef]
  12. Sanguansub, N.; Kamolrungwarakul, P.; Poopair, S.; Techaphonprasit, K.; Siriborvornratanakul, T. Song lyrics recommendation for social media captions using image captioning, image emotion, and caption-lyric matching via universal sentence embedding. Soc. Netw. Anal. Min. 2023, 13, 95. [Google Scholar] [CrossRef]
  13. Ji, Z.; Wu, Y.; Zeng, X.; An, Y.; Zhao, L.; Wang, Z.; Ganchev, I. Lung Nodule Detection in Medical Images Based on Improved YOLOv5s. IEEE Access 2023, 11, 76371–76387. [Google Scholar] [CrossRef]
  14. Hu, H.; Zhu, Z. Sim-YOLOv5s: A method for detecting defects on the end face of lithium battery steel shells. Adv. Eng. Inform. 2023, 55, 101824. [Google Scholar] [CrossRef]
  15. Hu, H.; Peng, R.; Tai, Y.W.; Tang, C.K. Network Trimming:A Data-Driven Neuron Pruning Approach towards Efficient Deep Architectures. arXiv 2016, arXiv:1607.03250. [Google Scholar] [CrossRef]
  16. Wang, Y.; Li, Y.; Duan, Y.; Wu, H. Infrared image recognition of substation equipment based on lightweight backbone network and attention structure. Power Grid Technol. 2023, 1–12. [Google Scholar] [CrossRef]
  17. Liu, L.; Ouyang, W.; Wang, X.; Fieguth, P.; Chen, J.; Liu, X.; Pietikäinen, M. Deep learning for generic object detection: A survey. arXiv 2018, arXiv:1809.02165. [Google Scholar] [CrossRef]
  18. Zhao, Z.-Q.; Zheng, P.; Xu, S.-T.; Wu, X. Object Detection with Deep Learning: A Review. IEEE Trans. Neural Netw. Learn. Syst. 2019, 30, 3212–3232. [Google Scholar] [CrossRef]
  19. Redmon, J.; Divvala, S.; Girshick, R.; Farhadi, A. You Only Look Once: Unified, Real-Time Object Detection. In Proceedings of the 2016 IEEE Conference on Computer Vision and Pattern Recognition (CVPR), Las Vegas, NV, USA, 27–30 June 2016; pp. 779–788. [Google Scholar] [CrossRef]
  20. Rathore, D.; Divyanth, L.G.; Reddy, K.L.S.; Chawla, Y.; Buragohain, M.; Soni, P.; Machavaram, R.; Hussain, S.Z.; Ray, H.; Ghosh, A. A Two-Stage Deep-Learning Model for Detection and Occlusion-Based Classification of Kashmiri Orchard Apples for Robotic Harvesting. J. Biosyst. Eng. 2023, 48, 242–256. [Google Scholar] [CrossRef]
  21. Chen, J.; Liu, H.; Zhang, Y.; Zhang, D.; Ouyang, H.; Chen, X. A Multiscale Lightweight and Efficient Model Based on YOLOv7: Applied to Citrus Orchard. Plants 2022, 11, 3260. [Google Scholar] [CrossRef] [PubMed]
  22. Puri, P.; Kumar, D.; Kukreja, V. Enhanced Detection of Wheat Mosaic Virus Using YOLOV5 Model with Adaptive Thresholding. In Proceedings of the 2023 4th International Conference for Emerging Technology (INCET), Belgaum, India, 26–28 May 2023; pp. 1–6. [Google Scholar] [CrossRef]
  23. Li, Z.; Yan, J.; Zhou, J.; Fan, X.; Tang, J. An efficient SMD-PCBA detection based on YOLOv7 network model. Eng. Appl. Artif. Intell. 2023, 124, 106492. [Google Scholar] [CrossRef]
  24. Singhi, V.; Kumar, D.; Kukreja, V. Integrated YOLOv4 Deep Learning Pretrained Model for Accurate Estimation of Wheat Rust Disease Severity. In Proceedings of the 2023 2nd International Conference on Applied Artificial Intelligence and Computing (ICAAIC), Salem, India, 4–6 May 2023; pp. 489–494. [Google Scholar] [CrossRef]
  25. Wang, C.-Y.; Bochkovskiy, A.; Liao, H.-Y.M. YOLOv7: Trainable Bag-of-Freebies Sets New State-of-the-Art for Real-Time Object Detectors. In Proceedings of the 2023 IEEE/CVF Conference on Computer Vision and Pattern Recognition (CVPR), Vancouver, BC, Canada, 18–22 June 2023; pp. 7464–7475. [Google Scholar] [CrossRef]
  26. Prasetyo, E.; Suciati, N.; Fatichah, C. Yolov4-tiny and Spatial Pyramid Pooling for Detecting Head and Tail of Fish. In Proceedings of the 2021 International Conference on Artificial Intelligence and Computer Science Technology (ICAICST), Yogyakarta, Indonesia, 29–30 June 2021; pp. 157–161. [Google Scholar] [CrossRef]
  27. Cai, Y.; Li, H.; Yuan, G.; Niu, W.; Li, Y.; Tang, X.; Ren, B.; Wang, Y. YOLObile: Real-Time Object Detection on Mobile Devices via Compression-Compilation Co-Design. Proc. Conf. AAAI Artif. Intell. 2021, 35, 955–963. [Google Scholar] [CrossRef]
  28. Luo, J. Research on Model Pruning Algorithms for Deep Convolutional Neural Networks. Ph.D. Thesis, Nanjing University, Nanjing, China, 2020. [Google Scholar] [CrossRef]
  29. Ju, M.; Luo, H.; Wang, Z.; He, M.; Chang, Z.; Hui, B. Improved YOLO V3 algorithm and its application in small target detection. J. Opt. 2019, 39, 253–260. Available online: https://kns.cnki.net/kcms/detail/detail.aspx?FileName=GXXB201907028&DbName=CJFQ2019 (accessed on 23 July 2023).
  30. Feng, S.Y.; Mei, W.; Hu, D.S. Airborne target detection based on impr-oved Faster R-CNN. J. Opt. 2018, 38, 250–258. Available online: https://kns.cnki.net/kcms/detail/detail.aspx?FileName=GXXB201806034&DbName=CJFQ2018 (accessed on 12 July 2023).
  31. Ren, S.Q.; He, K.M.; Girshick, R.; Sun, J. Faster R-CNN: Towards Real-Time Object Detection with Region Proposal Networks. Proc. Adv. Neural Inf. Process. Syst. 2015, 91, 99. [Google Scholar] [CrossRef]
  32. Zhou, K.; Wang, W.; Hu, T.; Deng, K. Time Series Forecasting and Classification Models Based on Recurrent with Attention Mechanism and Generative Adversarial Networks. Sensors 2020, 20, 7211. [Google Scholar] [CrossRef] [PubMed]
Figure 1. Example of code 0111.
Applsci 13 10202 g001
Figure 2. Images sourced from the dataset. Samples (ad) correspond to the following codes: 0111, 01111S, 01111L, and 01111, respectively.
Applsci 13 10202 g002
Figure 3. An image extracted from the dataset of workpieces featuring small and large holes is presented in Figure (a). The image showcases the annotated results of the small and large holes on sample 10111. (b) presents the identification and coordinates of the small and large holes as indicated in (a).
Applsci 13 10202 g003
Figure 4. Technical flow of the proposed method.
Applsci 13 10202 g004
Figure 5. YOLOv7-based identification of trolley codes.
Applsci 13 10202 g005
Figure 6. Curves depicting the training loss of the YOLOv7 model. The terms box_loss, obj_loss, cls_loss, and total_loss are denoted as (ad), respectively.
Applsci 13 10202 g006
Figure 7. Results of identification of trolley codes by YOLOv7. (ad) are samples 01111S, 0111, 01111L, and 01111N, respectively.
Applsci 13 10202 g007aApplsci 13 10202 g007b
Figure 8. Diagram of pruning using the channel pruning algorithm.
Applsci 13 10202 g008
Figure 9. Changes in access before and after pruning. (a) Number of channels before pruning. (b) Number of channels after pruning.
Applsci 13 10202 g009
Figure 10. Results of the fine-tuned model in terms of detecting holes. (ac) are its precision, recall and mAP_0.5, respectively.
Applsci 13 10202 g010
Figure 11. Example of a hole not being detected correctly when the shooting distance is 30 cm. (a) Case of not correctly identifying the correct position of the hole in sample 0111. (b) Case of not correctly identifying the correct position of the hole in sample 011.
Applsci 13 10202 g011
Figure 12. Results of identification of large and small holes under different intensities of light. (a) A case of correctly identifying the hole position in sample 01111S under low light conditions. (b) A case of correctly identifying the position of the hole in sample 01111L under bright light conditions.
Applsci 13 10202 g012
Table 1. Information from the dataset.
Sample Model CodingNumber of Samples
01111N423
01111L426
01111S302
01111408
Table 2. Parameters of the YOLOv7 model.
ParameterValue
Image size640 × 640
Learning rate0.001
Batch32
Number of categories2
Number of iterations300
Table 3. The main parameters of channel pruning.
StepPhase ParameterValue
Sparse trainingSparse training batch size32
Learning rate0.001
Number of iterations300
Channel pruningAccess pruning; pruning rate0.8
Fine-tuningModel fine-tuning batch size32
Number of iterations100
Table 4. Changes in the parameters of the model after channel pruning.
ParameterOriginal NetworkPruned NetworkFine-Tuned Network
Number of parameters37,201,95025,289,95424,813,245
mAP (%)99.5899.1599.24
Model size (MB)73.048.647.63
Forward extrapolation time (ms)15.79.758.1
Table 5. Results of different target detection algorithms in terms of identifying small and large holes.
AlgorithmNumber of ParametersModel Size (MB)mAP (%)Forward Propagation Time (ms)
YOLOv5x88,922,20516698.38114
YOLOv462,941,672237.8397.52163
YOLOv5m21,172,17340.898.2133.9
YOLOv5s7,025,02314.198.0618.8
YOLOv5n1,867,4053.8797.738.6
Ours24,813,24547.6399.248.1
Disclaimer/Publisher’s Note: The statements, opinions and data contained in all publications are solely those of the individual author(s) and contributor(s) and not of MDPI and/or the editor(s). MDPI and/or the editor(s) disclaim responsibility for any injury to people or property resulting from any ideas, methods, instructions or products referred to in the content.

