
Quantitative Analysis of Coal Quality by a Portable Laser Induced Breakdown Spectroscopy and Three Chemometrics Methods

Abstract
:1. Introduction
2. Materials and Methods
2.1. Instrumentation
2.2. Coal Samples
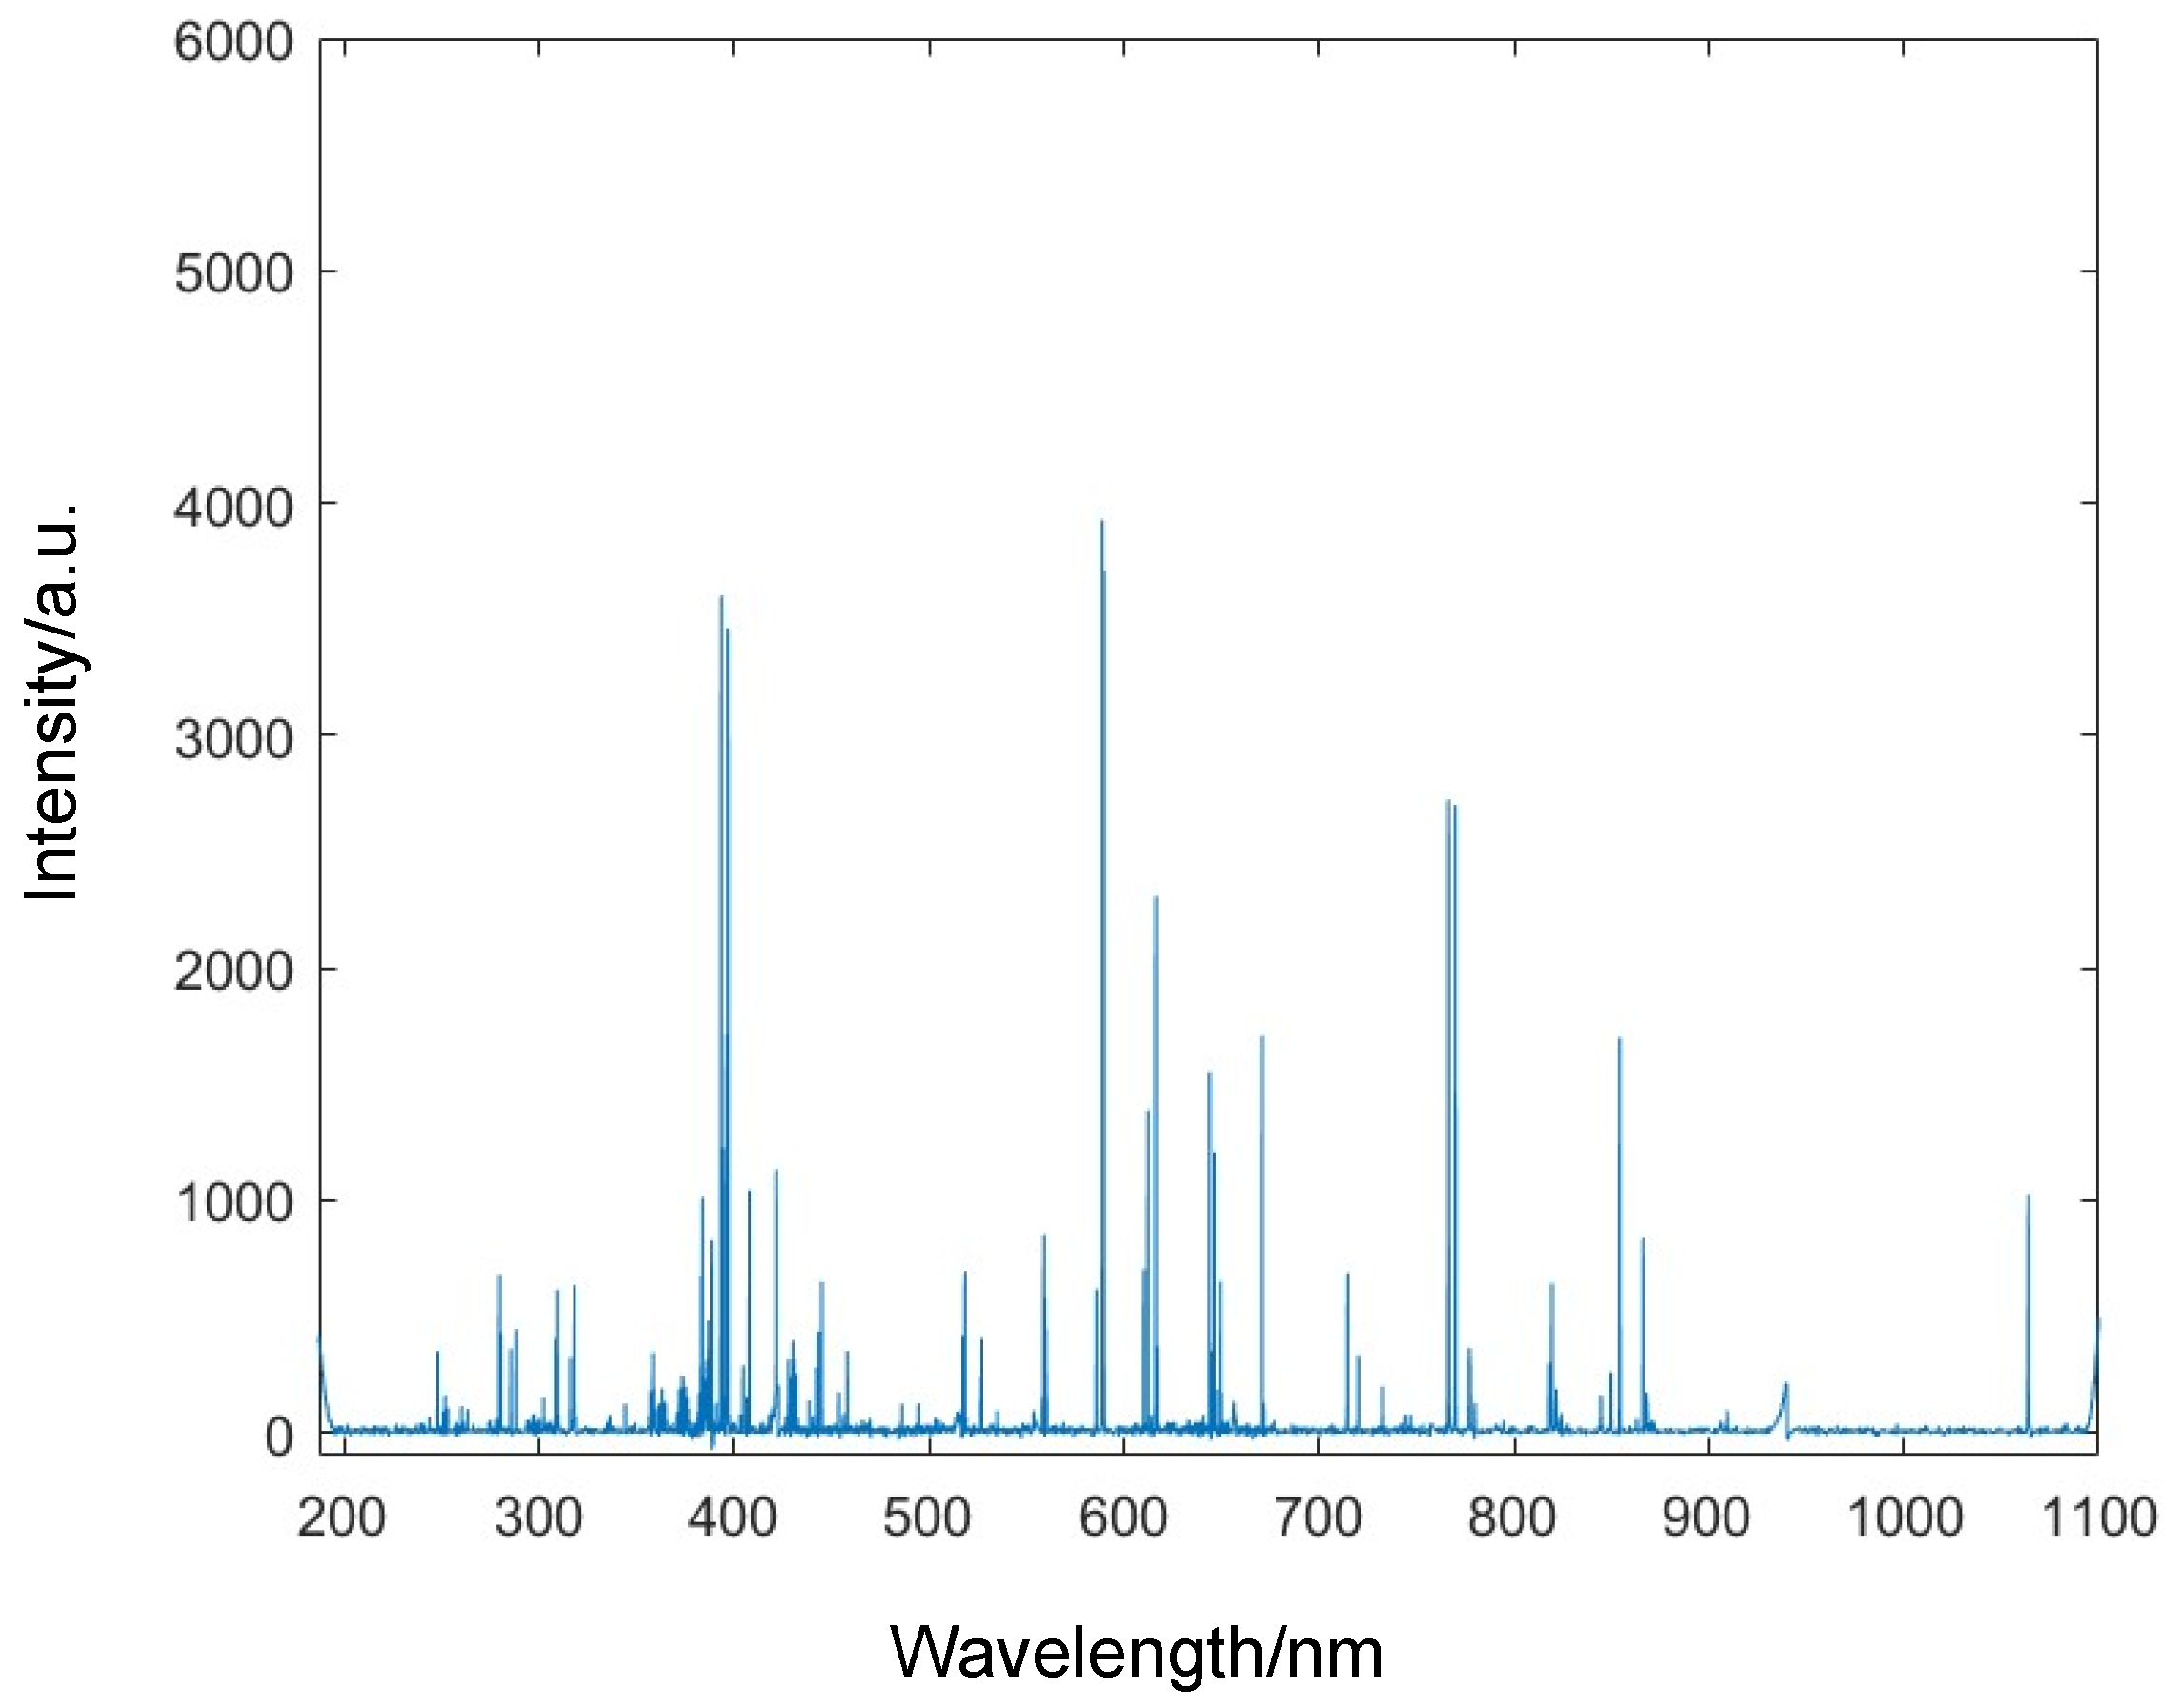
2.3. Spectral Line Selection
2.4. Data Partitioning Method
2.5. Quantitative Algorithms
3. Results and Discussion
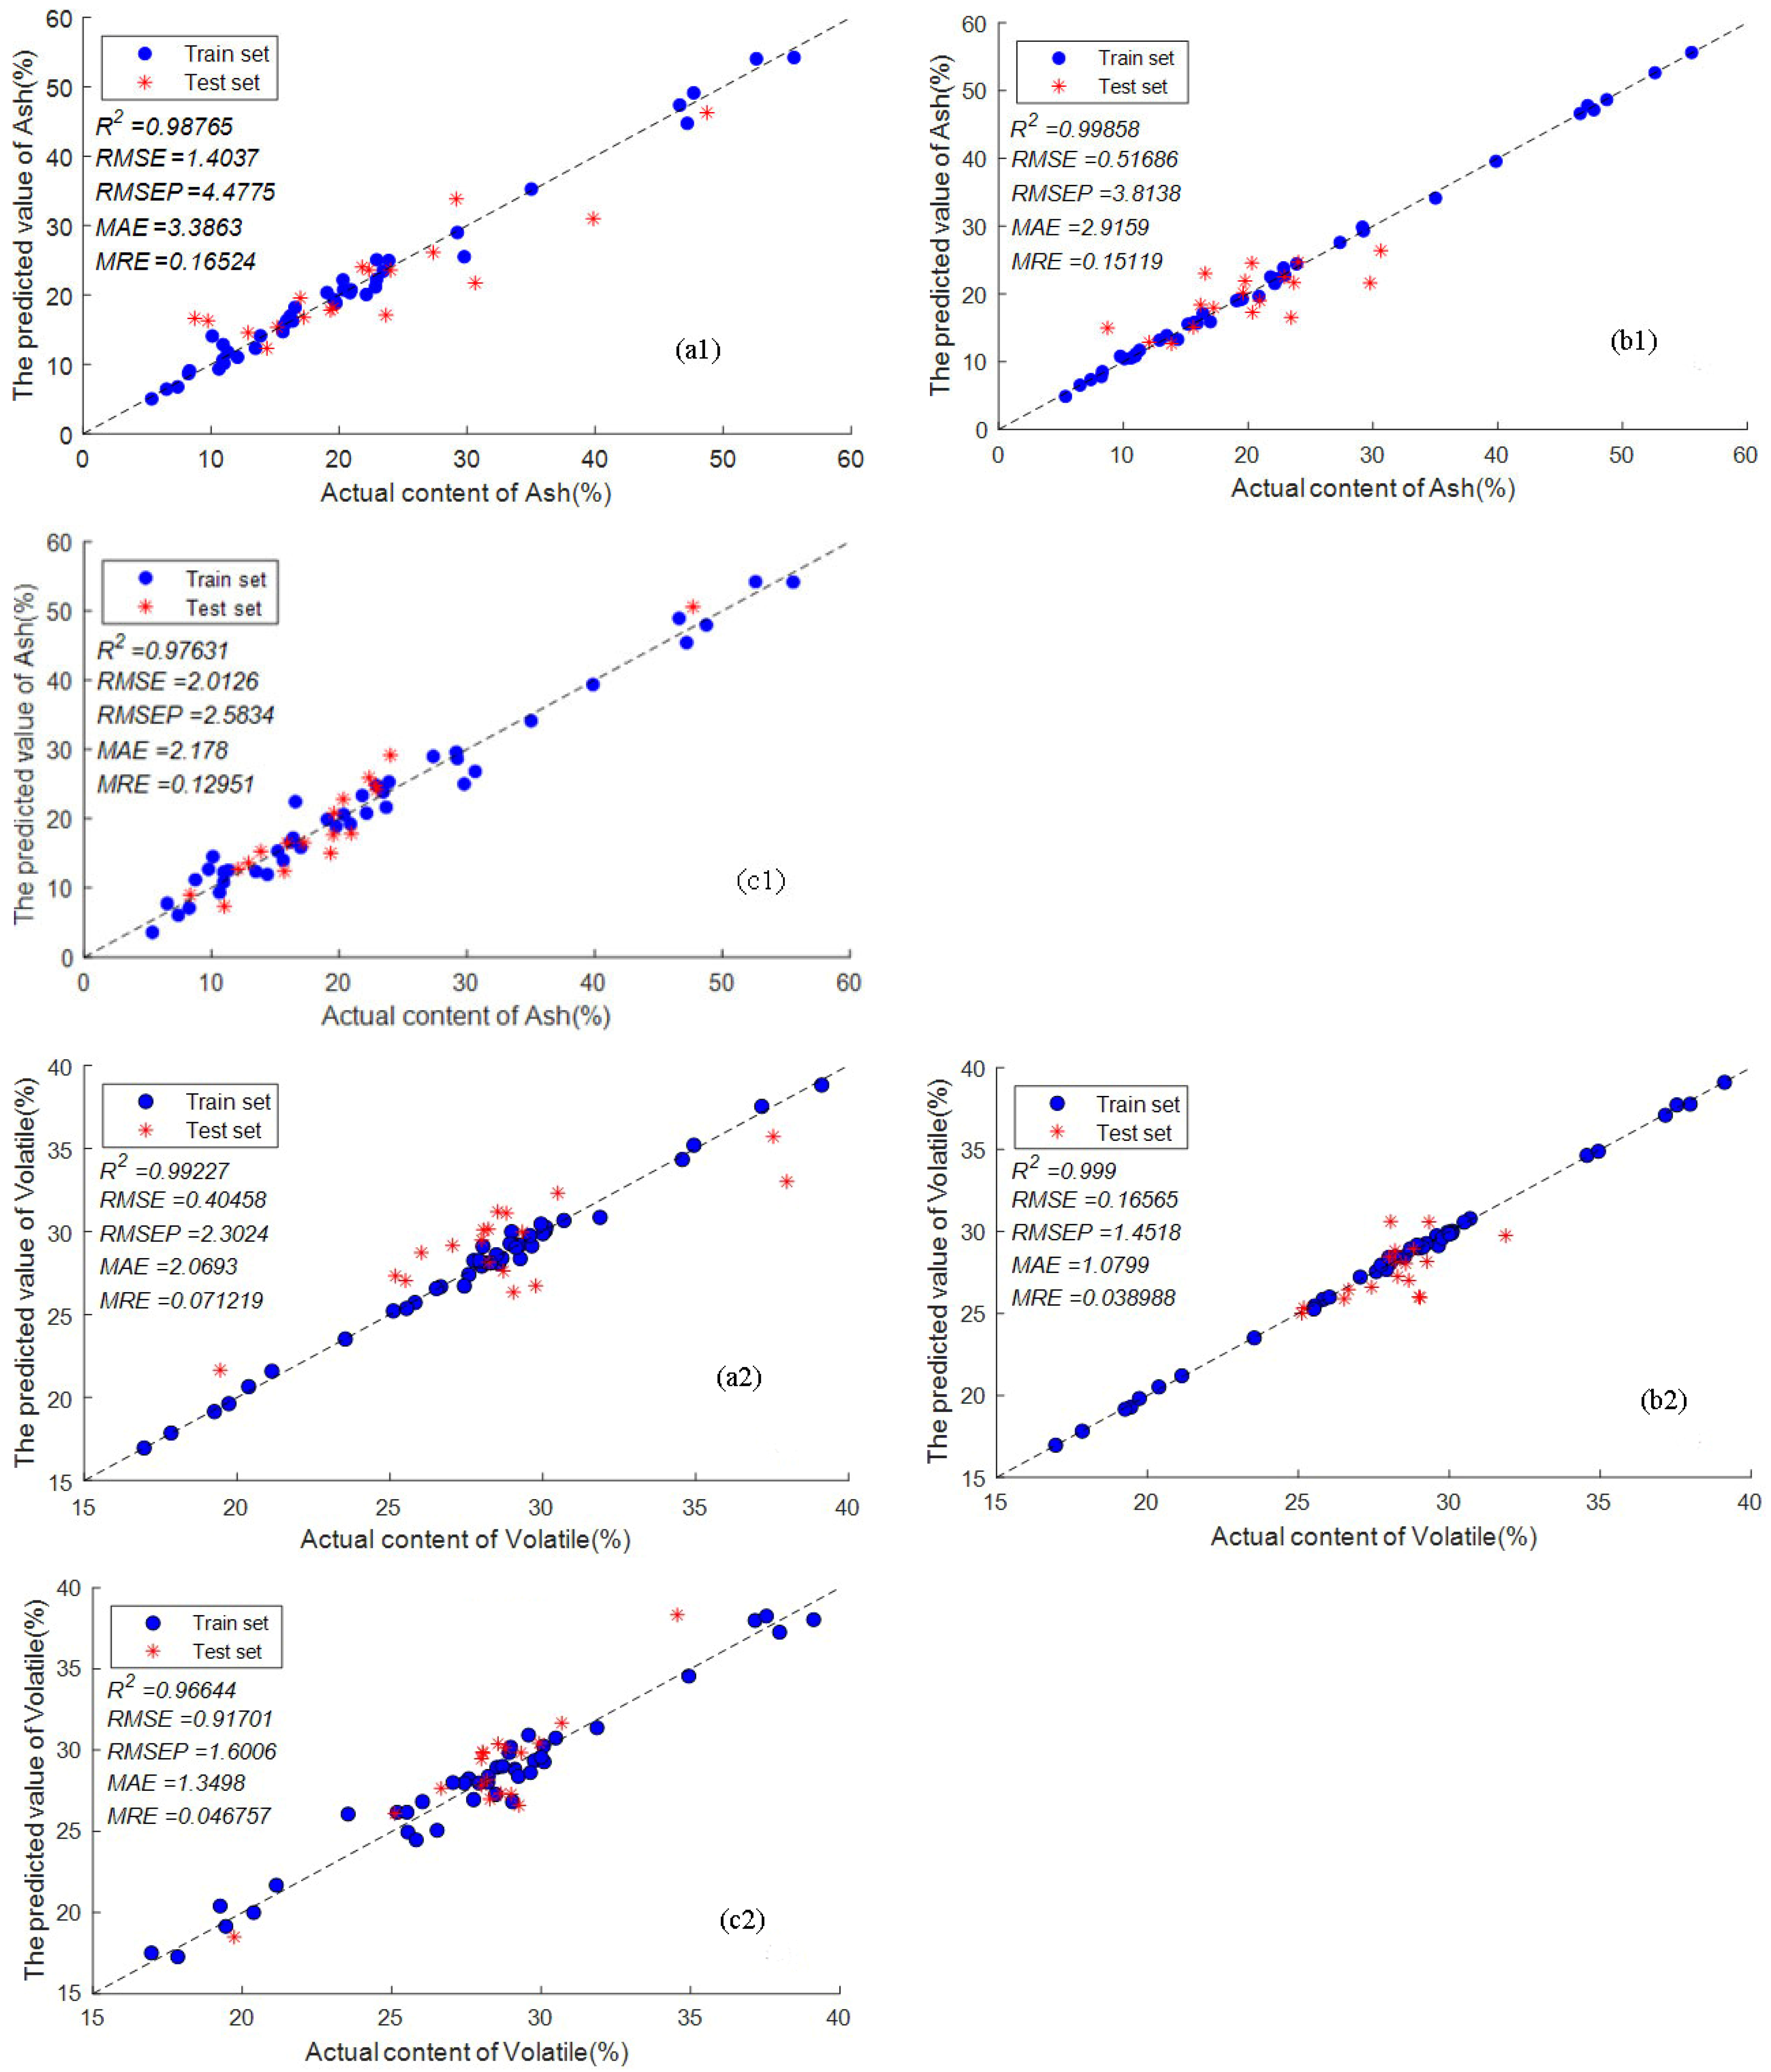
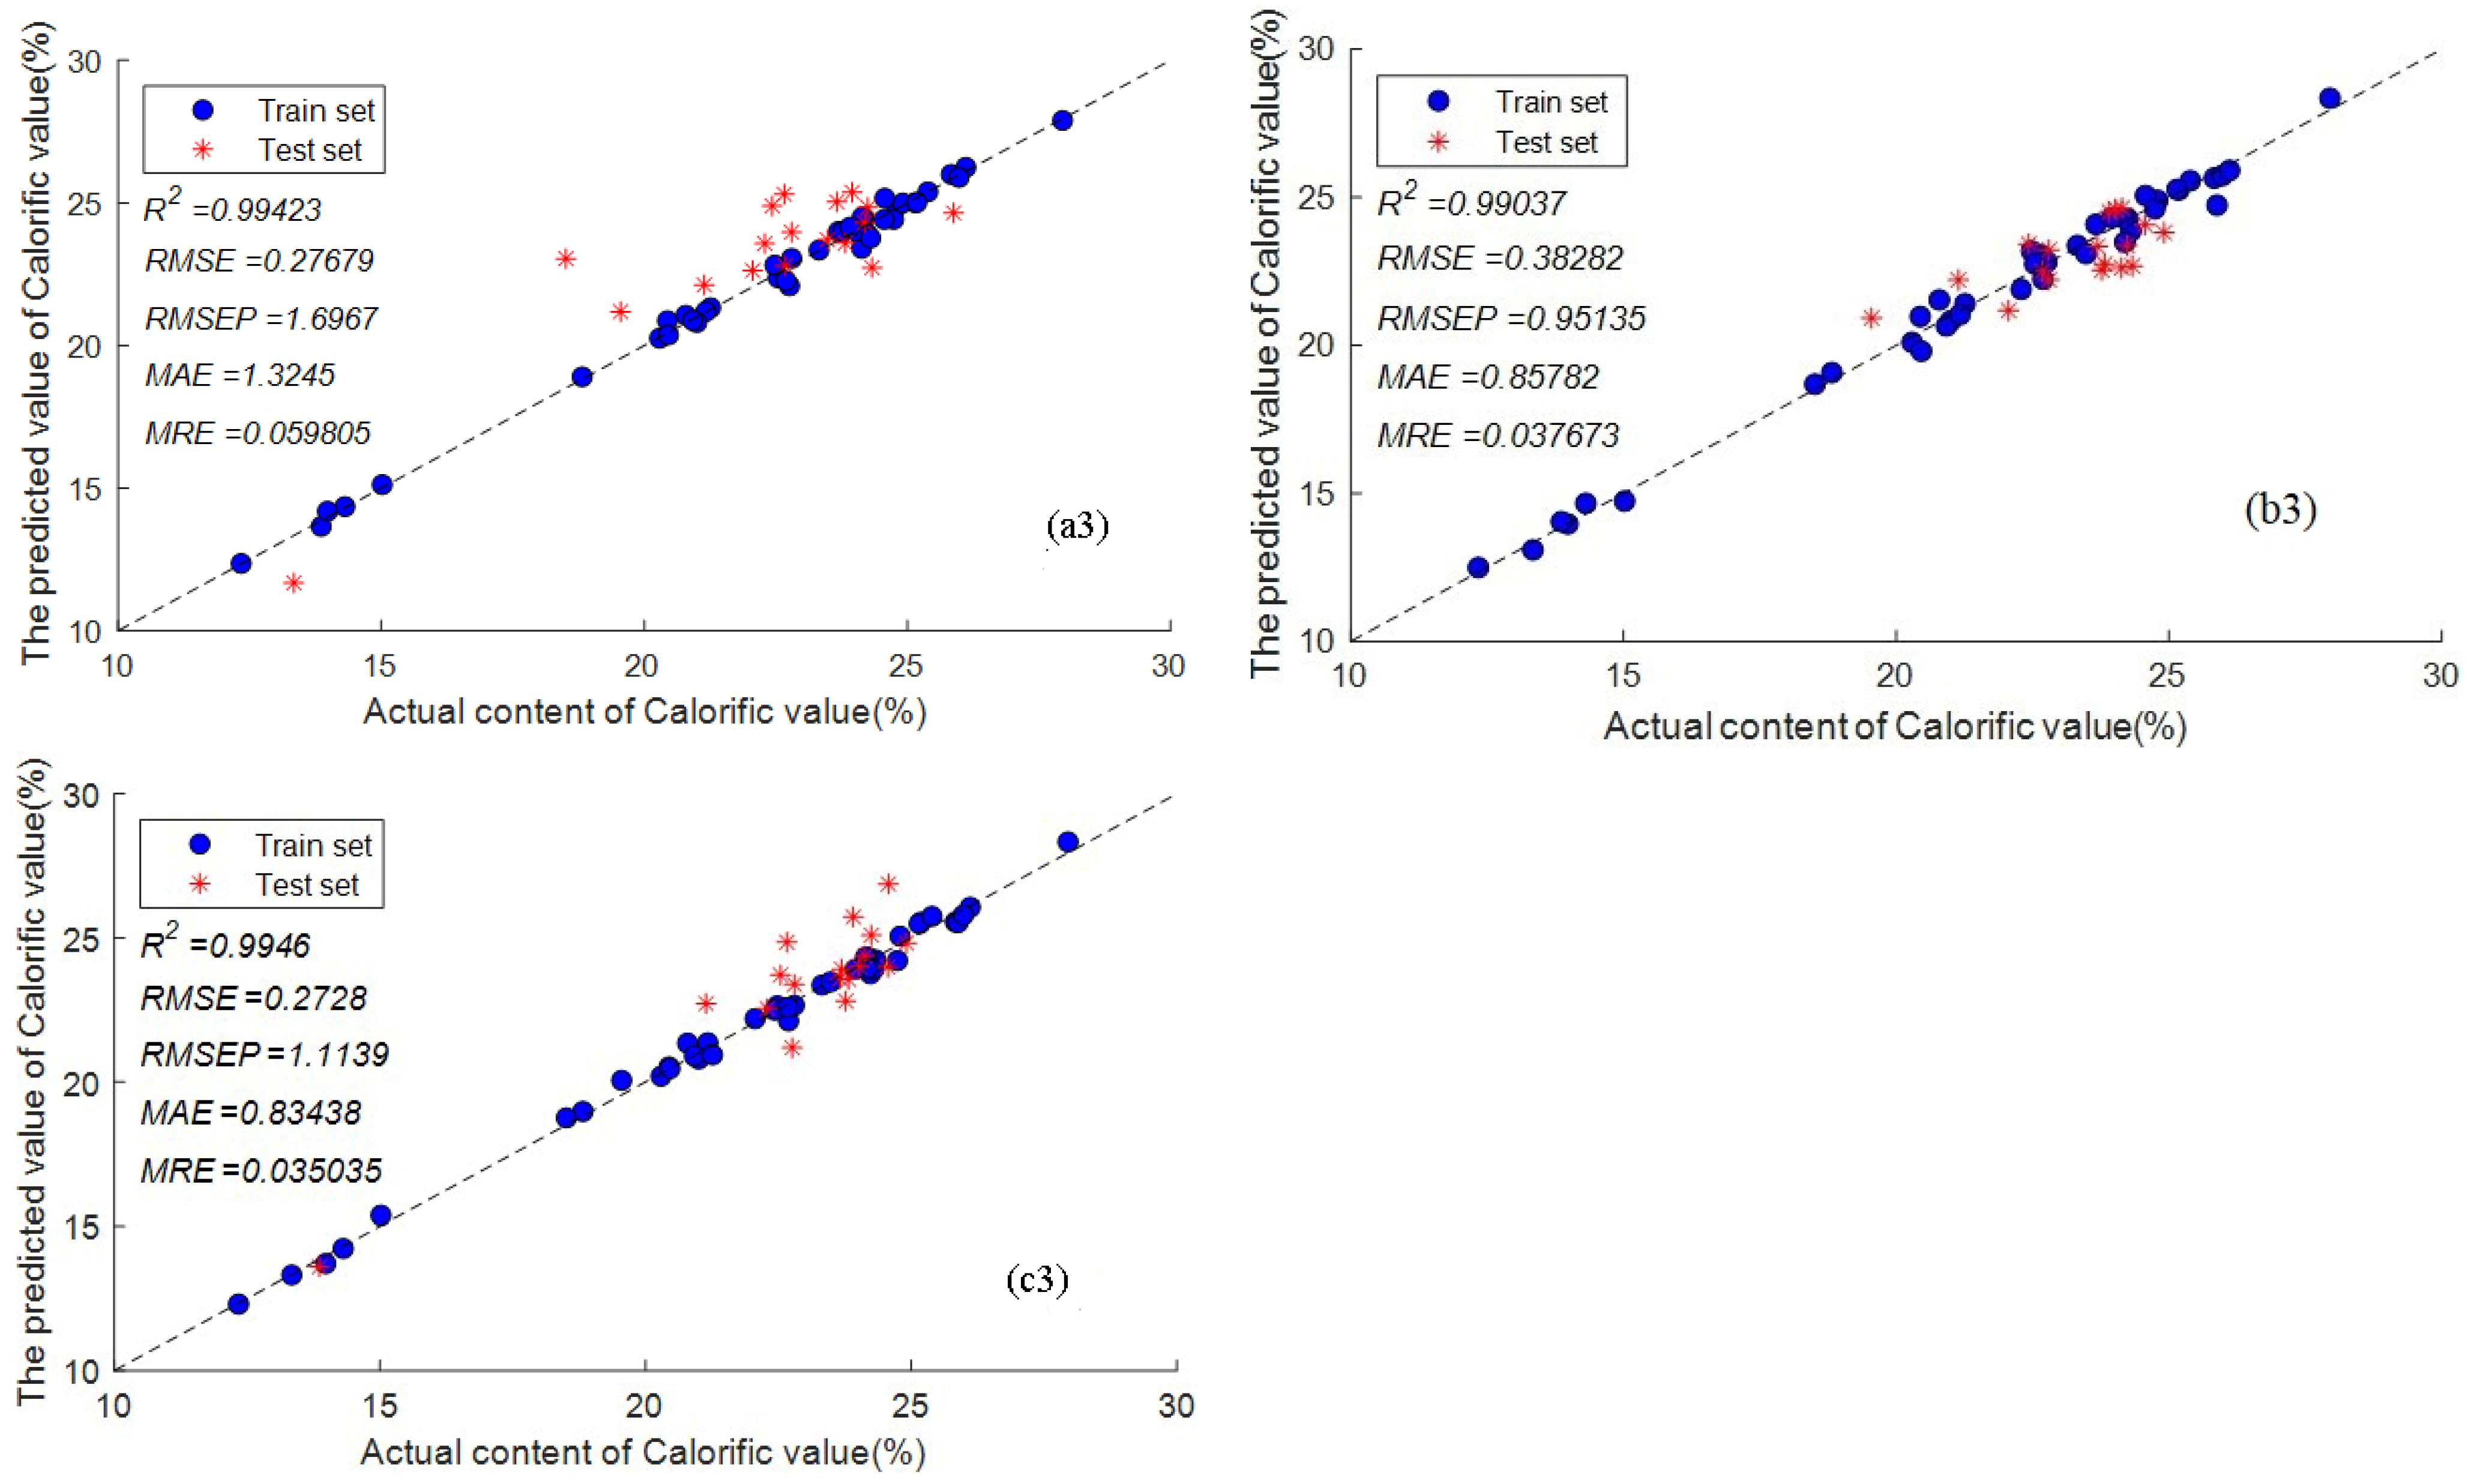
3.1. Predicted Results of PLSR
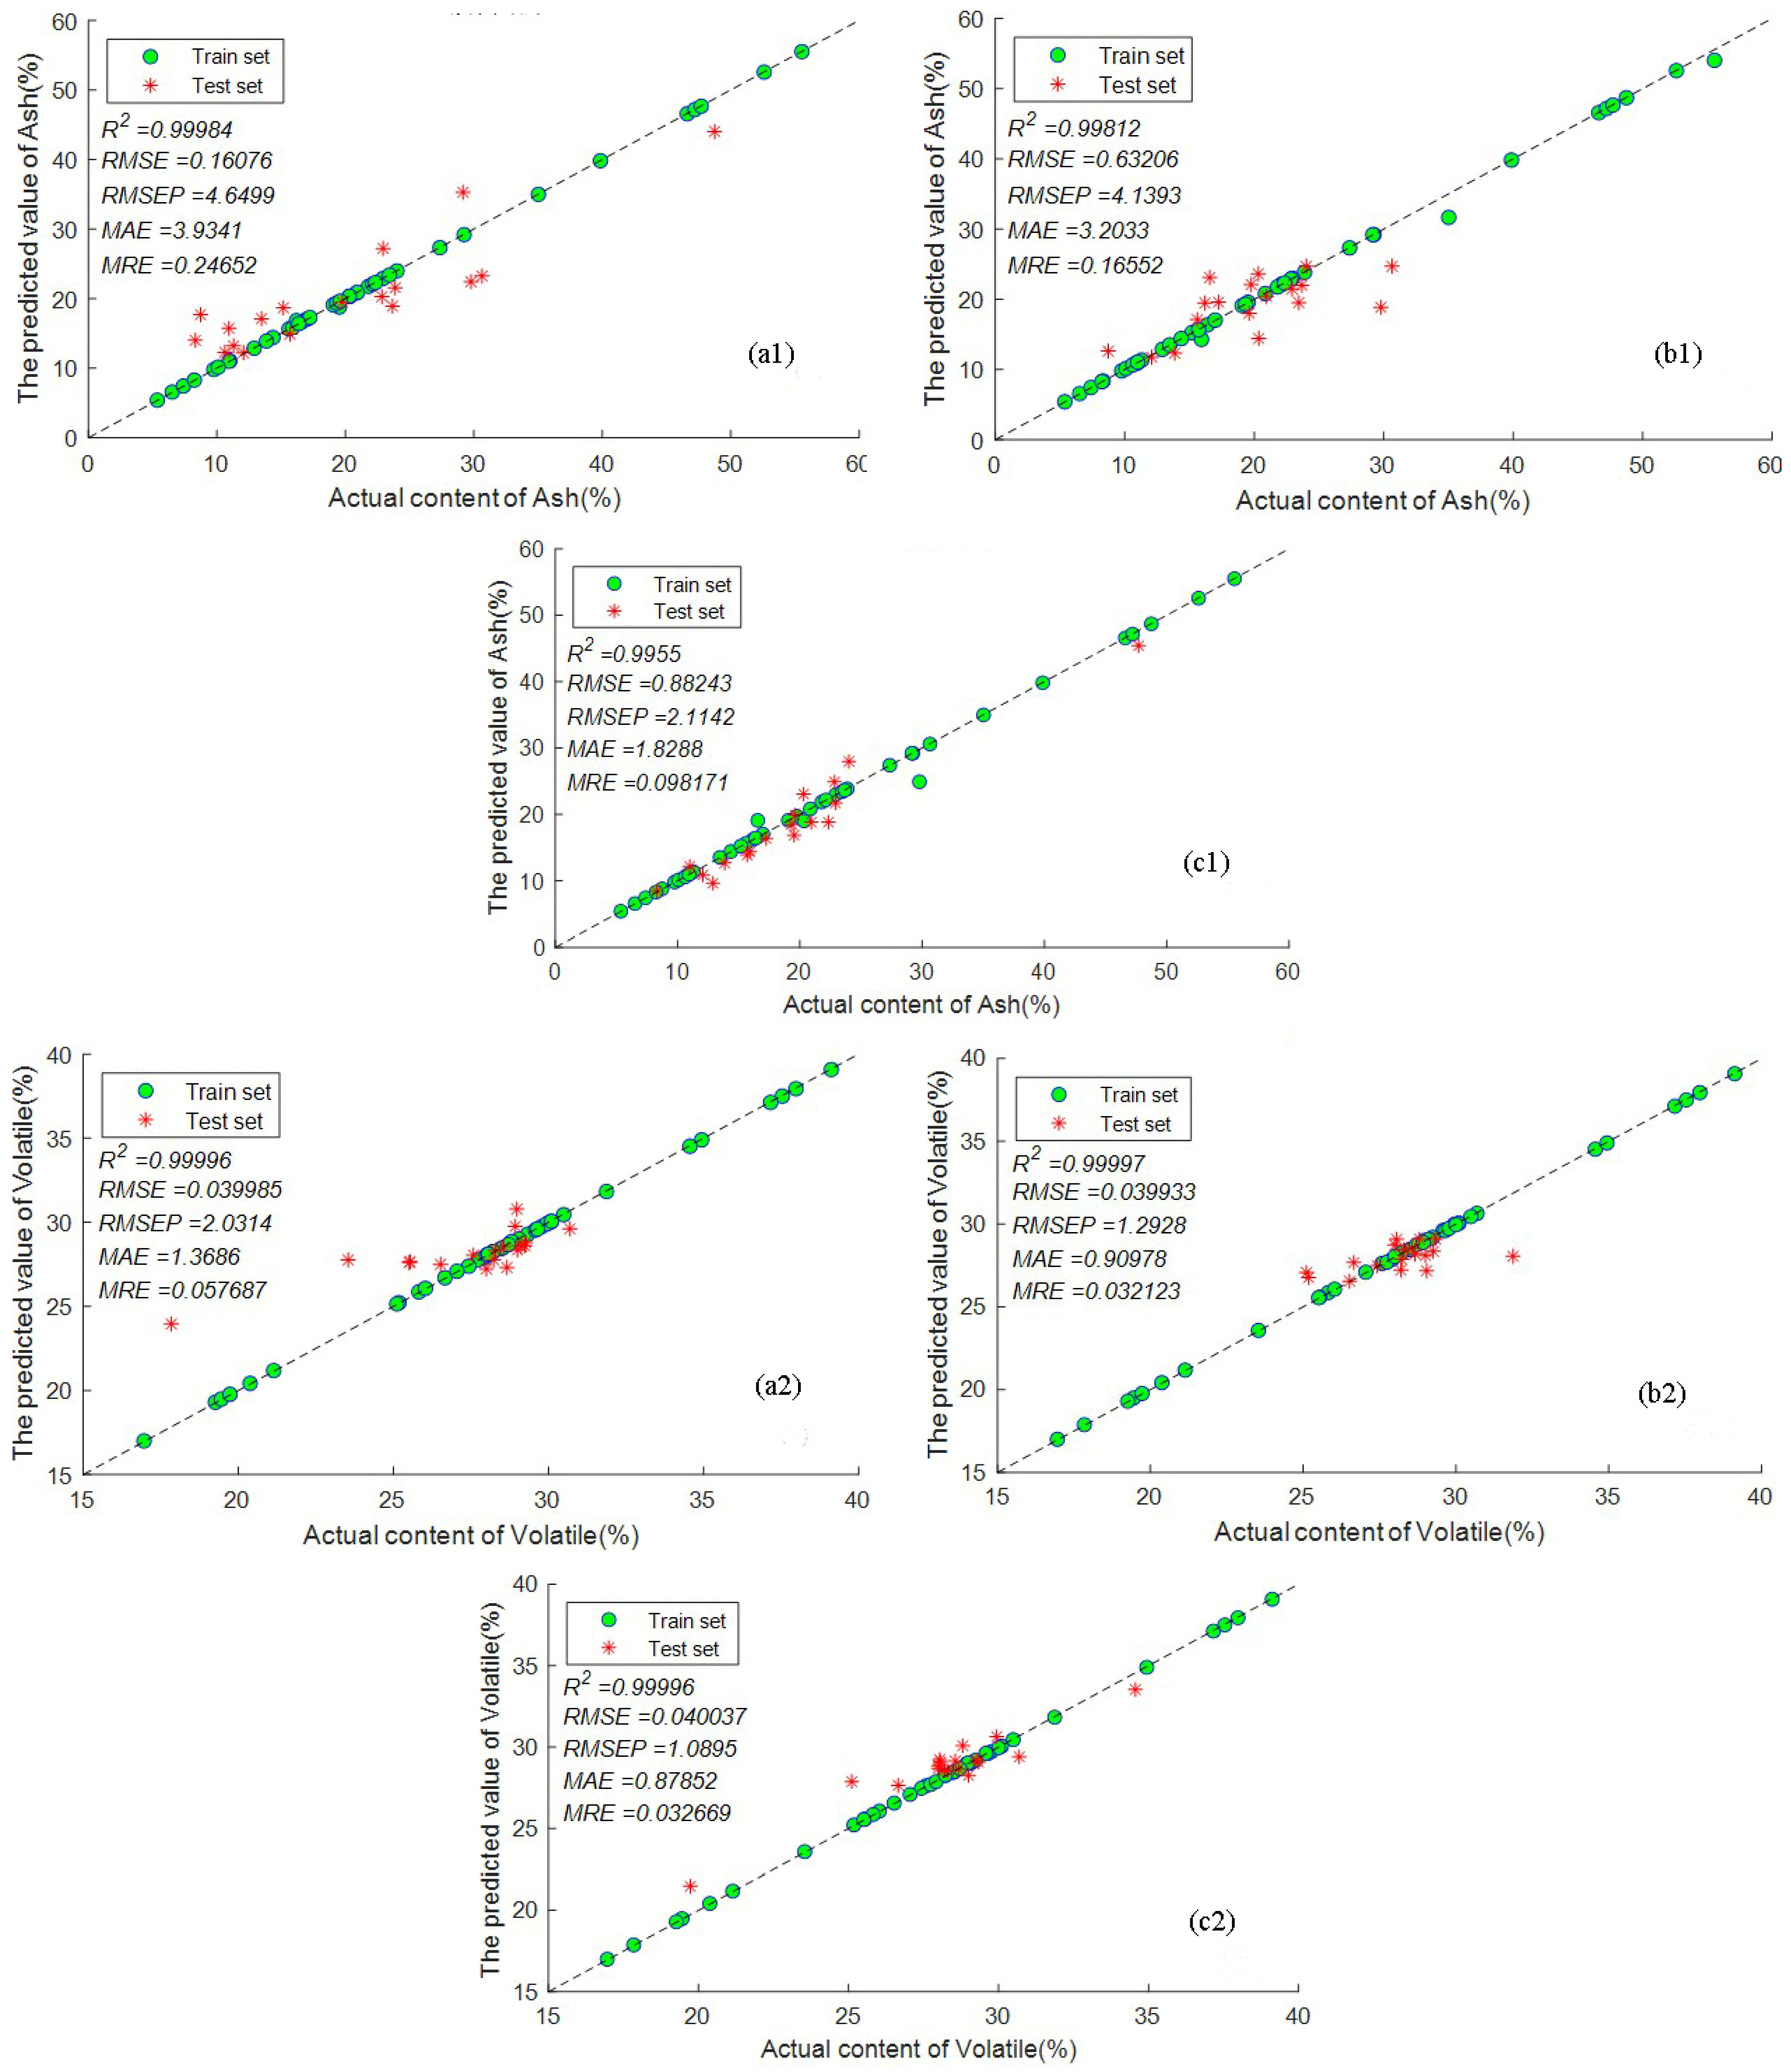
3.2. Prediction Results of SVR
3.3. Predicted Results of RF
4. Conclusions
Author Contributions
Funding
Institutional Review Board Statement
Informed Consent Statement
Data Availability Statement
Acknowledgments
Conflicts of Interest
References
- GB/T 213-2008; Determination of Calorific Value of Coal. Standardization Administration of People’s Republic of China: Beijing, China, 2008.
- GB-T 214-2007; Determination of Total Sulfur in Coal. Standardization Administration of People’s Republic of China: Beijing, China, 2007.
- GB/T 30732-2014; Proximate Analysis of Coal by Instrumental Method. Standardization Administration of People’s Republic of China: Beijing, China, 2014.
- Miziolek, A.W.; Palleschi, V.; Schechter, I. Laser Induced Breakdown Spectroscopy; (LIBS): Fundamentals and Applications; Cambridge University Press: Cambridge, UK, 2006. [Google Scholar]
- Zhang, Y.J.; Xiong, Z.; Ma, Y.W.; Zhu, C.W.; Zhou, R.; Li, X.Y.; Li, Q.; Zeng, Q.D. Quantitative Analysis of Coal Quality by Laser-induced Breakdown Spectroscopy Assisted with Different Chemometric Methods. Anal. Methods 2020, 12, 3530–3536. [Google Scholar] [CrossRef] [PubMed]
- Gottfried, J.L.; Harmon, R.S.; Lucia, F.C.; Miziolek, A.W. Multivariate analysis of laser-induced breakdown spectroscopy chemical signatures for geomaterial classification. Spectrochim. Acta Part B 2009, 64, 1009–1019. [Google Scholar] [CrossRef]
- Aragon, C.; Aguilera, J.A. Direct analysis of aluminum alloys by CSigma laser induced breakdown spectroscopy. J. Anal. Chim. Acta 2018, 1009, 12–19. [Google Scholar] [CrossRef] [PubMed]
- Bhatt, B.; Angeyo Kalambuka, H.A.; Dehayem-Kamadjeu, A. LIBS development methodology for forensic nuclear materials analysis. Anal. Methods 2018, 10, 791–798. [Google Scholar] [CrossRef]
- Brunnbauer, L.; Gajarska, Z.; Lohninger, H.A. Limbeck A critical review of recent trends in sample classification using Laser-Induced Breakdown Spectroscopy (LIBS). Trend Anal. Chem. 2023, 159, 116859. [Google Scholar] [CrossRef]
- Rajavelu, H.; Vasa, N.J.; Seshadri, S. Effect of ambiance on the coal characterization using laser-induced breakdown spectroscopy (LIBS). Appl. Phys. A 2020, 126, 395. [Google Scholar] [CrossRef]
- Liu, K.; He, C.; Zhu, C.W.; Chen, J.; Zhan, K.P.; Li, X.Y. A review of laser-induced breakdown spectroscopy for coal analysis. Trend Anal. Chem. 2021, 143, 116357. [Google Scholar] [CrossRef]
- Iqbal, S.M.Z.; Uddin, Z.; Umar, Z.A.; Ahmed, N.; Ahmed, R.; Baig, M.A. Analysis of Lakhra Coal by Calibration Free Laser-Induced Breakdown Spectroscopy (CF-LIBS) and Comparison of Self-Absorption Correction Procedures. Anal. Lett. 2022, 55, 11–23. [Google Scholar] [CrossRef]
- Sheta, S.; Afgan, M.S.; Hou, Z.; Yao, S.C.; Zhang, L.; Li, Z.; Wang, Z. Coal analysis by laser-induced breakdown spectroscopy: A tutorial review. J. Anal. Atom. Spectrom. 2019, 34, 1047–1082. [Google Scholar] [CrossRef]
- Legnaioli, S.; Campanella, B.; Pagnotta, S.; Poggialini, F.; Palleschi, V. Determination of Ash Content of coal by Laser-Induced Breakdown Spectroscopy. Spectrochim. Acta Part B 2019, 155, 123–126. [Google Scholar] [CrossRef]
- Ma, Y.W.; Zhang, W.; Xiong, Z.; Cui, H.; Li, Q.; Zhou, R.; Zhang, Y.; Li, X.; Zeng, X.; Li, Q. Accurate sulfur determination of coal using double-pulse laser-induced breakdown spectroscopy. J. Anal. Atom. Spectrom. 2020, 35, 1458–1463. [Google Scholar] [CrossRef]
- Petrovic, J.; Savovic, J.; Rankovic, D.; Kuzmanovic, M. Quantitative Analysis of Coal by Laser-Induced Breakdown Spectroscopy Using TEA CO2 Laser as the Excitation Source. Plasma Chem. Plasma Process. 2022, 42, 519–533. [Google Scholar] [CrossRef]
- Zhang, W.H.; Zhuo, Z.; Lu, P.; Tang, J.; Tang, H.; Lu, J.; Xing, T.; Wang, Y. LIBS analysis of ash content, volatile matter, and calorific value in coal by partial least squares regression based on ash classification. J. Anal. Atom. Spectrom. 2020, 35, 1621–1631. [Google Scholar] [CrossRef]
- Wang, W.; Kong, W.; Shen, T.; Man, Z.; Zhu, W.; He, Y.; Liu, F. Quantitative analysis of cadmium in rice roots based on LIBS and chemometrics methods. Environ. Sci. Eur. 2021, 33, 37. [Google Scholar] [CrossRef]
- Idris, N.; Pardede, M.; Jobiliong, E.; Lie, Z.S.; Hedwig, R.; Suliyanti, M.M.; Kurniawan, D.P.; Kurniawan, K.H.; Kagawa, K.; Tjia, M.O. Enhancement of carbon detection sensitivity in laser induced breakdown spectroscopy with low pressure ambient helium gas. Spectrochim. Acta Part B 2019, 151, 26–32. [Google Scholar] [CrossRef]
- Palleschi, V. Chemometrics and Numerical Methods in LIBS; John Wiley & Sons Ltd.: Hoboken, NJ, USA, 2022. [Google Scholar]
- Ewusi-Annan, E.; Delapp, D.M.; Wiens, R.C.; Melikechi, N. Automatic preprocessing of laser-induced breakdown spectra using partial least squares regression and feed-forward artificial neural network: Applications to Earth and Mars data. Spectrochim. Acta Part B 2020, 171, 105930. [Google Scholar] [CrossRef]
- Li, X.; Yang, Y.; Li, G.; Chen, B.; Hu, W. Accuracy improvement of quantitative analysis of calorific value of coal by combining support vector machine and partial least square methods in laser-induced breakdown spectroscopy. Plasma Sci. Technol. 2020, 22, 074014. [Google Scholar] [CrossRef]
- Sánchez-Esteva, S.; Knadel, M.; Kucheryavskiy, S.; de Jonge Lis, W.G.; Rubæk, H.; Hermansen, C.; Heckrath, G. Combining Laser-Induced Breakdown Spectroscopy (LIBS) and Visible Near-Infrared Spectroscopy (Vis-NIRS) for Soil Phosphorus Determination. Sensors 2020, 20, 5419. [Google Scholar] [CrossRef]
- Andres, J. Retraction: Novel techniques for enhancing the performance of support vector regression chemo-metric in quantitative analysis of LIBS spectra. J. Anal. Atom. Spectrom. 2019, 34, 2477. [Google Scholar] [CrossRef]
- Zhang, Y.; Dong, M.; Cheng, L.; Wei, L.; Cai, J.; Lu, J. Improved measurement in quantitative analysis of coal properties using laser induced breakdown spectroscopy. J. Anal. Atom. Spectrom. 2020, 35, 810–818. [Google Scholar] [CrossRef]
- Kramida, A.; Ralchenko, Y.; Reader, J. NIST Atomic Spectra Database (ver. 5.10). 2022. Available online: https://physics.nist.gov/asd (accessed on 3 January 2023).
- Kennard, R.W.; Stone, L.A. Computer aided design of experiments. Technometrics 1969, 11, 137–148. [Google Scholar] [CrossRef]
- Morais, C.L.M.; Santos, M.C.D.; Lima, K.M.G.; Martin, F.L. Improving data splitting for classification applications in spectrochemical analyses employing a random-mutation Kennard-Stone algorithm approach. Bioinformatics 2019, 35, 5257–5263. [Google Scholar] [CrossRef] [PubMed]
- Wu, W.; Walczak, B.; Massart, D.L. Artificial neural networks in classification of NIR spectral data: Design of the training set. Chemom. Intell. Lab. Syst. 1996, 33, 35–46. [Google Scholar] [CrossRef]
- Gad, A.D. Particle Swarm Optimization Algorithm and Its Applications: A Systematic Review. Arch. Comput. Methods Eng. 2022, 29, 2531–2561. [Google Scholar] [CrossRef]
- Huang, S.H.; Tian, L.; Zhang, J.S.; Chai, X.L.; Wang, H.L.; Zhan, H.L. Support Vector Regression Based on the Particle Swarm Optimization Algorithm for Tight Oil Recovery Prediction. ACS Omega 2021, 6, 32142–32150. [Google Scholar] [CrossRef]


| Element | Wavelength/nm |
|---|---|
| C | 247.8561 |
| H | 434.0462; 656.2819; 656.2852 |
| O | 407.5862; 441.4905; 777.1944; 777.5388 |
| Si | 288.1577 |
| Al | 308.2153; 309.2710; 394.4006; 396.1520 |
| Mg | 279.5528; 280.2704; 285.2127 |
| Ca | 315.8869; 317.9332; 393.3661; 396.8467; 422.6727 |
| Fe | 259.9396; 404.5813; 438.35449 |
| K | 766.4899; 769.8965 |
| Ti | 334.9405; 336.1227; 337.2798; 338.3769 |
| Na | 588.9950; 589.5924 |
| Li | 460.2898; 670.7775 |
| Industrial Index | Elements | Input Variables |
|---|---|---|
| Ash content | Si, Al, Mg, K, Ti, Fe, Na, Ca, Li | 287.917~288.505; 308.055~308.615; 308.845~309.827; 394.060~394.714; 395.448~396.508; 279.268~279.683; 765.247~766.938; 768.723~770.204; 335.712~336.326; 438.056~438.580; 588.252~590.309; 392.915~393.815; 396.508~397.483; 422.186~423.116; 669.629~671.148 |
| Volatile matter | C, CN, H, O, Al, Mg, Ca, Fe | 247.332~248.302; 380.918~390.123; 648.881~661.868; 773.839~779.961; 394.060~394.714; 395.448~396.508; 279.268~279.683; 392.915~393.815; 396.508~397.483; 438.056~438.580 |
| Calorific value | C, C2, CN, H, O, Al, Mg, Ca, Fe, Si | 247.332~248.302; 470.238~473.889; 380.918~390.123; 432.243~432.850; 648.881~661.868; 406.911~408.268; 441.046~441.939; 773.839~779.961; 394.060~394.714; 395.448~396.508; 279.268~279.683; 392.915~393.815; 396.508~397.483; 422.186~423.116; 438.056~438.580; 287.917~288.505 |
| Index | Partitioning Method | R2 | RMSEC | RMSEP | MAE | MRE |
|---|---|---|---|---|---|---|
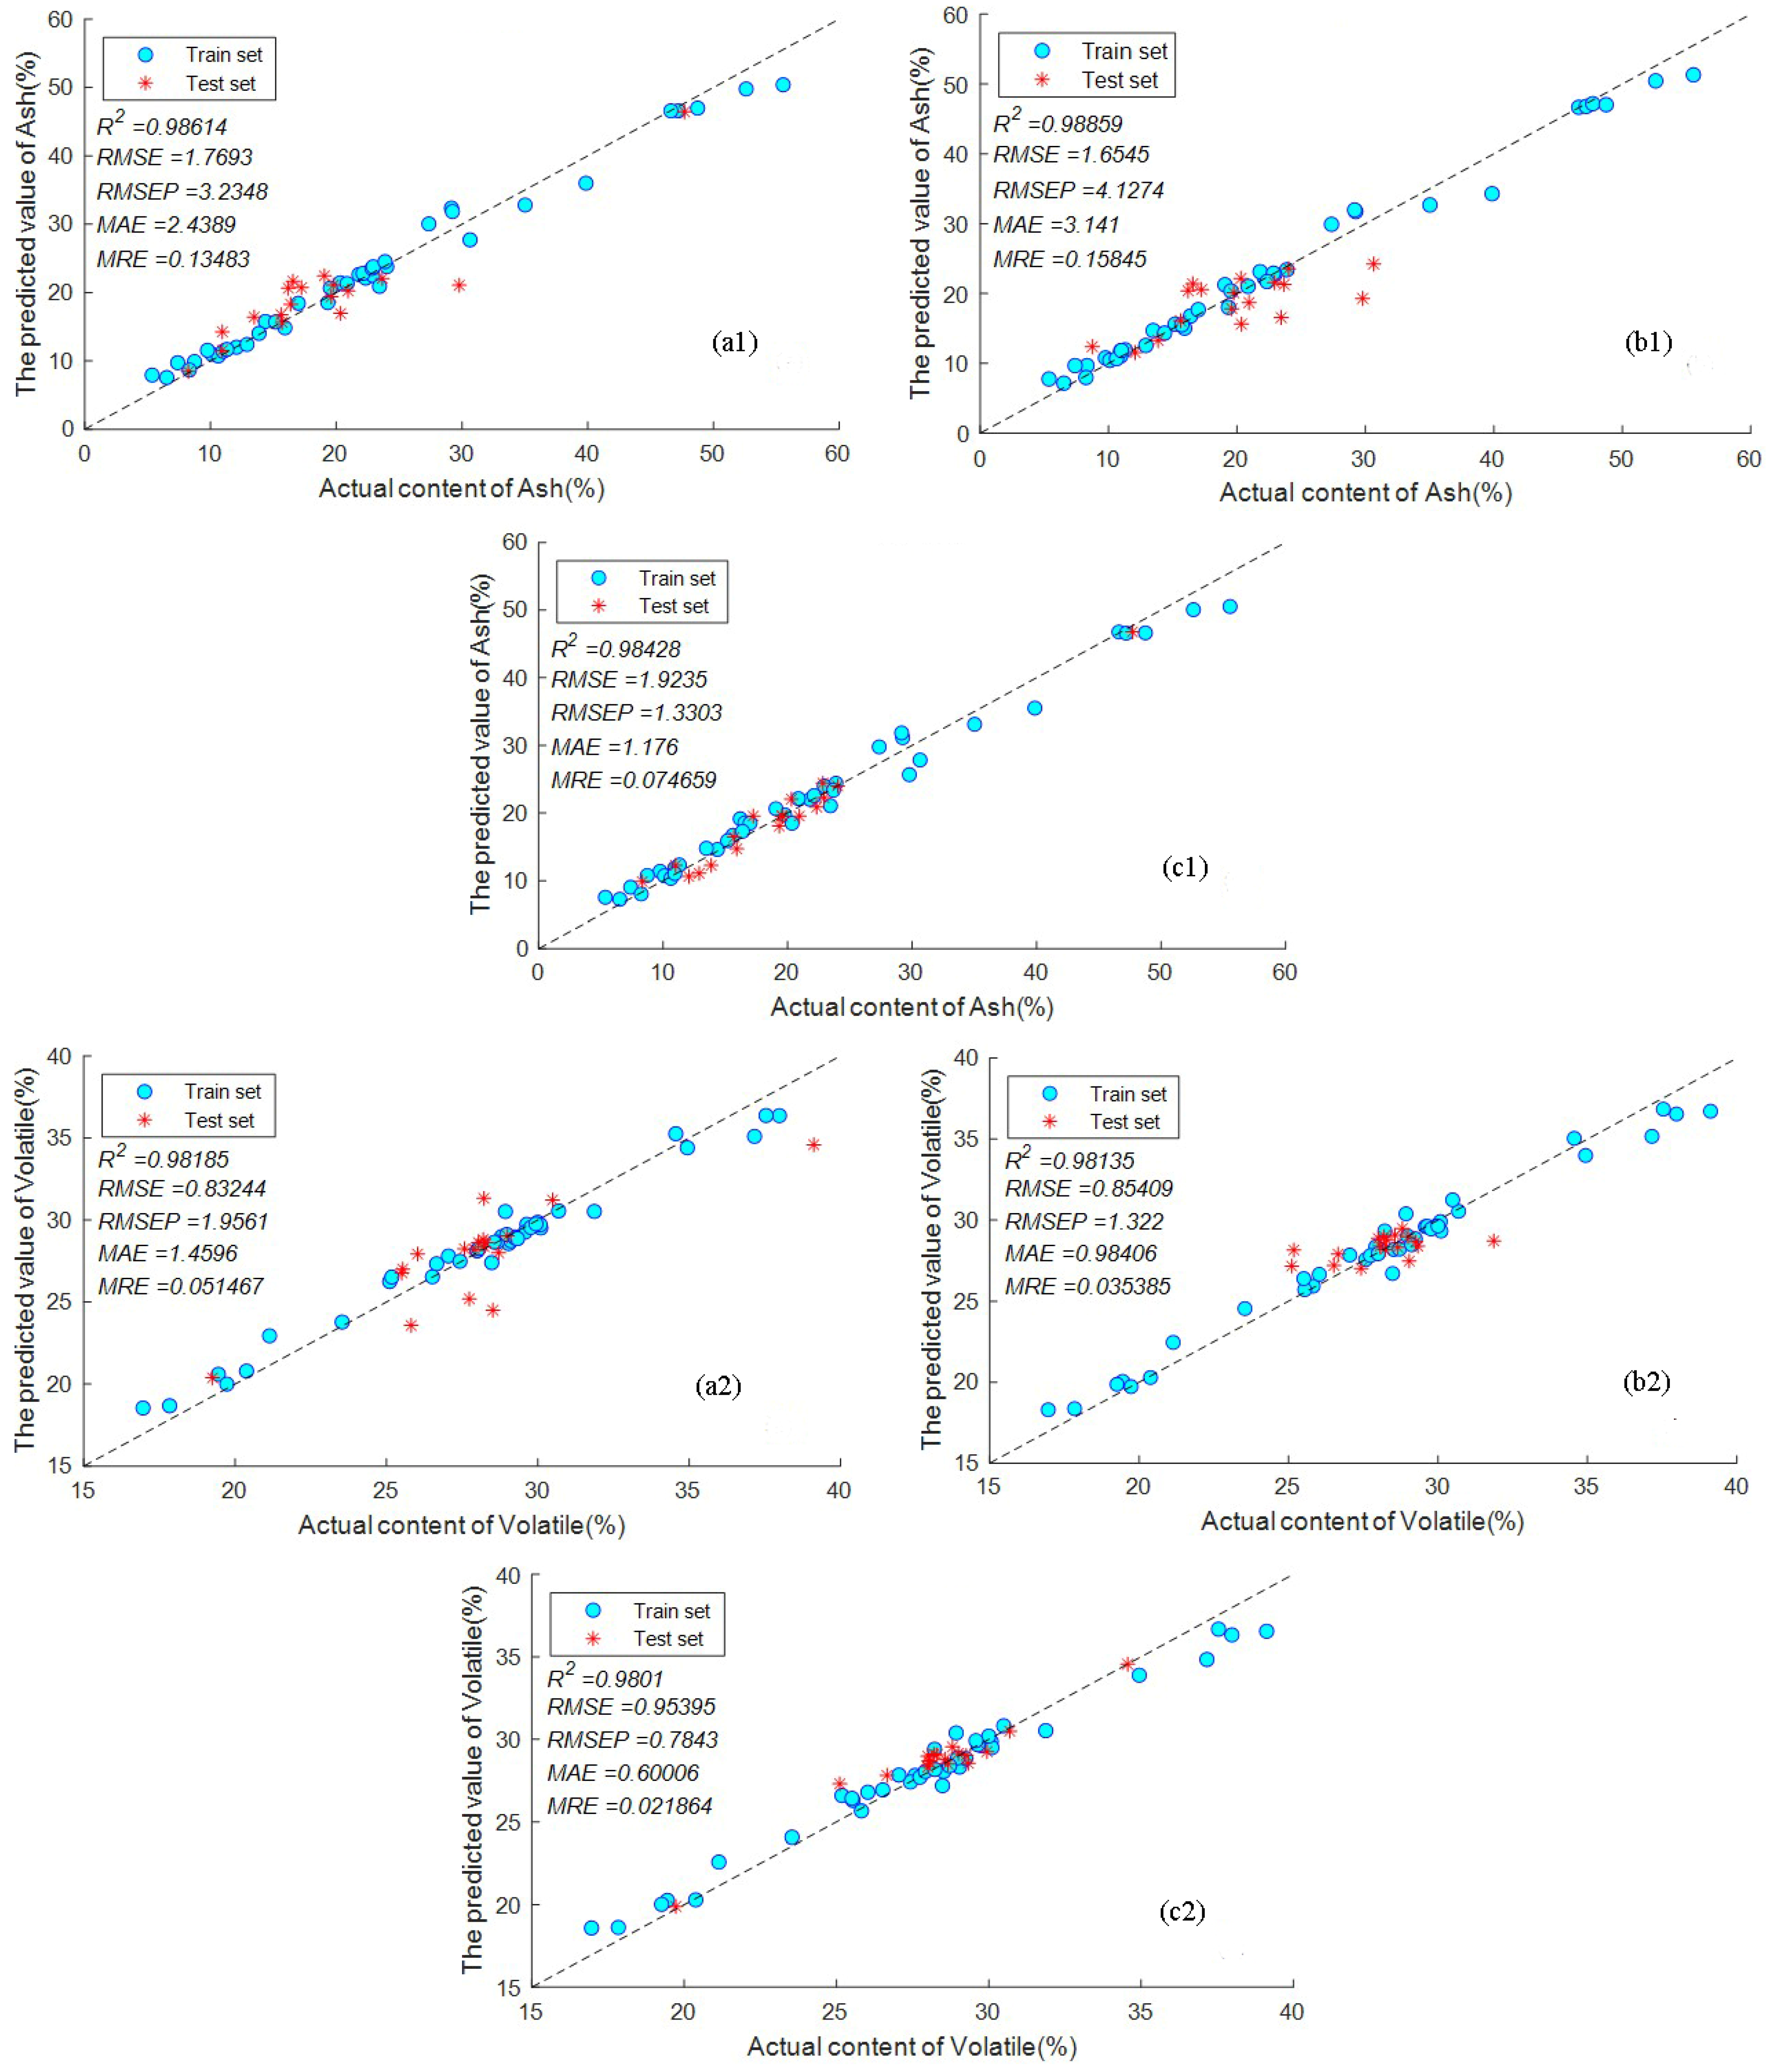
| Ash content | RS | 0.9877 | 1.4037 | 4.4775 | 3.3863 | 0.1652 |
| KS | 0.9986 | 0.5169 | 3.8138 | 2.9159 | 0.1512 | |
| SPXY | 0.9763 | 2.0126 | 2.5834 | 2.1780 | 0.1295 | |
| Volatile matter | RS | 0.9923 | 0.4046 | 2.3024 | 2.0693 | 0.0712 |
| KS | 0.9990 | 0.1657 | 1.4518 | 1.0799 | 0.0390 | |
| SPXY | 0.9664 | 0.9170 | 1.6006 | 1.3498 | 0.0468 | |
| Calorific value | RS | 0.9942 | 0.2768 | 1.6967 | 1.3245 | 0.0598 |
| KS | 0.9904 | 0.3828 | 0.9514 | 0.8578 | 0.0377 | |
| SPXY | 0.9946 | 0.2728 | 1.1139 | 0.8344 | 0.0350 |
| Index | Partitioning Method | R2 | RMSE | RMSEP | MAE | MRE |
|---|---|---|---|---|---|---|
| Ash content | RS | 0.9998 | 0.1608 | 4.6499 | 3.9341 | 0.2465 |
| KS | 0.9981 | 0.6321 | 4.1393 | 3.2033 | 0.1655 | |
| SPXY | 0.9955 | 0.8824 | 2.1142 | 1.8288 | 0.0982 | |
| Volatile matter | RS | 0.9999 | 0.0400 | 2.0314 | 1.3686 | 0.0577 |
| KS | 0.9999 | 0.0399 | 1.2928 | 0.9098 | 0.0321 | |
| SPXY | 0.9999 | 0.0400 | 1.0895 | 0.8785 | 0.0327 | |
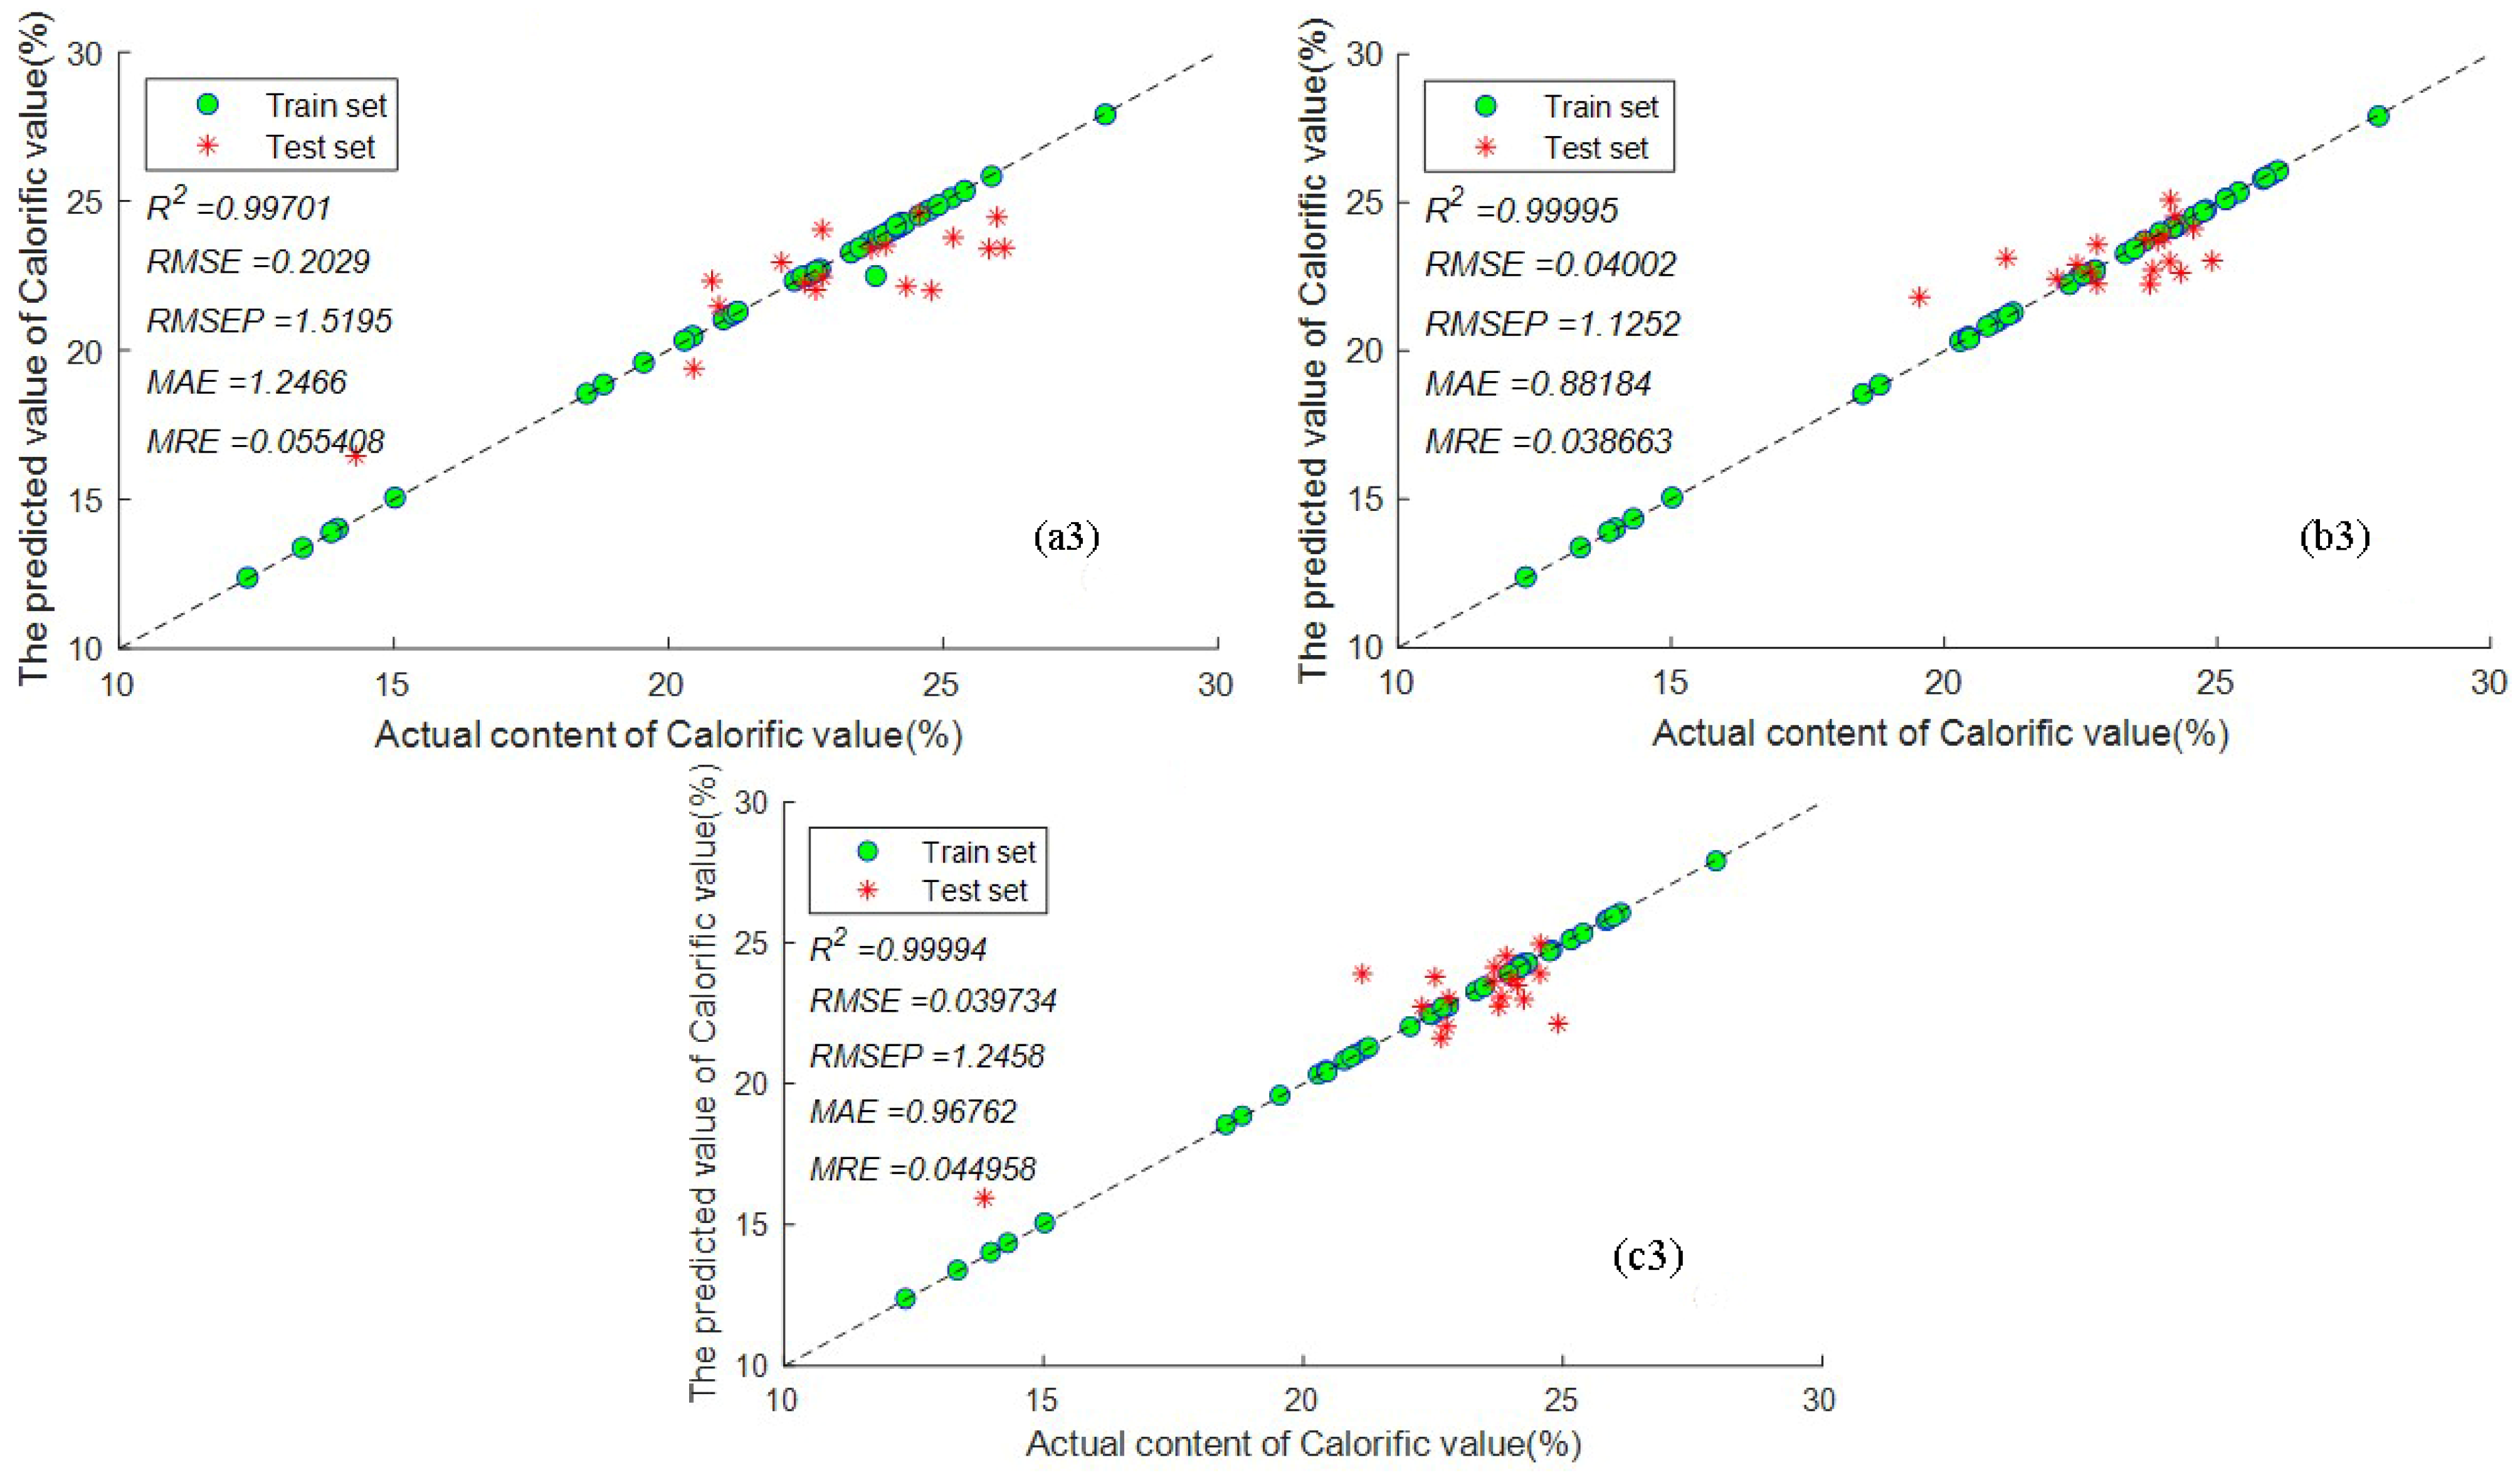
| Calorific value | RS | 0.9970 | 0.2029 | 1.5195 | 1.2466 | 0.0554 |
| KS | 0.9999 | 0.0400 | 1.1252 | 0.8818 | 0.0387 | |
| SPXY | 0.9999 | 0.0397 | 1.2458 | 0.9676 | 0.0450 |
| Index | Partitioning Method | R2 | RMSE | RMSEP | MAE | MRE |
|---|---|---|---|---|---|---|
| Ash content | RS | 0.9861 | 1.7693 | 3.2348 | 2.4389 | 0.1348 |
| KS | 0.9886 | 1.6545 | 4.1274 | 3.1410 | 0.1585 | |
| SPXY | 0.9843 | 1.9235 | 1.3303 | 1.1760 | 0.0747 | |
| Volatile matter | RS | 0.9818 | 0.8324 | 1.9561 | 1.4596 | 0.0515 |
| KS | 0.9813 | 0.8541 | 1.3220 | 0.9841 | 0.0354 | |
| SPXY | 0.9801 | 0.9540 | 0.7843 | 0.6001 | 0.0219 | |
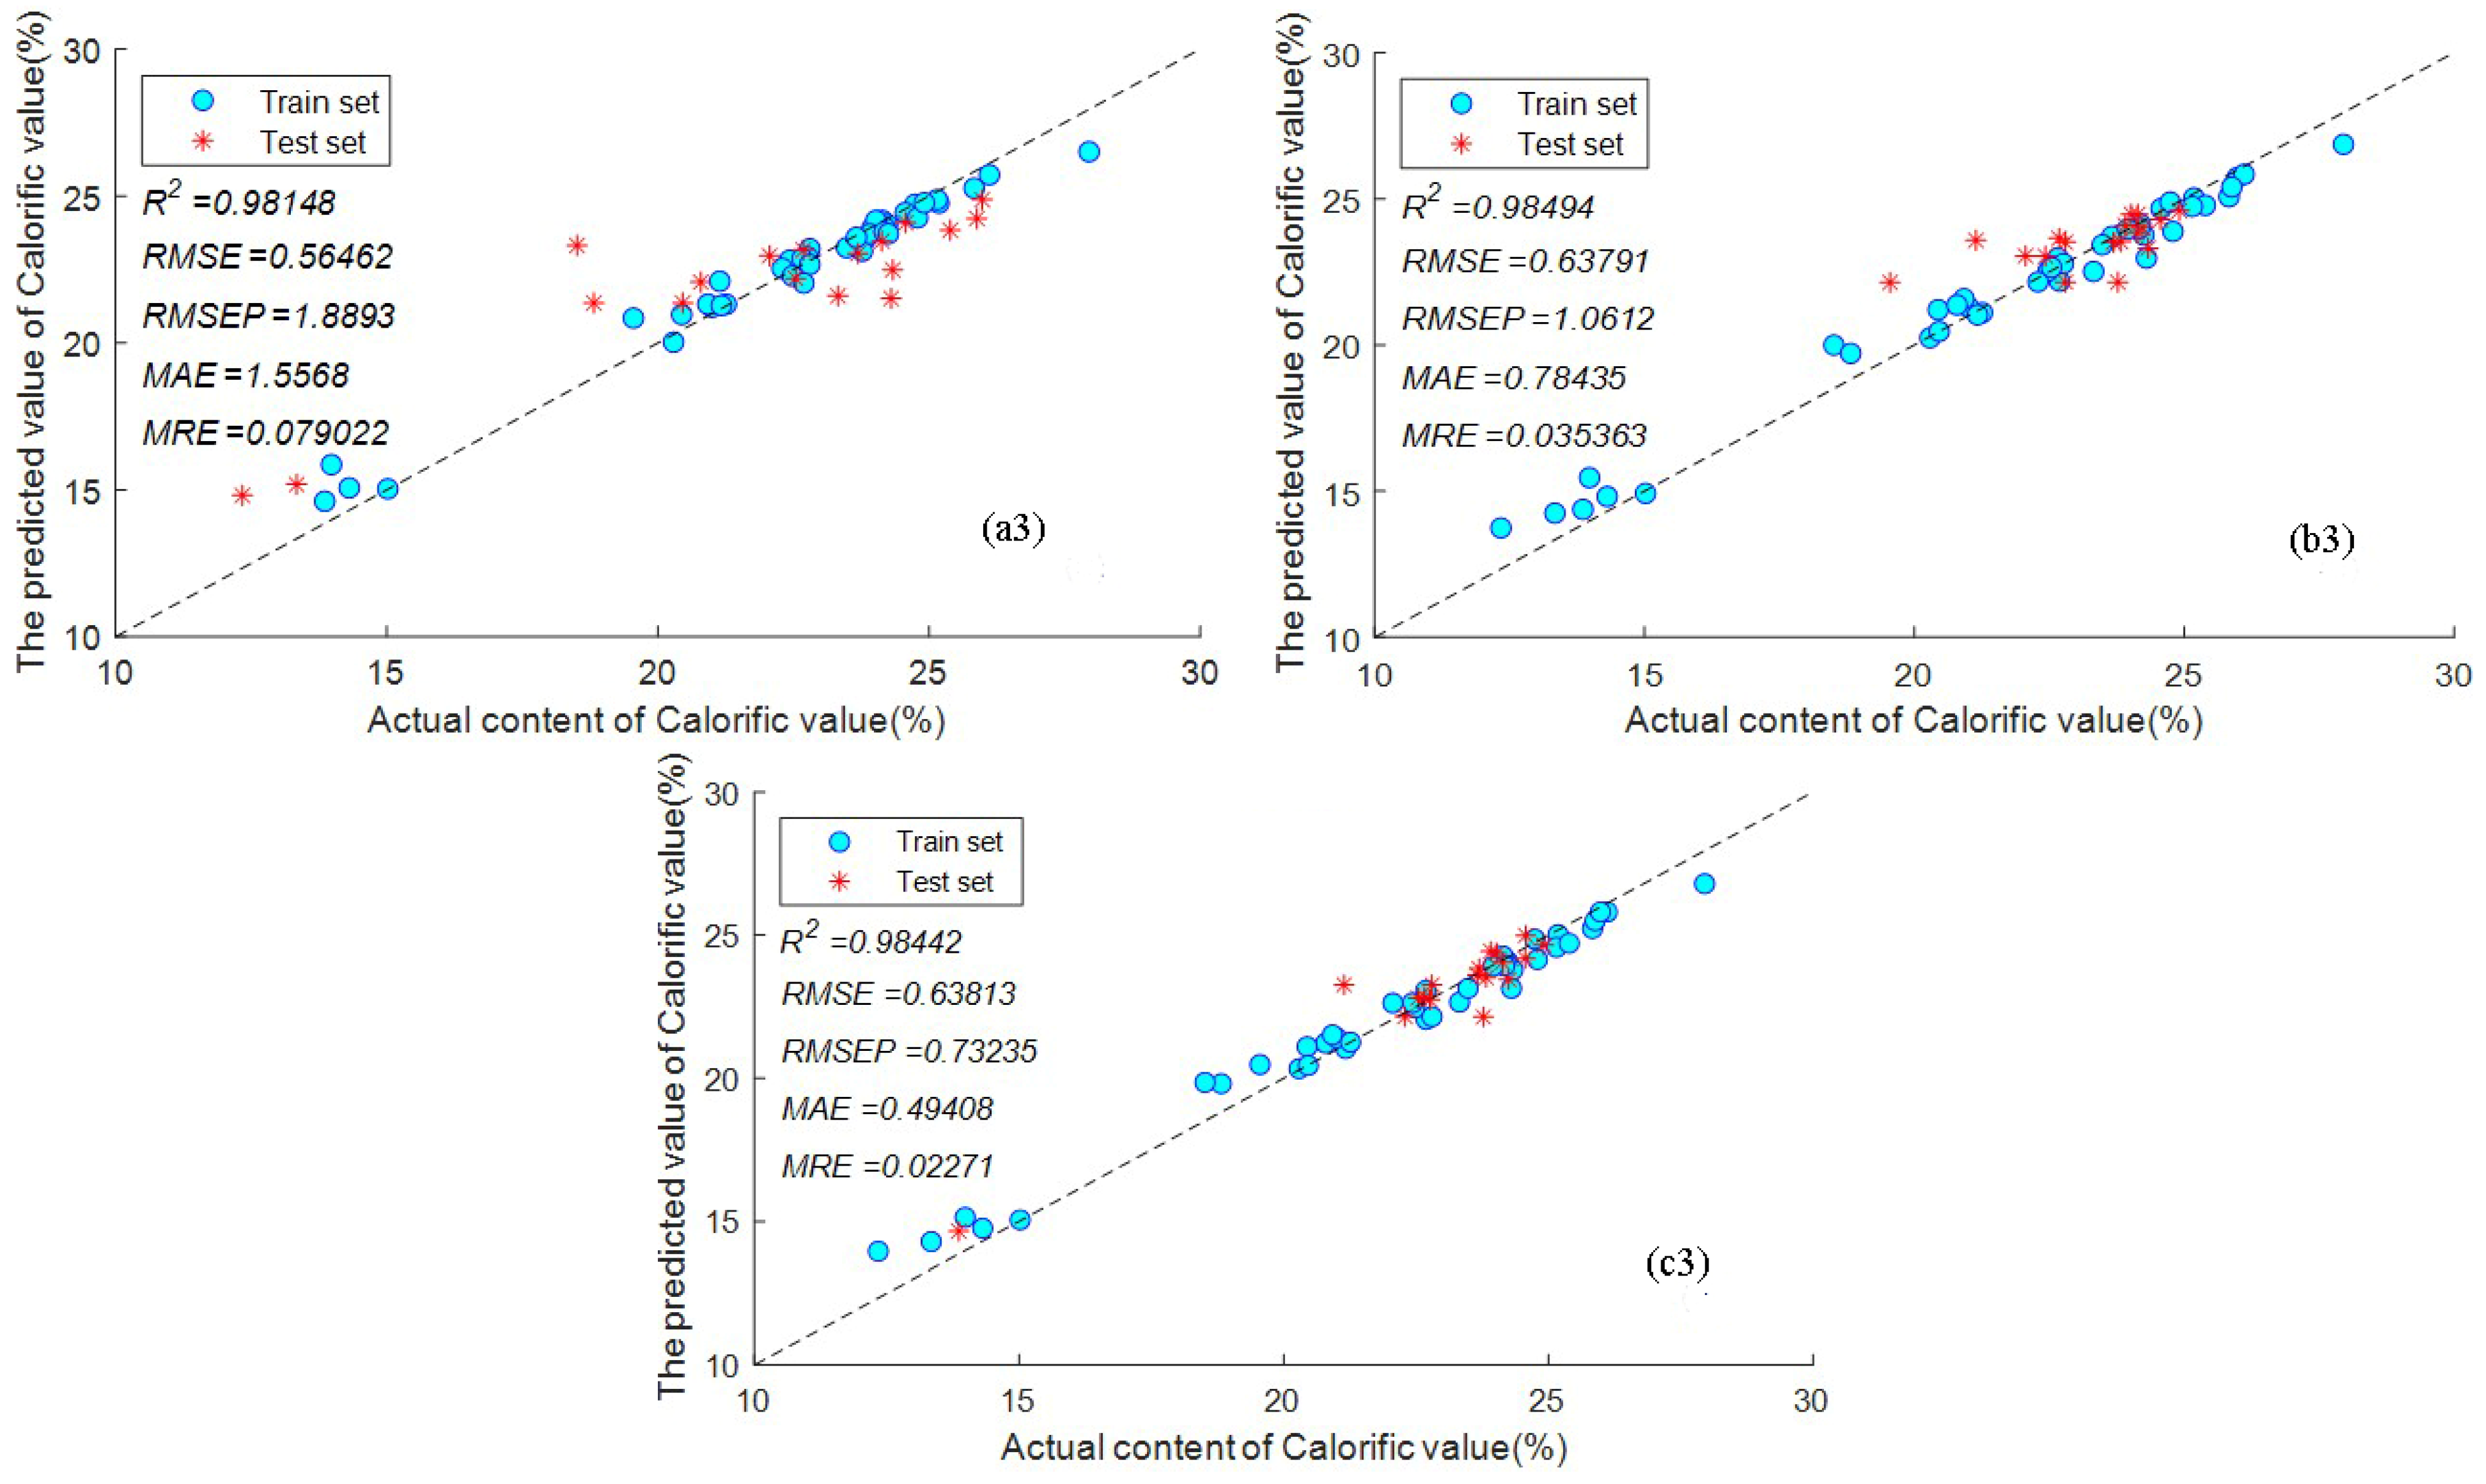
| Calorific value | RS | 0.9815 | 0.5646 | 1.8893 | 1.5568 | 0.0790 |
| KS | 0.9849 | 0.6379 | 1.0612 | 0.7843 | 0.0354 | |
| SPXY | 0.9844 | 0.6381 | 0.7324 | 0.4941 | 0.0227 |
Disclaimer/Publisher’s Note: The statements, opinions and data contained in all publications are solely those of the individual author(s) and contributor(s) and not of MDPI and/or the editor(s). MDPI and/or the editor(s) disclaim responsibility for any injury to people or property resulting from any ideas, methods, instructions or products referred to in the content. |
© 2023 by the authors. Licensee MDPI, Basel, Switzerland. This article is an open access article distributed under the terms and conditions of the Creative Commons Attribution (CC BY) license (https://creativecommons.org/licenses/by/4.0/).
Share and Cite
Dou, Y.; Wang, Q.; Wang, S.; Shu, X.; Ni, M.; Li, Y. Quantitative Analysis of Coal Quality by a Portable Laser Induced Breakdown Spectroscopy and Three Chemometrics Methods. Appl. Sci. 2023, 13, 10049. https://doi.org/10.3390/app131810049
Dou Y, Wang Q, Wang S, Shu X, Ni M, Li Y. Quantitative Analysis of Coal Quality by a Portable Laser Induced Breakdown Spectroscopy and Three Chemometrics Methods. Applied Sciences. 2023; 13(18):10049. https://doi.org/10.3390/app131810049
Chicago/Turabian StyleDou, Youquan, Qingsong Wang, Sen Wang, Xi Shu, Minghui Ni, and Yan Li. 2023. "Quantitative Analysis of Coal Quality by a Portable Laser Induced Breakdown Spectroscopy and Three Chemometrics Methods" Applied Sciences 13, no. 18: 10049. https://doi.org/10.3390/app131810049