Article

A Rapid and Nondestructive Detection Method for Rapeseed Quality Using NIR Hyperspectral Imaging Spectroscopy and Chemometrics

1
Key Laboratory of Biology and Genetic Improvement of Oil Crops, Ministry of Agriculture and Rural Affairs, Quality Inspection and Test Center for Oilseed Products, Ministry of Agriculture and Rural Affairs, Oil Crops Research Institute, Chinese Academy of Agricultural Sciences, Wuhan 430062, China
2
College of Food Science and Engineering, Collaborative Innovation Center for Modern Grain Circulation and Safety, Nanjing University of Finance and Economics, Nanjing 210023, China
3
Hubei Hongshan Laboratory, Wuhan 430070, China
4
Xianghu Laboratory, Hangzhou 311231, China
*
Author to whom correspondence should be addressed.
These authors contributed equally to this work.
Appl. Sci. 2023, 13(16), 9444; https://doi.org/10.3390/app13169444
Submission received: 3 July 2023 / Revised: 16 August 2023 / Accepted: 18 August 2023 / Published: 21 August 2023
(This article belongs to the Special Issue Spectral Detection: Technologies and Applications)

Abstract

:
In this study, a fast and non-destructive method was proposed to analyze rapeseed quality parameters with the help of NIR hyperspectral imaging spectroscopy and chemometrics. Hyperspectral images were acquired in the reflectance mode. Meanwhile, the region of interest was extracted from each image by the regional growth algorithm. The kernel partial least square regression was used to build prediction models for crude protein content, oil content, erucic acid content, and glucosinolate content of rapeseed. The results showed that the correlation coefficients were 0.9461, 0.9503, 0.9572, and 0.9335, whereas the root mean square errors of prediction were 0.5514%, 0.5680%, 2.8113%, and 10.3209 µmol/g for crude protein content, oil content, erucic acid content, and glucosinolate content, respectively. It demonstrated that NIR hyperspectral imaging is a promising tool to determine rapeseed quality parameters in a rapid and non-invasive manner.

1. Introduction

Brassica napus L. is one of the most important oilcrops, which provides not only important sources of edible oil and protein feedstuff, but also nectar sources [1]. Crude protein content, oil content, erucic acid content, and glucosinolate content are the most important quality parameters of rapeseed. Protein provides nutrition for livestock, whereas high oil content can increase the production of rapeseed oil [2]. Moreover, erucic acid can impair myocardial conductance and cause lipidosis and increase blood cholesterol [3], whereas glucosinolates in rapeseed meal are detrimental to animal health as glucosinolates reduce the feed palatability and affect the iodine uptake by the thyroid glands, thus reducing feed efficiency and weight gains, especially in non-ruminants [4]. With the improvement of people’s living standards, quality inspection has received ample attention. In recent years, traditional and classical analytical methods were used to detect these quality parameters of rapeseed, such as the Kjeldahl method for crude protein content [5], Soxhlet extraction for oil content [6], gas chromatography (GC) for fatty acids [7], and high-performance liquid chromatography (HPLC) for glucosinolates [8,9]. However, these traditional methods are generally time-consuming, tedious, laborious, destructive, and require skilled operation. Therefore, a rapid and non-destructive technique is required for high throughput detection.
Near-infrared hyperspectral imaging (NIR-HSI) was used to conduct quantitative and qualitative analysis due to its fast, non-destructive detection, and free use of chemical reagents [9,10]. Combined with conventional near-infrared spectroscopy with imaging techniques to acquire both spectral and spatial information from an object, NIR-HSI can overcome the disadvantage of point detection and provide images for visual classification [11,12,13]. Meanwhile, the spectral data provide the internal quality of the sample. The image information can be used to detect the external quality of the sample [14]. NIR-HSI is a three-dimensional image block containing a large amount of spectral information with the wavelength, two spatial dimensions (x and y), and one spectral coordinate (λ) [15,16,17]. Usually, dimensionality reduction and feature extraction were used to extract the most important information for solving practical challenges and building calibration models based on the selected wavelengths [18].
NIR-HSI has been widely applied in the quality and safety of various agricultural products. The contents of amylose and amylopectin in different varieties of sorghum were predicted by the cascade forest model. The residual predictive deviations (RPD) were 4.7622 and 5.5889, respectively [19]. Feature wavelengths were extracted by the uninformative variable elimination, and the partial least squares regression (PLSR) model was built for the moisture of maize [20]. An attention mechanism was used to identify the geographical origins of Coix seeds [21]. The convolutional neural network (CNN) models were established to discriminate three varieties of soybeans. The results showed that the performance of the model using pixel spectra from 60 soybeans was comparable to a model using average spectra from 810 soybeans. Only one soybean of one variety was misjudged, and the rest were predicted correctly [22]. Meanwhile, there was considerable progress in the detection of single seeds with the help of HSI, such as the total lipid content of single cocoa beans [23], oleic acid content, and the linoleic acid content of a single soybean [24]. In summary, HSI was widely used in the detection of quality parameters, origin traceability, variety identification, and single seeds of agricultural products. Recently, it has been reported that NIR-HSI was successfully used to detect mycotoxins and pesticide residues in agricultural products. One-dimensional CNN (1D-CNN) was employed to detect aflatoxin on the surface of one peanut and one corn by detecting aflatoxin-containing pixels in a rapid, comprehensive, and non-destructive manner. The classification result showed that the accuracy was greater than 90%, which was of great significance for the early warning of mycotoxins in oilseeds [25]. Meanwhile, the AFB1 concentration in a single maize kernel can be discriminated with the linear discriminant analysis (LDA) method [26]. The shortwave infrared (SWIR)-HSI possessed high accuracy in detecting deoxynivalenol (DON) of wheat flour rather than the visible NIR-HSI [27]. Moreover, the established absorbance-partial least squares discriminant analysis (AS-PLSDA) and locally weighted partial least square regression (LWPLSR) model had the potential to detect chlorpyrifos and imidacloprid in edible jujube fruits [28]. In general, NIR-HSI combined with multivariate analysis showed great performance in the detection of the quality and safety of agricultural products.
However, the detection of quality parameters of rapeseed using NIR-HSI has not been reported. In this study, the aim is to build models of rapeseed quality parameters based on NIR-HSI. Different pretreatment methods were compared to select the optimal method. Meanwhile, kernel partial least squares (KPLS) regression was used to build the model.

2. Materials and Methods
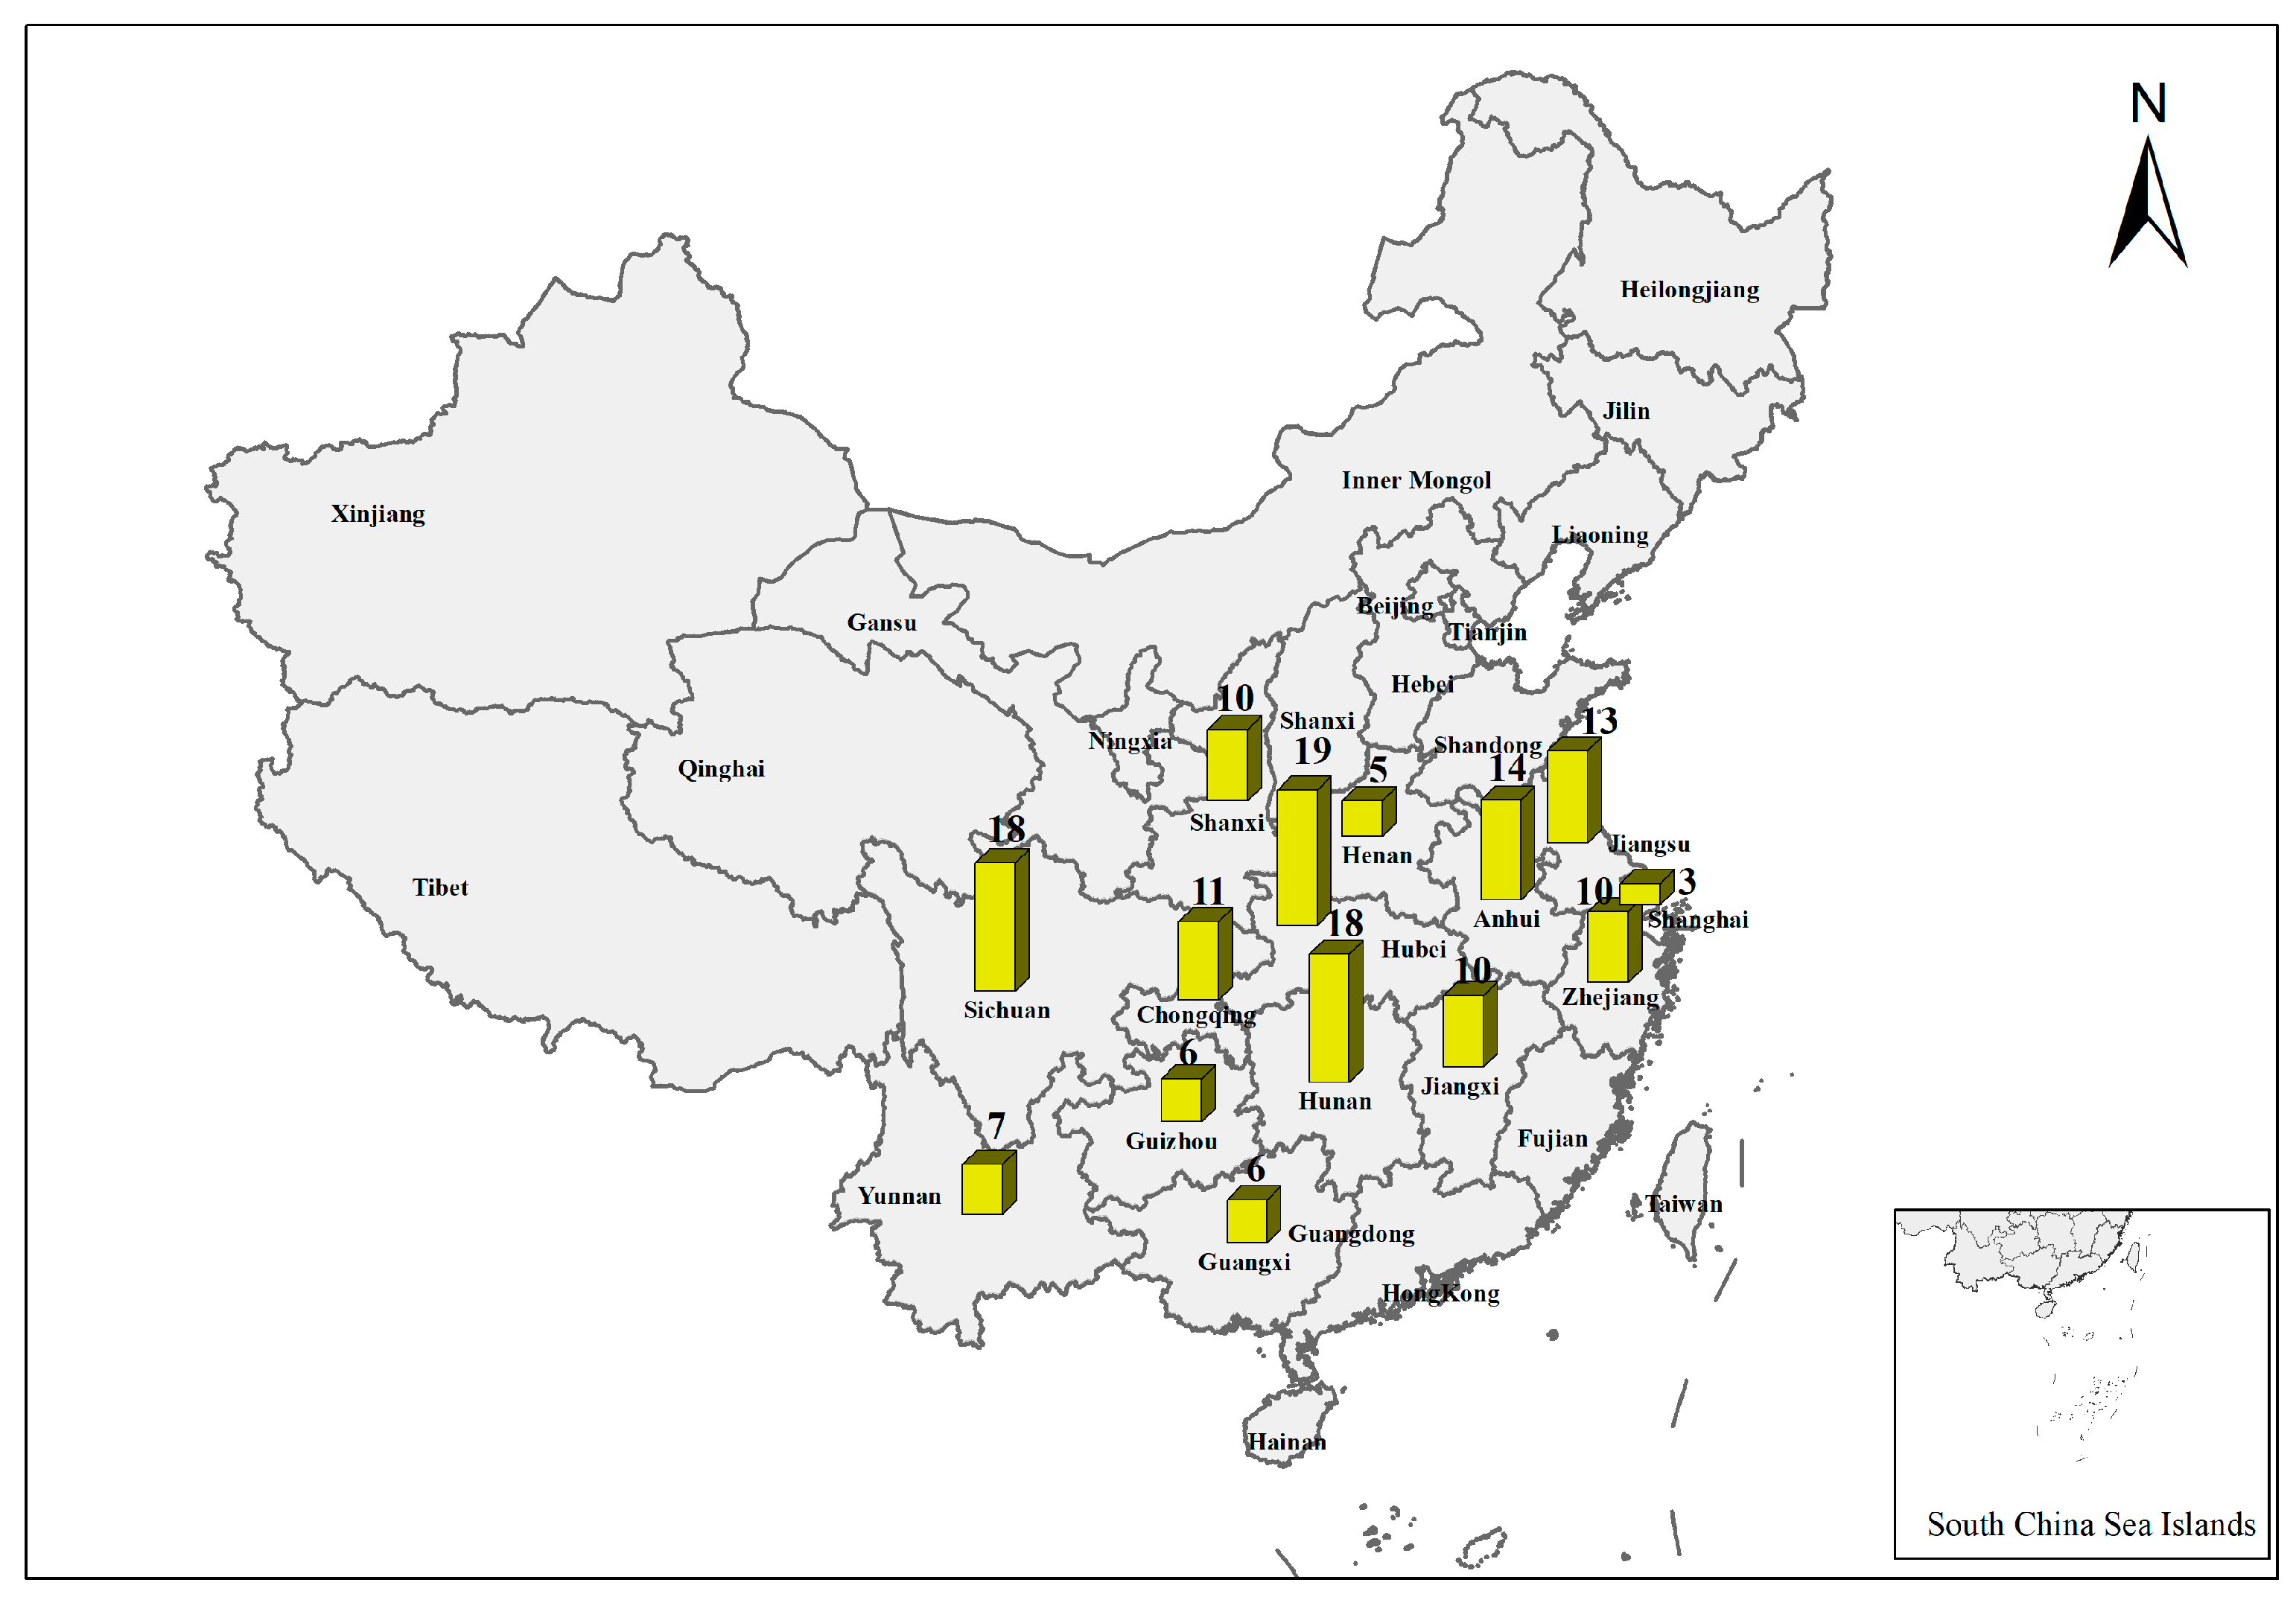
2.1. Materials

To ensure that the models could be used to predict quality parameters of rapeseeds from all varieties, production areas, and quality grades, 150 representative rapeseed samples were selected from our reference sample library. These rapeseed samples with different quality grades covered 14 major rapeseed-producing provinces in China. The major producing regions of rapeseed were shown in Figure 1. All samples and chemical values were provided by the Quality Inspection and Test Center for Oilseed Products, Ministry of Agriculture and Rural Affairs. The samples were spread evenly to the size of a 10 cm × 1 cm culture dish until fully covered, and the culture dish was put into the incubator and scanned one by one by the NIR-HSI system. The key steps for the whole procedure are presented in Figure 2.

2.2. Reference Analysis

The chemical values of four parameters were detected after acquiring NIR-HSI, which were the reference to develop the NIR-HSI calibration models. Crude protein content was measured using Kjeldahl analysis, whereas the Soxhlet extractor method was used to detect oil content. Meanwhile, erucic acid content was determined with GC, and HPLC was employed for the glucosinolate content according to the Chinese national standard [29,30,31,32].

2.3. NIR Hyperspectral Image Acquisition and Preprocessing

2.3.1. The NIR-HSI System

The GaiaSorter NIR-HSI system (Sichuan Dualix Spectral Imaging Technology Co., Ltd., Chengdu, China) was used to obtain the spectra and image data of rapeseed. This system consisted of a line-scan push broom spectrograph (ImSpector, N25E, Spectra Imaging Ltd., Oulu, Finland), a CCD camera (Zelos-285GV, Kappa optronics Gmbh, Gleichen, Germany) with 320 × 320 (spatial × spectral) pixels, halogen tungsten lamps (HSIA-LS-TDIF, Zolix, Ltd., Beijing, China), a conveyer (PSA 200-11-X, Zolix, Ltd., Beijing China), a data acquisition, preprocessing software (Spectra sens, Zolix Instruments Co., Ltd., Beijing, China), and a PC. The camera parameters were set as followed: objective lens height was 31 cm and exposure time was 10 ms. The spectrograph had a fixed-size internal slit (30 μm) to define a field of view (FOV) for the spatial line (horizontal pixel direction) and collected spectral images with 271 bands of 5.6 nm spectral resolution from 1000 to 2500 nm. The four 200 w lamps were mounted on one side of the camera at a 45° angle with respect to the vertical plane to illuminate the sample, which should be warmed up for 30 min to ensure the light source is stable. Meanwhile, the conveyer was at an optimized velocity of 10 mm/s during acquisition. More importantly, the dark current and background were subtracted. Reflectance spectral intensity correction was performed automatically when the sample was measured each time.

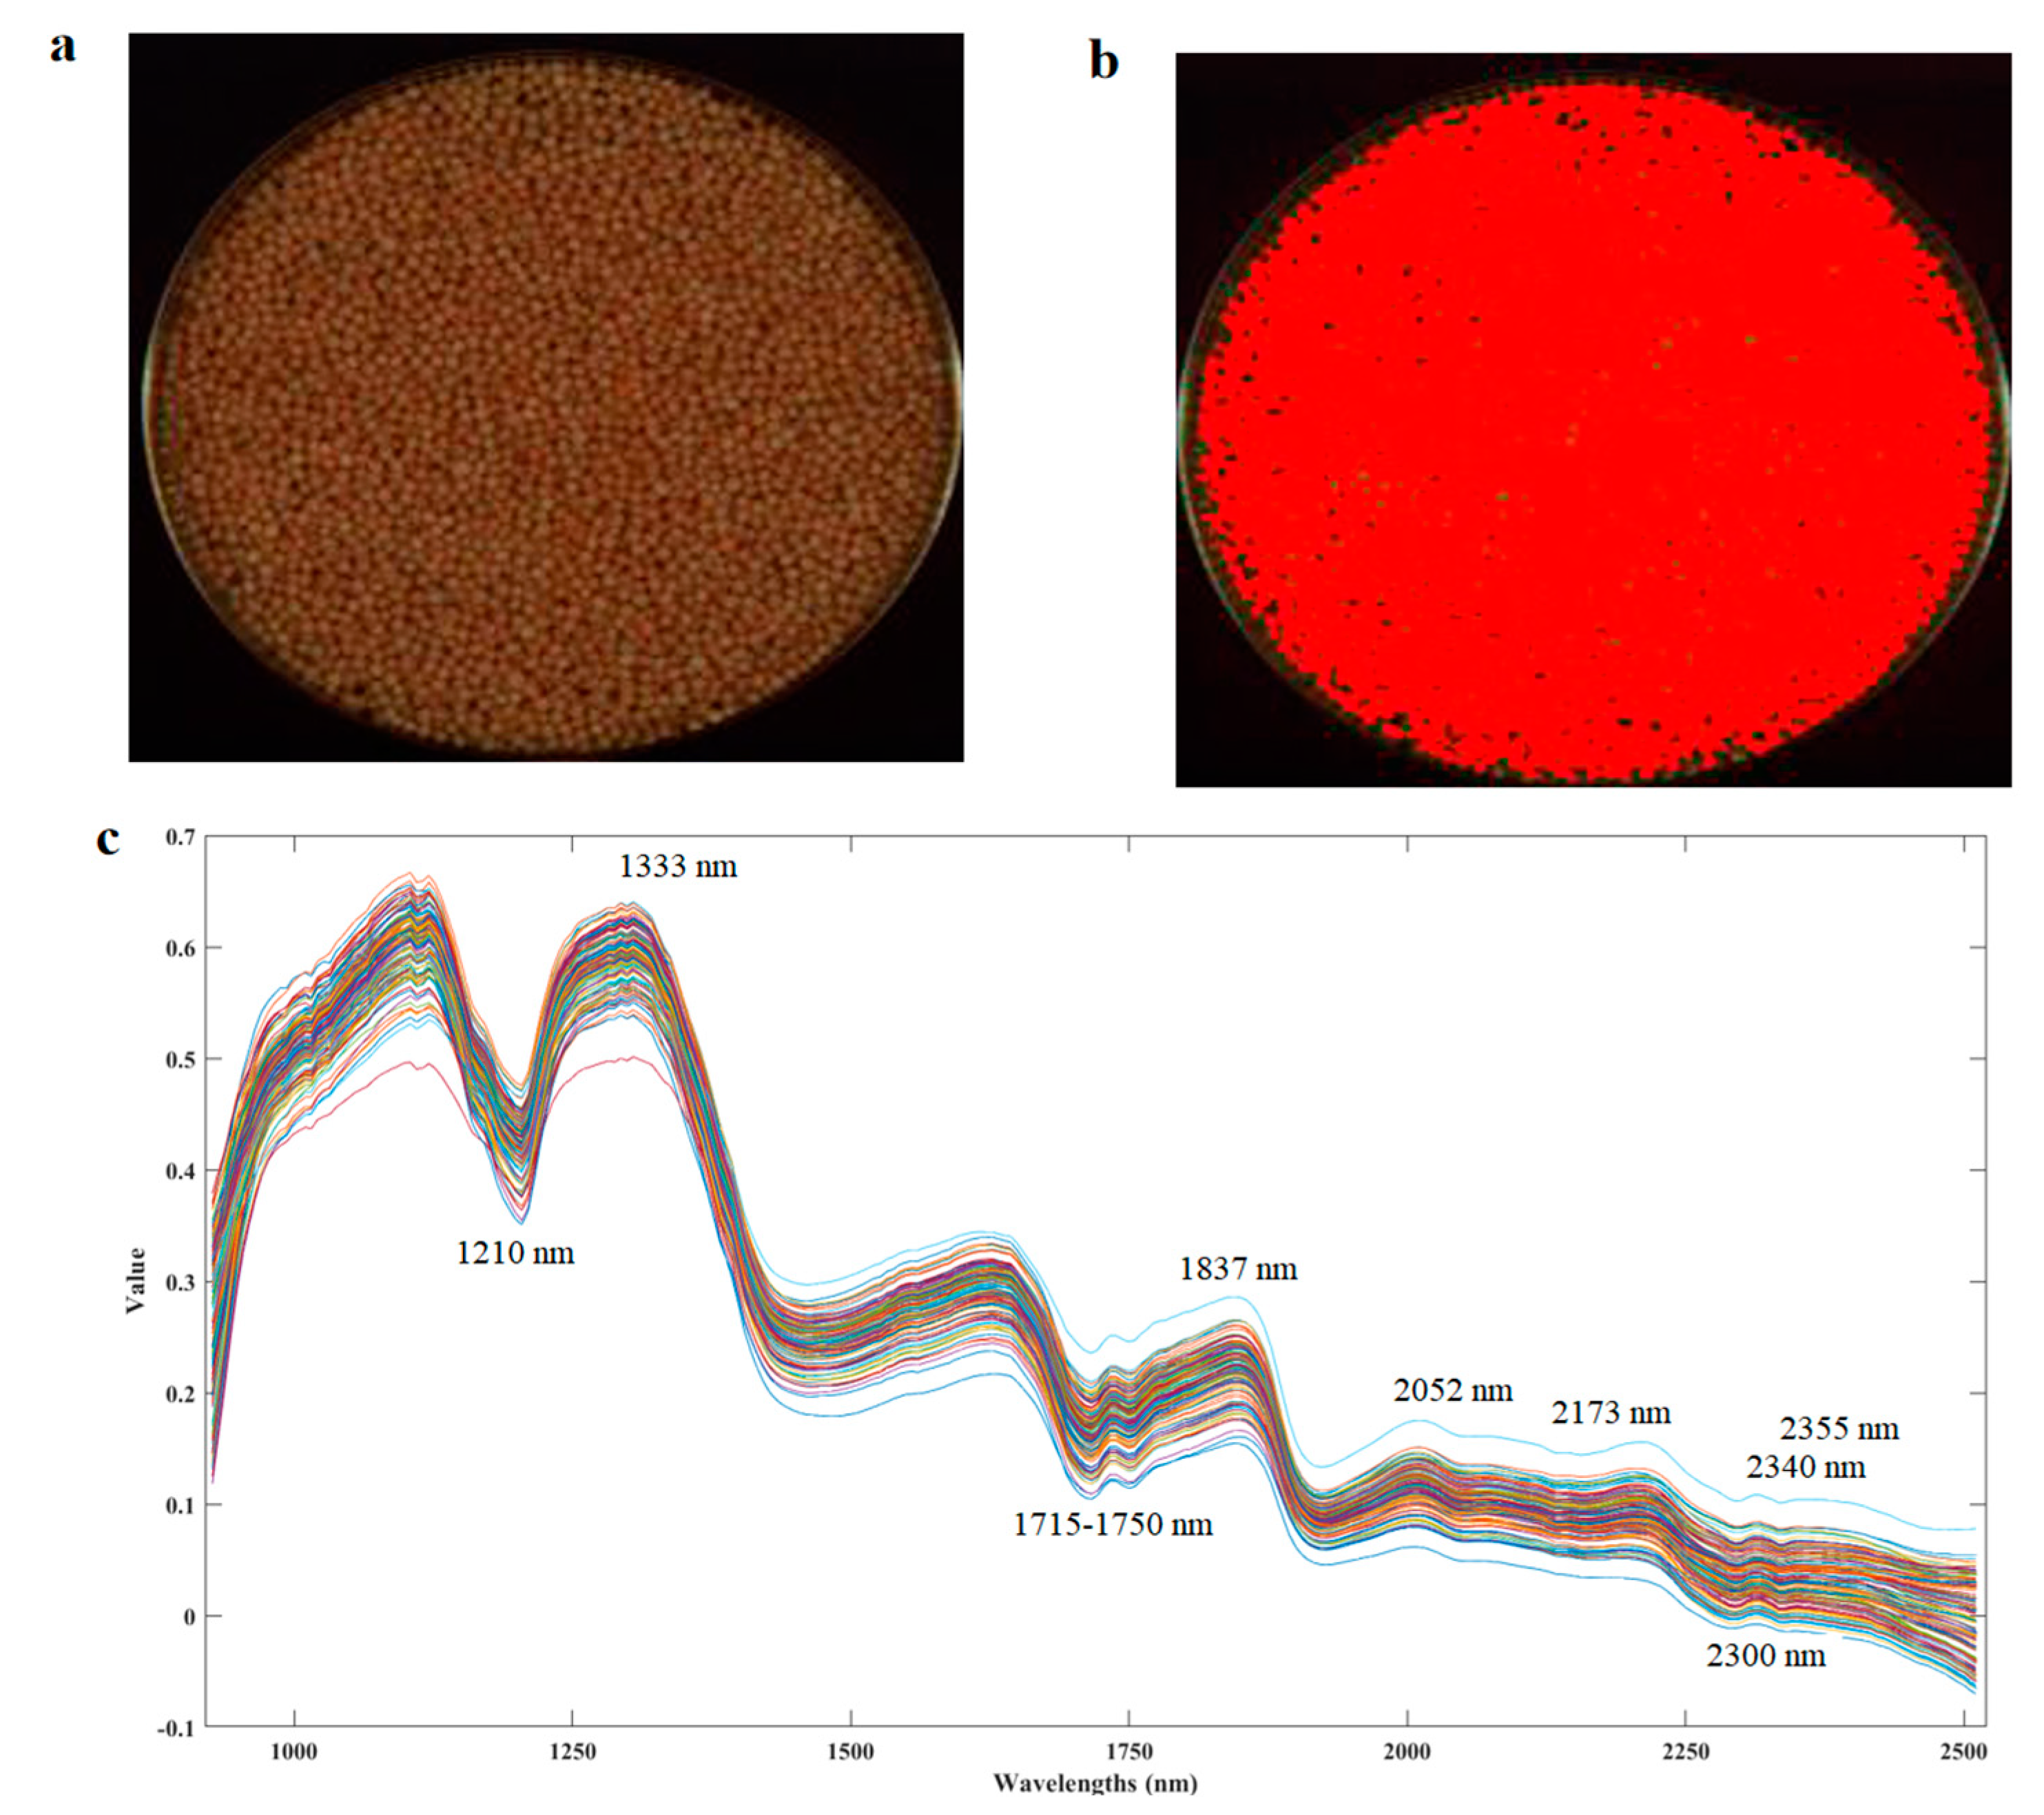
2.3.2. Regions of Interest (ROI) Selection and Spectral Information Extraction

Hyperspectral imaging systems can acquire abundant spatial and spectral information. The ROI tool in ENVI (Research Systems Inc., Boulder, CO, USA) was used to extract spectral information from rapeseed ROI. The regional growing method was employed to select ROI and spectral information was extracted from these regions. After identifying the ROI image, average spectra were calculated for all pixels enclosed in this region and taken as the NIR spectra of each rapeseed sample. All samples followed this procedure to acquire spectral information. As a result, a spectral matrix of 150 rapeseed samples in a row and 271 bands in a column was obtained for the modeling and prediction of the quality parameters of rapeseed.

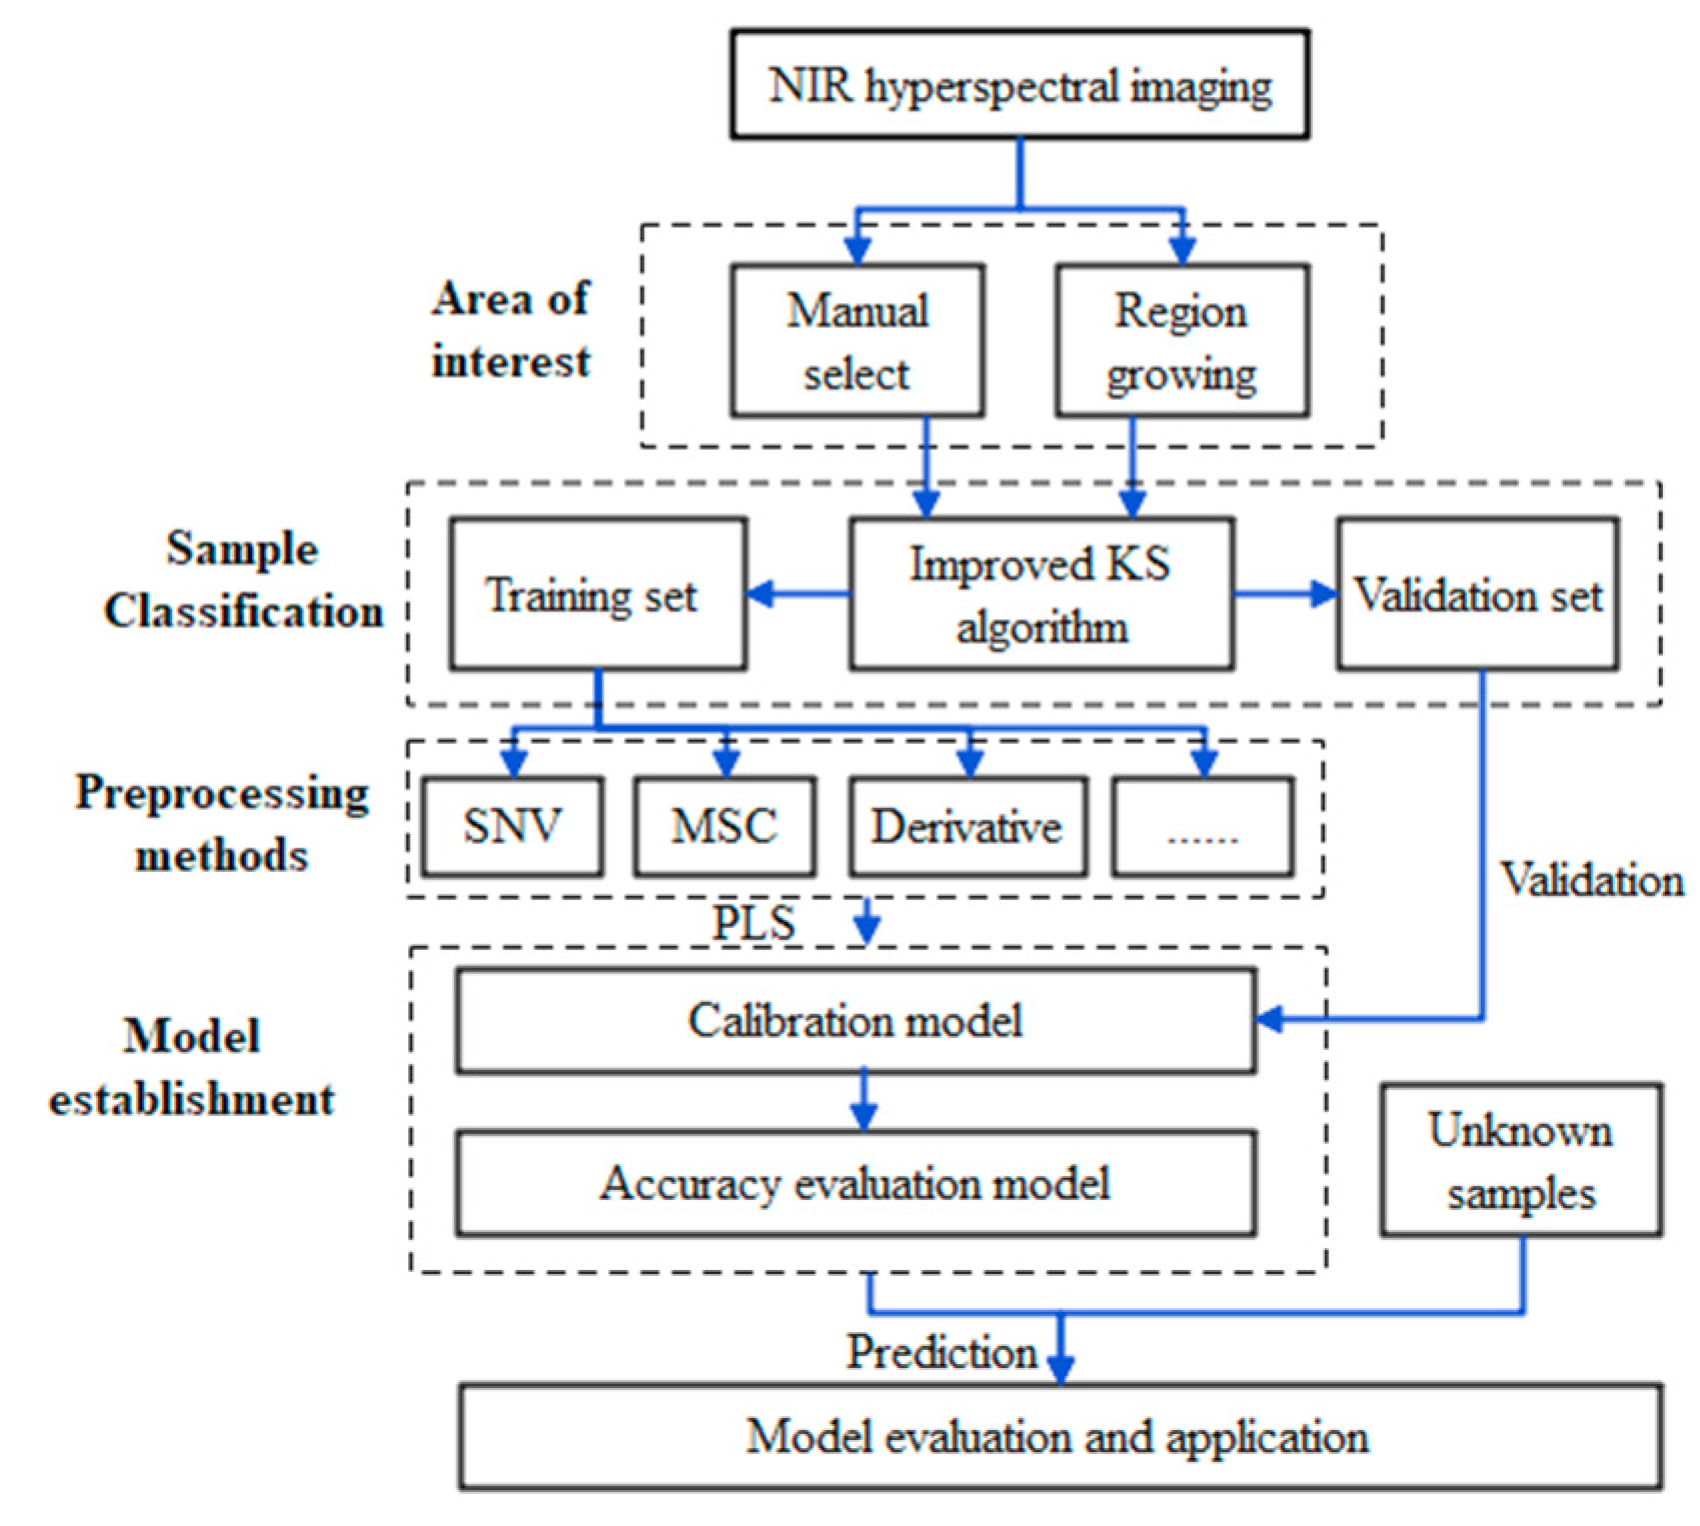
2.4. Data Processing and Quantitative Models

The spectral data often contain unexpected noise and exhibit systematic variations on the baseline due to the physical properties of the samples and other environmental noises. If the raw hyperspectral data are directly used to build the model, it might obtain low data modeling efficiency and poor model performance. The preprocessing of spectral datasets is necessary to remove non-chemical biases, such as scattering effects, due to the inhomogeneity of the surface, interference from external light sources, or random noise. Scattering correction can reduce the spectrum caused by the uneven distribution of sample particle size differences. Generally, common scattering correction includes multiplicative scatter correction (MSC), standard normal variate transformation (SNV), and smoothing. Meanwhile, the derivative algorithm can eliminate baseline drift and improve the resolution of overlapping peaks.
Extending the PLS model by introducing a nonlinear kernel is an approach to solving nonlinear problems. KPLS regression is a mapped spectral input matrix to a high-dimensional feature space by a nonlinear function; the major advantage of the KPLS method is that it does not need nonlinear optimization by substitution of the inner product of the feature space with a kernel function, which was used to build calibration models [33,34,35]. Leave-one-out cross-validation (LOOCV) was employed to evaluate the established calibration models. The performance of the calibration models was also evaluated according to the root mean square error of calibration (RMSEC), the root mean square error of cross-validation (RMSECV), and the correlation coefficient (Rc).

2.5. Software

Hyperspectral image and spectra data extraction were accomplished with ENVI 4.5 (Research Systems Inc., Boulder, CO, USA). The data processing, wavelength selection, and model establishment were developed in Unscrambler X version 10.4.1 (CAMO Software AS, Oslo, Norway).

3. Results and Discussion

3.1. Statistics Analysis

As illustrated in Table 1, the descriptive statistics of crude protein content, oil content, erucic acid content, and glucosinolate content of representative rapeseed samples were presented using Unscrambler X version 10.4.1 (CAMO Software AS, Oslo, Norway). The minimum and maximum values of crude protein content, oil content, erucic acid content, and glucosinolate content were 18.66%, 33.24%, 0.10%, and 14.63 µmol/g and 29.60%, 49.37%, 50.20%, and 168.96 μmol/g for all rapeseed samples (including the training set and test set), respectively. The wide range of the above four parameters indicated that 150 rapeseed samples could reflect the qualities of rapeseeds in China. These rapeseed samples were divided into a training set of 120 samples and a test set of 30 samples using the improved KS algorithm.

3.2. Research on the ROI of Hyperspectral Image Data

The regional growing methods were used to select a rapeseed image by EVNI 4.5, which was primarily conducted by combining pixels with similar properties [36]. First, a seed point should be designated as the starting point of growth, and the pixels in the area around the seed point should be compared with the seed point. Then, we combined the four similarity points, which continued to grow outward until the pixels did not meet the conditions. After identifying the region of similar spectral characteristics, the average spectrum was calculated as the average of the spectra of all pixels enclosed in this region. In this work, a four-neighborhood region-growing algorithm was used to mask the image. The ROI and spectral data were shown in Figure 3.
Figure 3c showed the average spectrum. It was reported that the wavelengths of fat were 1210 nm and 1715–1750 nm, which was associated with the third overtone -CH stretch. The protein was related to the wavelengths of 2052 nm and 2300 nm and corresponded to the N-H functional groups [37]. Meanwhile, erucic acid ranged from 1333–1837 nm and glucosinolates were 1333–1837 nm and 2173–2355 nm [38]. This study demonstrated that the species, variety, and production area of samples were the important factors in NIR analysis, which will increase the heterogeneity of the spectrum and improve the robustness of the calibration model [37].

3.3. Establishment and Validation Calibration Model

3.3.1. Establishment Calibration Models

After hyperspectral image acquisition, 120 and 30 spectral data were involved in the training set and test set, respectively. The regional growing method was used to calibrate the model. Different pretreatment methods were used to obtain the optimal model for four quality parameters of rapeseed. The light scattering correction was used to reduce the difference caused by the light source drift, whereas the first or second derivative (1st Der or 2nd Der) by the Savitzky–Golay algorithm was employed to eliminate the interference of baseline and other backgrounds. KPLS was employed to build the models for crude protein content, oil content, erucic acid content, and glucosinolate content of rapeseed. As shown in Table 2, the best processing method was MSC and the first derivative for crude protein content, oil content, erucic acid, and glucosinolates.
As shown in Figure 4, the prediction model for crude protein content was built and obtained acceptable results (R2c = 0.9692, RMSEC = 0.4500%, R2cv = 0.9548, RMSECV = 0.5522%), whereas the prediction models for oil content, erucic acid content, and glucosinolate content also showed satisfactory results. R2c = 0.9653, RMSEC = 0.5399%, R2cv = 0.9528, RMSECV = 0.6285% for fat, R2c = 0.9774, RMSEC = 2.5018%, R2cv = 0.9603, RMSECV = 3.2581% for erucic acid, and R2c = 0.9451, RMSEC = 9.5087 µmol/g, R2cv = 0.9182, and RMSECV = 11.7602 µmol/g for glucosinolates.

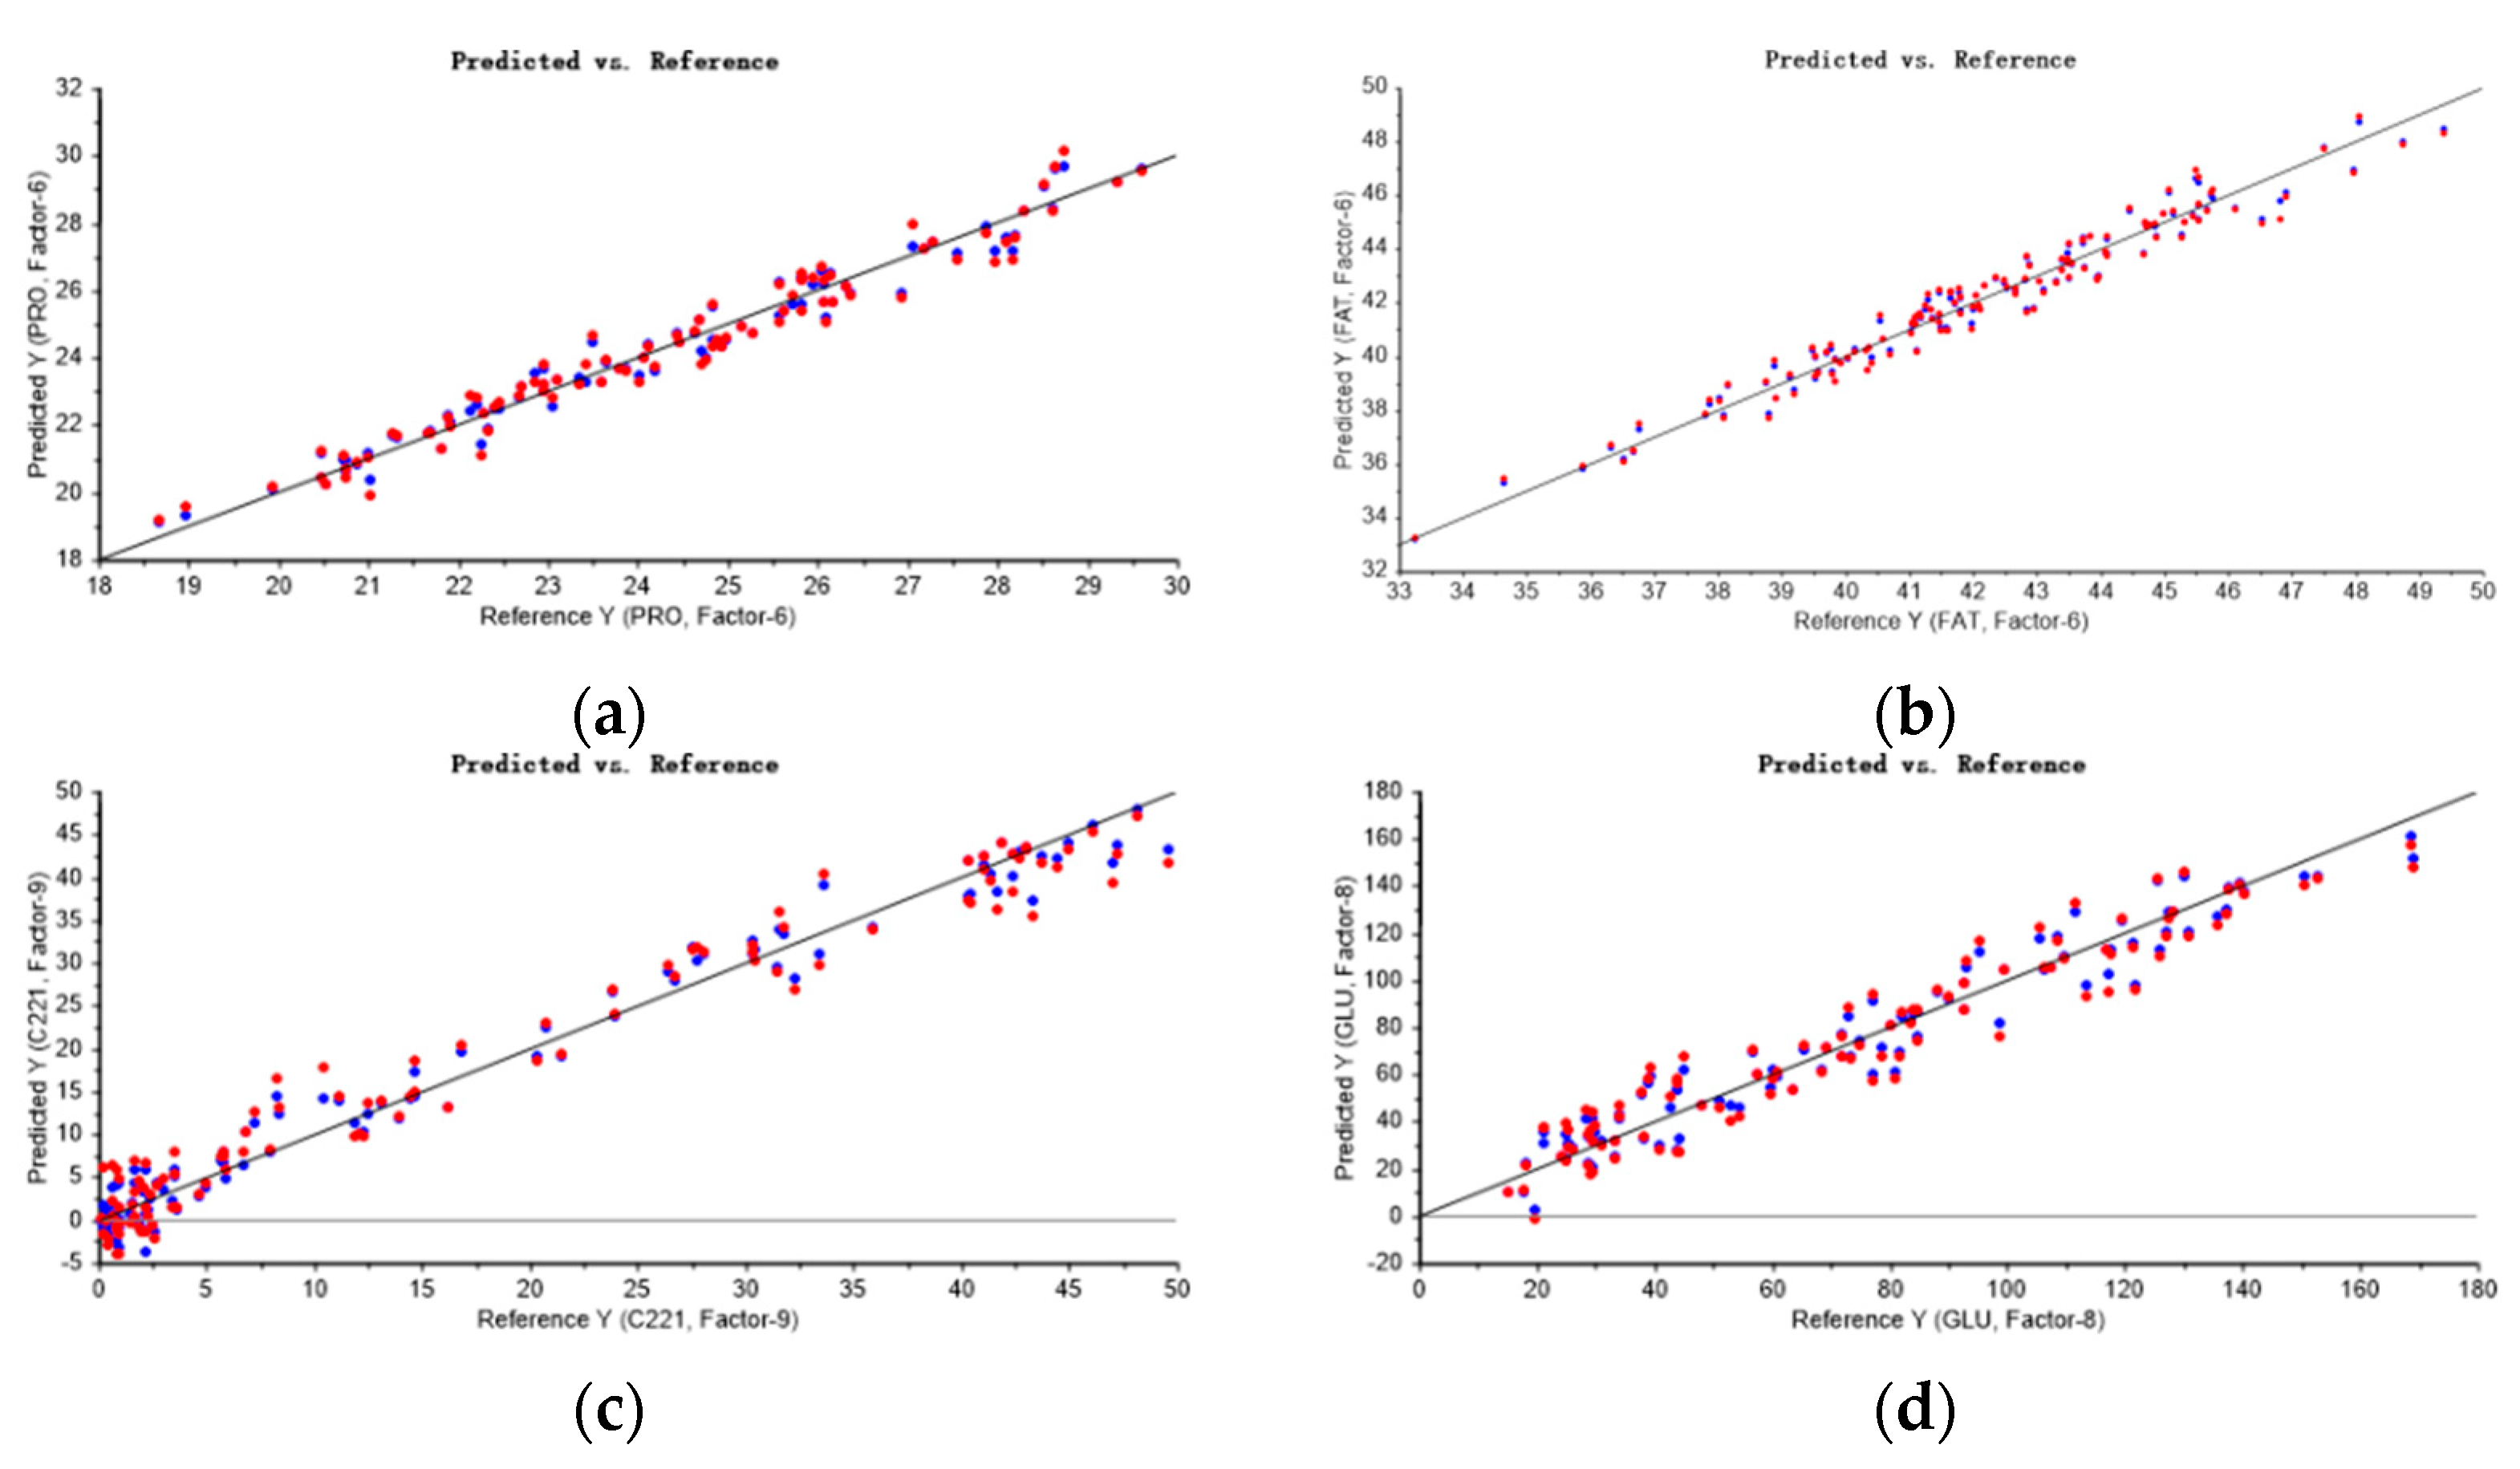
3.3.2. Validation of Calibration Models

The KPLS calibration models of crude protein content, oil content, erucic acid content, and glucosinolate content were built in Section 3.3.1. Then, these calibration models were used to estimate the crude protein content, oil content, erucic acid content, and glucosinolate content at each NIR hyperspectral image. A total of 30 independent samples were used to evaluate these models, and the results were presented in Table 2. The RMSEPs of the crude protein content, oil content, erucic acid content, and glucosinolate content were 0.5514%, 0.5680%, 2.8113%, and 10.3209 µmol/g, respectively. The R2p of proteins, fat, erucic acid and glucosinolate were 0.9461, 0.9503, 0.9572, and 0.9335, respectively.

3.4. Discussion

In order to eliminate the negative effects of sample color and particle size, some measures were used to collect the hyperspectral image. These measures included (a) the region growth algorithm used to select images and remove abnormal color points to improve applicability; (b) sample surface color, type and distribution determined the directions of reflected light, the four lamps were mounted on one side of the camera at a 45° angle with respect to the vertical plane to illuminate the sample, which should be warmed up for 30 min when the light source was stable; (c) the black box was used to reduce the light interference when collecting the samples; (d) the moving platform was at a uniform speed of 10 mm/s and without vibration; and (e) average spectrum was used to reduce the negative effects of sample color and particle size.

4. Conclusions

In this study, the crude protein content, oil content, erucic acid content, and glucosinolate content of rapeseed were determined using NIR-HSI. The regional growth algorithm was used for selecting the ROI. Furthermore, the best processing method was MSC combined with the first derivative for crude protein content, oil content, erucic acid content, and glucosinolate content. KPLS was used for the model establishment. The results indicated that RMSEPs were 0.5514%, 0.5680%, 2.8113%, and 10.3209 µmol/g and R2p were 0.9461, 0.9503, 0.9572, and 0.9335 for the crude protein, oil content, erucic acid content and glucosinolate content in rapeseed, respectively, which revealed great potential for detecting four quality parameters of rapeseed using NIR-HSI. Therefore, this method can provide technical support for guaranteeing rapeseed quality and safety.

Author Contributions

D.W.: investigation, methodology, writing—original draft. X.L.: investigation, validation. L.Y., F.M., W.Z. and J.J.: formal analysis. L.Z.: conceptualization, writing—review and editing, project administration, funding acquisition. P.L.: supervision, funding acquisition. All authors have read and agreed to the published version of the manuscript.

Funding

This research was funded by the National Key Research and Development Project of China (2021YFD1600101), the earmarked fund for the China Agriculture Research System (CARS-12), the Major Project of Hubei Hongshan Laboratory (2022hszd002), Key Research and Development Projects of Hubei Province (2021BBA227), and the Agricultural Science and Technology Innovation Program of Chinese Academy of Agricultural Sciences (CAAS-ASTIP-2021- OCRI).

Institutional Review Board Statement

Not applicable.

Informed Consent Statement

Not applicable.

Data Availability Statement

The data that support the findings of this study are available on request to the corresponding author.

Conflicts of Interest

The authors declare no conflict of interests.

References

  1. Zheng, Q.; Liu, K. Worldwide rapeseed (Brassica napus L.) research: A bibliometric analysis during 2011–2021. Oil Crop Sci. 2022, 7, 157–165. [Google Scholar] [CrossRef]
  2. Lu, Y.Z.; Du, C.W.; Yu, C.B.; Zhou, J.M. Fast and nondestructive determination of protein content in rapeseeds (Brassica napus L.) using Fourier transform infrared photoacoustic spectroscopy (FTIR-PAS). J. Sci. Food Agric. 2014, 94, 2239–2245. [Google Scholar] [CrossRef] [PubMed]
  3. Chew, S.C. Cold-pressed rapeseed (Brassica napus) oil: Chemistry and functionality. Food Res. Int. 2020, 131, 108997. [Google Scholar] [CrossRef] [PubMed]
  4. Zhang, Z.; Wen, M.; Chang, Y.Q. Degradation of glucosinolates in rapeseed meal by Lactobacillus delbrueckii and Bacillus subtilis. Grain Oil Sci. Technol. 2020, 3, 70–76. [Google Scholar] [CrossRef]
  5. Jung, S.; Rickert, D.A.; Deak, N.A.; Aldina, E.D.; Recknorc, J.; Johnson, L.A.; Murphy, P.A. Comparison of Kjeldahl and Dumas Methods for Determining Protein Contents of Soybean Products. J. Am. Oil Chem. Soc. 2003, 80, 1169–1173. [Google Scholar] [CrossRef]
  6. Luque-Garcia, J.L.; de Castro, M.D.L. Ultrasound-assisted Soxhlet extraction: An expeditive approach for solid sample treatment-Application to the extraction of total fat from oleaginous seeds. J. Chromatogr. A 2004, 1034, 237–242. [Google Scholar] [CrossRef]
  7. Seppänen-Laakso, T.; Laakso, I.; Hiltunen, R. Analysis of fatty acids by gas chromatography, and its relevance to research on health and nutrition. Anal. Chim. Acta 2002, 465, 39–62. [Google Scholar] [CrossRef]
  8. Szmigielska, A.M.; Schoenau, J.J. Use of anion-exchange membrane extraction for the high-performance liquid chromatographic analysis of mustard seed glucosinolates. J. Agric. Food Chem. 2000, 48, 5190–5194. [Google Scholar] [CrossRef]
  9. Li, L.; Chen, S.; Deng, M.; Gao, Z.D. Optical techniques in non-destructive detection of wheat quality: A review. Grain Oil Sci. Technol. 2022, 5, 44–57. [Google Scholar] [CrossRef]
  10. Tian, X.; Zhang, C.; Li, J.B.; Fan, S.X.; Yang, Y.; Huang, W.Q. Detection of early decay on citrus using LW-NIR hyperspectral reflectance imaging coupled with two-band ratio and improved watershed segmentation algorithm. Food Chem. 2021, 360, 130077. [Google Scholar] [CrossRef]
  11. Kang, R.; Park, B.; Ouyang, Q.; Ren, N. Rapid identification of foodborne bacteria with hyperspectral microscopic imaging and artificial intelligence classification algorithms. Food Control 2021, 130, 108379. [Google Scholar] [CrossRef]
  12. Rabanera, J.D.; Guzman, J.D.; Yaptenco, K.F. Rapid and Non-destructive measurement of moisture content of peanut (Arachis hypogaea L.) kernel using a near-infrared hyperspectral imaging technique. J. Food Meas. Charact. 2021, 15, 3069–3078. [Google Scholar] [CrossRef]
  13. Ríos-Reina, R.; Callejon, R.M.; Amigo, J.M. Feasibility of a rapid and non-destructive methodology for the study and discrimination of pine nuts using near-infrared hyperspectral analysis and chemometrics. Food Control 2021, 130, 108365. [Google Scholar] [CrossRef]
  14. Klein, M.E.; Aalderink, B.J.; Padoan, R.; de Bruin, G.; Steemers, T.A.G. Quantitative hyperspectral reflectance imaging. Sensors 2008, 8, 5576–5618. [Google Scholar] [CrossRef] [PubMed]
  15. Jin, H.L.; Ma, Y.S.; Li, L.L.; Cheng, J.H. Rapid and Non-destructive Determination of oil content of peanut (Arachis hypogaea L.) using hyperspectral imaging analysis. Food Anal. Methods 2016, 9, 2060–2067. [Google Scholar] [CrossRef]
  16. Liu, Z.; Zheng, Y.Q.; Han, X.H. Deep unsupervised fusion learning for hyperspectral image super resolution. Sensors 2021, 21, 2348. [Google Scholar] [CrossRef]
  17. Nalepa, J. Recent advances in multi- and hyperspectral image analysis. Sensors 2021, 21, 6002. [Google Scholar] [CrossRef]
  18. Yuan, D.S.; Jiang, J.B.; Qi, X.T.; Xie, Z.L.; Zhang, G.M. Selecting key wavelengths of hyperspectral imagine for nondestructive classification of moldy peanuts using ensemble classifier. Infrared Phys. Technol. 2020, 111, 103518. [Google Scholar] [CrossRef]
  19. Huang, H.P.; Hu, X.J.; Tian, J.P.; Jiang, X.N.; Sun, T.; Luo, H.B.; Huang, D. Rapid and nondestructive prediction of amylose and amylopectin contents in sorghum based on hyperspectral imaging. Food Chem. 2021, 59, 129954. [Google Scholar] [CrossRef]
  20. Zhang, Y.M.; Guo, W.C. Moisture content detection of maize seed based on visible/nearinfrared and near-infrared hyperspectral imaging technology. Int. J. Food Sci. Tech. 2019, 55, 631–640. [Google Scholar] [CrossRef]
  21. Wang, Y.Y.; Xiong, F.; Zhang, Y.; Wang, S.; Yuan, Y.W.; Lu, C.C.; Nie, J.; Nan, T.G.; Yang, B.; Huang, L.Q.; et al. Application of hyperspectral imaging assisted with integrated deep learning approaches in identifying geographical origins and predicting nutrient contents of Coix seeds. Food Chem. 2023, 404, 134503. [Google Scholar] [CrossRef] [PubMed]
  22. Zhu, S.S.; Zhou, L.; Zhang, C.; Bao, Y.D.; Wu, B.H.; Chu, H.J.; Yu, Y.; He, Y.; Feng, L. Identification of soybean varieties using hyperspectral imaging coupled with convolutional neural network. Sensors 2019, 19, 4065. [Google Scholar] [CrossRef] [PubMed]
  23. Caporaso, N.; Whitworth, M.B.; Fisk, B.D. Total lipid prediction in single intact cocoa beans by hyperspectral chemical imaging. Food Chem. 2021, 344, 128663. [Google Scholar] [CrossRef] [PubMed]
  24. Fu, D.D.; Zhou, J.F.; Scaboo, A.M.; Niu, X.F. Nondestructive phenotyping fatty acid trait of single soybean seeds using reflective hyperspectral imagery. J. Food Process Eng. 2021, 44, e13759. [Google Scholar] [CrossRef]
  25. Gao, J.Y.; Zhao, L.G.; Li, J.; Deng, L.M.; Ni, J.G.; Han, Z.Z. Aflatoxin rapid detection based on hyperspectral with 1D-convolution neural network in the pixel level. Food Chem. 2021, 360, 129968. [Google Scholar] [CrossRef]
  26. Zhou, Q.; Huang, W.Q.; Liang, D.; Tian, X. Classification of aflatoxin B1 concentration of single maize kernel based on near-infrared hyperspectral imaging and feature selection. Sensors 2021, 21, 4257. [Google Scholar] [CrossRef]
  27. Liang, K.; Huang, J.N.; He, R.Y.; Wang, Q.J.; Chai, Y.Y.; Shen, M.X. Comparison of Vis-NIR and SWIR hyperspectral imaging for the nondestructive detection of DON levels in Fusarium head blight wheat kernel and wheat flour. Infrared Phys. Technol. 2020, 106, 103281. [Google Scholar] [CrossRef]
  28. Su, W.H.; Sun, D.W.; He, J.G.; Zhang, L.B. Variation analysis in spectral indices of volatile chlorpyrifos and non-volatile imidacloprid in jujube (Ziziphus jujuba Mill.) using near-infrared hyperspectral imaging (NIR-HSI) and gasch0romatograph-mass spectrometry (GC-MS). Comput. Electron. Agric. 2017, 139, 41–55. [Google Scholar] [CrossRef]
  29. GB 5009.6-2016; Determination of Fat in Food. National Food Safety Standard: Beijing, China, 2016.
  30. GB 14488.1-2008; Determination of Oil Content in Food. National Food Safety Standard: Beijing, China, 2008.
  31. GB 5009.168-2016; Determination of Fatty Acids in Food. National Food Safety Standard: Beijing, China, 2016.
  32. NY/T 1581-2007; Determination of Glucosinolate in Rapeseed. Agricultural Industry Standard: Beijing, China, 2007.
  33. Zhan, X.B.; Jiang, S.L.; Yang, Y.L.; Liang, J.; Shi, T.L.; Li, X.W. Ultrasonic spectrum for particle concentration measurement in multicomponent suspensions. Meas. Sci. Technol. 2016, 27, 025501. [Google Scholar] [CrossRef]
  34. Park, J.I.; Liu, L.; Ye, X.P.; Jeong, M.K.; Jeong, Y.S. Improved prediction of biomass composition for switchgrass using reproducing kernel methods with wavelet compressed FT-NIR spectra. Expert. Syst. Appl. 2012, 39, 1555–1564. [Google Scholar] [CrossRef]
  35. Ni, Y.N.; Mei, M.H.; Kokot, S. Analysis of complex, processed substances with the use of NIR spectroscopy and chemometrics: Classification and prediction of properties-the potato crisps example. Chemom. Intell. Lab. Syst. 2011, 105, 147–156. [Google Scholar] [CrossRef]
  36. Qi, X.T.; Jiang, J.B.; Ximin Cui, X.M.; Yuan, D.S. Moldy peanut kernel identification using wavelet spectral features extracted from hyperspectral images. Food Anal. Method. 2020, 13, 445–456. [Google Scholar] [CrossRef]
  37. Petisco, C.; García-Criado, B.; Vázquez-de-Aldana, B.R.; de Haro, A.; García-Ciudad, A. Measurement of quality parameters in intact seeds of Brassica species using visible and near-infrared spectroscopy. Ind. Crops Prod. 2010, 32, 139–146. [Google Scholar] [CrossRef]
  38. Kumar, S.; Chauhan, J.S.; Kumar, A. Screening for erucic acid and glucosinolate content in rapeseed-mustard seeds using near infrared reflectance spectroscopy. J. Food Sci. Technol. 2010, 47, 690–692. [Google Scholar] [CrossRef] [PubMed]
Figure 1. Fourteen major rapeseed-producing regions.
Applsci 13 09444 g001
Figure 2. The whole procedure of quality analysis by NIR hyperspectral imaging.
Applsci 13 09444 g002
Figure 3. (a) The raw image of rapeseed; (b) ROI selected by regional growing method; (c) the raw spectra of rapeseed.
Applsci 13 09444 g003
Figure 4. The optimal model parameter for crude protein content (a), oil content (b), erucic acid (c), and glucosinolates (d). (Blue dots represents the reference values and red dots represents the predicted valus).
Applsci 13 09444 g004
Table 1. Descriptive statistics for crude protein content, oil content, erucic acid content, and glucosinolate content.
ParametersGroupNumberMin.MeanMax.
Crude protein contentTraining set12018.6624.2929.60
Test set3018.8624.7829.12
Oil contentTraining set12033.2442.1549.37
Test set3034.5443.3249.11
Erucic acidTraining set1200.1016.3750.20
Test set300.1015.4047.87
GlucosinolatesTraining set12014.6368.97168.96
Test set3015.8771.43155.54
Table 2. The performance of four prediction models for crude protein content, oil content, erucic acid content, and glucosinolate content.
ParametersPreprocessingKPLS FactorsTraining SetCross-ValidationTest Set
R2cRMSECR2CVRMSECVR2PRMSEP
Crude proteinMSC + 1st Der60.96920.45000.95480.55220.94610.5514
MSC70.96320.49750.94810.5908
SNV80.96870.45590.95040.5736
SNV + 1st Der60.94680.59570.92190.7369
Oil contentMSC + 1st Der60.96530.53990.95280.62850.95030.5680
MSC60.95110.61850.94230.6812
SNV60.94740.63970.93930.7105
Erucic acidMSC + 1st Der90.97742.50180.96033.25810.95722.8113
SNV + 1st Der70.96103.34730.94234.1374
OSC + 1st Der60.93624.24880.91345.0265
GlucosinolateMSC + 1st Der80.94519.50870.918211.76020.933510.3209
MSC + 2nd Der70.938010.59560.893113.8567
SNV + 1st Der60.919411.69720.899513.0994
SNV + 2nd Der70.94619.44470.904412.6364
Disclaimer/Publisher’s Note: The statements, opinions and data contained in all publications are solely those of the individual author(s) and contributor(s) and not of MDPI and/or the editor(s). MDPI and/or the editor(s) disclaim responsibility for any injury to people or property resulting from any ideas, methods, instructions or products referred to in the content.

