Article

Accurate Segmentation of Tilapia Fish Body Parts Based on Deeplabv3+ for Advancing Phenotyping Applications

Key Laboratory of Fisheries Information, Ministry of Agriculture and Rural Affairs, Shanghai Ocean University, Hucheng Ring Road 999, Shanghai 201306, China
*
Author to whom correspondence should be addressed.
Appl. Sci. 2023, 13(17), 9635; https://doi.org/10.3390/app13179635
Submission received: 3 August 2023 / Revised: 21 August 2023 / Accepted: 24 August 2023 / Published: 25 August 2023

Abstract

:
As an important economic fish resource, germplasm resources and phenotypic measurements of tilapia are of great importance in the direction of culture and genetic improvement. Furthermore, accurate identification and precise localization of tilapia body parts are crucial for enabling key technologies such as automated capture and precise cutting. However, there are some problems in the semantic segmentation of tilapia fish, including the accuracy of target edge segmentation and the ambiguity in segmenting small targets. To improve the accuracy of semantic segmentation of tilapia parts in real farming environments, an improved Deeplabv3+ network model method is proposed for implementing tilapia part segmentation to facilitate phenotypic measurements on tilapia in this paper. The CBAM module is embedded in the encoder, which can improve the accurate identification and localization of tilapia parts by adaptively adjusting the channel weights and spatial weights and better focus on the key features and spatial connections of tilapia body parts. Furthermore, the decoding part of the Deeplabv3+ model is optimized by using SENet, which greatly increases the segmentation accuracy of the network by establishing the interdependence between channels while suppressing useless features. Finally, model performance is tested and compared with the original network and other methods on the tilapia part segmentation dataset. The experimental results show that the segmentation performance of the improved network is better than other networks, such as PSPNet and U-Net, and the IoU values in the head, fins, trunk, and tail of the fish body are 9.78, 2.27, 6.27, and 6.58 percentage points higher than those of the Deeplabv3+ network, respectively. The results validate the effectiveness of our approach in solving the above problems encountered in the semantic segmentation of tilapia parts.

1. Introduction

Fish phenotypic measurement involves the quantitative description of fish body morphology and structure. It typically includes measurements of characteristics such as body length, body width, and fat content of the fish. These measurement results can provide valuable information for fish classification, population dynamics studies, investigation of environmental adaptability, and management of fish genetic resources. The tilapia, as an important economic fish, is widely utilized in aquaculture due to its fast growth, strong adaptability, and excellent meat quality [1]. Accurate acquisition of fish body information is essential for aquaculture management and product processing. Precise identification and segmentation of fish parts contribute to monitoring the health status, growth and development, disease detection, and achieving refined aquaculture management. Currently, most methods rely on manual or semi-mechanized approaches, which are more subjective, less efficient, and less accurate, and prone to physiological damage to the fish [2].
Accurate measurement and analysis of tilapia weight, length, and abdominal fat weight can be achieved through the segmentation of specific body parts, providing effective guidance for the assessment of tilapia genetic resources [3]. However, tilapia possesses unique morphological characteristics, such as a well-developed black dorsal fin, regular black markings on the dorsal fin and tail, blunt and round tail fin, and multiple vertical black stripes along the body axis. The special morphological features and the complex underwater background interference make the identification extremely difficult. Traditional segmentation methods often fail to meet the accuracy and efficiency and still have limitations in dealing with complex backgrounds, multiple fish occlusions, and edge blurring.
With the development of image processing and deep learning, semantic segmentation techniques have demonstrated significant advantages and potential in fish phenotypic measurement. Many scholars have explored the possibility of applying deep learning methods to fish phenotypic measurement and have achieved notable results. For instance, Deng [4] proposed a method based on Keypoints R-CNN for the segmentation and measurement of several freshwater fish species. They used deep learning networks to extract features from freshwater fish images and employed an underwater stereo vision system for automatic species recognition and length measurement. Azarmdel [5] developed an automatic trout fin-cutting system using image processing algorithms, which can accurately locate the trout fin position and determine the cutting point location. By employing the Mask-RCNN network, Yanjun Li [6] successfully accomplished fish detection and segmentation, and the model had an accuracy of 88% and a recall of 84% on the validation set. Their model used the GrabCut interactive segmentation algorithm to refine the segmentation samples at the boundaries, which greatly improved the segmentation accuracy with an MIoU of 81%. However, their method has difficulties in dealing with the problem of similar colors in the dorsal fin, tail, and abdominal regions of tilapia. In particular, when the background closely resembles the fish’s natural farming environment due to lighting conditions, these techniques tend to produce errors in proximity to the fin boundary and tail. Consequently, this leads to a notable decline in the accuracy of segmentation rates. To address these issues, Yu [7] used Mask-RCNN to segment fish phenotypic features in pure and complex backgrounds, respectively, and the experimental results showed that the segmentation accuracy of fish morphology in complex backgrounds was much lower than that in pure backgrounds. Garcia [8] used Mask-RCNN to test segmentation on a self-built dataset and achieved 84.5% IoU for single fish and 82.4% IoU for overlapping fish. To extract fish contours, Yu [9] improved mAP by 2.6% compared to the original model by improving Decoupled-SOLO, but they still need to solve the problem of fish occlusion. In addition, Liu [10] compared and tested FCN [11] with the Segnet [12] network on a self-built semantic part segmentation dataset of striped sharks, and the experimental findings demonstrated that Segnet was more accurate on the self-built dataset and the segmentation was smoother in each part. To enhance the accuracy of segmentation within intricate underwater environments, Liu [13] used Deeplabv3+ as the base model, introduced an unsupervised color correction module (UCM) in the encoder part to improve the image quality, two upsamplings were added to the decoder part, and verified the improved method’s segmentation accuracy improvement of 3% on a homemade dataset. However, the above method degrades when dealing with different types of objects of similar shapes or small objects for semantic segmentation, in addition to the segmentation effect when the gap between the target and the background is small. Zeng [14] addressed the problems of inaccurate image target edge segmentation and slow image fitting by the Deeplabv3+ model and mirrored the feature cross-notice module (FCA). The improved model improves MIoU and MPA on the Pascal VOC2012 dataset by 1.96% and 2.84%, respectively. Since FCA consists of two branches and a feature cross-attention module, it will occupy too much computational space and is very demanding on the equipment. Although many domestic and foreign researchers have performed a lot of research on fish segmentation and detection, no method for tilapia part segmentation has been found after review. In addition, based on the application of the Deeplabv3+ semantic segmentation model, many scholars have achieved good results in different fields. Peng [15] realized the accurate segmentation of litchi branches by using the Deeplabv3+ model combined with the Xception_65 feature extraction network and obtained the relevant information of the branches through semantic segmentation, which provided powerful picking robots to find the fruit branch. For the research area of automatic interpretation of remote sensing images, Atik [16] used the combination of the Deeplabv3+ network with different models, such as ResNet-50, and compared the model’s performance on different datasets, in which the IoU value of Deeplabv3+ and ResNet-50 model in the Inria dataset was at least 3% higher than that of the previous studies. These studies provide useful guidance for the task of tilapia part segmentation.
Based on the above, we selected the Deeplabv3+ network as the baseline framework. In choosing Deeplabv3+ as the basic framework, we consider its excellent performance in semantic segmentation. Deeplabv3+ is able to effectively capture both global and local features in an image through the features of dilated convolution and global contextual information fusion, and it is also robust in dealing with scale changes and object boundaries. For the task of tilapia part segmentation, Deeplabv3+’s multi-scale information fusion allows the network to perceive the changes in different scales of the morphological features of tilapia, such as dorsal fins and tails, which is expected to capture the features better and improve the accuracy of segmentation. Furthermore, a self-constructed tilapia body part segmentation dataset was used as our experimental dataset. Considering the limitations of the Deeplabv3+ network in accurate object edge segmentation and ambiguous segmentation of small objects, this study proposes a fusion of CBAM (Convolutional Block Attention Module) [17] and SENet [18] with the Deeplabv3+ model. The CBAM attention mechanism is introduced after the feature extraction stage, allowing the model to assign different weights to different spatial and channel aspects of the input image, and SENet can be used to enhance the informative features and suppress the unimportant ones. Furthermore, to address the issue of imbalanced sample distribution, the Focal Loss function is introduced for correction. Finally, a comparative analysis is conducted with other networks, such as U-Net [19], PSPNet [20], and Deeplabv3+, on our self-constructed dataset to resolve the issue of low edge segmentation accuracy in the original network. This approach aims to achieve precise segmentation of tilapia body parts in real aquaculture environments. The main contributions of the work in this paper are as follows:
  • For the first time, a tilapia part image sample dataset was established, which can be used for accurate part segmentation of tilapia and can provide an effective basis for phenotypic measurement of tilapia.
  • According to the morphological characteristics of tilapia, the Deeplabv3+ network structure is improved accordingly to increase the segmentation accuracy of the network as a whole.
  • Great improvements in the issues of unclear segmentation of tilapia boundary regions, mis-segmentation of small objects in the presence of overlapping fish, and segmentation errors in complex backgrounds on the Deeplabv3+ tilapia part segmentation dataset.

2. Materials and Methods

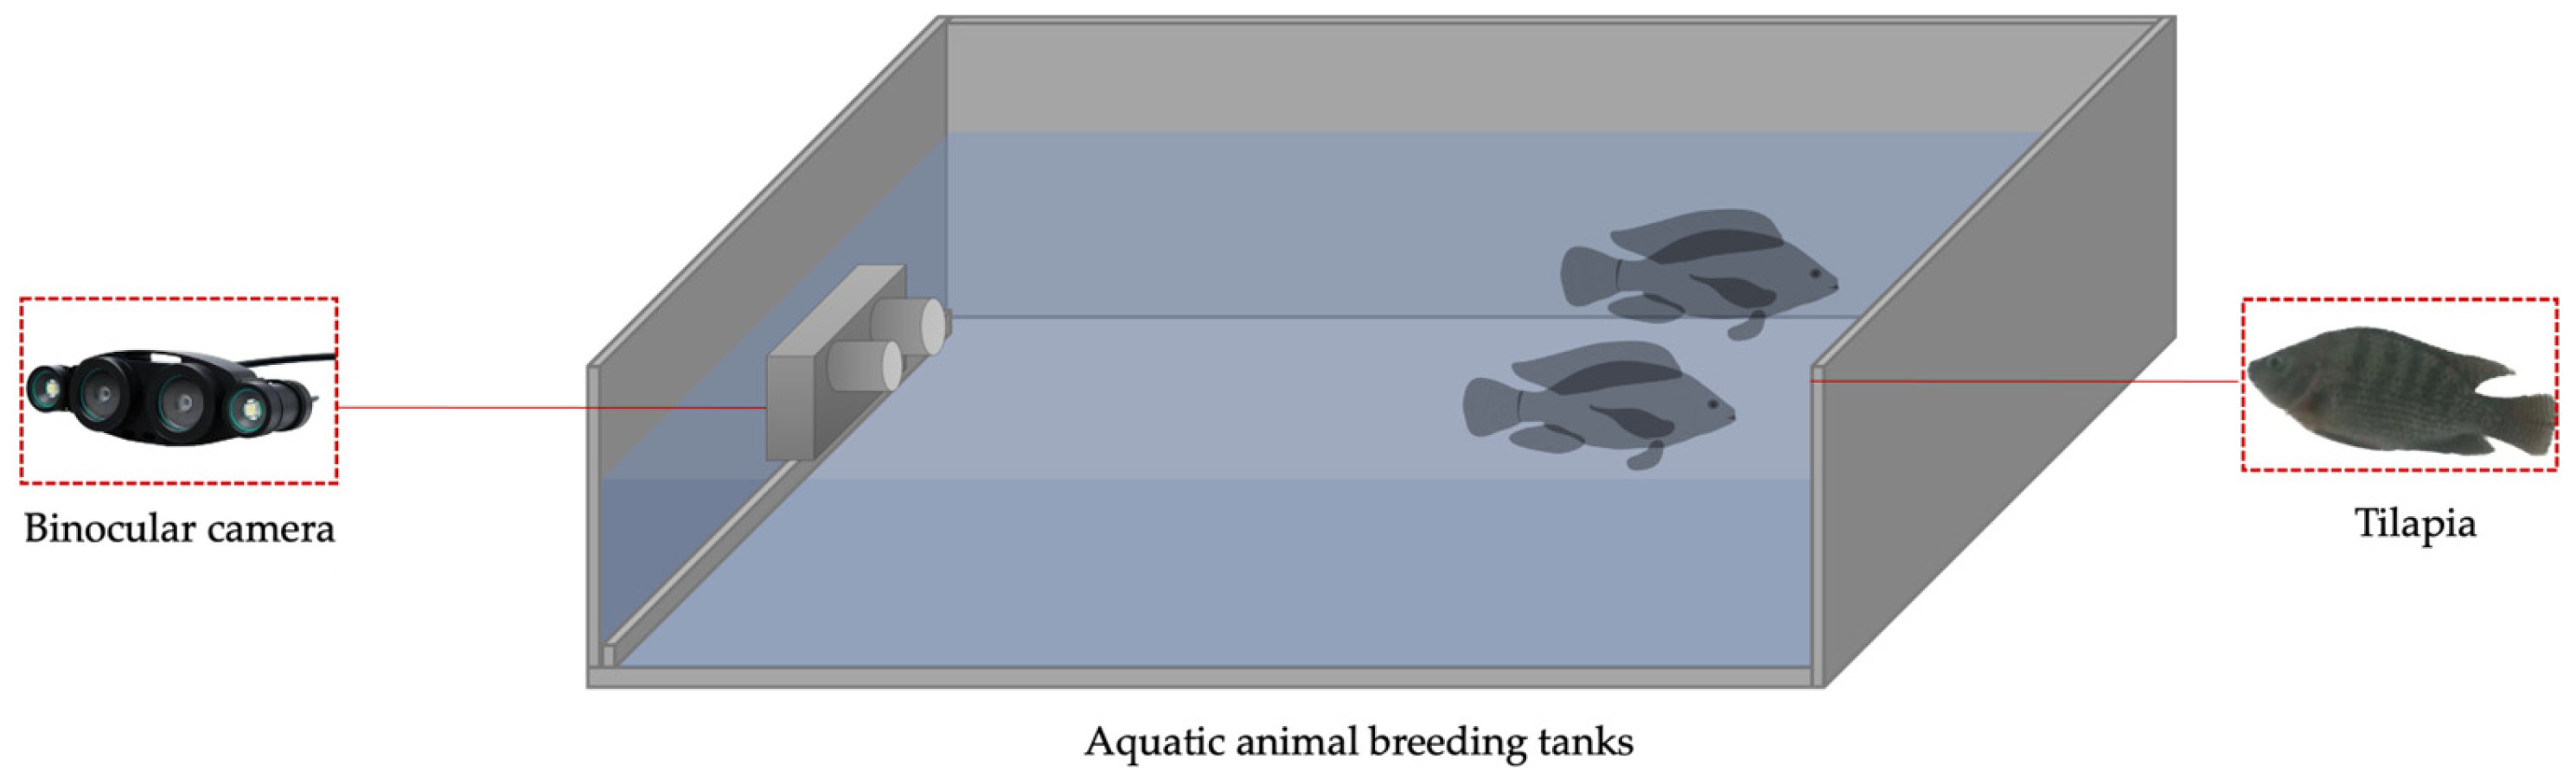
2.1. Data Acquisition

Currently, research on semantic part segmentation mostly focuses on publicly available datasets and explores relevant phenotypes through model adjustments and improvements. There is currently a lack of publicly available data samples specifically for tilapia part segmentation. Tilapia has a spindle-shaped body, a flat head, and more than ten dorsal fin spines. It also exhibits black stripes and spots on its body, which are important features for tilapia part segmentation and are among the challenging aspects in the field of image segmentation. Moreover, research on the semantic segmentation of fish mainly focuses on segmenting the entire body, lacking specific annotations for individual parts. To address this gap, we have created a dataset specifically for tilapia part segmentation. This dataset emphasizes the annotation of tilapia parts, enhancing its suitability for fine-grained analysis. For example, it can be used to study the impact of tilapia parts on phenotype, behavior, or disease diagnosis. Furthermore, the dataset encompasses diverse angles and poses in capturing tilapia, aiding in the assessment of algorithmic robustness and generalization performance. In contrast to overall segmentation tasks prevalent in publicly available datasets, our dataset is distinctly focused on the segmentation of tilapia parts, allowing for the design and training of models tailored to this specific task, thereby furnishing data support for subsequent phenotype measurements. Therefore, this study establishes a sample set for semantic part segmentation of tilapia.
The tilapia (African Carp) samples used in the experiments were collected from the Coastal Aquaculture Base of Shanghai Ocean University in Shanghai, China, as shown in Figure 1. To quickly obtain tilapia samples, the tilapias were placed in batches in an aquaculture tank during image acquisition. A stereo camera was horizontally positioned at the bottom of the tank. The camera captured images of individual fish, multiple fish, and occluded fish by moving the camera accordingly. The image resolution was set to 1920 × 960. To address issues such as overfitting during model training and the redundancy of left and right stereo images, we utilized Matlab tools to segment and remove duplicate samples from the left and right images. This resulted in a total of 855 unique sample images. Figure 2 shows a part of the image of the tilapia part segmentation dataset.

2.2. Research Program

2.2.1. Phenotype Classification-Oriented Segmentation Scheme

Zhang [21] conducted an evaluation on the effects of different levels of tea polyphenol feed on the fat deposition content in tilapia. These research findings provide some reference for understanding the characteristics of different parts of tilapia and their relationship with growth performance and other biological parameters. Additionally, the research team collected data on the head circumference, chest circumference, tail circumference, body weight, and abdominal fat weight of tilapia. The measurement results are presented in Figure 3. Figure 3 displays the relationships between the tilapia’s head circumference, chest circumference, and tail circumference, respectively, with their body weight and abdominal fat weight. The blue dots represent the body weight of the tilapia, while the orange dots represent the abdominal fat weight. By observing the scatter plot distributions, we can observe that in Figure 3a, the tilapia’s head circumference can be fitted to a polynomial curve, indicating a correlation with the body weight. The tilapia’s head circumference also exhibits a linear relationship with its abdominal fat weight. This finding aligns with previous studies by other scholars. First, Fernandes [22] proposed a method for tilapia part segmentation using the PSII-6 model. They successfully identified and segmented key parts of tilapia, including the head, body, and tail, using this model. This research provides strong support for our part segmentation. Furthermore, Zhu [23] explored the growth performance assessment and phenotypic trait correlation coefficients of GIFT tilapia. Their study revealed the associations between different phenotypic characteristics and various parts of the tilapia body. This finding further supports our segmentation approach based on head circumference, chest circumference, and tail circumference, laying the foundation for subsequent phenotypic measurement and analysis. Based on the analysis of the aforementioned measurement results and the morphological characteristics of visible parts of the tilapia, the fish were divided into four parts: head, trunk, fins, and tail. Each of these four parts was manually annotated with semantic labels using Labelme software (v4.5.12), as shown in Figure 4. The first row displays the original images, while the second row shows the corresponding labels, demonstrating examples of single fish, multiple fish, and occlusion scenarios present in the dataset.

2.2.2. Experimental Process

Figure 5 illustrates the main workflow of the experiment. In the aquaculture environment, the original images were obtained through an image acquisition device. After preprocessing, the raw data were obtained, and the image annotation tool Labelme was used for manual labeling to create the part label dataset. To better simulate the swimming scenes of tilapia in real environments and address overfitting issues during model training, three data augmentation techniques were employed: translation, flipping, and cropping. The augmented data were then fed into the improved model for training to obtain the optimal network structure parameters. Using the optimized fish part segmentation model, the test samples were predicted, and the segmentation results were compared with the corresponding labels to evaluate the performance of the evaluation metric.

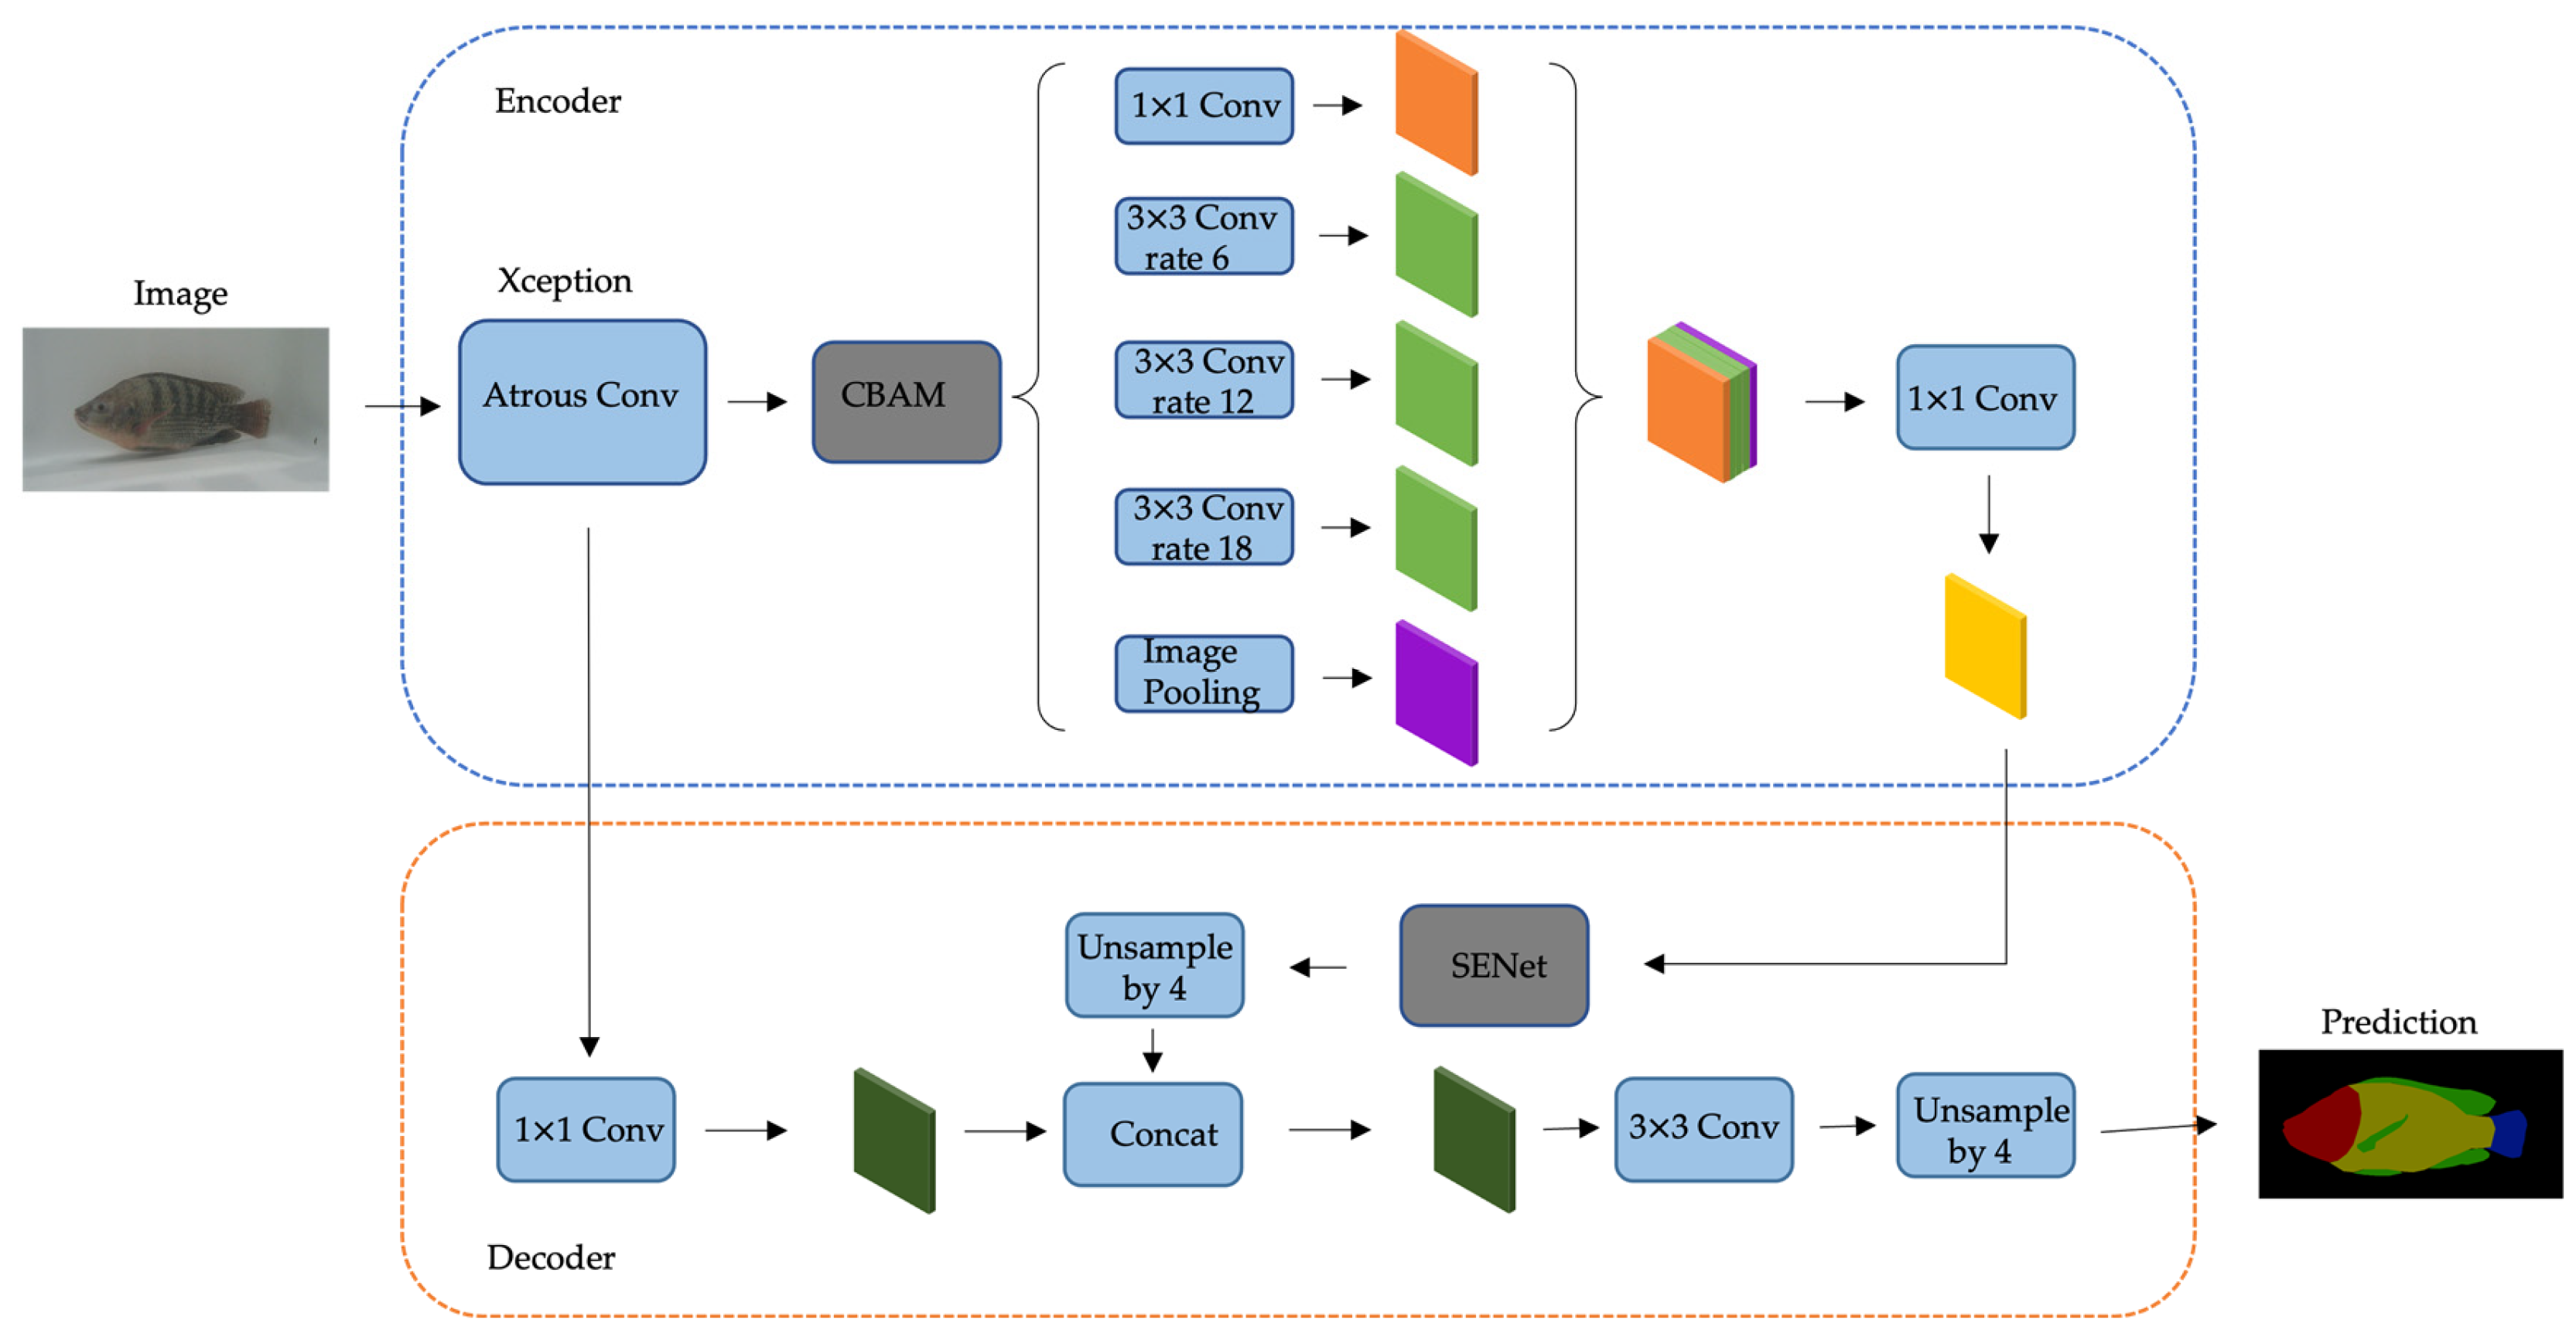
2.3. Improved Deeplabv3+ Network Architecture

Deeplabv3+ is the latest cutting-edge semantic segmentation network in the Google team’s Deeplab series [24]. It follows a common encoder-decoder architecture and is based on end-to-end training. Deeplabv3+ utilizes Deeplabv3 [25] as the encoder and employs a deep separable convolution network as the decoder. In the encoder, the backbone network adopts the lightweight Xception [26] architecture for feature extraction, followed by ASPP (Atrous Spatial Pyramid Pooling) [27], which utilizes atrous convolutions with different dilation rates and upsampling to fuse low-level and high-level feature information for multi-scale feature extraction. Simultaneously, during the four-fold upsampling, the low-level features with the same Xception structure from the backbone network are connected and undergo 1 × 1 convolution to reduce the number of channels. The features are then fine-tuned using a 3 × 3 convolution and four upsampling layers to generate the final prediction map.
Deeplabv3+ has achieved good results on commonly used semantic segmentation datasets. In this study, when using our custom tilapia part segmentation dataset, Deeplabv3+ exhibited insufficient clarity in tilapia boundary segmentation and lacked sufficient feature information. There were issues with misclassification of objects and blending of object pixels. The reason for these issues is that the downsampling and upsampling operations in the feature extraction process, while improving computational speed and spatial resolution, also result in the loss of feature information. This leads to inadequate receptive field and blurriness in point and line information in the boundary, resulting in unclear segmentation, especially in complex scenes. In the decoding process, the feature maps obtained from the ASPP module with different sampling rates are fused together using 1 × 1 convolution to obtain higher-level semantic features. After completing the upsampling, they are combined with the low-level feature maps. However, this process does not differentiate the importance of each feature channel. There is no distinction between useful and irrelevant features, which can affect the final segmentation accuracy of the model.
To address the aforementioned issues, improvements were made to both the encoder and decoder structures of the Deeplabv3+ network in this experiment. The improved model structure is shown in Figure 6, where the gray shaded regions represent the main contributions of this study. To enhance the understanding of image features in the decoder, we introduced the CBAM (Convolutional Block Attention Module) attention mechanism. By adaptively adjusting channel weights and spatial weights, the CBAM module strengthens the understanding of the output feature information. Specifically, after the image passes through the Xception backbone network for feature extraction, we applied the CBAM module to the feature maps to enhance the extraction of semantic feature information. Next, the obtained feature maps were processed using dilated convolutions with different dilation rates to extract semantic feature information from deeper layers. After adjusting the number of channels using a 1 × 1 convolution, the deep semantic information of the tilapia was obtained and transmitted to the decoder module. The deep features were then passed back to the encoder part, where a SENet (Squeeze-and-Excitation) attention mechanism was introduced. Different weights were assigned to the channel features of different segmentation parts to capture higher-level contextual channel information. Subsequently, the image resolution was increased through four-fold upsampling. Finally, the processed shallow features were fused with the deep features and passed through a 3 × 3 convolution to extract features, enabling the segmentation of various parts of the tilapia body. In the following sections, we will provide a detailed explanation of the structures and functions of these two modules.

2.3.1. CBAM Module

The CBAM module is an attention mechanism used in feed-forward convolutional neural networks. It combines spatial and channel attention mechanisms and is applied to enhance the understanding of feature information after feature extraction in the Deeplabv3+ network. For the task of tilapia body part segmentation, the experimental results revealed that there is minimal color difference among different parts of the tilapia body, and varying regions exhibit differing levels of significance with regard to morphology. For example, there is more boundary information around the head and tail, while the trunk and fins contain more texture information. By utilizing channel attention and spatial attention, the CBAM module adaptively adjusts the weights of the feature maps, enabling the network to better focus on important morphological features and improve segmentation accuracy. It has been observed that incorporating both channel and spatial attention in the CBAM module yields better results compared to solely focusing on channel attention. The structure of the CBAM module is shown in Figure 7. The CBAM contains two sub-modules, the Channel Attention Module and the Spatial Attention Module, which perform the mapping of attention mechanisms on the channel and the space, respectively.
The channel attention mechanism compresses the feature maps in the spatial dimension. Specifically, it utilizes two parallel pooling layers, namely max pooling and average pooling, to compress the input feature maps in the spatial dimension, resulting in background descriptors F   m a x c and F   a v g c , respectively. These two outputs are then added together using a shared multi-layer perceptron (MLP) module, and the sigmoid activation function is applied to obtain the weights for each channel, generating the channel-wise feature map M c R C × 1 × 1 . The calculation formula is as follows:
M c F = σ M L P A v g P o o l F + M L P M a x P o o l F
M c F = σ W 1 W 0 F       m a x c + W 1 W 0 F       a v g c
where F denotes the input feature map, σ denotes the sigmoid operation, W 0 R C × r / C ,   W 1 R C / r × C , and r denotes the reduction rate.
The spatial attention mechanism is to compress the feature map in the channel dimension. The average pooling and maximum pooling of the channel feature map in the channel dimension are obtained as F   m a x s and F   a v g s , respectively, and the two feature maps are combined and reduced to one channel after convolution, and then the feature mapping map M s R 1 × W × H is obtained by the sigmoid activation function, which is calculated as follows:
M s F = σ f 7 × 7 A v g P o o l F ; M a x P o o l F  
M s F = σ f 7 × 7 F m a x s ; F a v g s
where f 7 × 7 denotes the convolution kernel of 7 × 7 and σ denotes the sigmoid function.

2.3.2. SENet Module

The SENet module learns feature weights through training loss, enhancing the effectiveness of important features while suppressing irrelevant or uninformative weights. Within the realm of tilapia body part segmentation tasks, practical farming scenarios can introduce certain disruptions, such as fluctuations in lighting conditions or interferences from the background. The introduction of SENet can effectively alleviate channel redundancy issues in the feature maps of the Deeplabv3+ network, improving both parameter and computational efficiency. By precisely controlling the weights of each channel, the network can adaptively adjust the expressive power of the feature maps at different levels. This improves the model’s perception of tilapia body part boundaries, textures, shapes, and other features, enabling it to better adapt to variations in tilapia morphology.
The structure of the SENet module is shown in Figure 8, and it recalibrates the output features through three operations: Squeeze, Excitation, and Reweight. First, the Squeeze operation compresses the feature maps of each channel into a scalar value using global average pooling. Then, a series of fully connected layers map this scalar value to a smaller vector. Next, the Excitation operation treats this vector as the importance weights for each channel and uses these weights to reweight the feature maps of each channel. Finally, the Reweight operation considers the weights outputted by Excitation as the importance of each feature channel after feature selection. It then performs element-wise multiplication to reweight the original features along the channel dimension. The mapping formula is as follows:
z c = F s q u c = 1 H × W i = 1 H j = 1 W u c i , j
s = F e x z , W = σ g z , W = σ W 2 δ W 1 z
x ˜ c = F s c a l e u c , s c = s c · u c
In the given context, u c   represents each feature channel, W 1 and W 2 denote weights, while σ   and δ represent activation functions.

3. Experiment and Analysis

This section is dedicated to enhancing the Deeplabv3+ network for achieving highly precise segmentation of tilapia body parts. The impetus behind this endeavor stems from the pivotal role of tilapia as a crucial aquaculture species, with its morphological characteristics holding paramount significance in both cultivation and research domains. However, contemporary semantic segmentation models encounter challenges when confronted with the distinctive morphological structure and accurate identification of tilapia body parts. Thus, our research objective revolves around optimizing the Deeplabv3+ network to elevate the accuracy and robustness of tilapia body part segmentation, thereby laying a robust groundwork for forthcoming phenotypic measurement pursuits. We accomplish this through meticulous parameter tuning, comprehensive evaluation metrics, and a meticulous demonstration of improvement effects, both quantitatively and qualitatively. Through this undertaking, we aspire to furnish a more precise solution to the realm of tilapia-related research and applications.

3.1. Experimental Environment

The software experimental environment for the study used PyTorch 1.12.0, CUDA 11.3, Python 3.10.6, and Ubuntu 20.04.4. The hardware experimental environment involved an NVIDIA GTX 3090 GPU, an Intel Core i9-10900K CPU, and 24 GB of memory.

3.2. Evaluation Metrics

To provide an objective assessment of the model’s segmentation performance on the tilapia part segmentation dataset and facilitate comparisons with various methods, the following evaluation metrics were employed: mIoU, mPA, and mRecall.
mIoU (mean Intersection over Union) is used to measure the degree of overlap between the predicted segmentation results and the true labels. In the tilapia fish segmentation task, a higher mIoU value indicates that the model can accurately capture the boundaries and shapes of various parts of the tilapia fish. The formula is as follows (8):
mPA (mean Pixel Accuracy) measures the accuracy of the model in classifying each pixel. It calculates the proportion of pixels in the predicted results that match the true labels out of the total number of pixels. For the tilapia fish segmentation task, mPA reflects the pixel-level classification accuracy of the model for various parts. The formula is as follows (9):
mRecall (mean Recall) represents the proportion of correctly detected pixels by the model out of the total number of true pixels for a specific part. In the experiment, the mRecall value indicates the model’s ability to detect various parts of the tilapia fish. The formula is as follows (10):
m I o U = i = 0 k T P T P + F P + F N
m P A = i = 0 k T P + T N T P + F P + F N + T N
m R e c a l l = i = 0 k T P T P + F N
where k represents the number of segmentation classes, i represents the predicted class, TP represents the pixels predicted as fish body regions, which are actually fish body pixels, FP represents the pixels predicted as fish body regions but are actually not fish body pixels, FN represents the pixels predicted as non-fish body regions but are actually fish body pixels, and TN represents the pixels predicted as non-fish body regions and are actually not fish body pixels.

3.3. Experimental Parameter Setting

To visually showcase the efficacy of the proposed methodologies in this study, the reliability and proficiency of the network were ensured through comparative experiments involving several widely employed semantic segmentation models. The network optimization was performed using the stochastic gradient descent algorithm with a momentum parameter (Momentum) of 0.9. The initial learning rate (Learning Rate) was set to 0.001. During the training of the model, we used the freeze training strategy commonly used in deep learning. It is used to fix the parameters of certain layers in the early stages of model training and then fine-tune them in subsequent stages. To accelerate the model training process, the network was subjected to frozen training for a specified number of epochs (Epoch), which was set to 50. The batch size (Batchsize) was set to 8, and the total number of steps was set to 100. For the unfreezing part, a batch size of 4 was used. Considering the potential extreme situations during the capture of tilapia fish in real environments, where there might be significant differences in pixel values for different parts (e.g., only capturing a specific body part), a combination loss function of Focal Loss [28] and Dice Loss [29] was employed in this experiment to further enhance the model’s prediction ability.

3.4. Network Training Results

The experimental results of network training in this study are shown in Figure 9. From the figure, it can be observed that the improved Deeplabv3+ network exhibits a rapid decrease in loss during the initial stages of training. Following a training duration of 10 epochs, the loss value descended from an initial 1.248 to 0.200. As the number of training iterations increases, the loss gradually stabilizes. In the first 80 epochs of training, the improved model exhibits lower training and validation losses compared to the original model. At the 80th epoch, the model’s loss value diminished to 0.084. Due to the inclusion of Focal Loss and Dice Loss in the proposed method, the overall loss values during training may be larger compared to Deeplabv3+, U-Net, and PSPNet. This phenomenon arises due to the fact that Focal Loss and Dice Loss, when employed to address intricately segmented boundary regions and diminutive targets, steer the model’s attention toward these challenging samples, consequently augmenting the magnitude of the loss function. However, they still remain significantly lower than Deeplabv3+. After 100 training epochs, each model tends to stabilize and converge in the later stages of training.

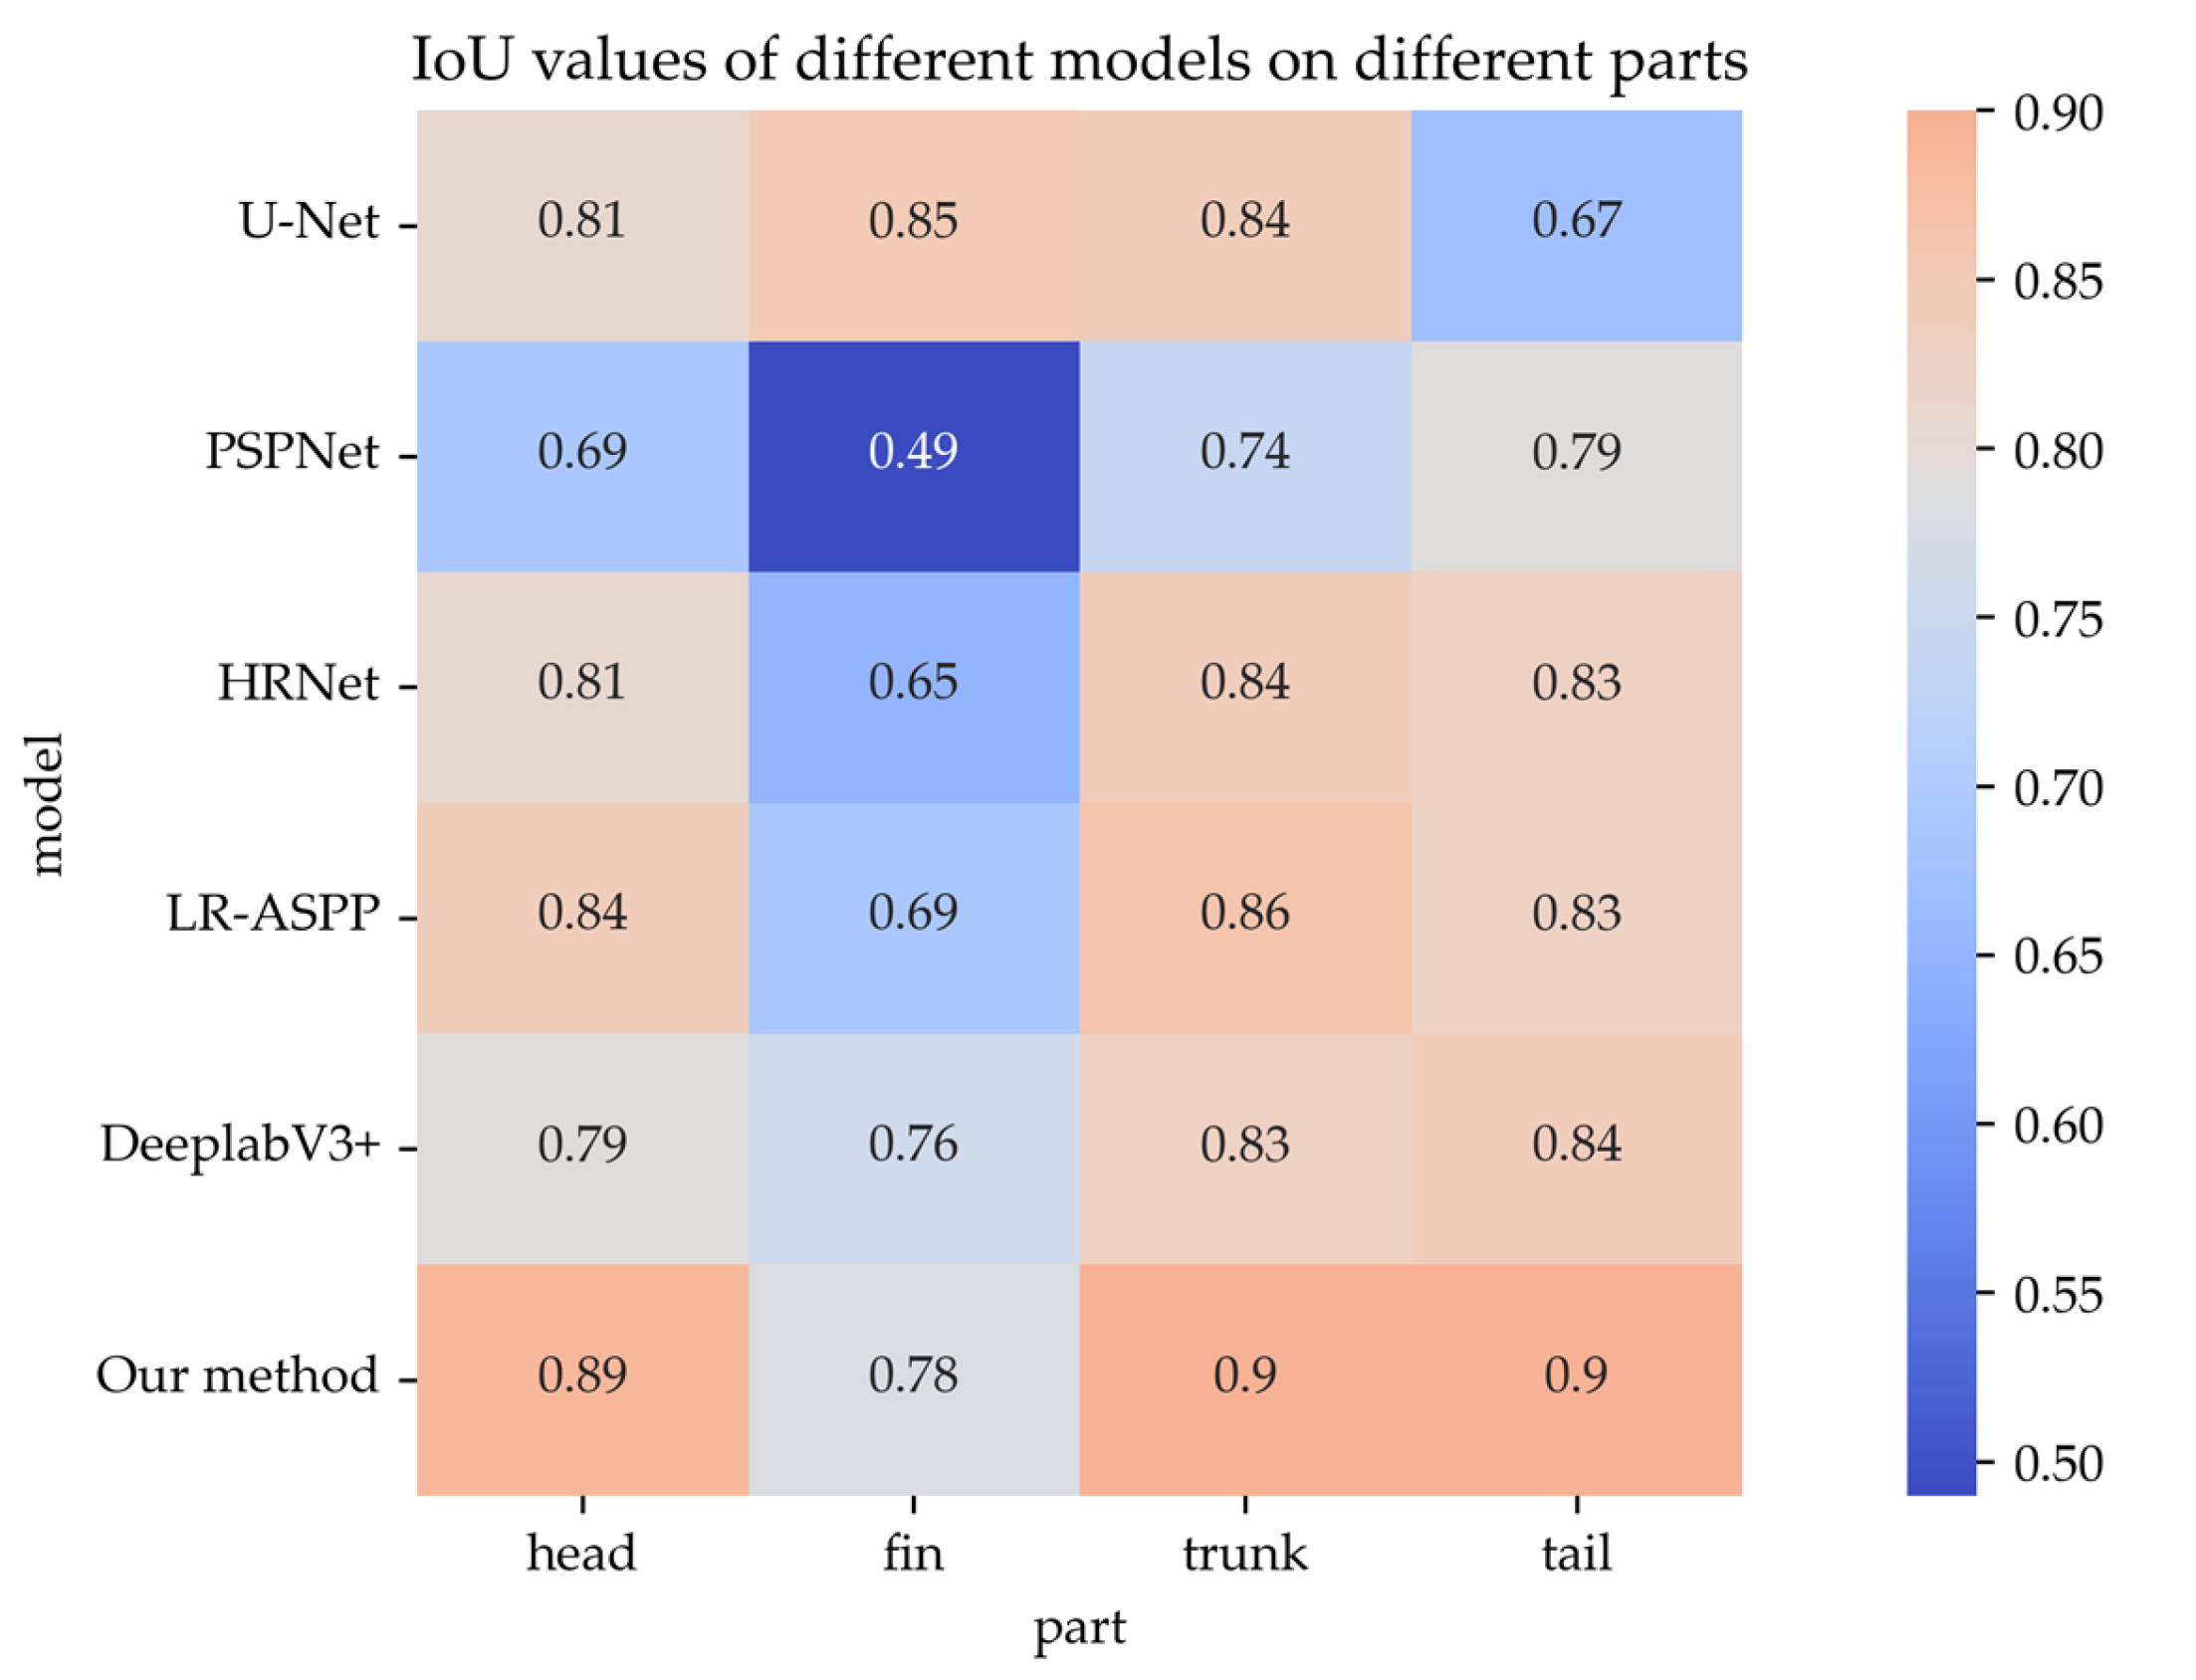
3.5. Comparative Analysis of Splitting Performance

In Table 1 and Table 2, the performance of the proposed models is compared with several existing semantic segmentation models. Overall, these networks exhibit good recognition of the background but show relatively poor recognition results for fish fins and fish heads.
The improved Deeplabv3+ network, due to the fusion of two attention mechanisms, shows significant improvements in IoU values for heads, fins, tails, and the trunk compared to the original network, with increases of 9.78%, 2.27%, 6.58%, and 6.07%, respectively. The improved Deeplabv3+ network demonstrates an increase of 3.23% in mIoU, 1.96% in mPA, and 4.74% in mRecall on the tilapia part segmentation dataset compared to the original network. Compared to other models, the improved model is able to handle boundaries and small target regions better due to the fusion of the two attentions and the inclusion of Focal loss and Dice loss. These findings also show that the improved network is more advanced and superior.
In Table 3, we conducted an extensive investigation into the performance of diverse backbone networks in tilapia anatomical segmentation. Furthermore, a novel enhancement approach was introduced. ResNet-50, MobileNetv3, Swin Transformer, Xception, and our approach (Xception + CBAM + SENet) were selected for the experiments. This selection aimed to comprehensively understand their performance contrast for this specific task. The experimental findings elucidate noticeable performance disparities among distinct backbone networks. Remarkably, the model founded on Xception as the backbone network excelled significantly in mIoU and mPA values compared to ResNet-50, MobileNetv3, and Swin Transformer, confirming Xception’s exceptional proficiency in tilapia anatomical segmentation. Additionally, we enhanced the segmentation capability of the Deeplabv3+ model with Xception as its backbone network by incorporating two attention mechanisms, CBAM and SENet. In comparison, our approach achieved a substantial increase of 3.23% and 1.96% in mIoU and mPA values, respectively, compared to Xception. This significant improvement is attributed to the introduction of two attention mechanisms, CBAM and SENet, which allow the network to focus on crucial features essential for segmentation outcomes. Additionally, these mechanisms efficiently capture multi-scale features within images, thereby enhancing the model’s ability to effectively address intricate details in tilapia anatomical segmentation tasks.
In Figure 10, it can be observed that the Deeplabv3+ network based on the fusion of CBAM and SENet attention mechanisms successfully predicts the tilapia fish and achieves good prediction results for various body parts. Although the U-Net network achieves good results on the tilapia part segmentation dataset, it performs noticeably lower in predicting the tail compared to our proposed method. This is because the tilapia fish’s tail is black, and there is a small color difference between the tail fin and the background in the aquaculture environment, making it more challenging for the network to extract features accurately. In addition, in aquaculture environments, the segmentation of the caudal and fins of tilapia is interfered with by light refraction, water flow effects, and particulate matter in the water. These factors lead to unclear segmentation of the caudal and fins as well as bring challenges to the extraction of shape and texture information. In our method, we incorporate CBAM and SENet into Deeplabv3+, which greatly improves the network’s feature extraction capability and suppresses the influence of irrelevant background. Furthermore, our proposed method also improves the accuracy of fish fin segmentation, addressing the low segmentation accuracy of the Deeplabv3+ network in that area.
When delving into the study of tilapia fish part segmentation, our objective is to furnish robust support for future phenotypic measurements while enhancing the segmentation performance of the Deeplabv3+ model in experiments. Recognizing the significance of precisely delineating distinct organism components, we acknowledge the consequential impact on subsequent phenotypic measurements, given its potential to supply pivotal data for subsequent morphological analyses and investigations into biological behaviors.
In order to validate the enhanced segmentation performance of the modified Deeplabv3+ model in real-world settings, a range of scenarios was chosen to simulate fish within authentic environments. These scenarios encompass swimming at an angle, horizontal stillness, multiple fish presence, relative swimming, and fish occlusion. The outcomes are illustrated in Figure 11. The proposed method is compared with U-Net, PSPNet, HRNet [30], LR-ASPP [31], and Deeplabv3+ for evaluation. U-Net tends to lose some details in fish fin segmentation and may mistakenly identify water plants as part of the fish fins. PSPNet exhibits overly rough segmentation for small objects, resulting in incomplete boundary segmentation. It also lacks robustness in distinguishing fish body parts when dealing with multiple fish or fish occlusion. Although HRNet and LR-ASPP are able to capture multi-scale information, their global contextual information fusion is not as powerful as Deeplabv3+, and the prediction on the part dataset cannot fully take into account the effect of part morphology on segmentation. As a result, difficulties arise in the recognition of tilapia’s fin parts, and it is easy to segment incompletely. Deeplabv3+ can accurately segment the tilapia fish parts from the images, but compared to our proposed method, it still loses many details and exhibits issues such as missing fish fin segmentation and misclassification at the boundaries. The orange boxes in the figure indicate the details missed and misclassified by the Deeplabv3+ model during segmentation. Compared to our proposed method, the incorporation of CBAM considers the importance of pixels in different spatial positions and channels. It can focus on key features and spatial connections in the tilapia fish body parts, resulting in more complete and accurate feature extraction for fish parts and edge details. The introduction of SENet can help the model to better distinguish features in different parts of the body. For example, SENet can improve the model’s sensitivity to key features such as the black dorsal fin, which enhances the model’s ability to segment these important parts. At the same time, SENet can also suppress some irrelevant features in the segmentation process, reducing the possibility of wrong segmentation. Based on the aforementioned experimental findings, in our study, precise segmentation of body parts is not merely a technical matter but also a means to establish a more accurate and reliable foundational dataset for future phenotypic measurement research.

3.6. Ablation Experiments

To validate the rationality of the designed network, this study conducted ablation experiments to assess the impact of introducing different attention mechanisms on the segmentation accuracy of the model. The experimental results are shown in Table 4, where the checkmark (“✓”) indicates whether a particular module was used. Compared to the standard Deeplabv3+ model, the introduction of the SENet module improved mIoU and mPA by 0.62 and 0.23 percentage points, respectively. The introduction of the CBAM module increased mIoU and mPA by 0.65 and 0.1 percentage points, respectively. When SENet and CBAM were combined, the mIoU and mPA were improved by 3.23 and 1.96 percentage points, respectively, compared to the original model. These experimental results further demonstrate that the proposed method has good feature extraction capabilities and higher segmentation accuracy.

4. Conclusions

In this paper, we first analyzed the phenotypic characteristics and body parameters of tilapia and preliminarily concluded that there exists a close relationship between tilapia head circumference, chest circumference, and tail circumference and their own body weight and abdominal fat weight. Therefore, a tilapia part segmentation dataset was constructed for the first time, encompassing four distinct segments for each tilapia: the head, trunk, fins, and tail. To achieve accurate segmentation of tilapia body parts, a segmentation method based on improved Deeplabv3+ is proposed, which greatly addressed the issues of unclear boundary segmentation, multiple fish occlusions, and misclassification of small objects in complex backgrounds. In this method, we made improvements to both the encoder and decoder. In the encoder, we introduced the CBAM module to enhance the spatial relationship between different parts of tilapia after feature extraction and to make the target boundary information more complete. In the decoder, a SENet module was added to adaptively assign weights to different parts of the tilapia channel to improve the segmentation accuracy of the network. The experimental results demonstrated that, when tested on the tilapia part segmentation dataset, the IoU values for the background, head, fins, trunk, and tail were 99.09%, 88.83%, 77.97%, 89.66%, and 90.06%, respectively. Compared to Deeplabv3+, the model, with the addition of the dual-attention module, improved the mPA, mIoU, and mRecall values by 1.96, 3.23, and 4.54 percentage points, respectively. The proposed model achieved high accuracy in segmenting tilapia body parts and obtained clearer object boundaries. In the process of phenotypic measurement research, high-quality segmentation results are indispensable. Only through precise segmentation of different biological parts can we effectively delve into the intricate interplay between their morphology and functionality. Furthermore, the outcomes of accurate segmentation serve as an essential foundation for forthcoming phenotypic measurement endeavors.

Author Contributions

Conceptualization, G.F. and M.C.; methodology, H.W.; software, H.W.; validation, G.F., Z.L. and H.W.; formal analysis, G.F. and H.W.; resources, G.F.; data curation, G.F. and H.W.; writing—original draft preparation, G.F., H.W. and Z.L.; writing—review and editing, G.F., H.W. and Z.L.; supervision, Z.L. All authors have read and agreed to the published version of the manuscript.

Funding

This work was supported by the National Key Research and Development Program of China (2022YFD2400800) and JiangSu Modern Agricultural Industry Key Technology Innovation Planning, NO. CX (20) 2028.

Informed Consent Statement

Not applicable.

Data Availability Statement

Experimental data related to this paper can be requested from the authors by email if any researcher is in need of the dataset, email: gffeng@shou.edu.cn.

Acknowledgments

The authors are very grateful to Wang Yaohui of Nantong Longyang Aquatic Co. in Jiangsu Province, China, for providing us with the experimental data and the data collection site.

Conflicts of Interest

The authors declare no conflict of interest.

References

  1. Xie, X.; Zhai, X.; Chen, M.; Li, Q.; Huang, Y.; Zhao, L.; Wang, Q.; Lin, L. Effects of Frozen Storage on Texture, Chemical Quality Indices and Sensory Properties of Crisp Nile Tilapia Fillets. Aquac. Fish. 2023, 8, 626–633. [Google Scholar] [CrossRef]
  2. Khammi, A.; Kutako, M.; Sangwichien, C.; Nootong, K. Development and Evaluation of Compact Aquaculture System for the Application of Zero Water-Exchange Inland Aquacultures. Eng. J. 2015, 19, 15–27. [Google Scholar] [CrossRef]
  3. Konovalov, D.A.; Saleh, A.; Domingos, J.A.; White, R.D.; Jerry, D.R. Estimating Mass of Harvested Asian Seabass Lates Calcarifer from Images. World J. Eng. Technol. 2018, 6, 15–23. [Google Scholar] [CrossRef]
  4. Deng, Y.; Tan, H.; Tong, M.; Zhou, D.; Li, Y.; Zhu, M. An Automatic Recognition Method for Fish Species and Length Using an Underwater Stereo Vision System. Fishes 2022, 7, 326. [Google Scholar] [CrossRef]
  5. Azarmdel, H.; Mohtasebi, S.S.; Jafari, A.; Rosado Muñoz, A. Developing an Orientation and Cutting Point Determination Algorithm for a Trout Fish Processing System Using Machine Vision. Comput. Electron. Agric. 2019, 162, 613–629. [Google Scholar] [CrossRef]
  6. Li, Y.; Huang, K.; Xiang, J. Measurement of Dynamic Fish Dimension Based on Stereoscopic Vision. Trans. CSAE 2020, 36, 220–226. [Google Scholar]
  7. Yu, C.; Fan, X.; Hu, Z.; Xia, X.; Zhao, Y.; Li, R.; Bai, Y. Segmentation and Measurement Scheme for Fish Morphological Features Based on Mask R-CNN. Inf. Process. Agric. 2020, 7, 523–534. [Google Scholar] [CrossRef]
  8. Garcia, R.; Prados, R.; Quintana, J.; Tempelaar, A.; Gracias, N.; Rosen, S.; Vågstøl, H.; Løvall, K. Automatic Segmentation of Fish Using Deep Learning with Application to Fish Size Measurement. ICES J. Mar. Sci. 2020, 77, 1354–1366. [Google Scholar] [CrossRef]
  9. Yu, X.; Wang, Y.; Liu, J.; Wang, J.; An, D.; Wei, Y. Non-Contact Weight Estimation System for Fish Based on Instance Segmentation. Expert Syst. Appl. 2022, 210, 118403. [Google Scholar] [CrossRef]
  10. Liu, B.; Wang, K.; Li, X.; Hu, C. Motion Posture Parsing of Chiloscyllium Plagiosum Fish Body Based on Semantic Part Segmentation. Trans. CSAE 2021, 37, 179–187. [Google Scholar]
  11. Long, J.; Shelhamer, E.; Darrell, T. Fully Convolutional Networks for Semantic Segmentation. In Proceedings of the IEEE Conference on Computer Vision and Pattern Recognition (CVPR), Boston, MA, USA, 7–12 June 2015; pp. 3431–3440. [Google Scholar]
  12. Badrinarayanan, V.; Kendall, A.; Cipolla, R. SegNet: A Deep Convolutional Encoder-Decoder Architecture for Image Segmentation. IEEE Trans. Pattern Anal. Mach. Intell. 2017, 39, 2481–2495. [Google Scholar] [CrossRef] [PubMed]
  13. Liu, F.; Fang, M. Semantic Segmentation of Underwater Images Based on Improved Deeplab. J. Mar. Sci. Eng. 2020, 8, 188. [Google Scholar] [CrossRef]
  14. Zeng, H.; Peng, S.; Li, D. Deeplabv3+ Semantic Segmentation Model Based on Feature Cross Attention Mechanism. J. Phys. Conf. Ser. 2020, 1678, 012106. [Google Scholar] [CrossRef]
  15. Peng, H.; Xue, C.; Shao, Y.; Chen, K.; Xiong, J.; Xie, Z.; Zhang, L. Semantic Segmentation of Litchi Branches Using DeepLabV3+ Model. IEEE Access 2020, 8, 164546–164555. [Google Scholar] [CrossRef]
  16. Atik, S.O.; Atik, M.E.; Ipbuker, C. Comparative research on different backbone architectures of DeepLabV3+ for building segmentation. J. Appl. Remote Sens. 2022, 16, 024510. [Google Scholar] [CrossRef]
  17. Woo, S.; Park, J.; Lee, J.-Y.; Kweon, I.S. CBAM: Convolutional Block Attention Module. In Proceedings of the European Conference on Computer Vision (ECCV), Munich, Germany, 8–14 September 2018; pp. 3–19. [Google Scholar]
  18. Hu, J.; Shen, L.; Sun, G. Squeeze-and-Excitation Networks. In Proceedings of the IEEE Conference on Computer Vision and Pattern Recognition, Salt Lake City, UT, USA, 18–23 June 2018; pp. 7132–7141. [Google Scholar]
  19. Ronneberger, O.; Fischer, P.; Brox, T. U-Net: Convolutional Networks for Biomedical Image Segmentation. In Medical Image Computing and Computer-Assisted Intervention—MICCAI 2015; Navab, N., Hornegger, J., Wells, W.M., Frangi, A.F., Eds.; Lecture Notes in Computer Science; Springer International Publishing: Cham, Switzerland, 2015; Volume 9351, pp. 234–241. ISBN 978-3-319-24573-7. [Google Scholar]
  20. Zhao, H.; Shi, J.; Qi, X.; Wang, X.; Jia, J. Pyramid Scene Parsing Network. In Proceedings of the IEEE Conference on Computer Vision and Pattern Recognition, Honolulu, HI, USA, 21–26 July 2017; pp. 2881–2890. [Google Scholar]
  21. Qian, Y.-C.; Wang, X.; Ren, J.; Wang, J.; Limbu, S.M.; Li, R.-X.; Zhou, W.-H.; Qiao, F.; Zhang, M.-L.; Du, Z.-Y. Different Effects of Two Dietary Levels of Tea Polyphenols on the Lipid Deposition, Immunity and Antioxidant Capacity of Juvenile GIFT Tilapia (Oreochromis Niloticus) Fed a High-Fat Diet. Aquaculture 2021, 542, 736896. [Google Scholar] [CrossRef]
  22. Fernandes, A.F.A.; Turra, E.M.; De Alvarenga, É.R.; Passafaro, T.L.; Lopes, F.B.; Alves, G.F.O.; Singh, V.; Rosa, G.J.M. Deep Learning Image Segmentation for Extraction of Fish Body Measurements and Prediction of Body Weight and Carcass Traits in Nile Tilapia. Comput. Electron. Agric. 2020, 170, 105274. [Google Scholar] [CrossRef]
  23. Zhu, J.; Shen, X.; Zhou, Y.; Tan, Y.; Gan, X. Growth Performance Evaluation and Correlation Analysis on Phenotypic Traits of GIFT Tilapia. J. Northwest A F Univ. Nat. Sci. Ed. 2014, 42, 24–28. [Google Scholar]
  24. Chen, L.-C.; Papandreou, G.; Kokkinos, I.; Murphy, K.; Yuille, A.L. DeepLab: Semantic Image Segmentation with Deep Convolutional Nets, Atrous Convolution, and Fully Connected CRFs. IEEE Trans. Pattern Anal. Mach. Intell. 2018, 40, 834–848. [Google Scholar] [CrossRef]
  25. Chen, L.-C.; Papandreou, G.; Schroff, F.; Adam, H. Rethinking Atrous Convolution for Semantic Image Segmentation. arXiv 2017, arXiv:1706.05587. [Google Scholar]
  26. Chollet, F. Xception: Deep Learning with Depthwise Separable Convolutions. In Proceedings of the IEEE Conference on Computer Vision and Pattern Recognition, Honolulu, HI, USA, 21–26 July 2017; pp. 1251–1258. [Google Scholar]
  27. He, K.; Zhang, X.; Ren, S.; Sun, J. Spatial Pyramid Pooling in Deep Convolutional Networks for Visual Recognition. IEEE Trans. Pattern Anal. Mach. Intell. 2015, 37, 1904–1916. [Google Scholar] [CrossRef] [PubMed]
  28. Lin, T.-Y.; Goyal, P.; Girshick, R.; He, K.; Dollar, P. Focal Loss for Dense Object Detection. In Proceedings of the IEEE International Conference on Computer Vision, Venice, Italy, 22–29 October 2017; pp. 2980–2988. [Google Scholar]
  29. Li, X.; Sun, X.; Meng, Y.; Liang, J.; Wu, F.; Li, J. Dice Loss for Data-Imbalanced NLP Tasks. arXiv 2019, arXiv:1911.02855. [Google Scholar]
  30. Sun, K.; Xiao, B.; Liu, D.; Wang, J. Deep High-Resolution Representation Learning for Human Pose Estimation. In Proceedings of the IEEE/CVF Conference on Computer Vision and Pattern Recognition, Long Beach, CA, USA, 16–17 June 2019. [Google Scholar] [CrossRef]
  31. Howard, A.; Sandler, M.; Chu, G.; Chen, L.-C.; Chen, B.; Tan, M.; Wang, W.; Zhu, Y.; Pang, R.; Vasudevan, V.; et al. Searching for MobileNetV3. In Proceedings of the IEEE/CVF International Conference on Computer Vision, Seoul, Republic of Korea, 27 October–2 November 2019. [Google Scholar]
Figure 1. Tilapia image acquisition device.
Applsci 13 09635 g001
Figure 2. Tilapia part segmentation dataset images.
Applsci 13 09635 g002
Figure 3. Relationship of tilapia part size to body weight and belly fat weight. (a) Head circumference in relation to body weight and belly fat weight; (b) Chest circumference in relation to body weight and abdominal fat weight relationship; (c) Tail circumference in relation to body weight and abdominal fat weight.
Applsci 13 09635 g003
Figure 4. Visualization of semantic segmentation part label of tilapia.
Applsci 13 09635 g004
Figure 5. Semantic segmentation steps for tilapia parts.
Applsci 13 09635 g005
Figure 6. Improved Deeplabv3+ network structure diagram.
Applsci 13 09635 g006
Figure 7. CBAM module structure.
Applsci 13 09635 g007
Figure 8. SENet module structure.
Applsci 13 09635 g008
Figure 9. Comparison of training loss curves of network models.
Applsci 13 09635 g009
Figure 10. Comparison of network model IoU values.
Applsci 13 09635 g010
Figure 11. Comparison of different segmentation models. (a) Tilt; (b) Horizontal; (c) Multi-fish; (d) Swimming in opposite directions; (e) Partial occlusion of fish.
Applsci 13 09635 g011
Table 1. IoU comparison results of semantic segmentation network on tilapia part dataset.
ModelIoU (%)
BackgroundHeadFinTrunkTail
PSPNet98.1468.8949.2679.1974.45
U-Net98.9080.6784.7065.6383.65
HRNet98.9881.0465.2784.1282.77
LR-ASPP98.8284.0069.3786.3983.39
Deeplabv3+99.1879.0575.7083.5983.48
Our method99.0988.8377.9789.6690.06
Table 2. Comparison of results between semantic segmentation networks.
ModelmIoU (%)mPA (%)mRecall (%)
PSPNet73.9983.8884.60
U-Net82.7190.3189.68
HRNet82.4489.8389.34
LR-ASPP84.3991.2391.22
Deeplabv3+88.4693.9889.67
Our method91.6995.9494.21
Table 3. Comparison of segmentation model using different feature extraction networks.
ModelmIoU (%)mPA (%)
Deeplabv3+ + ResNet-5067.5484.11
Deeplabv3+ + MobileNetv372.2686.07
Deeplabv3+ + Swin Transformer75.7184.99
Deeplabv3+ + Xception88.4693.98
Deeplabv3+ + Xception+ CBAM+ SENet91.6995.94
Table 4. mIoU and mPA values in different situations.
ModelSENetCBAMmIoU (%)mPA (%)
Deeplabv3+ 88.4693.98
89.0894.21
89.1194.08
91.6995.94
Disclaimer/Publisher’s Note: The statements, opinions and data contained in all publications are solely those of the individual author(s) and contributor(s) and not of MDPI and/or the editor(s). MDPI and/or the editor(s) disclaim responsibility for any injury to people or property resulting from any ideas, methods, instructions or products referred to in the content.

