
Indoor Clutter Object Removal Method for an As-Built Building Information Model Using a Two-Dimensional Projection Approach

Abstract
:1. Introduction
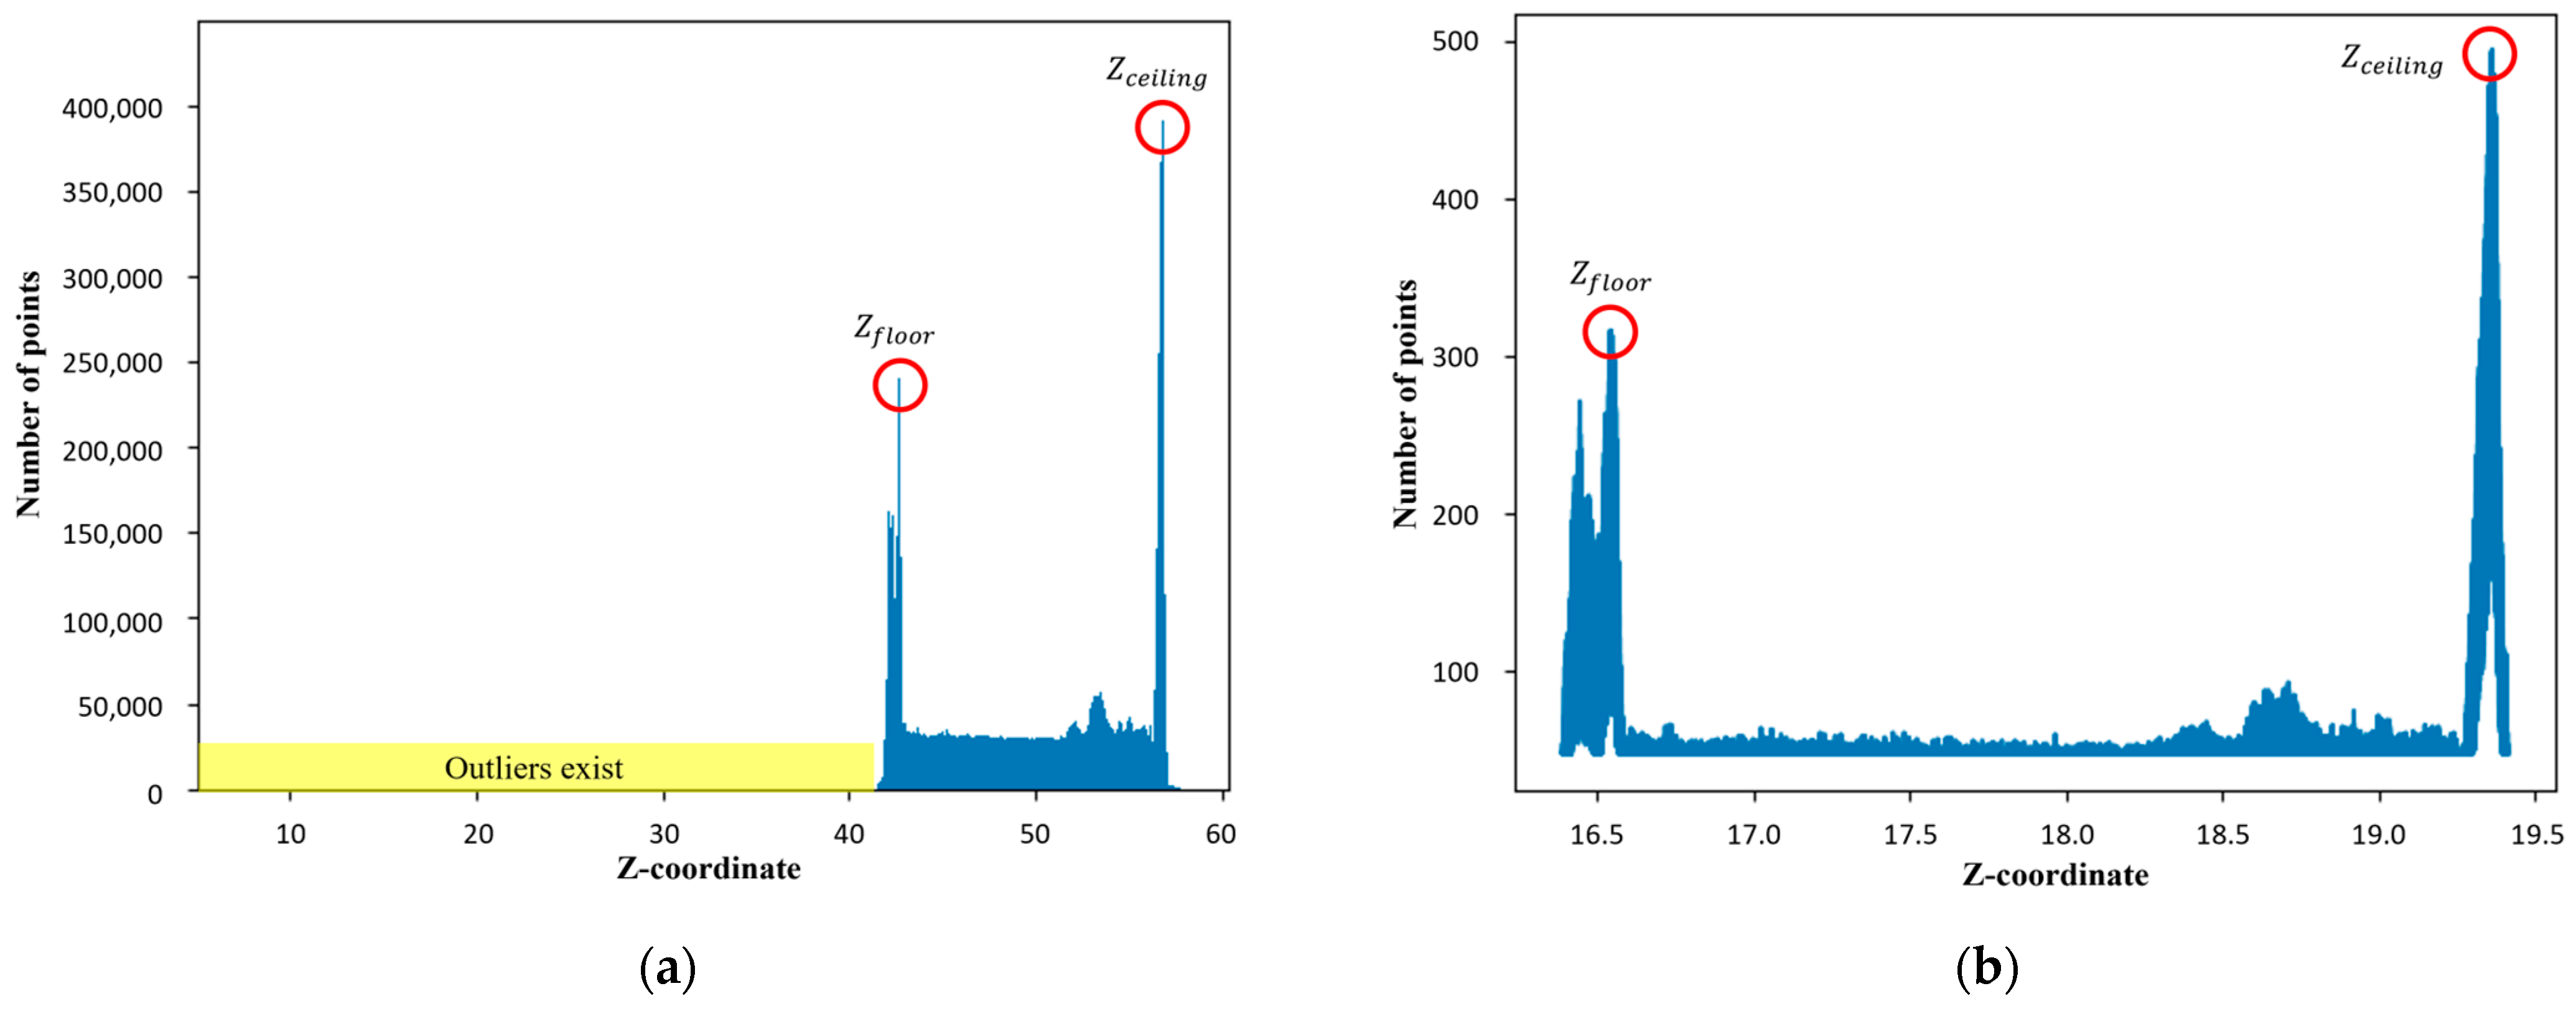
- Structural elements, such as columns and walls, are in contact with the floor and ceiling.
- Indoor clutter objects mainly exist on the floor and do not extend to the ceiling.
2. Literature Review
2.1. Line-Fitting-Based Method
2.2. Feature-Based Method
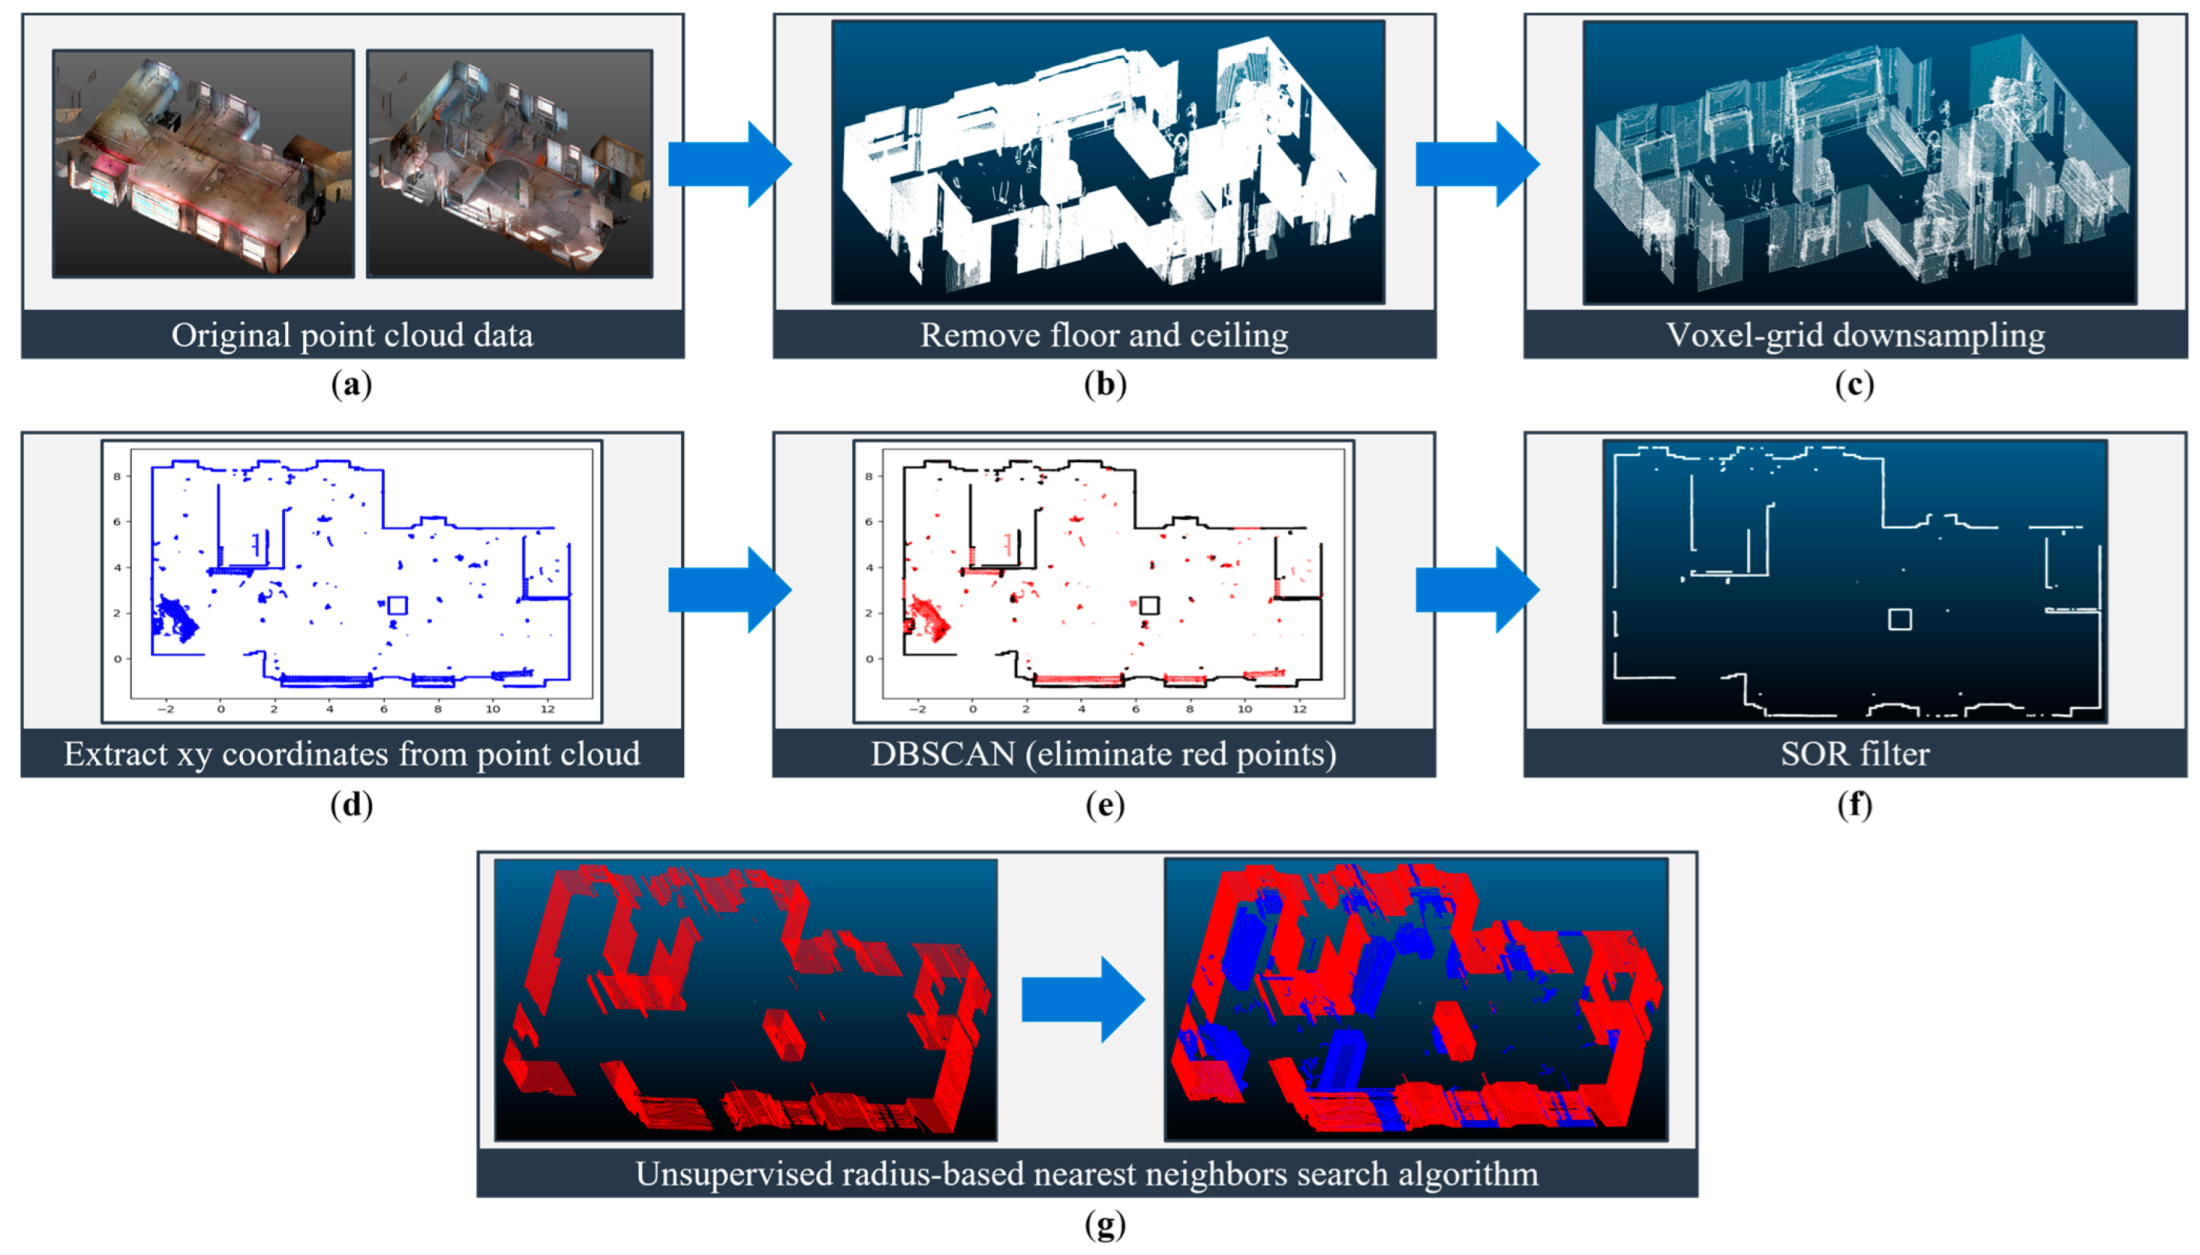
3. Methods
3.1. Method Overview and Assumptions
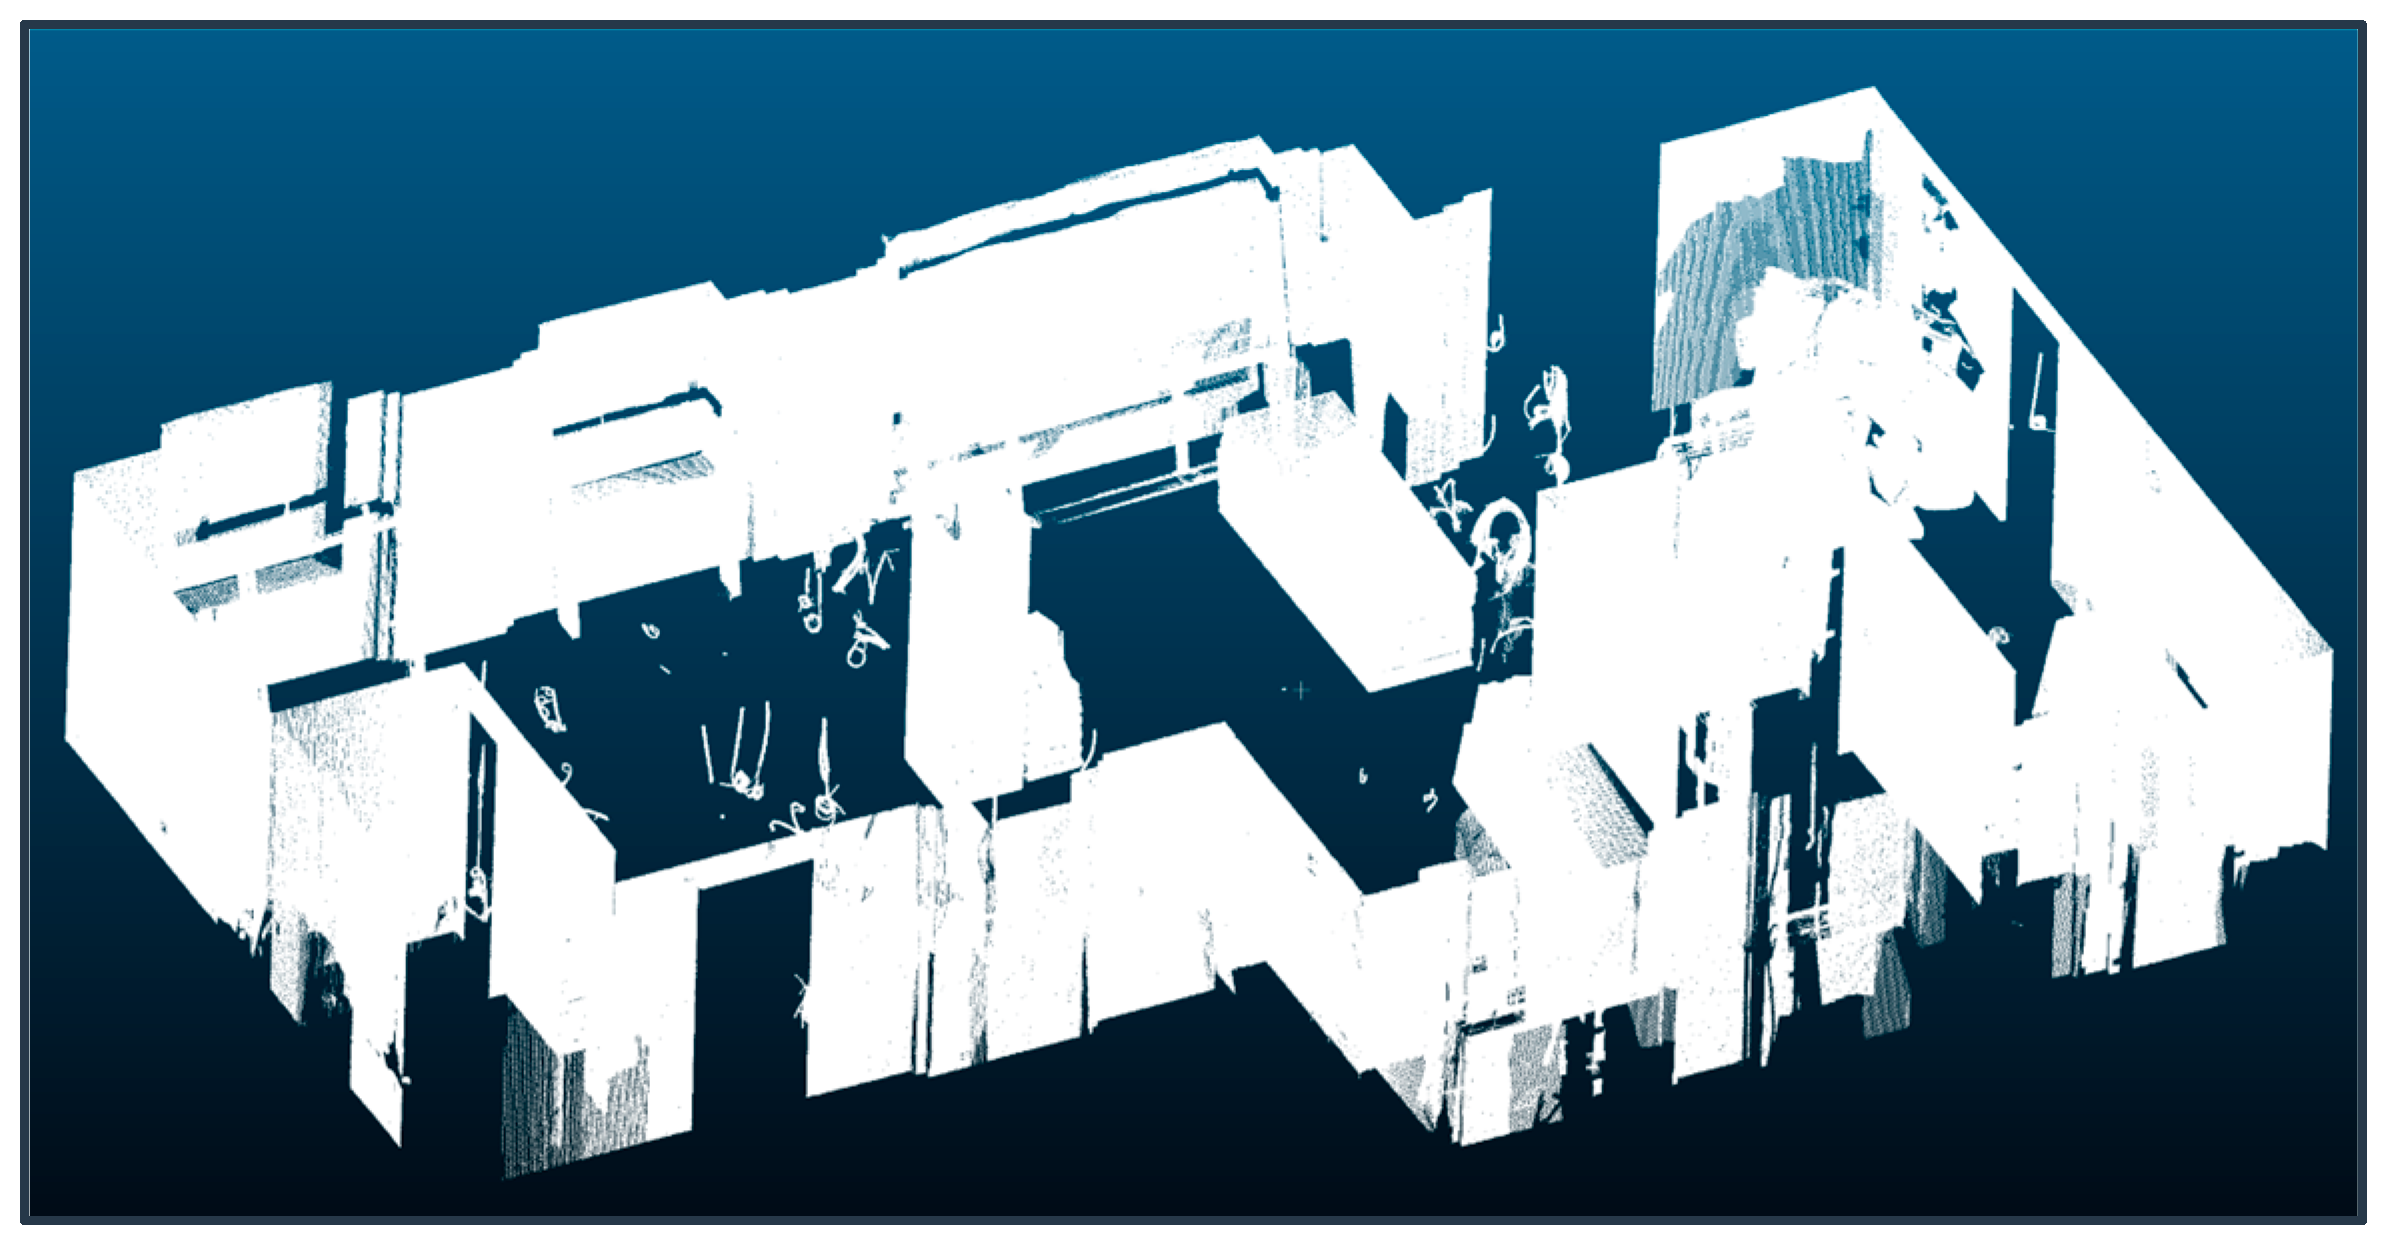
3.2. Removal of the Floor and Ceiling
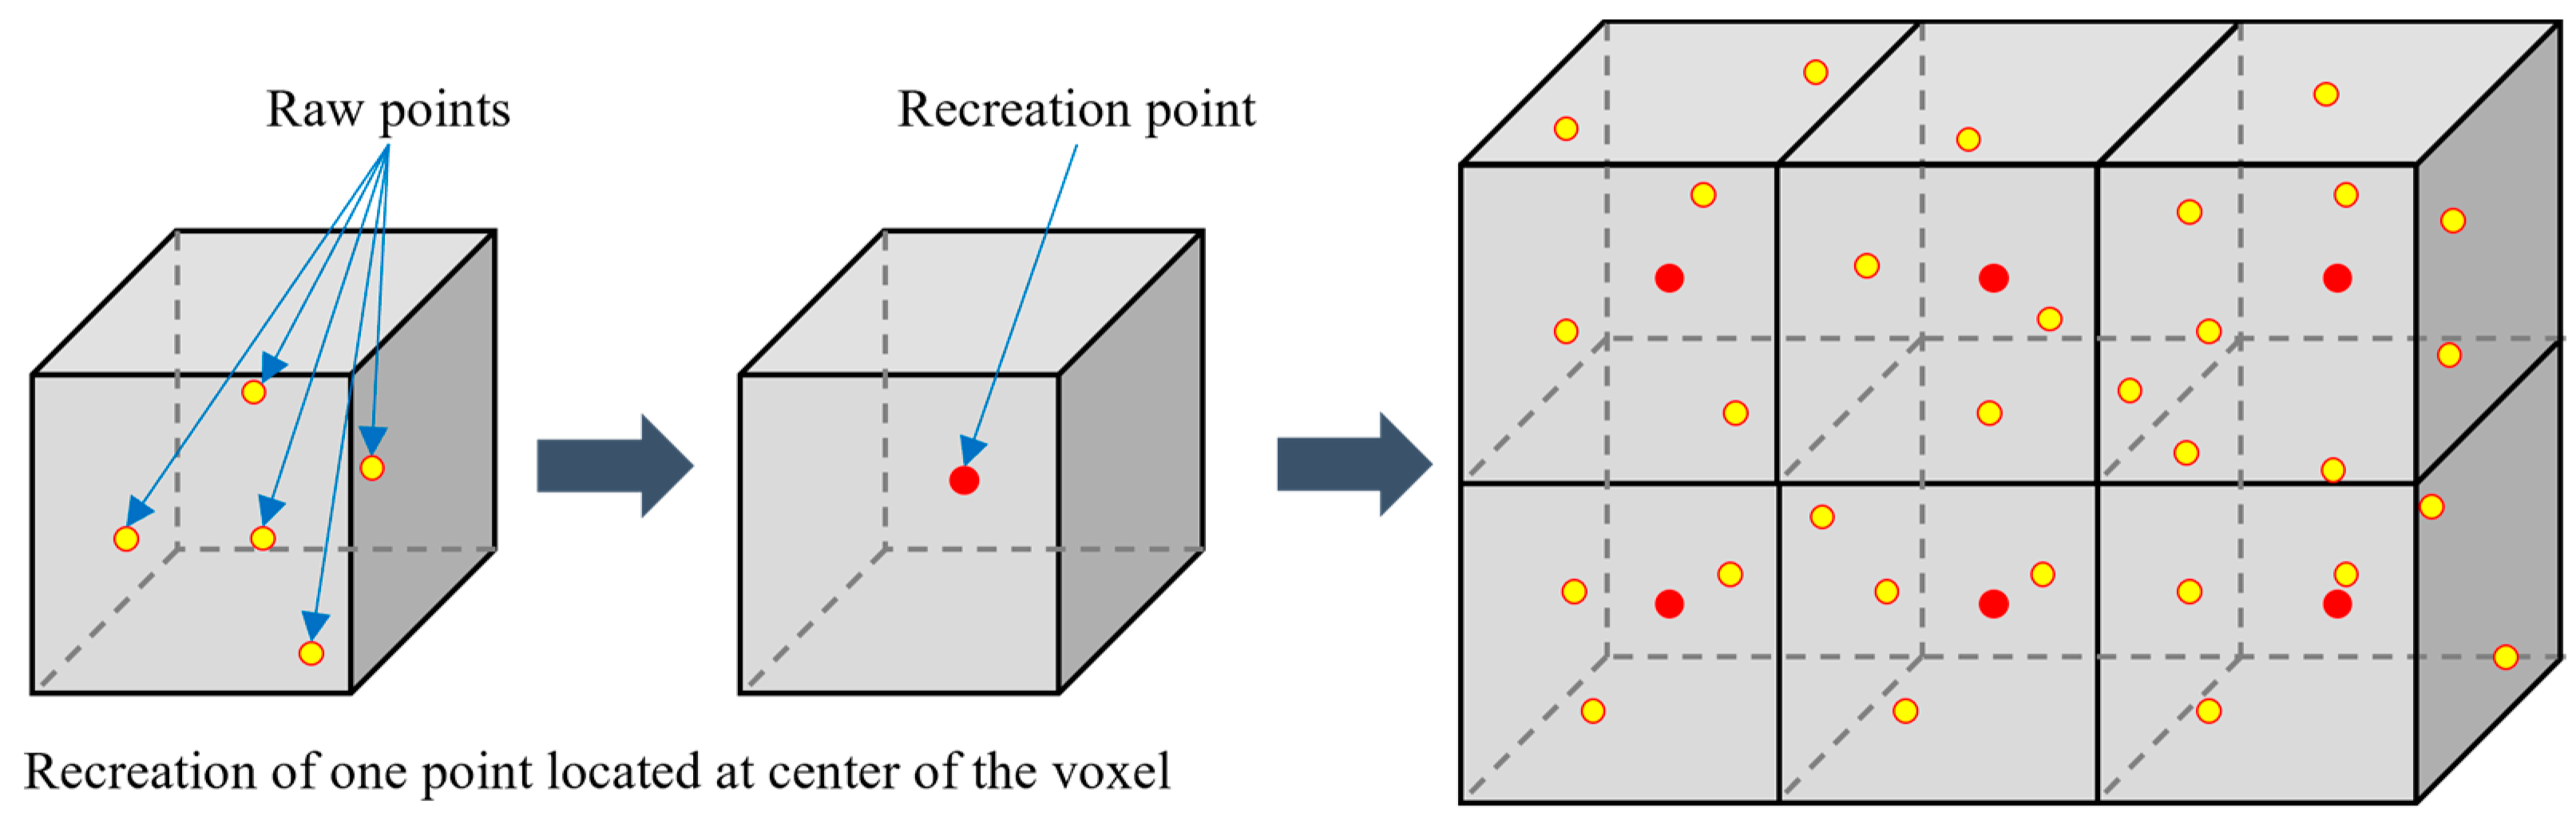
3.3. Voxel-Grid Downsampling
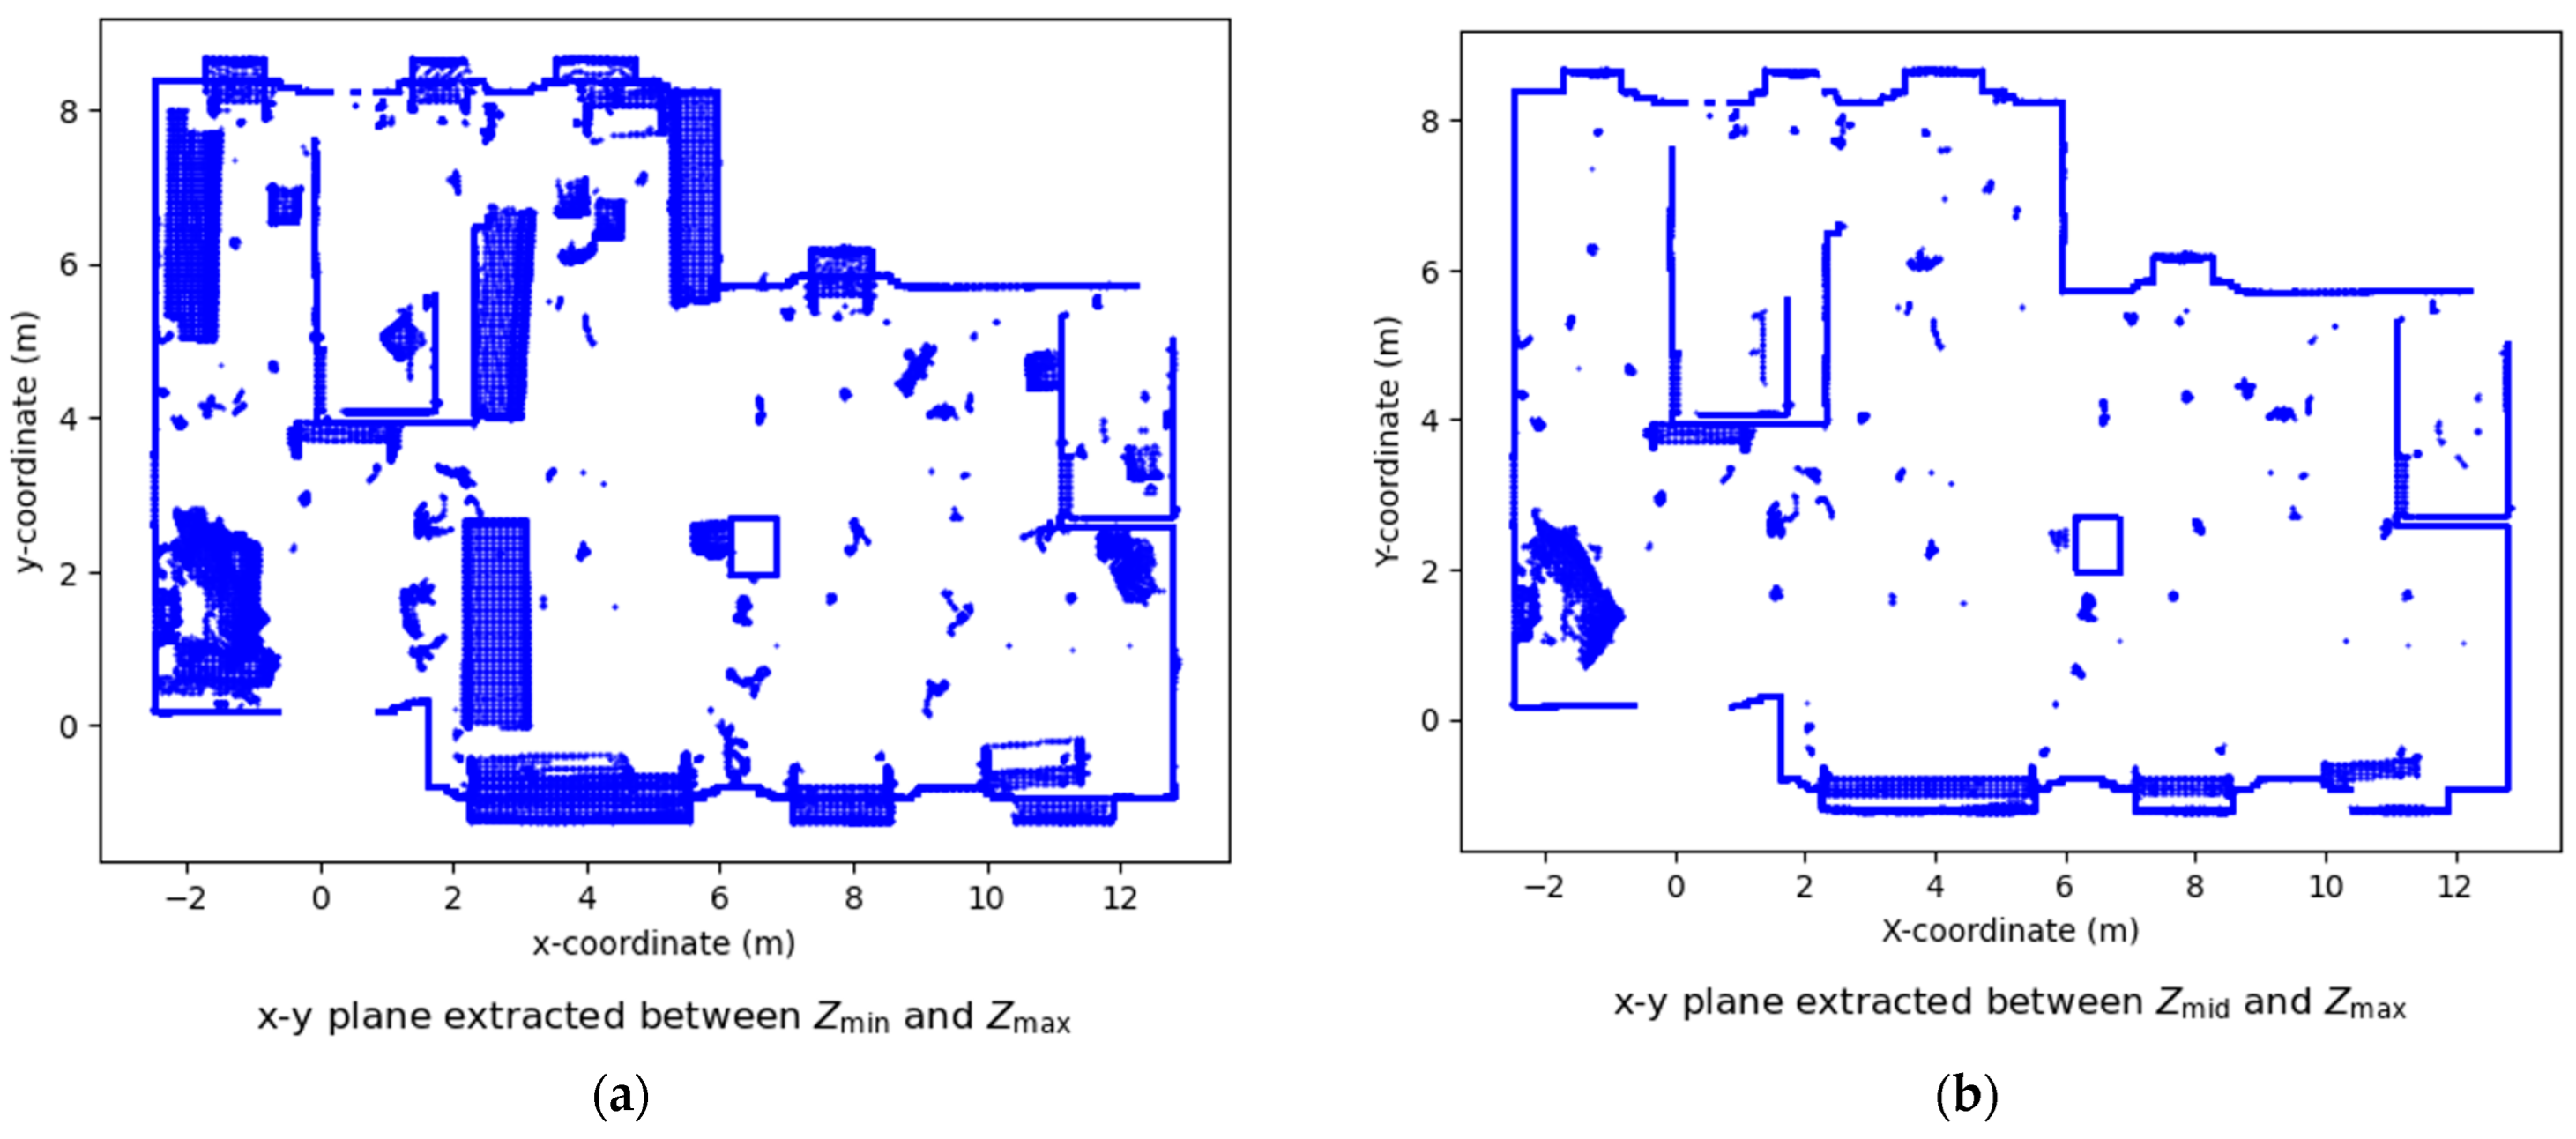
3.4. Extraction of XY Coordinates from the Point Cloud between and
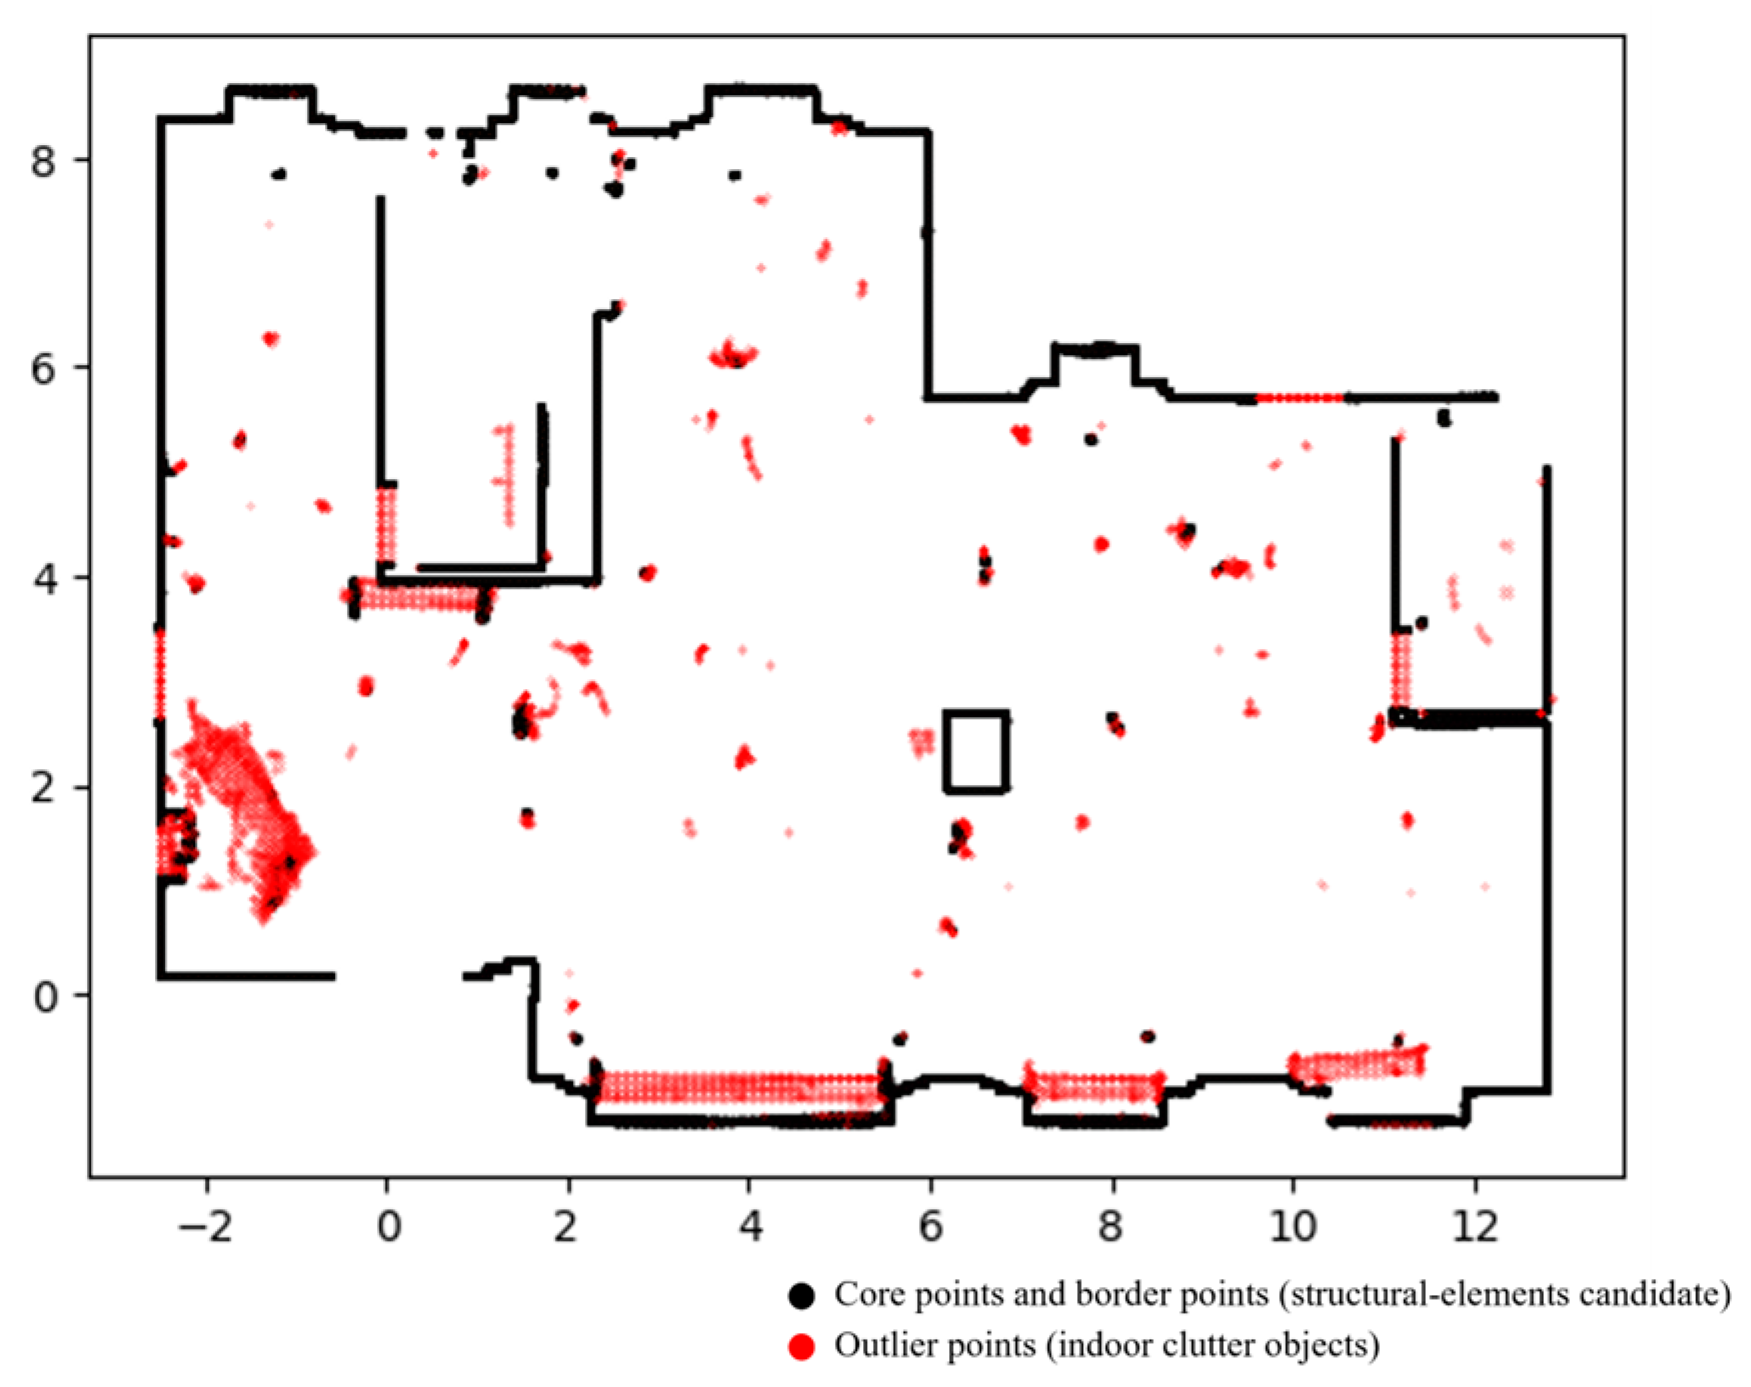
3.5. DBSCAN
3.6. SOR Filter
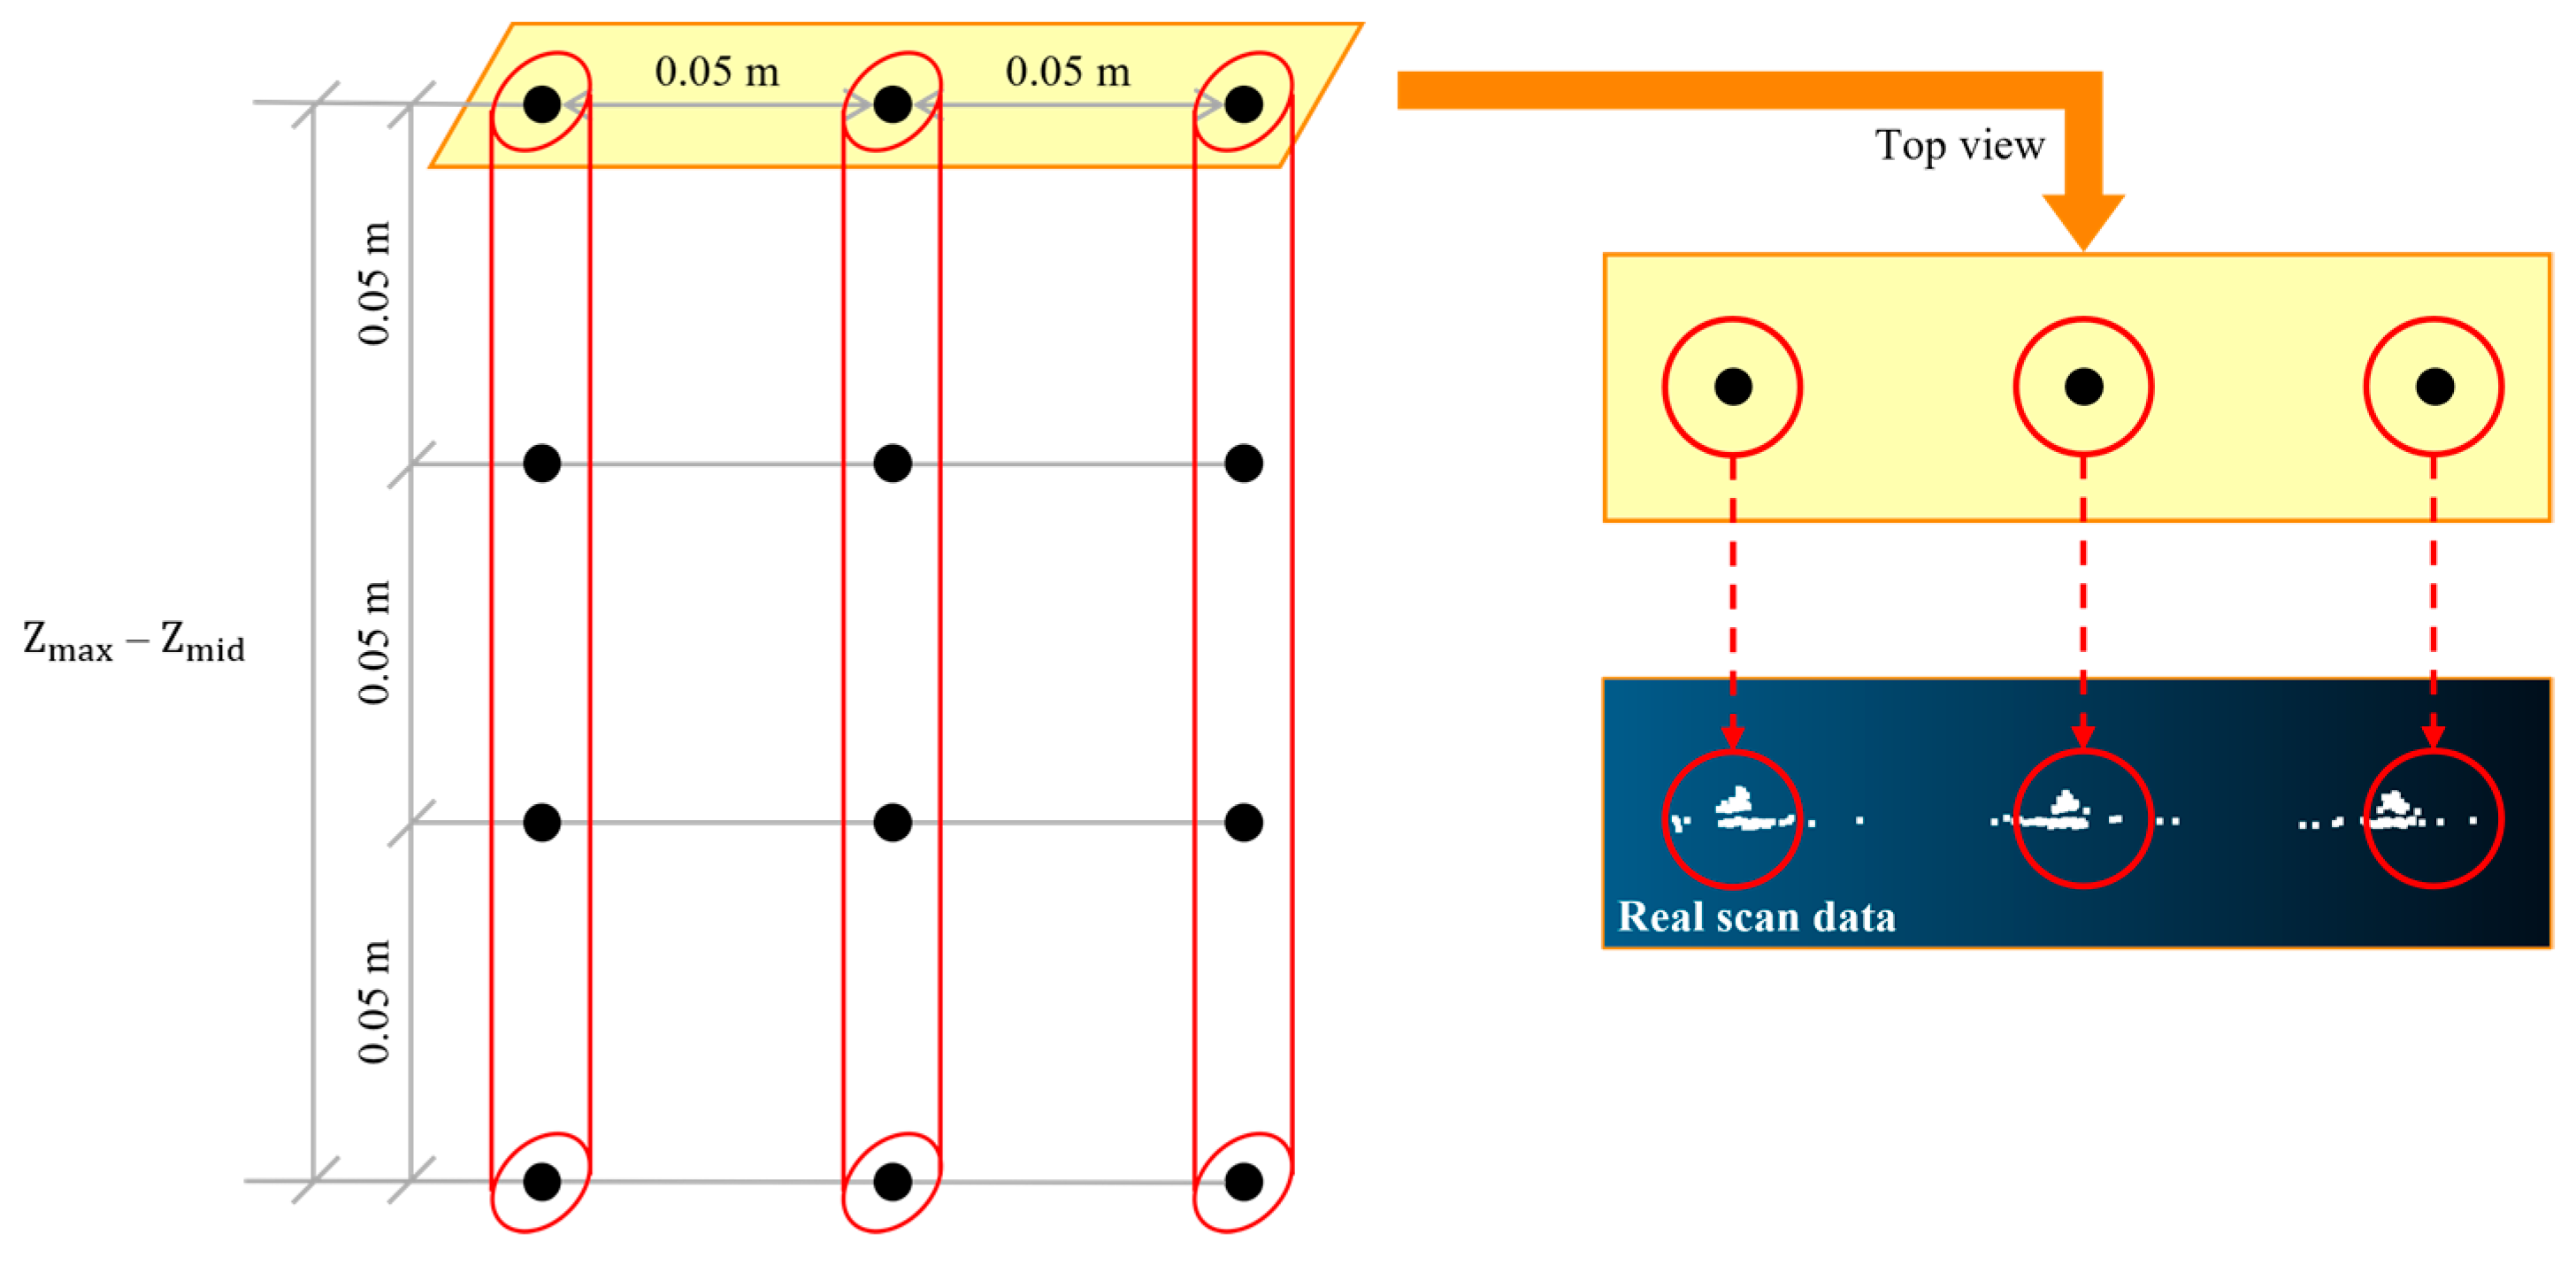
3.7. Unsupervised Radius-Based Nearest Neighbor Search Algorithm
4. Experiments
4.1. Experimental Data
4.2. Performance Evaluation and Metrics
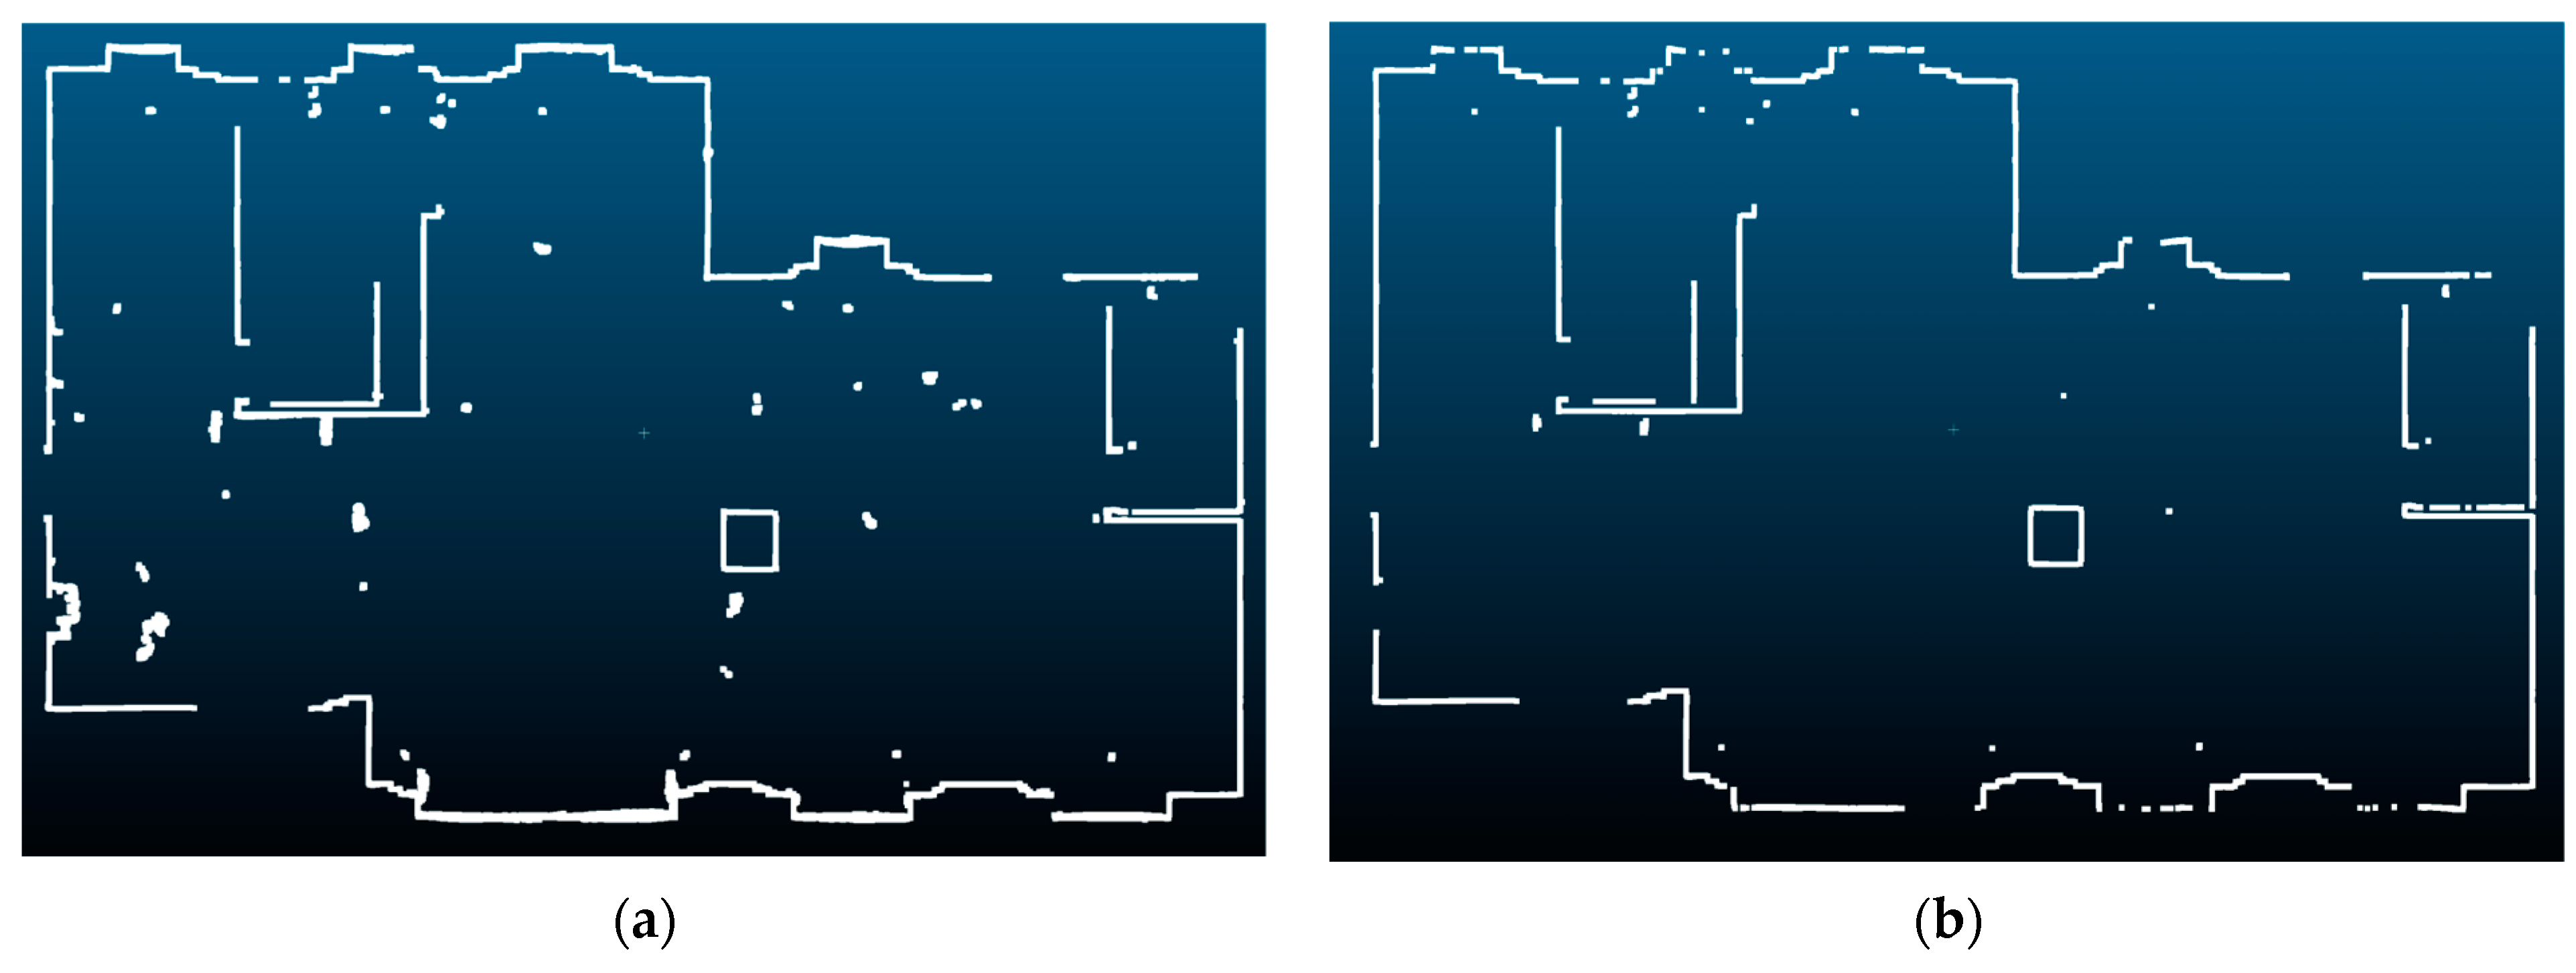
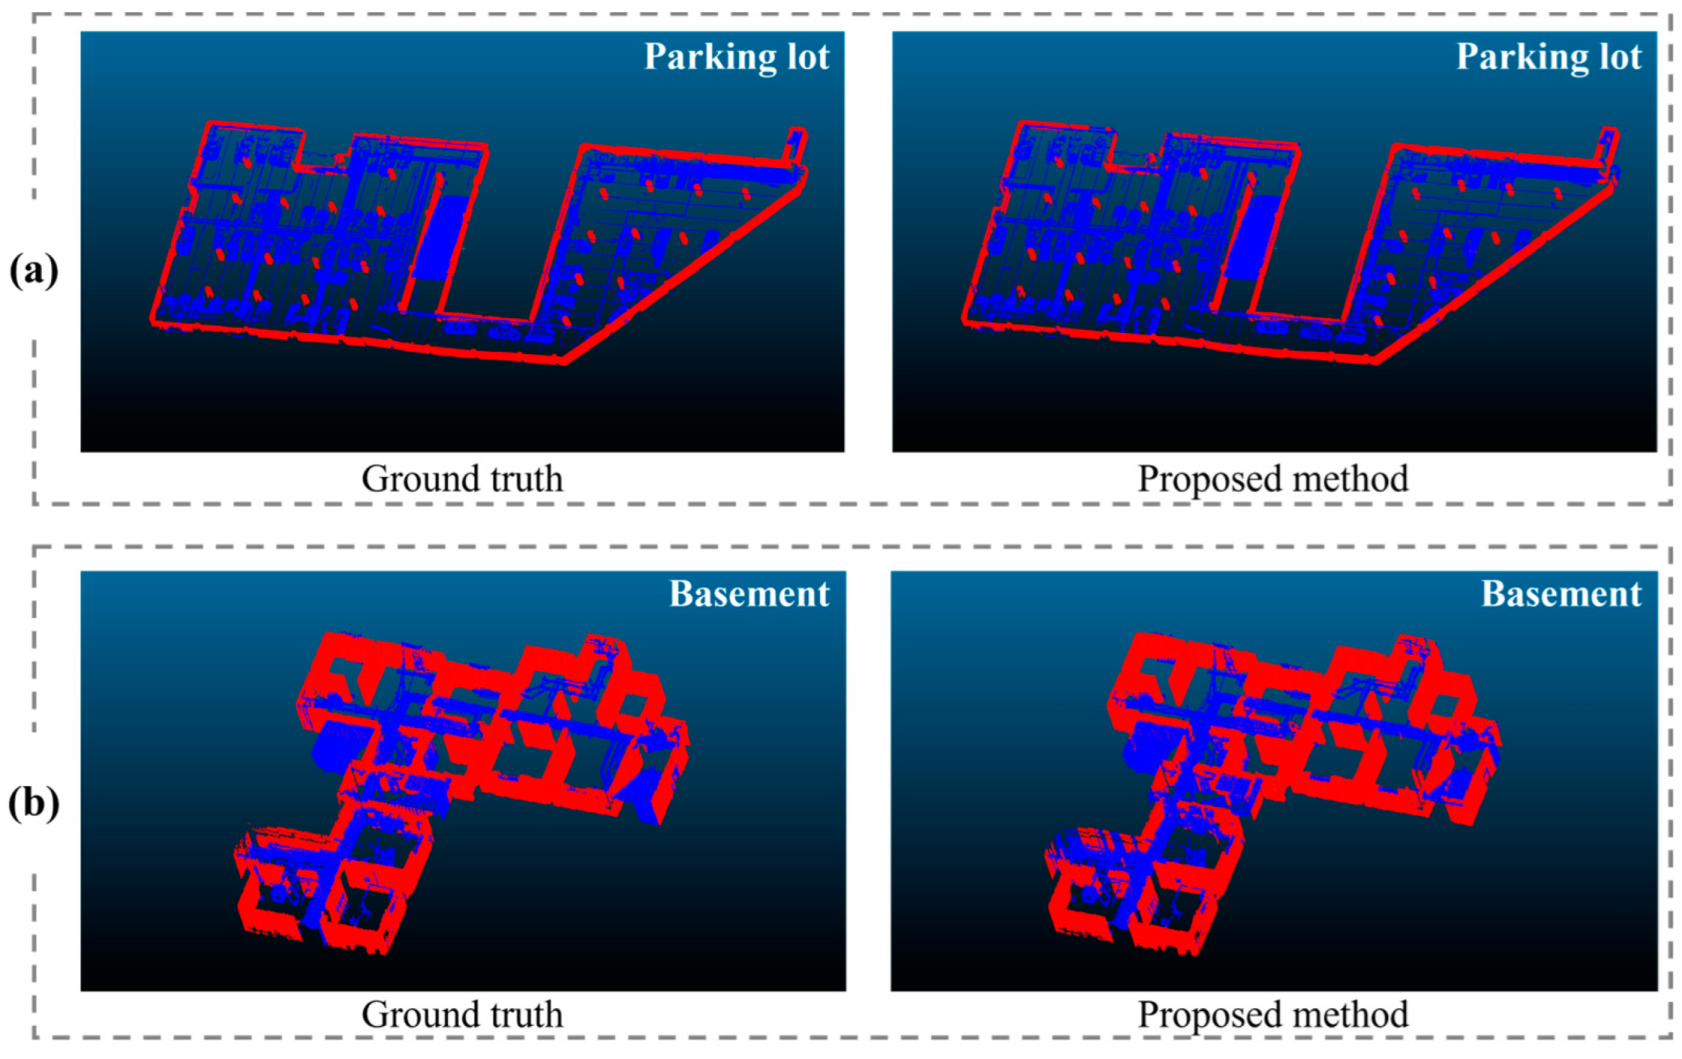
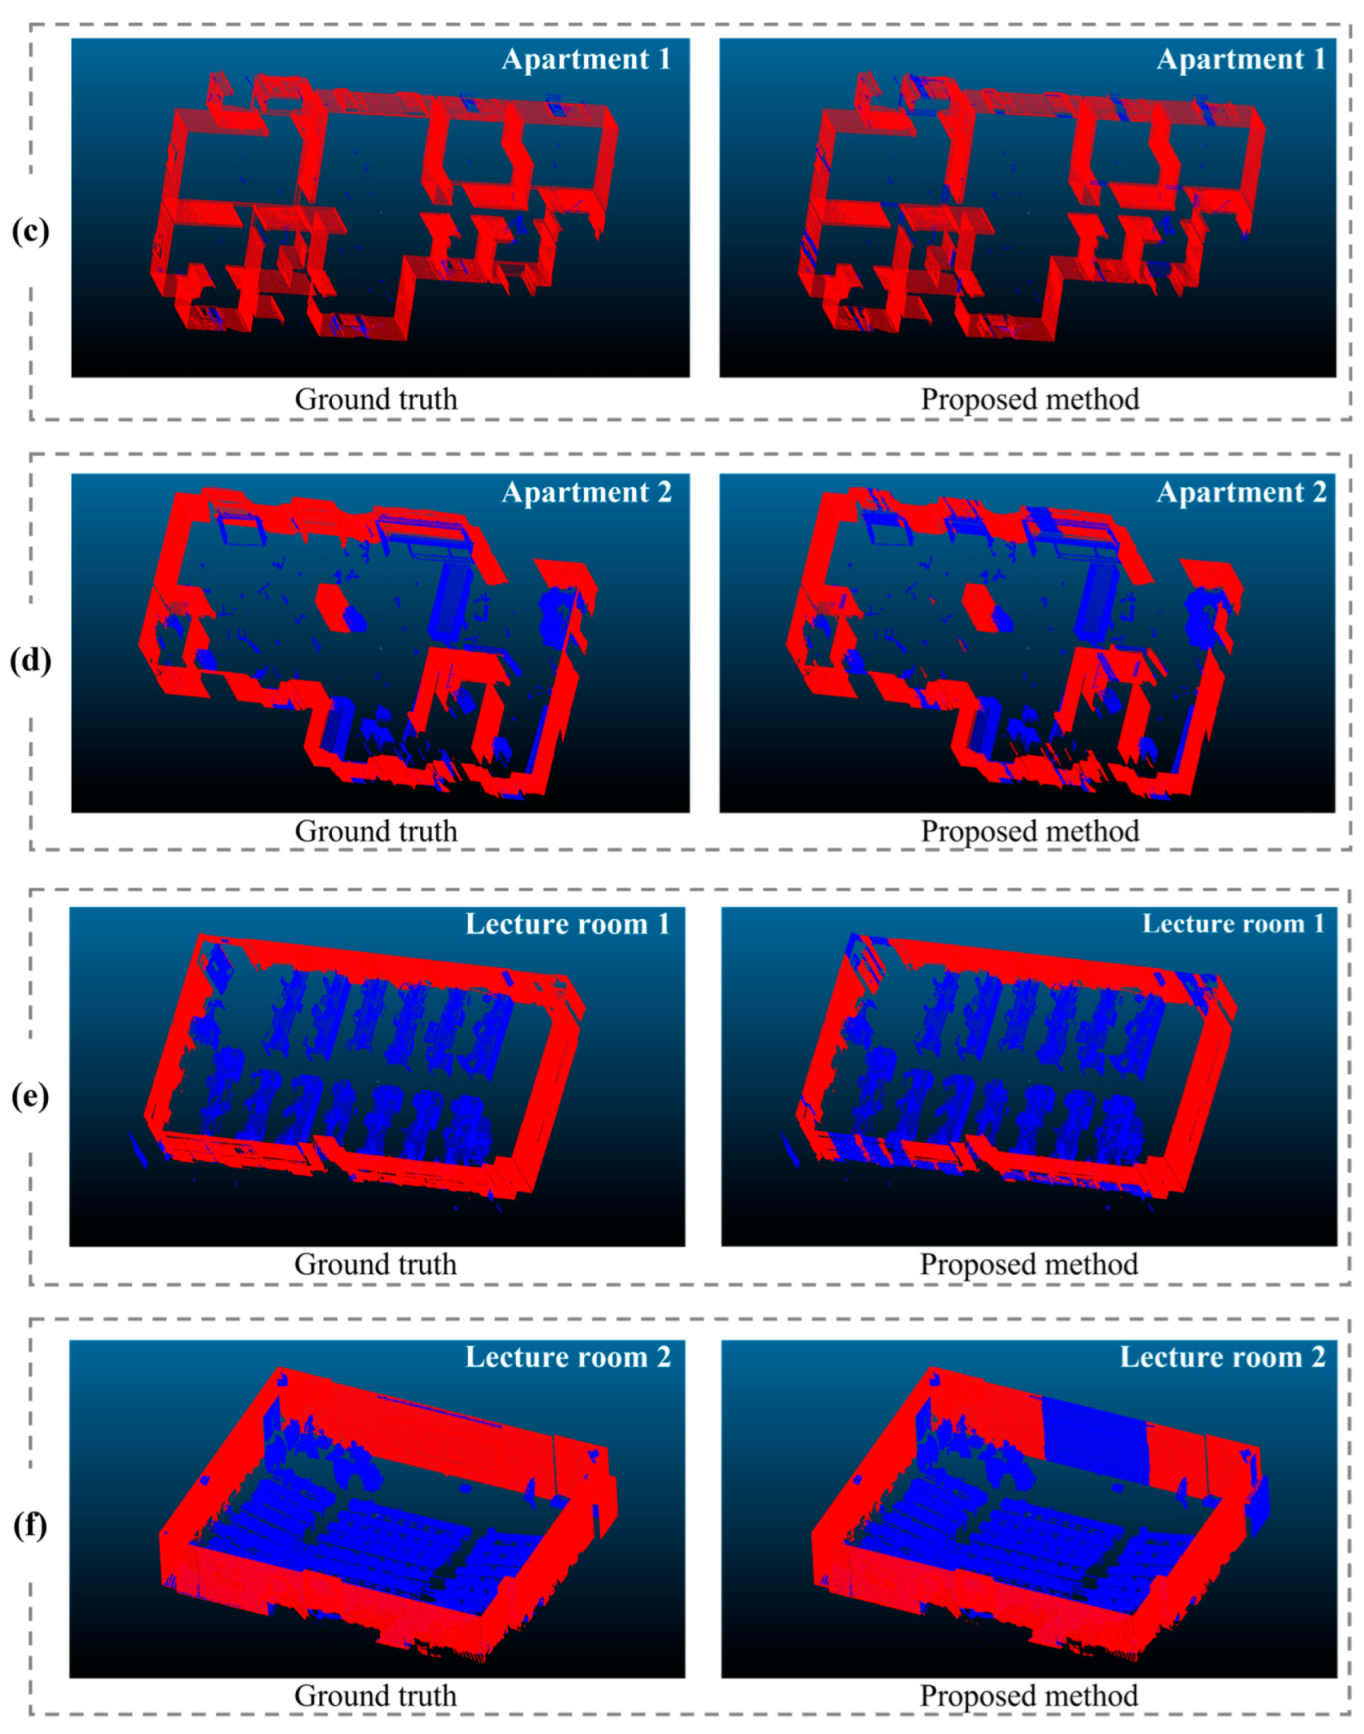
4.3. Experimental Results
4.4. Discussion
5. Conclusions
- The proposed method can accurately determine and remove indoor clutter objects with higher performance than commercial software;
- The proposed method can extract an appropriate x–y plane that represents structural elements, including inner walls and columns;
- The proposed method can identify indoor clutter objects among objects with similar geometrical features to structural elements;
- The parameters of DBSCAN, the SOR filter, and the unsupervised radius-based nearest neighbor search algorithm used in the proposed method are automatically determined by the voxel size.
Author Contributions
Funding
Institutional Review Board Statement
Informed Consent Statement
Data Availability Statement
Conflicts of Interest
References
- Volk, R.; Stengel, J.; Schultmann, F. Building Information Modeling (BIM) for Existing Buildings—Literature Review and Future Needs. Autom. Constr. 2014, 38, 109–127. [Google Scholar] [CrossRef]
- Park, J.; Kim, J.; Lee, D.; Jeong, K.; Lee, J.; Kim, H.; Hong, T. Deep Learning–Based Automation of Scan-to-BIM with Modeling Objects from Occluded Point Clouds. J. Manag. Eng. 2022, 38, 04022025. [Google Scholar] [CrossRef]
- Wang, T.; Chen, H.-M. Integration of Building Information Modeling and Project Management in Construction Project Life Cycle. Autom. Constr. 2023, 150, 104832. [Google Scholar] [CrossRef]
- Tang, P.; Huber, D.; Akinci, B.; Lipman, R.; Lytle, A. Automatic Reconstruction of As-Built Building Information Models from Laser-Scanned Point Clouds: A Review of Related Techniques. Autom. Constr. 2010, 19, 829–843. [Google Scholar] [CrossRef]
- Azhar, S.; Khalfan, M.; Maqsood, T. Building Information Modeling (BIM): Now and Beyond. Australas. J. Constr. Econ. Build. 2012, 12, 15–28. [Google Scholar] [CrossRef]
- Asadi, K.; Ramshankar, H.; Noghabaei, M.; Han, K. Real-Time Image Localization and Registration with BIM Using Perspective Alignment for Indoor Monitoring of Construction. J. Comput. Civ. Eng. 2019, 33, 04019031. [Google Scholar] [CrossRef]
- Kim, I.; Lee, C. Development of Video Shooting System and Technique Enabling Detection of Micro Cracks in the Tunnel Liningwhile Driving. J. Korean Soc. Hazard Mitig. 2018, 18, 217–229. [Google Scholar] [CrossRef]
- Wang, Q.; Kim, M.-K. Applications of 3D Point Cloud Data in the Construction Industry: A Fifteen-Year Review from 2004 to 2018. Adv. Eng. Inform. 2019, 39, 306–319. [Google Scholar] [CrossRef]
- Previtali, M.; Díaz-Vilariño, L.; Scaioni, M. Indoor Building Reconstruction from Occluded Point Clouds Using Graph-Cut and Ray-Tracing. Appl. Sci. 2018, 8, 1529. [Google Scholar] [CrossRef]
- Babacan, K.; Jung, J.; Wichmann, A.; Jahromi, B.A.; Shahbazi, M.; Sohn, G.; Kada, M. Towards Object Driven Floor Plan Extraction from Laser Point Cloud. ISPRS-Int. Arch. Photogramm. Remote Sens. Spat. Inf. Sci. 2016, 49, 3–10. [Google Scholar] [CrossRef]
- Nikoohemat, S.; Peter, M.; Oude Elberink, S.; Vosselman, G. Semantic Interpretation of Mobile Laser Scanner Point Clouds in Indoor Scenes Using Trajectories. Remote Sens. 2018, 10, 1754. [Google Scholar] [CrossRef]
- Stojanovic, V.; Trapp, M.; Richter, R.; Döllner, J. Generation of Approximate 2D and 3D Floor Plans from 3D Point Clouds. In Proceedings of the 14th International Conference on Computer Graphics Theory and Applications, Prague, Czech Republic, 9 December 2018; pp. 177–184. [Google Scholar]
- Shukor, S.A.A.; Rushforth, E.J. Adapting Histogram for Automatic Noise Data Removal in Building Interior Point Cloud Data. AIP Conf. Proc. 2015, 1660, 070074. [Google Scholar] [CrossRef]
- Gankhuyag, U.; Han, J.-H. Automatic 2D Floorplan CAD Generation from 3D Point Clouds. Appl. Sci. 2020, 10, 2817. [Google Scholar] [CrossRef]
- Pouraghdam, M.H.; Saadatseresht, M.; Rastiveis, H.; Abzal, A.; Hasanlou, M. Building Floor Plan Reconstruction from Slam-Based Point Cloud Using Ransac Algorithm. ISPRS-Int. Arch. Photogramm. Remote Sens. Spat. Inf. Sci. 2019, 4218, 483–488. [Google Scholar] [CrossRef]
- Wang, Q.; Zhu, Z.; Chen, R.; Xia, W.; Yan, C. Building Floorplan Reconstruction Based on Integer Linear Programming. Remote Sens. 2022, 14, 4675. [Google Scholar] [CrossRef]
- Wang, C.; Ji, M.; Wang, J.; Wen, W.; Li, T.; Sun, Y. An Improved DBSCAN Method for LiDAR Data Segmentation with Automatic Eps Estimation. Sensors 2019, 19, 172. [Google Scholar] [CrossRef] [PubMed]
- Czerniawski, T.; Nahangi, M.; Walbridge, S.; Haas, C. Automated Removal of Planar Clutter from 3D Point Clouds for Improving Industrial Object Recognition: 33rd International Symposium on Automation and Robotics in Construction, ISARC 2016. In Proceedings of the 33rd International Symposium on Automation and Robotics in Construction (ISARC 2016), Auburn, AL, USA, 18–21 July 2016; pp. 357–365. [Google Scholar]
- Chen, X.; Wu, H.; Lichti, D.; Han, X.; Ban, Y.; Li, P.; Deng, H. Extraction of Indoor Objects Based on the Exponential Function Density Clustering Model. Inf. Sci. 2022, 607, 1111–1135. [Google Scholar] [CrossRef]
- Wang, C.; Hou, S.; Wen, C.; Gong, Z.; Li, Q.; Sun, X.; Li, J. Semantic Line Framework-Based Indoor Building Modeling Using Backpacked Laser Scanning Point Cloud. ISPRS J. Photogramm. Remote Sens. 2018, 143, 150–166. [Google Scholar] [CrossRef]
- Mura, C.; Mattausch, O.; Villanueva, A.J.; Gobbetti, E.; Pajarola, R. Robust Reconstruction of Interior Building Structures with Multiple Rooms under Clutter and Occlusions. In Proceedings of the 2013 International Conference on Computer-Aided Design and Computer Graphics, Guangzhou, China, 16–18 November 2013; pp. 52–59. [Google Scholar]
- Yang, H.; Wu, H. Intelligent Classification of Point Clouds for Indoor Components Based on Dimensionality Reduction. In Proceedings of the 2020 5th International Conference on Computational Intelligence and Applications (ICCIA), Beijing, China, 19–21 June 2020; pp. 89–93. [Google Scholar]
- Qi, C.R.; Su, H.; Mo, K.; Guibas, L.J. PointNet: Deep Learning on Point Sets for 3D Classification and Segmentation. In Proceedings of the 2017 IEEE Conference on Computer Vision and Pattern Recognition (CVPR), IEEE Xplore, Honolulu, HI, USA, 21–26 July 2017; pp. 652–660. [Google Scholar]
- Martin, A.F.; Rober, C. Bolles Random Sample Consensus: A Paradigm for Model Fitting with Applications to Image Analysis and Automated Cartography. Commun. ACM 1981, 24, 381–395. [Google Scholar] [CrossRef]
- Kim, M.; Lee, D. Automated Two-Dimensional Geometric Model Reconstruction from Point Cloud Data for Construction Quality Inspection and Maintenance. Autom. Constr. 2023, 154, 105024. [Google Scholar] [CrossRef]
- Martens, J.; Blankenbach, J. VOX2BIM+—A Fast and Robust Approach for Automated Indoor Point Cloud Segmentation and Building Model Generation. PFG 2023, 91, 273–294. [Google Scholar] [CrossRef]
- Wu, H.; Yue, H.; Xu, Z.; Yang, H.; Liu, C.; Chen, L. Automatic Structural Mapping and Semantic Optimization from Indoor Point Clouds. Autom. Constr. 2021, 124, 103460. [Google Scholar] [CrossRef]
- Macher, H.; Landes, T.; Grussenmeyer, P. From Point Clouds to Building Information Models: 3D Semi-Automatic Reconstruction of Indoors of Existing Buildings. Appl. Sci. 2017, 7, 1030. [Google Scholar] [CrossRef]
- Yao, T.; Yang, Q.; Zhang, R. Fast 3D Object Segmentation Using DBSCAN Clustering Based on Supervoxel. In Proceedings of the 2nd International Conference on Signal Image Processing and Communication (ICSIPC 2022), SPIE, Qingdao, China, 9 October 2022; Volume 12246, pp. 311–316. [Google Scholar]
- Romero-Jarén, R.; Arranz, J.J. Automatic Segmentation and Classification of BIM Elements from Point Clouds. Autom. Constr. 2021, 124, 103576. [Google Scholar] [CrossRef]
- Kim, H.; Kim, C. 3D As-Built Modeling from Incomplete Point Clouds Using Connectivity Relations. Autom. Constr. 2021, 130, 103855. [Google Scholar] [CrossRef]
- Wang, Y.; Sun, Y.; Liu, Z.; Sarma, S.E.; Bronstein, M.M.; Solomon, J.M. Dynamic Graph CNN for Learning on Point Clouds. ACM Trans. Graph. 2019, 38, 1–12. [Google Scholar] [CrossRef]
- Perez-Perez, Y.; Golparvar-Fard, M.; El-Rayes, K. Scan2BIM-NET: Deep Learning Method for Segmentation of Point Clouds for Scan-to-BIM. J. Constr. Eng. Manag. 2021, 147, 04021107. [Google Scholar] [CrossRef]
- Hu, Q.; Yang, B.; Xie, L.; Rosa, S.; Guo, Y.; Wang, Z.; Trigoni, N.; Markham, A. RandLA-Net: Efficient Semantic Segmentation of Large-Scale Point Clouds. In Proceedings of the 2020 Conference on Computer Vision and Pattern Recognition, Seattle, WA, USA, 14–19 June 2020; pp. 11108–11117. [Google Scholar]
- Qi, C.R.; Yi, L.; Su, H.; Guibas, L.J. PointNet++: Deep Hierarchical Feature Learning on Point Sets in a Metric Space. In Advances in Neural Information Processing Systems; Curran Associates, Inc.: New York, NY, USA, 2017; Volume 30. [Google Scholar]
- Yin, C.; Wang, B.; Gan, V.J.L.; Wang, M.; Cheng, J.C.P. Automated Semantic Segmentation of Industrial Point Clouds Using ResPointNet++. Autom. Constr. 2021, 130, 103874. [Google Scholar] [CrossRef]
- Kim, J.; Chung, D.; Kim, Y.; Kim, H. Deep Learning-Based 3D Reconstruction of Scaffolds Using a Robot Dog. Autom. Constr. 2022, 134, 104092. [Google Scholar] [CrossRef]


| Data Structuring Method | Original Point Cloud (52,150,674 Points) | Downsampled Point Cloud (106,391 Points) |
|---|---|---|
| KD-tree | 2 m 11 s | 0.4 s |
| Ball-tree | 1 m 48 s | 0.2 s |
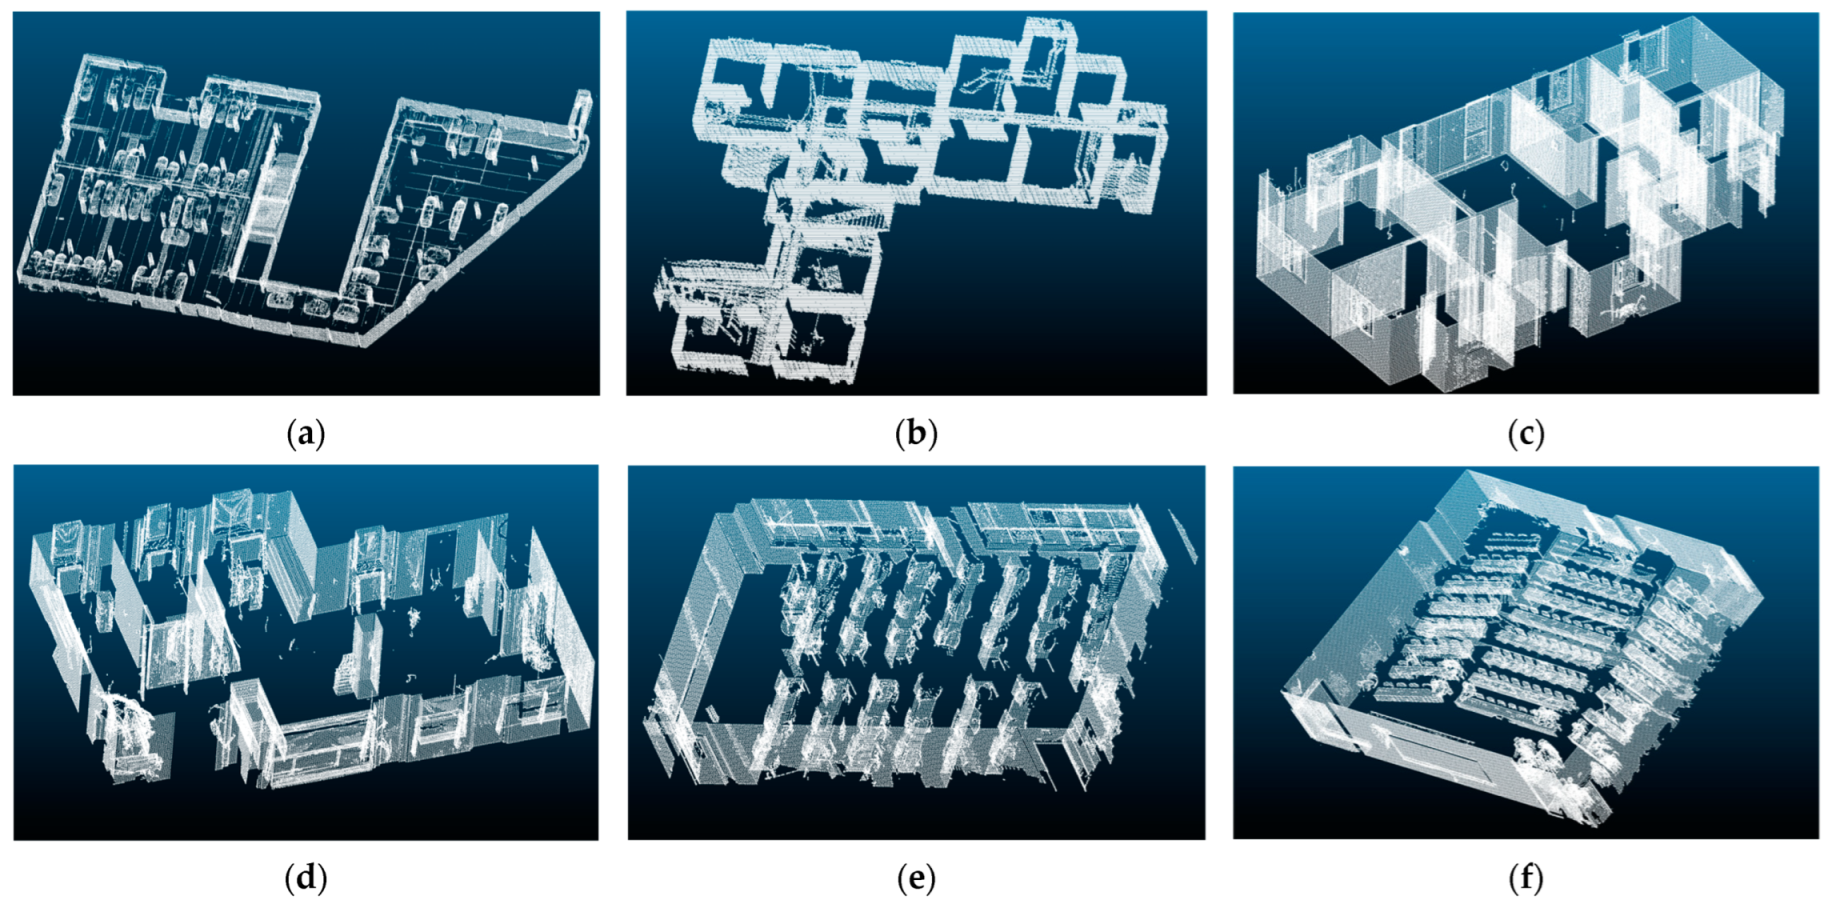
| Dataset | Initial Number of Points (Size) | Downsampled Points (Size) | Volume Size of Point Cloud (m) | Indoor Complexity |
|---|---|---|---|---|
| Parking lot | 158,575,772 (6.3 GB) | 877,184 (10.0 MB) | 100.5 × 52.6 × 2.2 | high |
| Basement | 16,518,293 (0.7 GB) | 333,587 (3.8 MB) | 26.3 × 21.6 × 2.5 | low |
| Apartment 1 | 121,652,038 (3.9 GB) | 149,896 (1.7 MB) | 10.2 × 16.7 × 2.3 | low |
| Apartment 2 | 52,150,675 (1.4 GB) | 106,391 (1.2 MB) | 15.4 × 9.9 × 2.3 | low |
| Lecture room 1 | 22,082,415 (0.7 GB) | 65,027 (0.8 MB) | 12.6 × 7.7 × 2.2 | high |
| Lecture room 2 | 43,856,412 (1.4 GB) | 116,533 (1.9 MB) | 12.6 × 15.5 × 3.3 | high |
| Dataset | Accuracy | Precision | Recall | F1 Score |
|---|---|---|---|---|
| Parking lot | 0.98 | 0.98 | 0.97 | 0.98 |
| Basement | 0.93 | 0.88 | 0.89 | 0.88 |
| Apartment 1 | 0.96 | 0.99 | 0.97 | 0.98 |
| Apartment 2 | 0.94 | 0.99 | 0.86 | 0.92 |
| Lecture room 1 | 0.90 | 0.97 | 0.83 | 0.89 |
| Lecture room 2 | 0.94 | 0.99 | 0.86 | 0.92 |
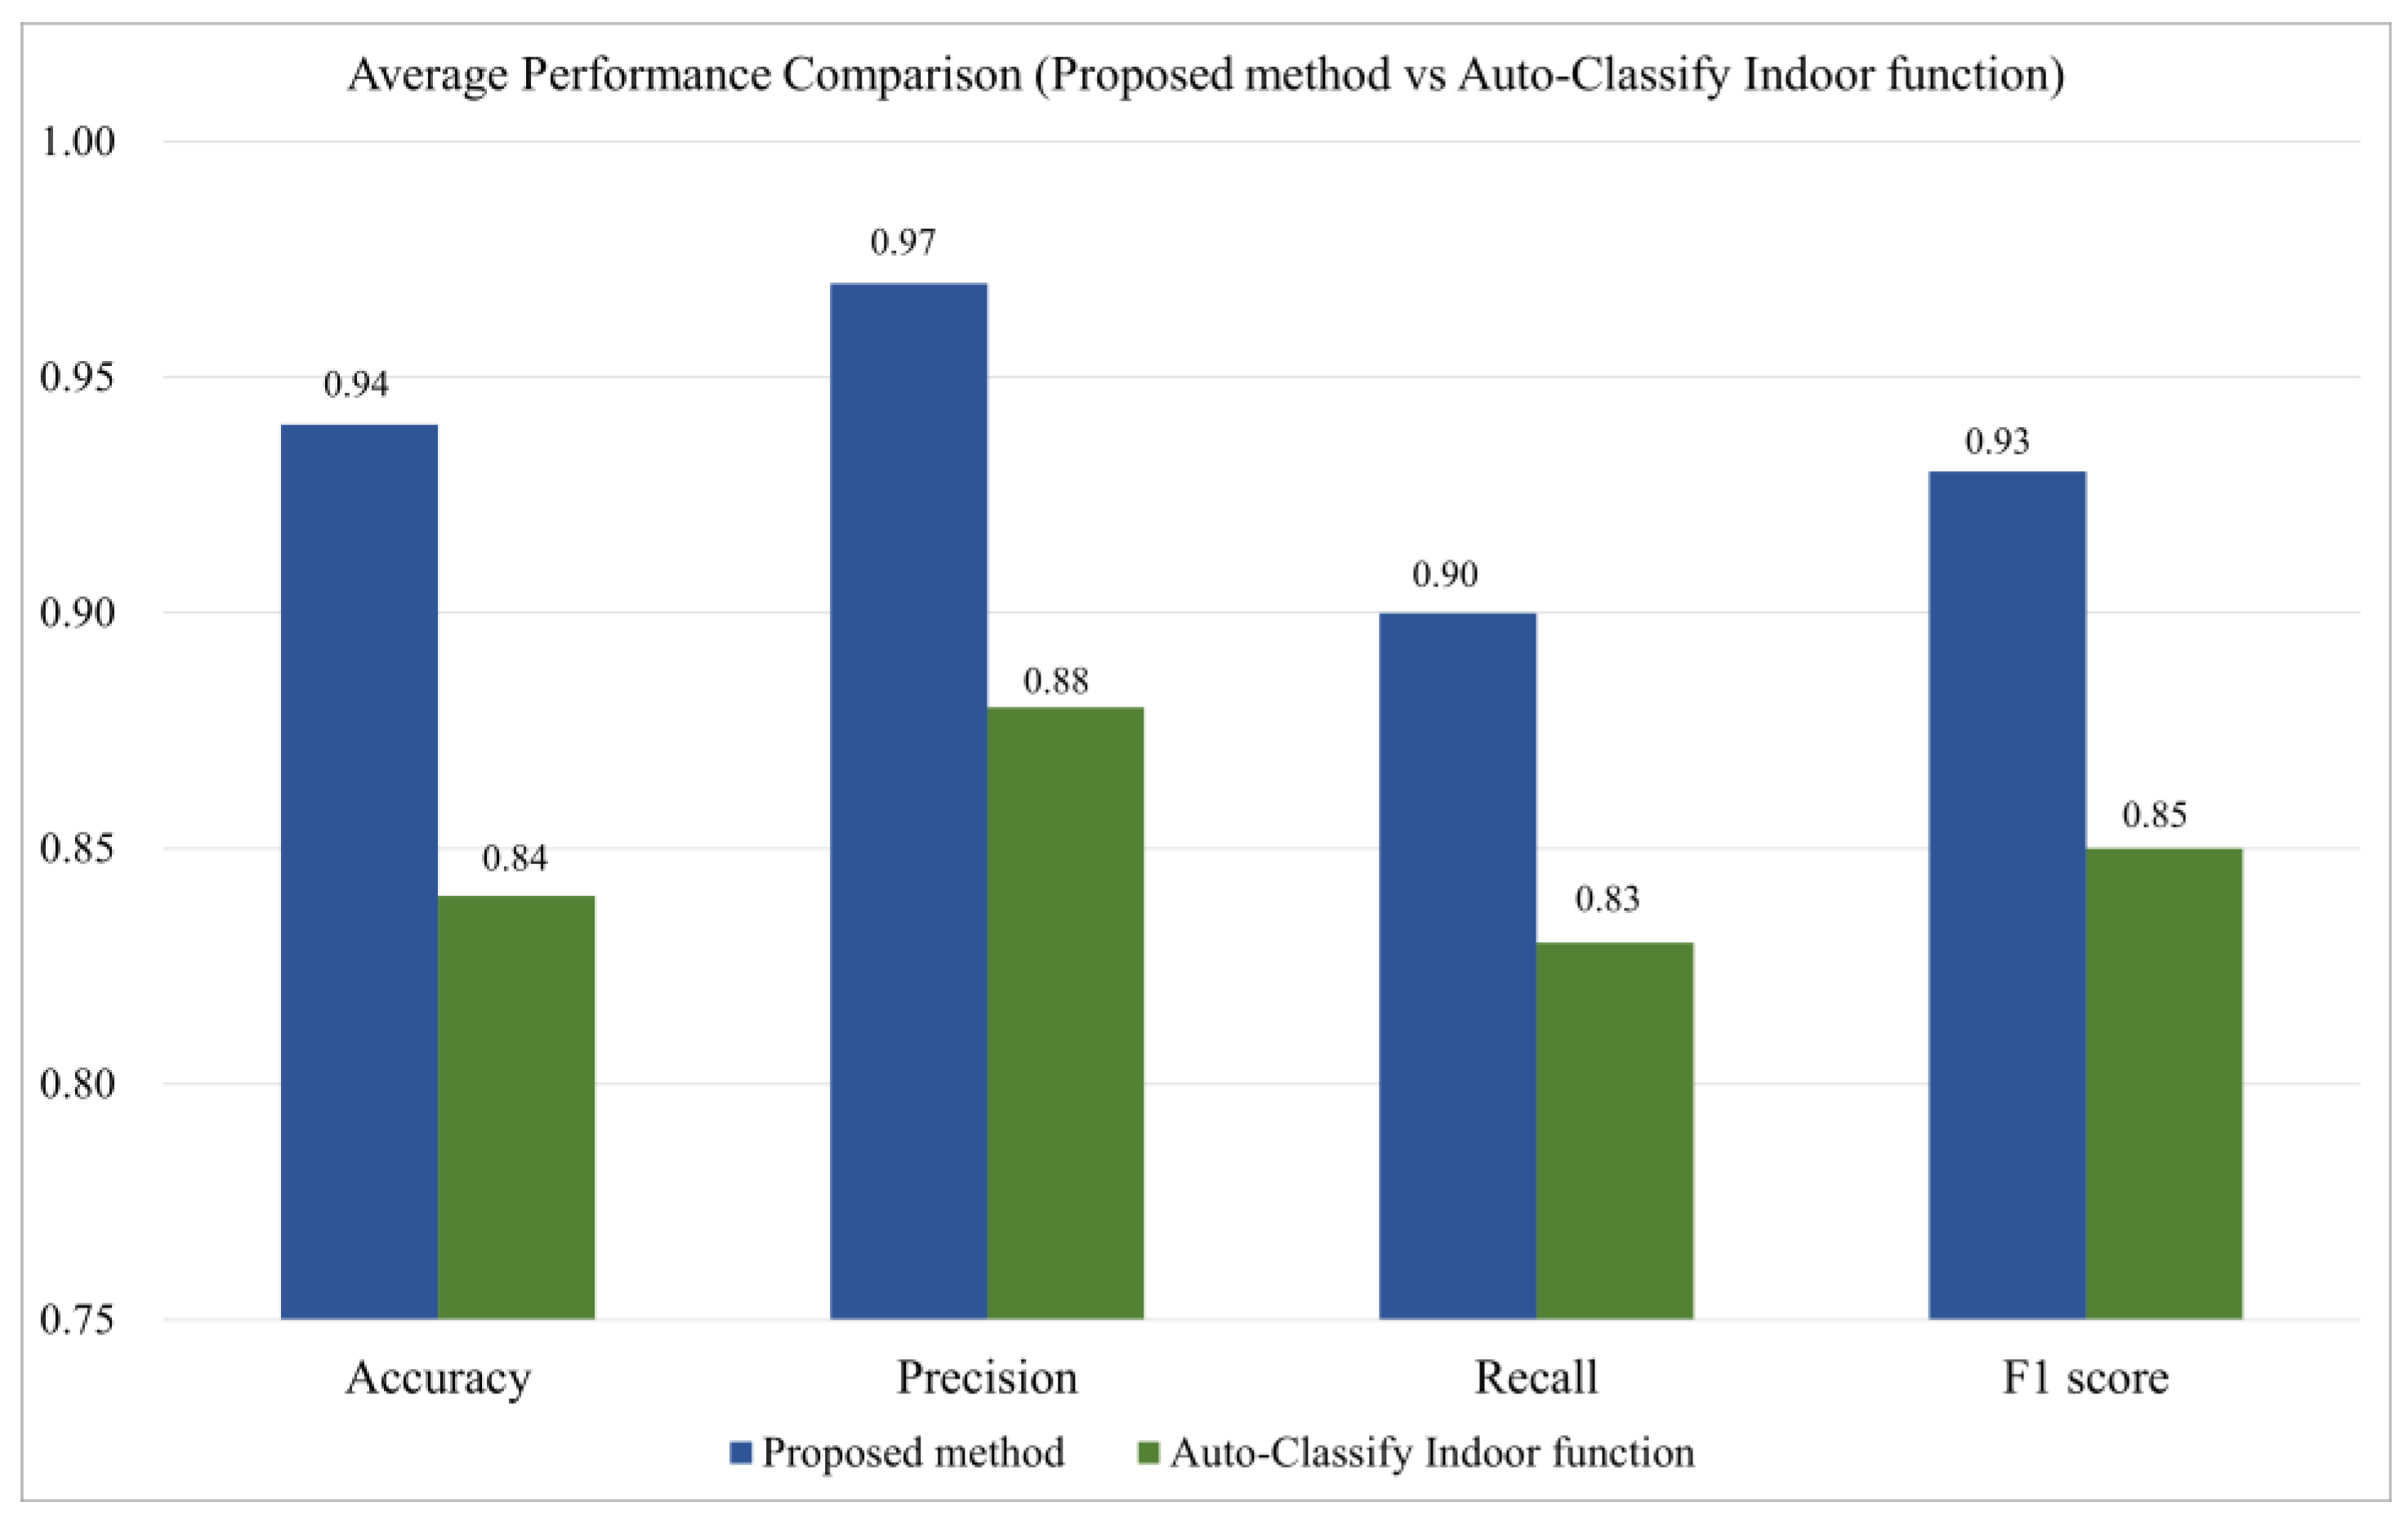
| Average performance | 0.94 | 0.97 | 0.90 | 0.93 |
| Dataset | Accuracy | Precision | Recall | F1 Score |
|---|---|---|---|---|
| Parking lot | 0.86 | 0.93 | 0.73 | 0.81 |
| Basement | 0.78 | 0.62 | 0.80 | 0.70 |
| Apartment 1 | 0.74 | 0.98 | 0.75 | 0.85 |
| Apartment 2 | 0.79 | 0.82 | 0.87 | 0.84 |
| Lecture room 1 | 0.90 | 0.98 | 0.84 | 0.91 |
| Lecture room 2 | 0.97 | 0.95 | 0.97 | 0.96 |
| Average performance | 0.84 | 0.88 | 0.83 | 0.85 |
| Dataset | Time (s) |
|---|---|
| Parking lot | 300.3 |
| Basement | 38.2 |
| Apartment 1 | 171.6 |
| Apartment 2 | 65.3 |
| Lecture room 1 | 28.2 |
| Lecture room 2 | 62.4 |
Disclaimer/Publisher’s Note: The statements, opinions and data contained in all publications are solely those of the individual author(s) and contributor(s) and not of MDPI and/or the editor(s). MDPI and/or the editor(s) disclaim responsibility for any injury to people or property resulting from any ideas, methods, instructions or products referred to in the content. |
© 2023 by the authors. Licensee MDPI, Basel, Switzerland. This article is an open access article distributed under the terms and conditions of the Creative Commons Attribution (CC BY) license (https://creativecommons.org/licenses/by/4.0/).
Share and Cite
Bae, S.-J.; Kim, J.-Y. Indoor Clutter Object Removal Method for an As-Built Building Information Model Using a Two-Dimensional Projection Approach. Appl. Sci. 2023, 13, 9636. https://doi.org/10.3390/app13179636
Bae S-J, Kim J-Y. Indoor Clutter Object Removal Method for an As-Built Building Information Model Using a Two-Dimensional Projection Approach. Applied Sciences. 2023; 13(17):9636. https://doi.org/10.3390/app13179636
Chicago/Turabian StyleBae, Sung-Jae, and Jung-Yeol Kim. 2023. "Indoor Clutter Object Removal Method for an As-Built Building Information Model Using a Two-Dimensional Projection Approach" Applied Sciences 13, no. 17: 9636. https://doi.org/10.3390/app13179636