

Value Assessment of UGC Short Videos through Element Mining and Data Analysis

Abstract
:1. Introduction
2. Literature Review
2.1. Study on the Value Assessment of UGC Short Videos Using Technical Methods
2.2. Study on Value Assessment of UGC Short Videos through the Construction of an Index System
2.3. Study on the Value Assessment of UGC Short Videos Using Data Modeling
2.4. Research Gap
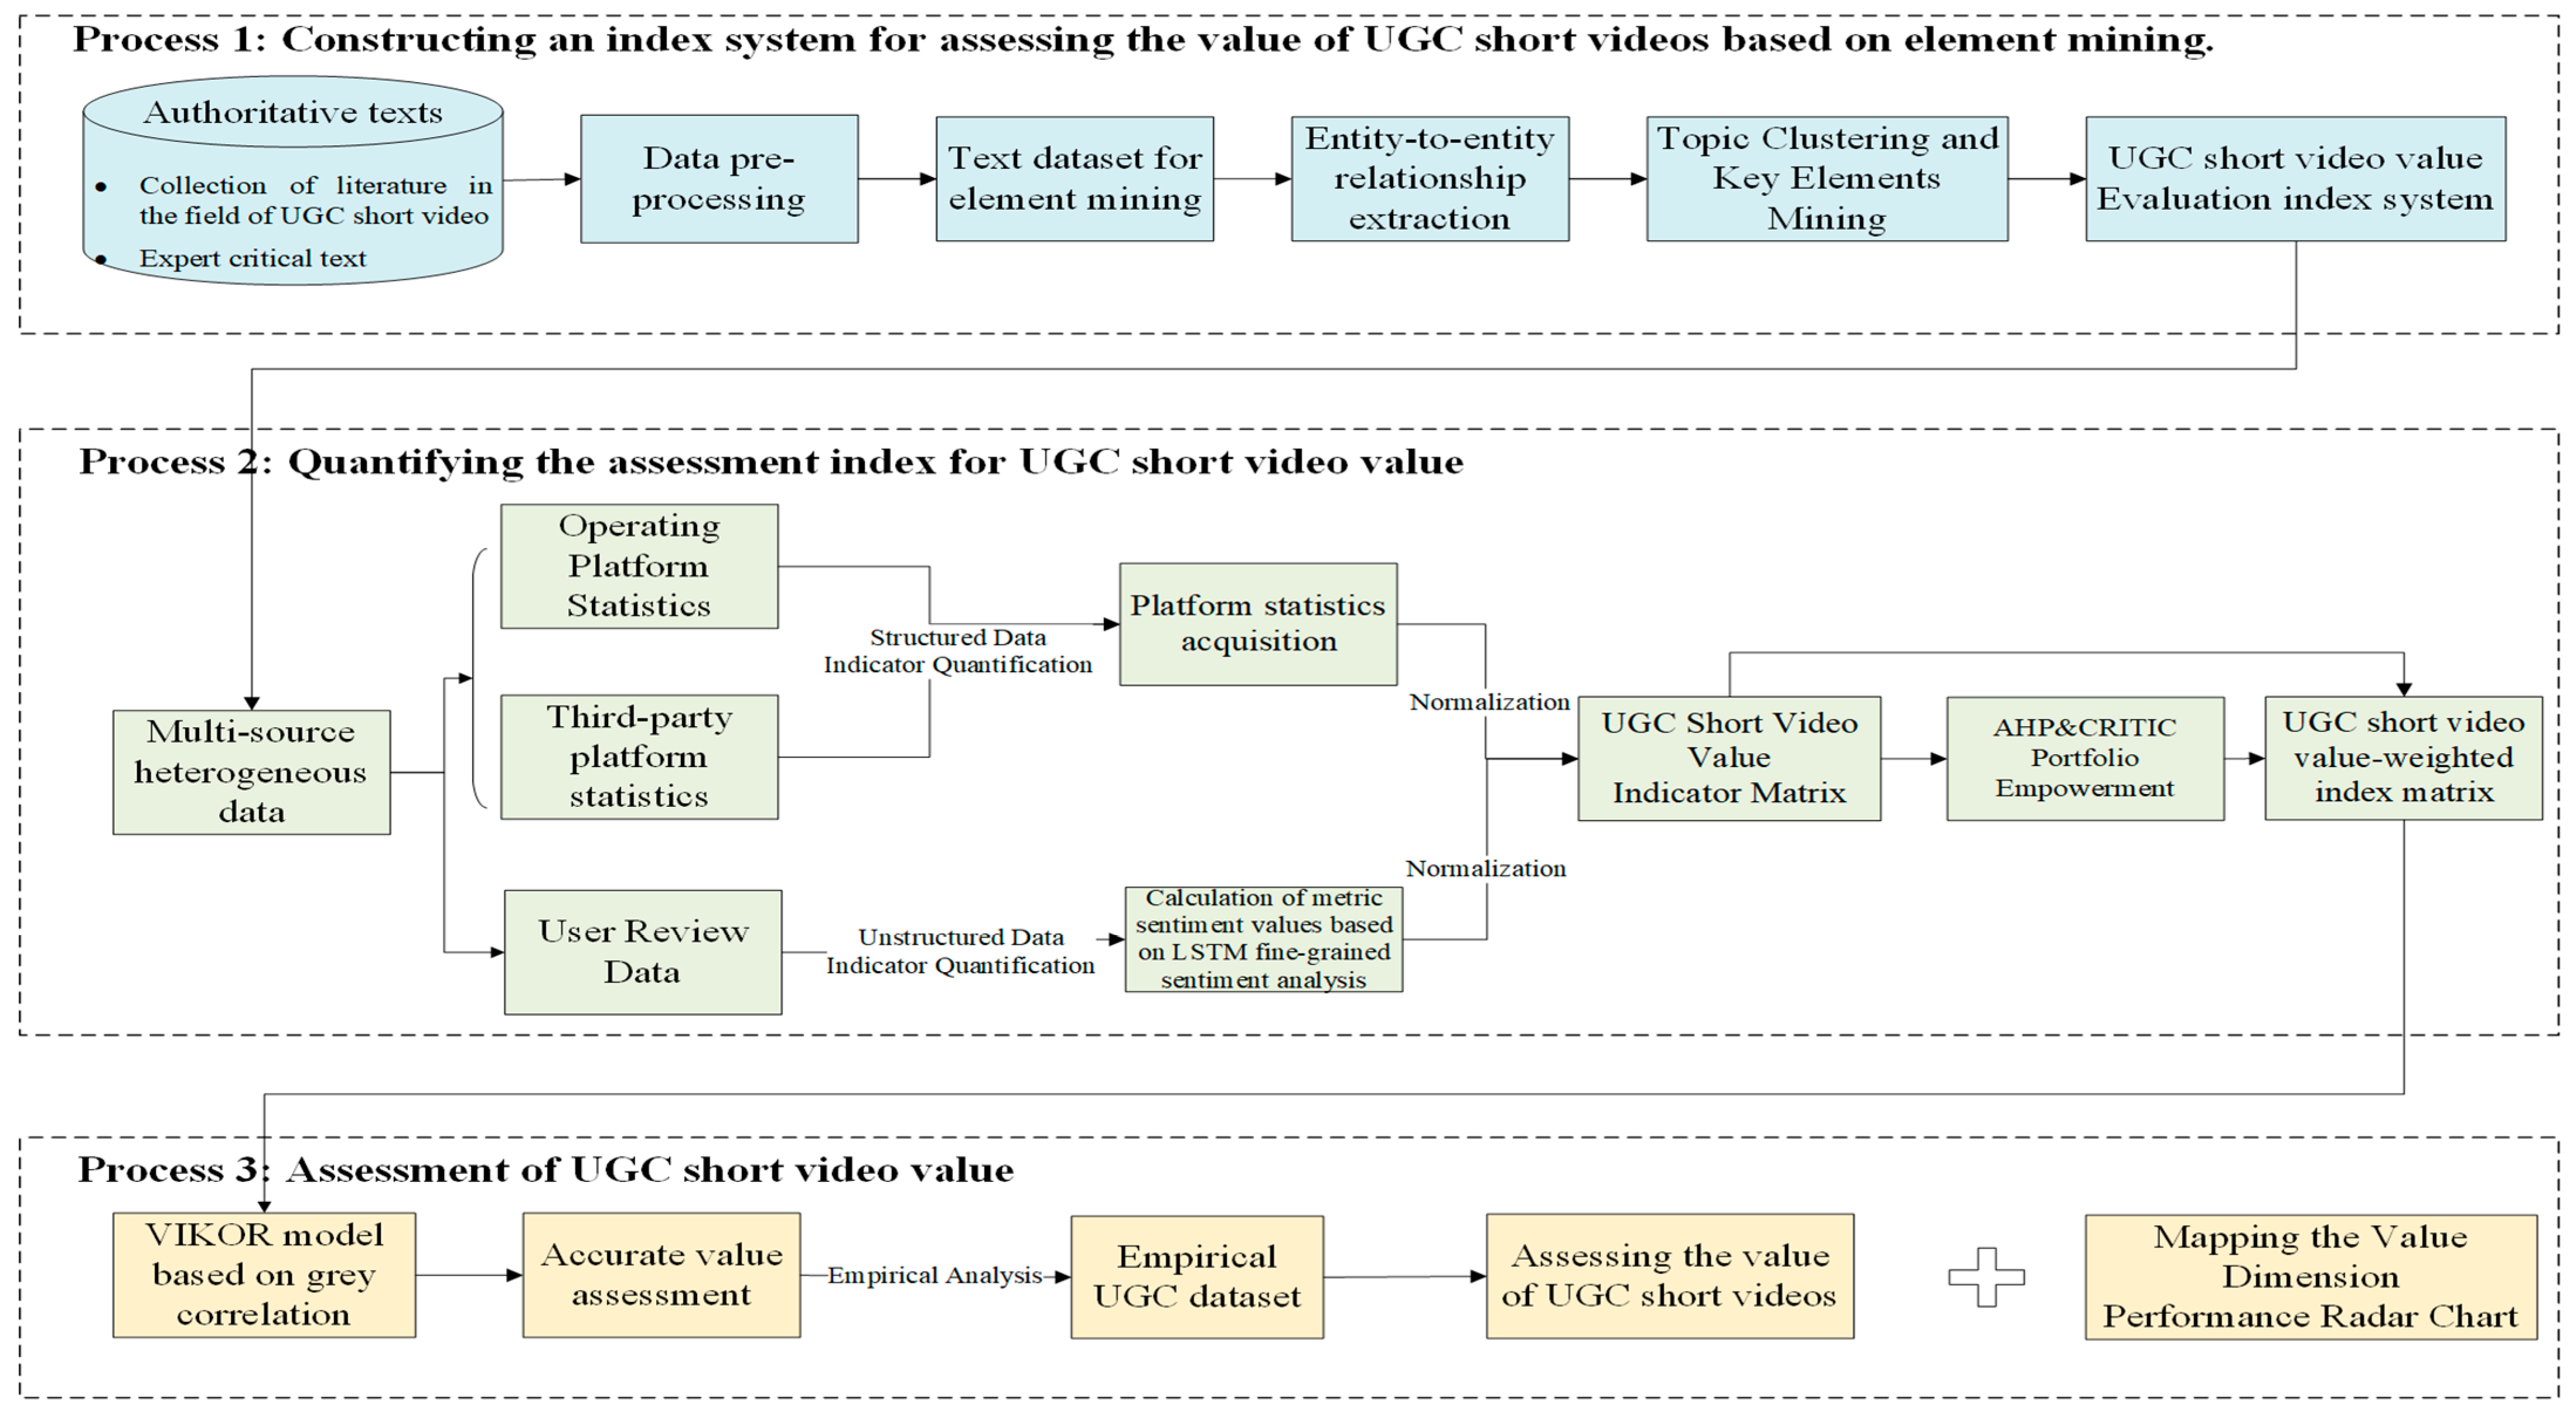
3. Methodology
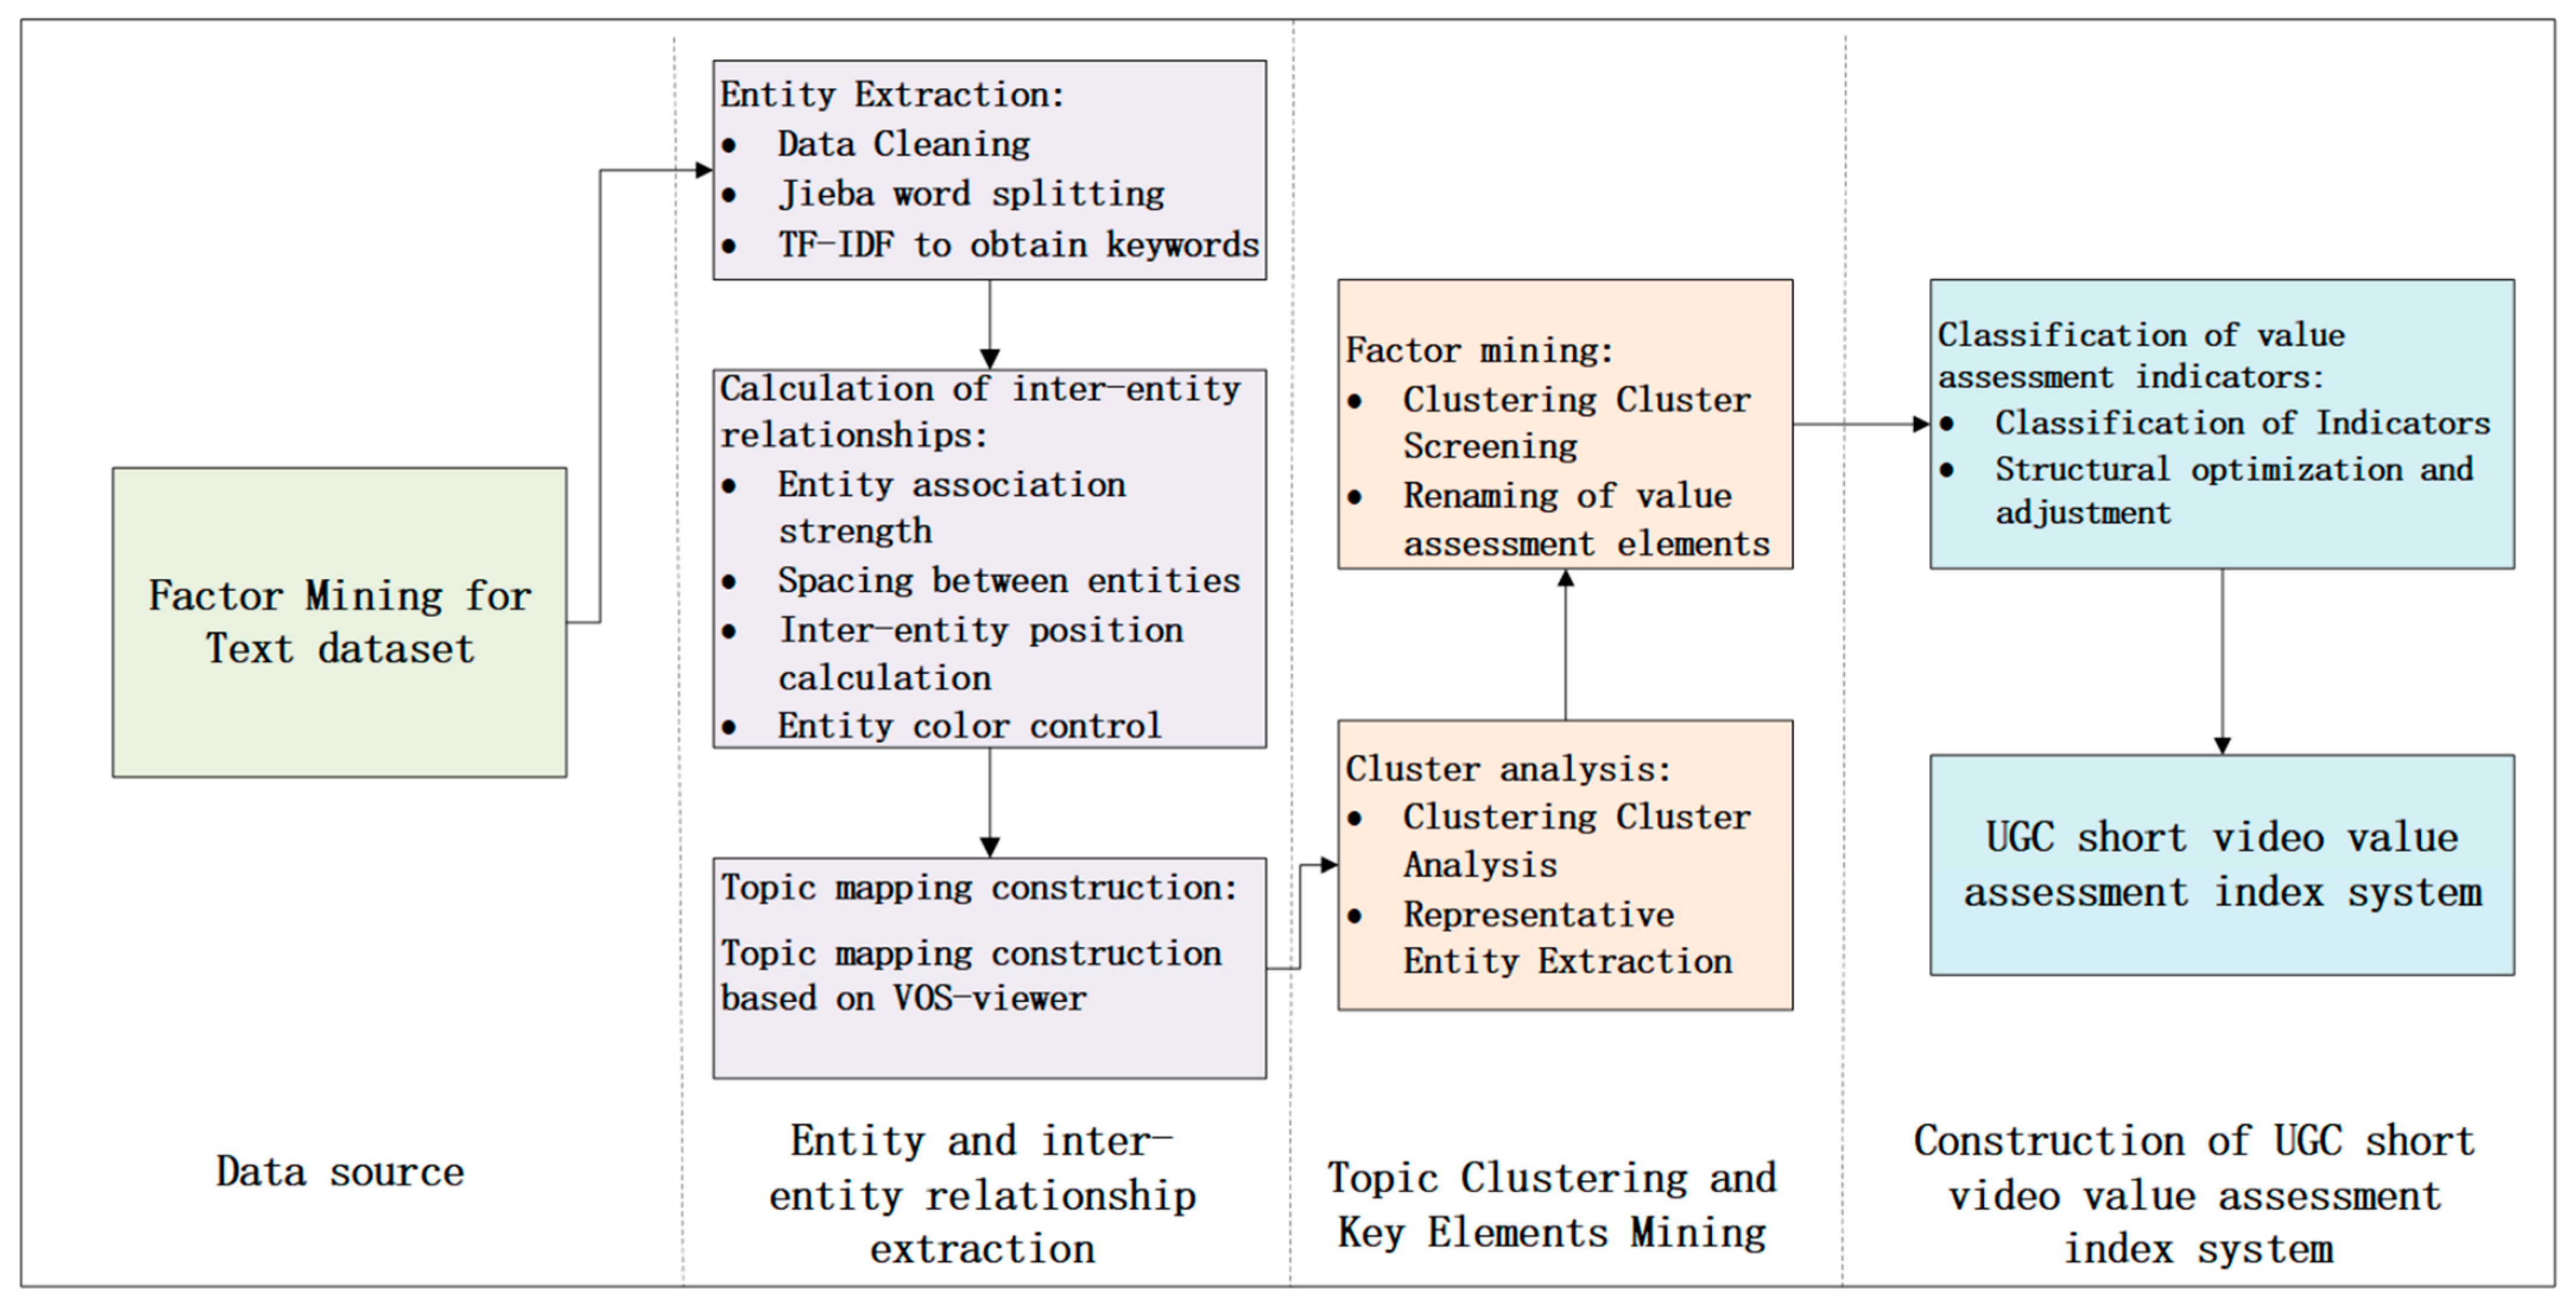
3.1. Process 1: Constructing an Index System for Assessing the Value of UGC Short Videos Based on Element Mining
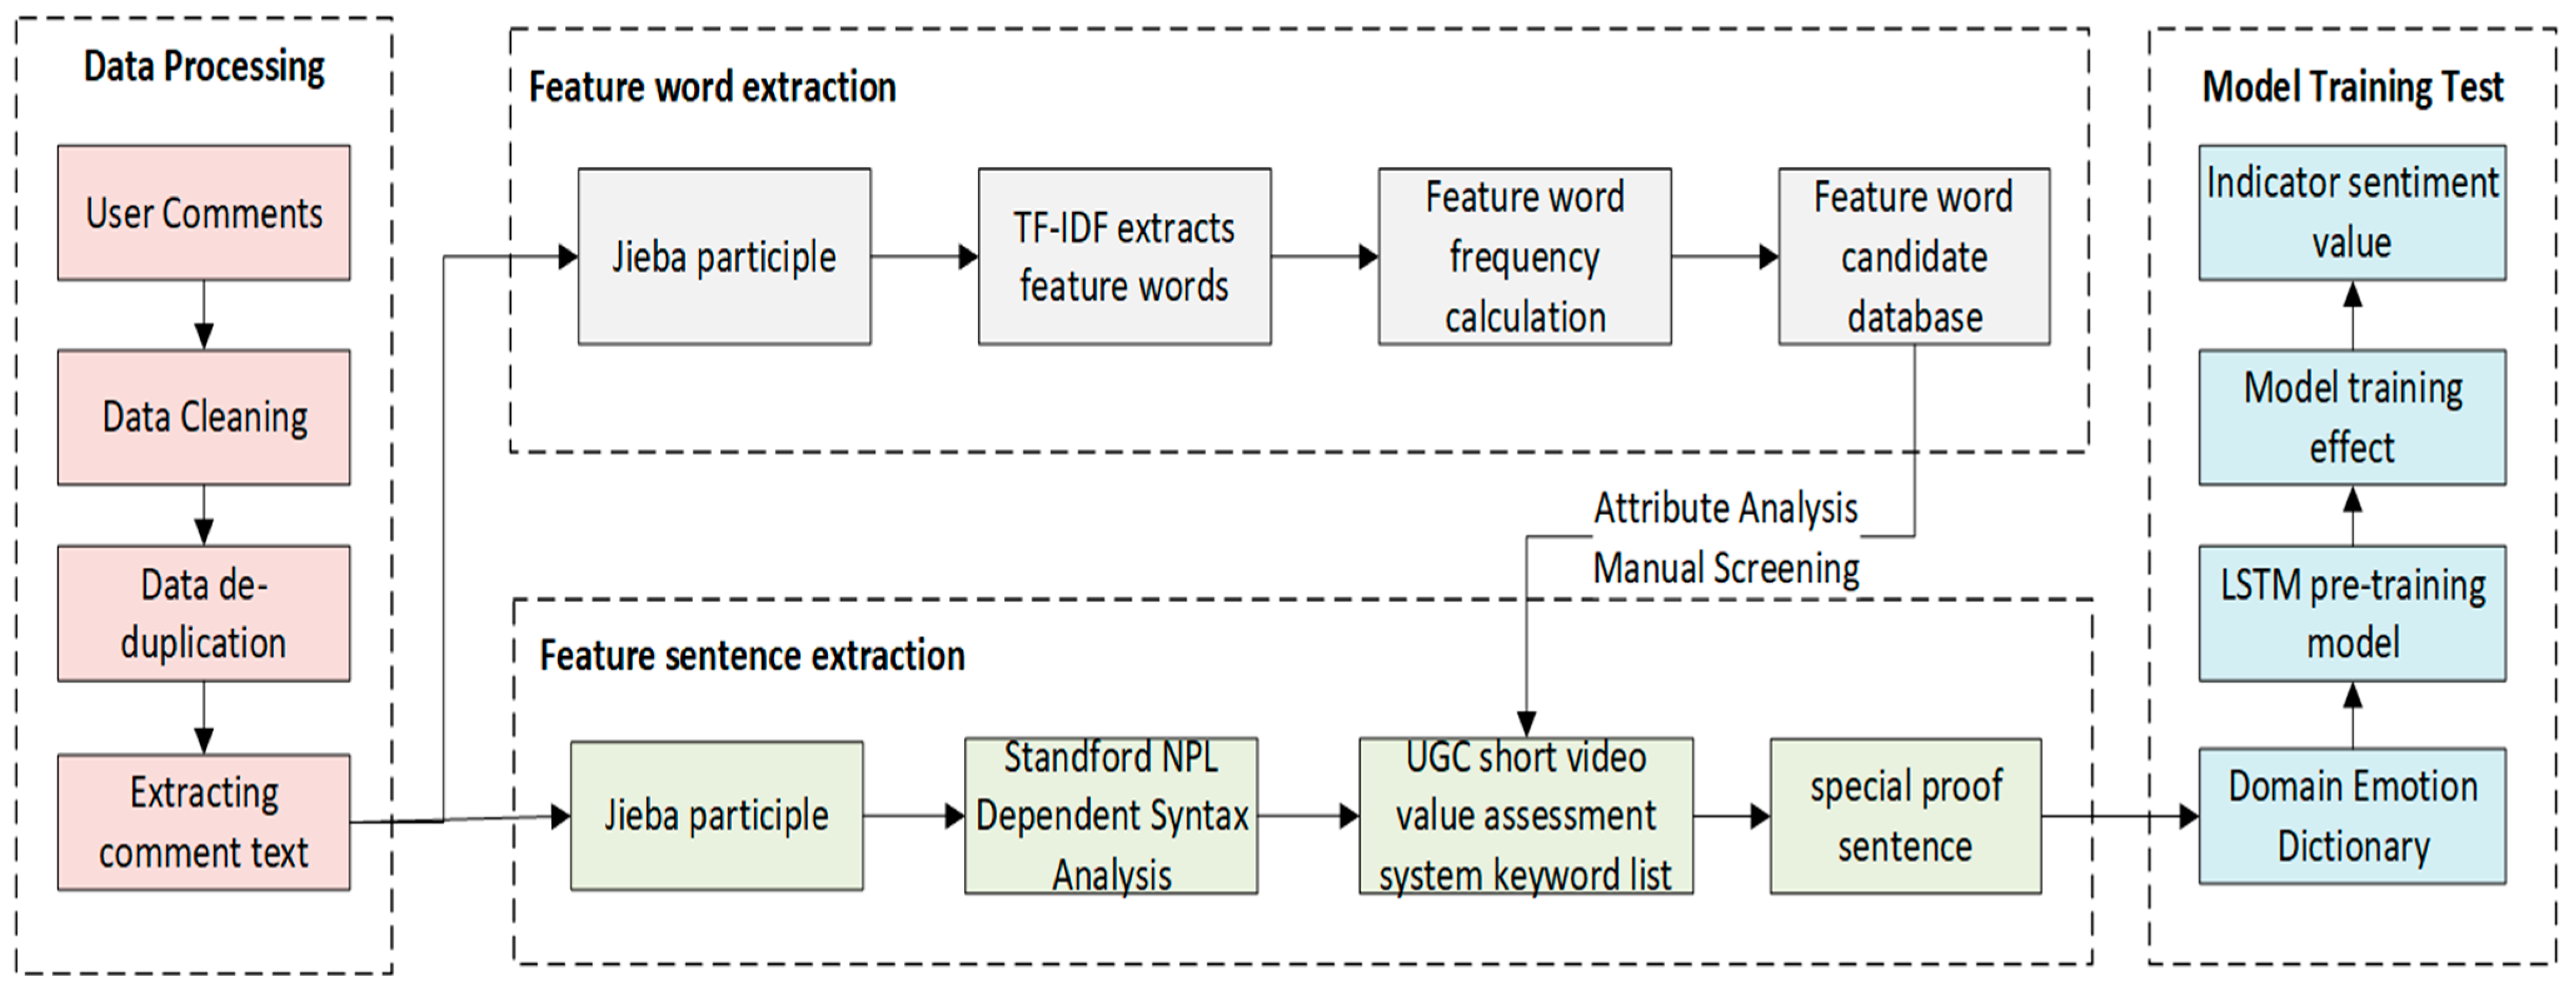
3.2. Process 2: Quantifying the Assessment Index for UGC Short Video Value
3.3. Process 3: Assessment of UGC Short Video Value
4. Results
4.1. Construction of the UGC Short Video Value Assessment Index System
4.1.1. Data Acquisition and Processing
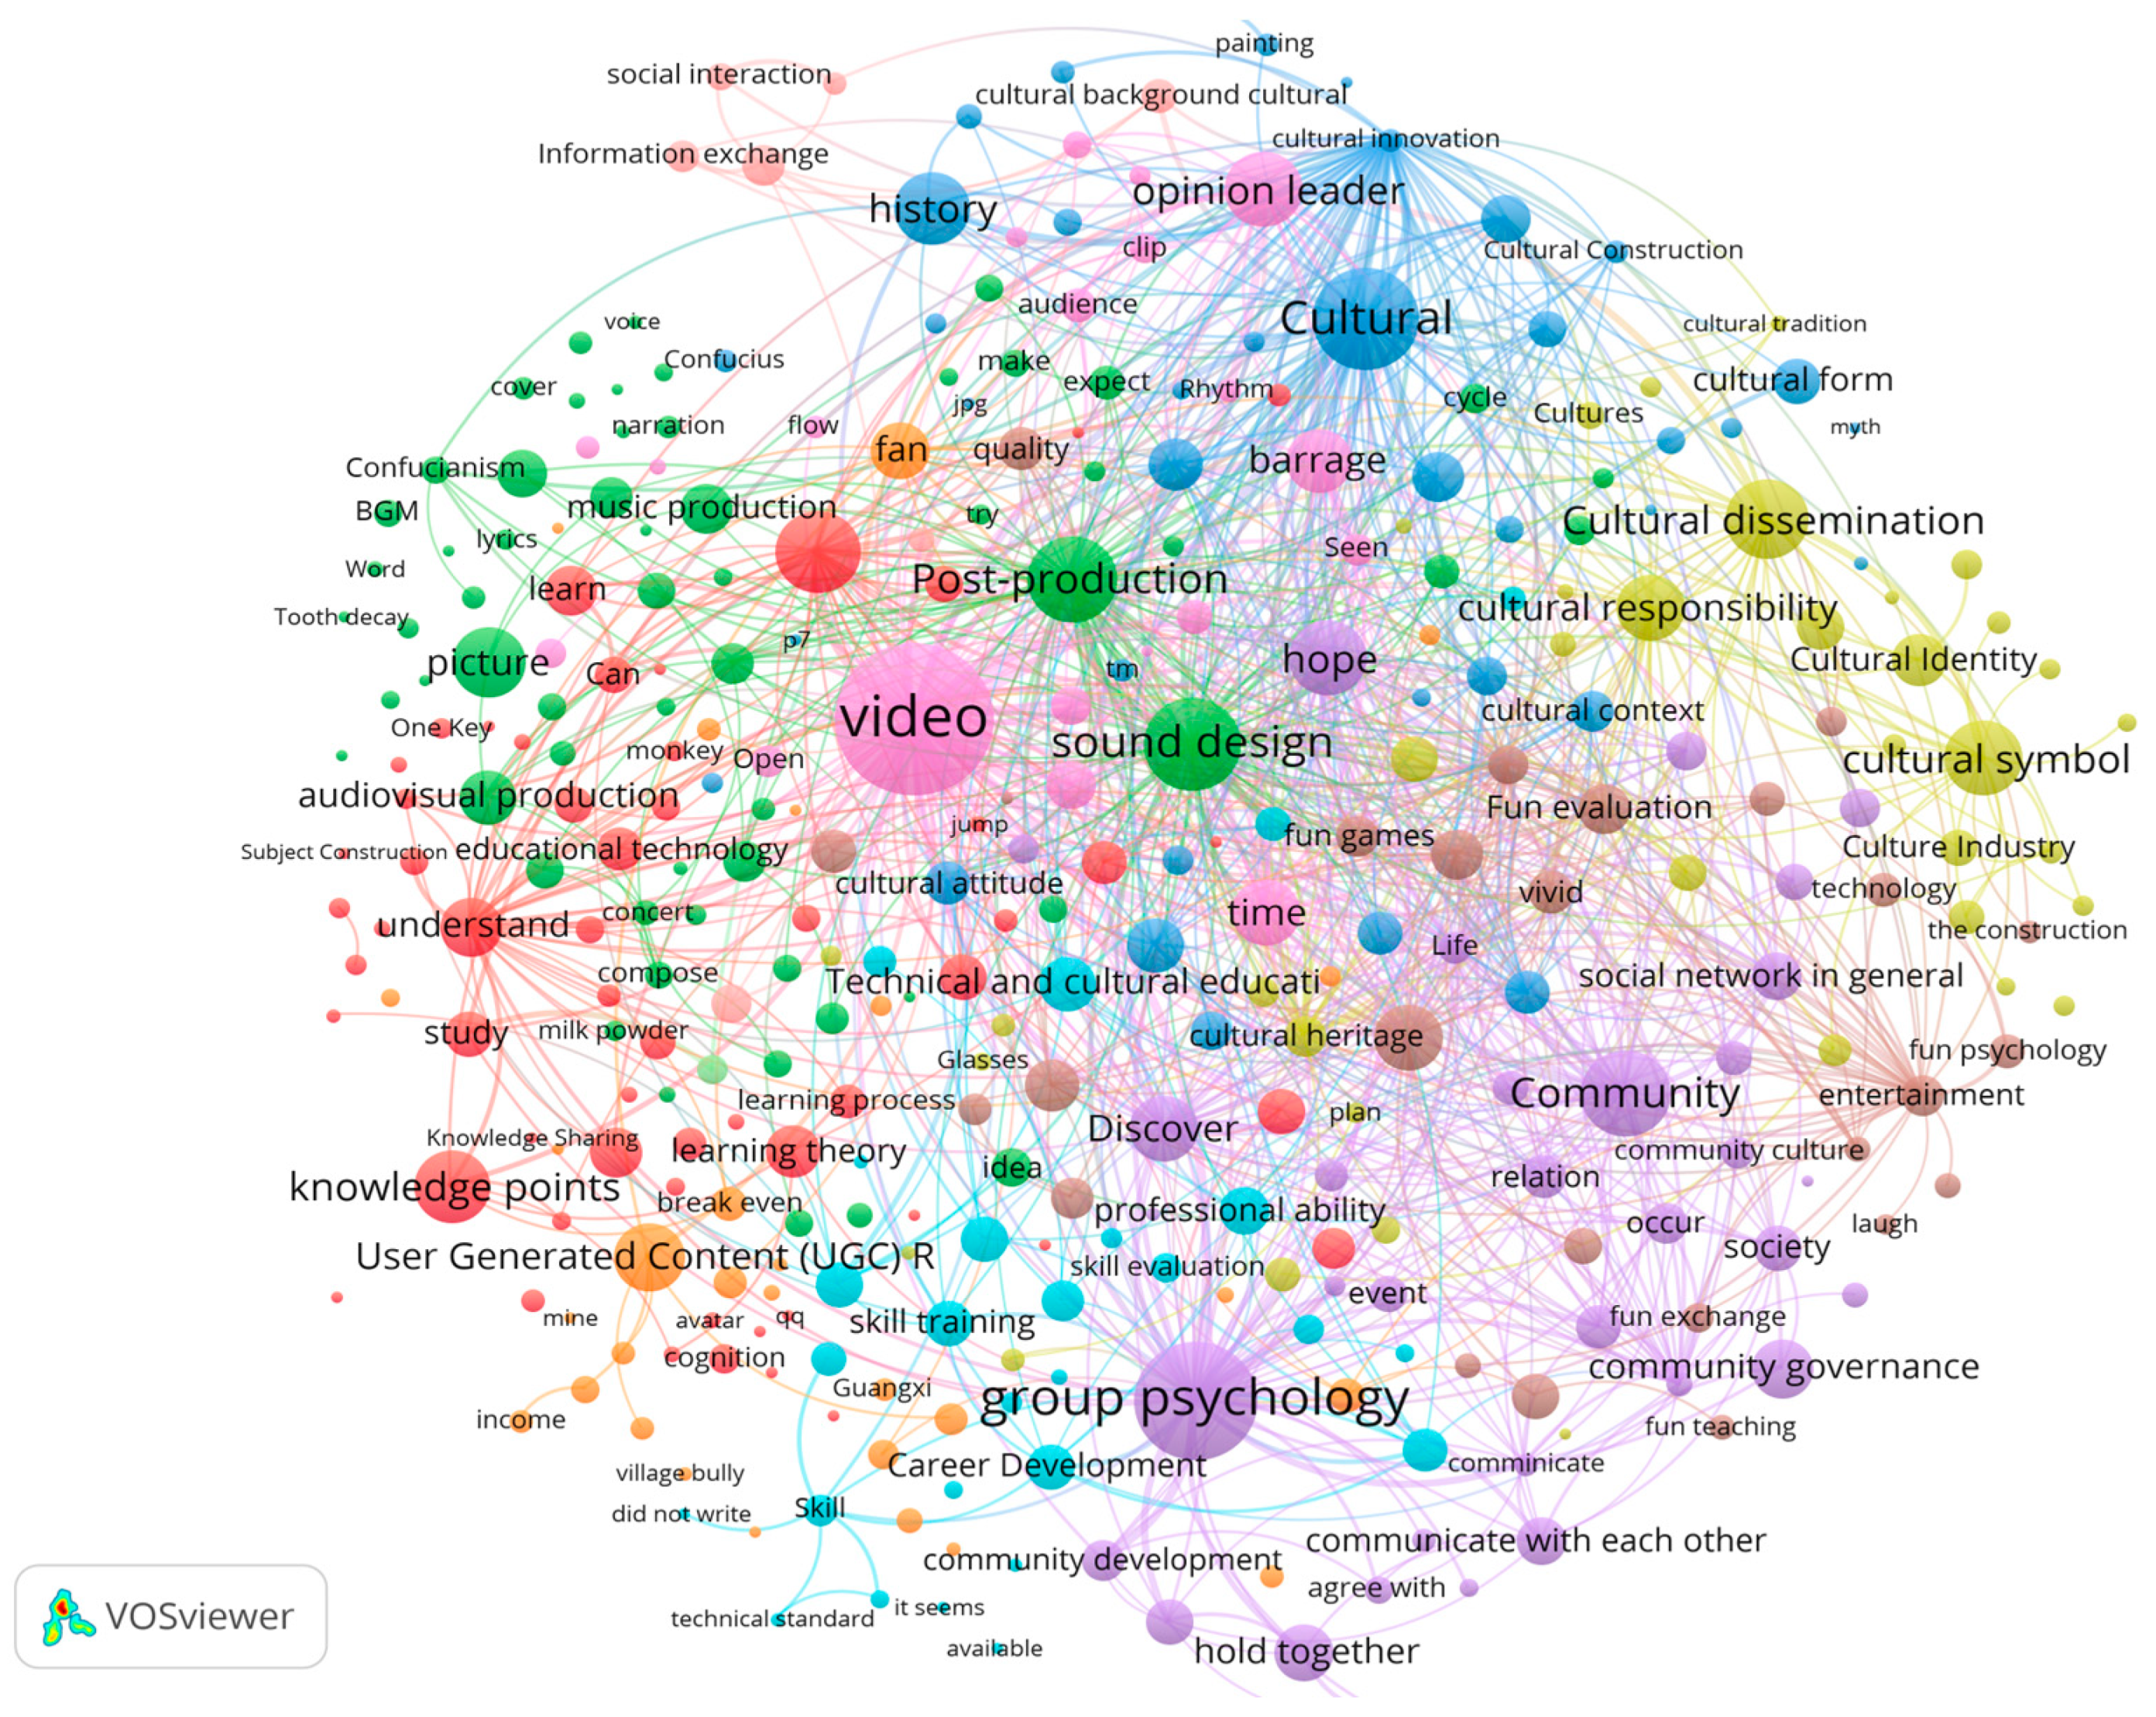
4.1.2. Element Mining Based on Text Clustering Algorithm and Topic Mapping
4.1.3. Construction of the UGC Short Video Value Assessment Index System
4.2. Quantification of the UGC Short Video Value Assessment Index
4.2.1. Data Collection
4.2.2. Indicator Processing Process
4.3. UGC Short Video Value Assessment
4.3.1. Assessment Principles
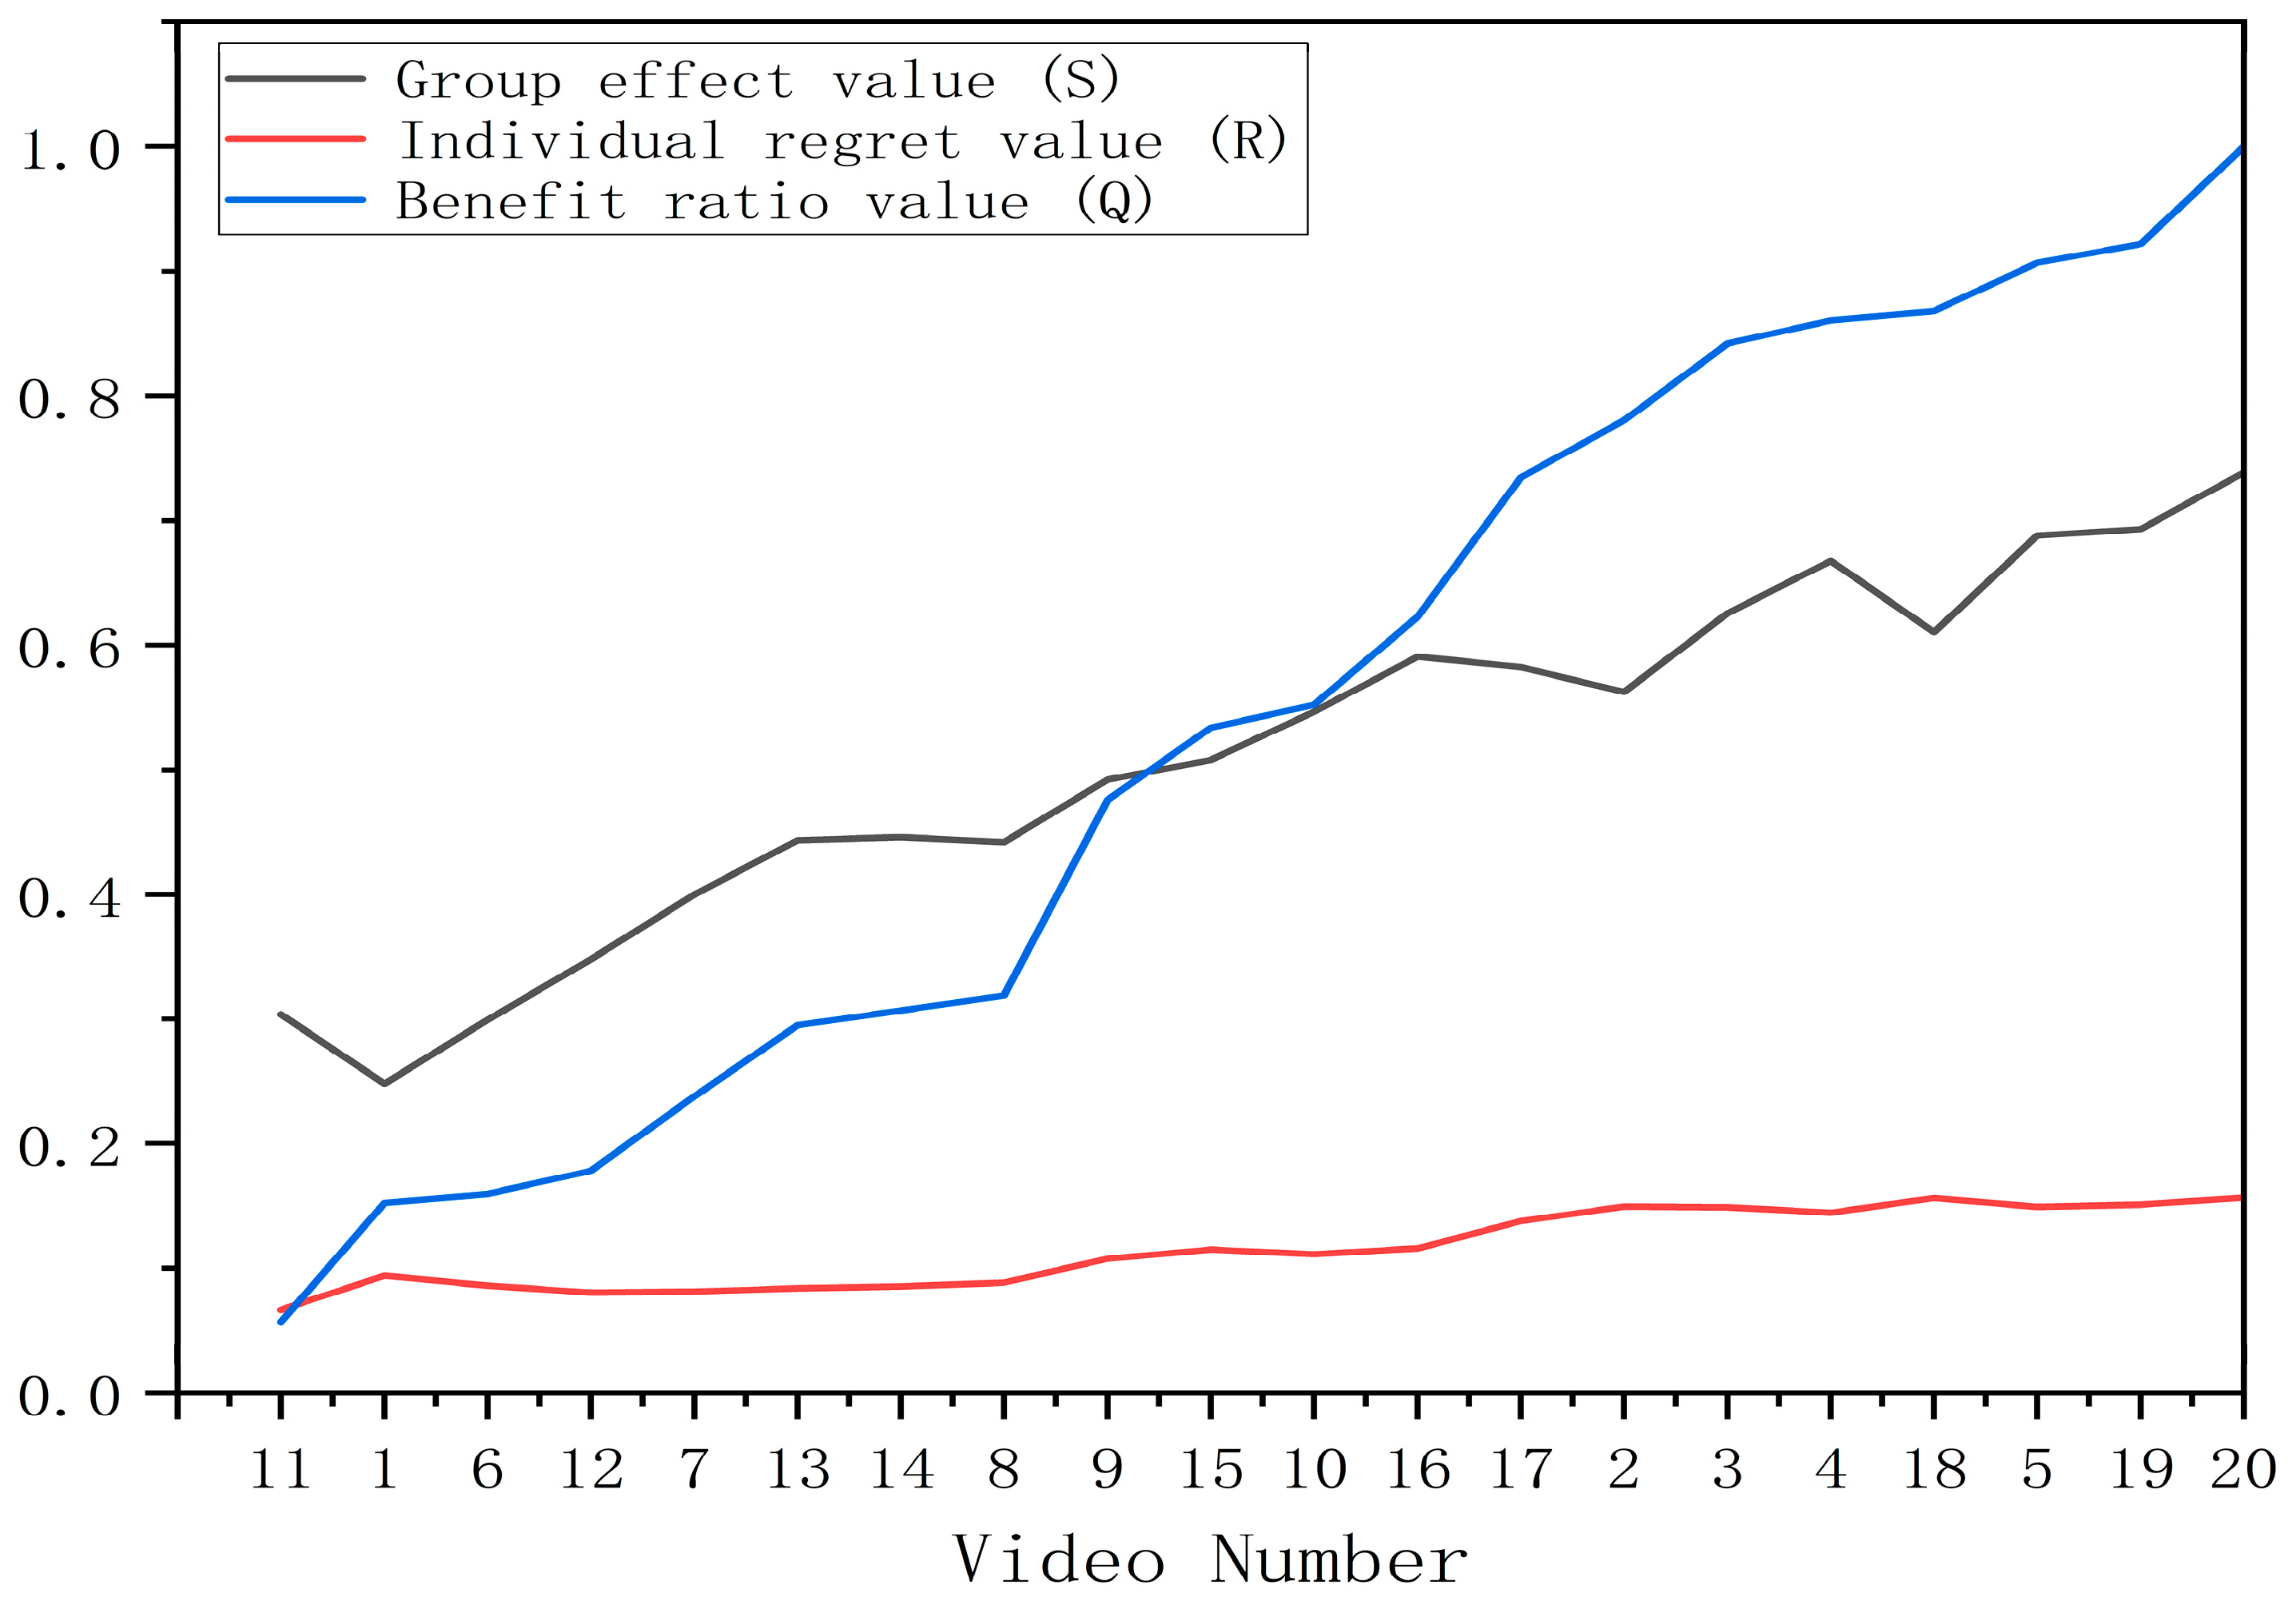
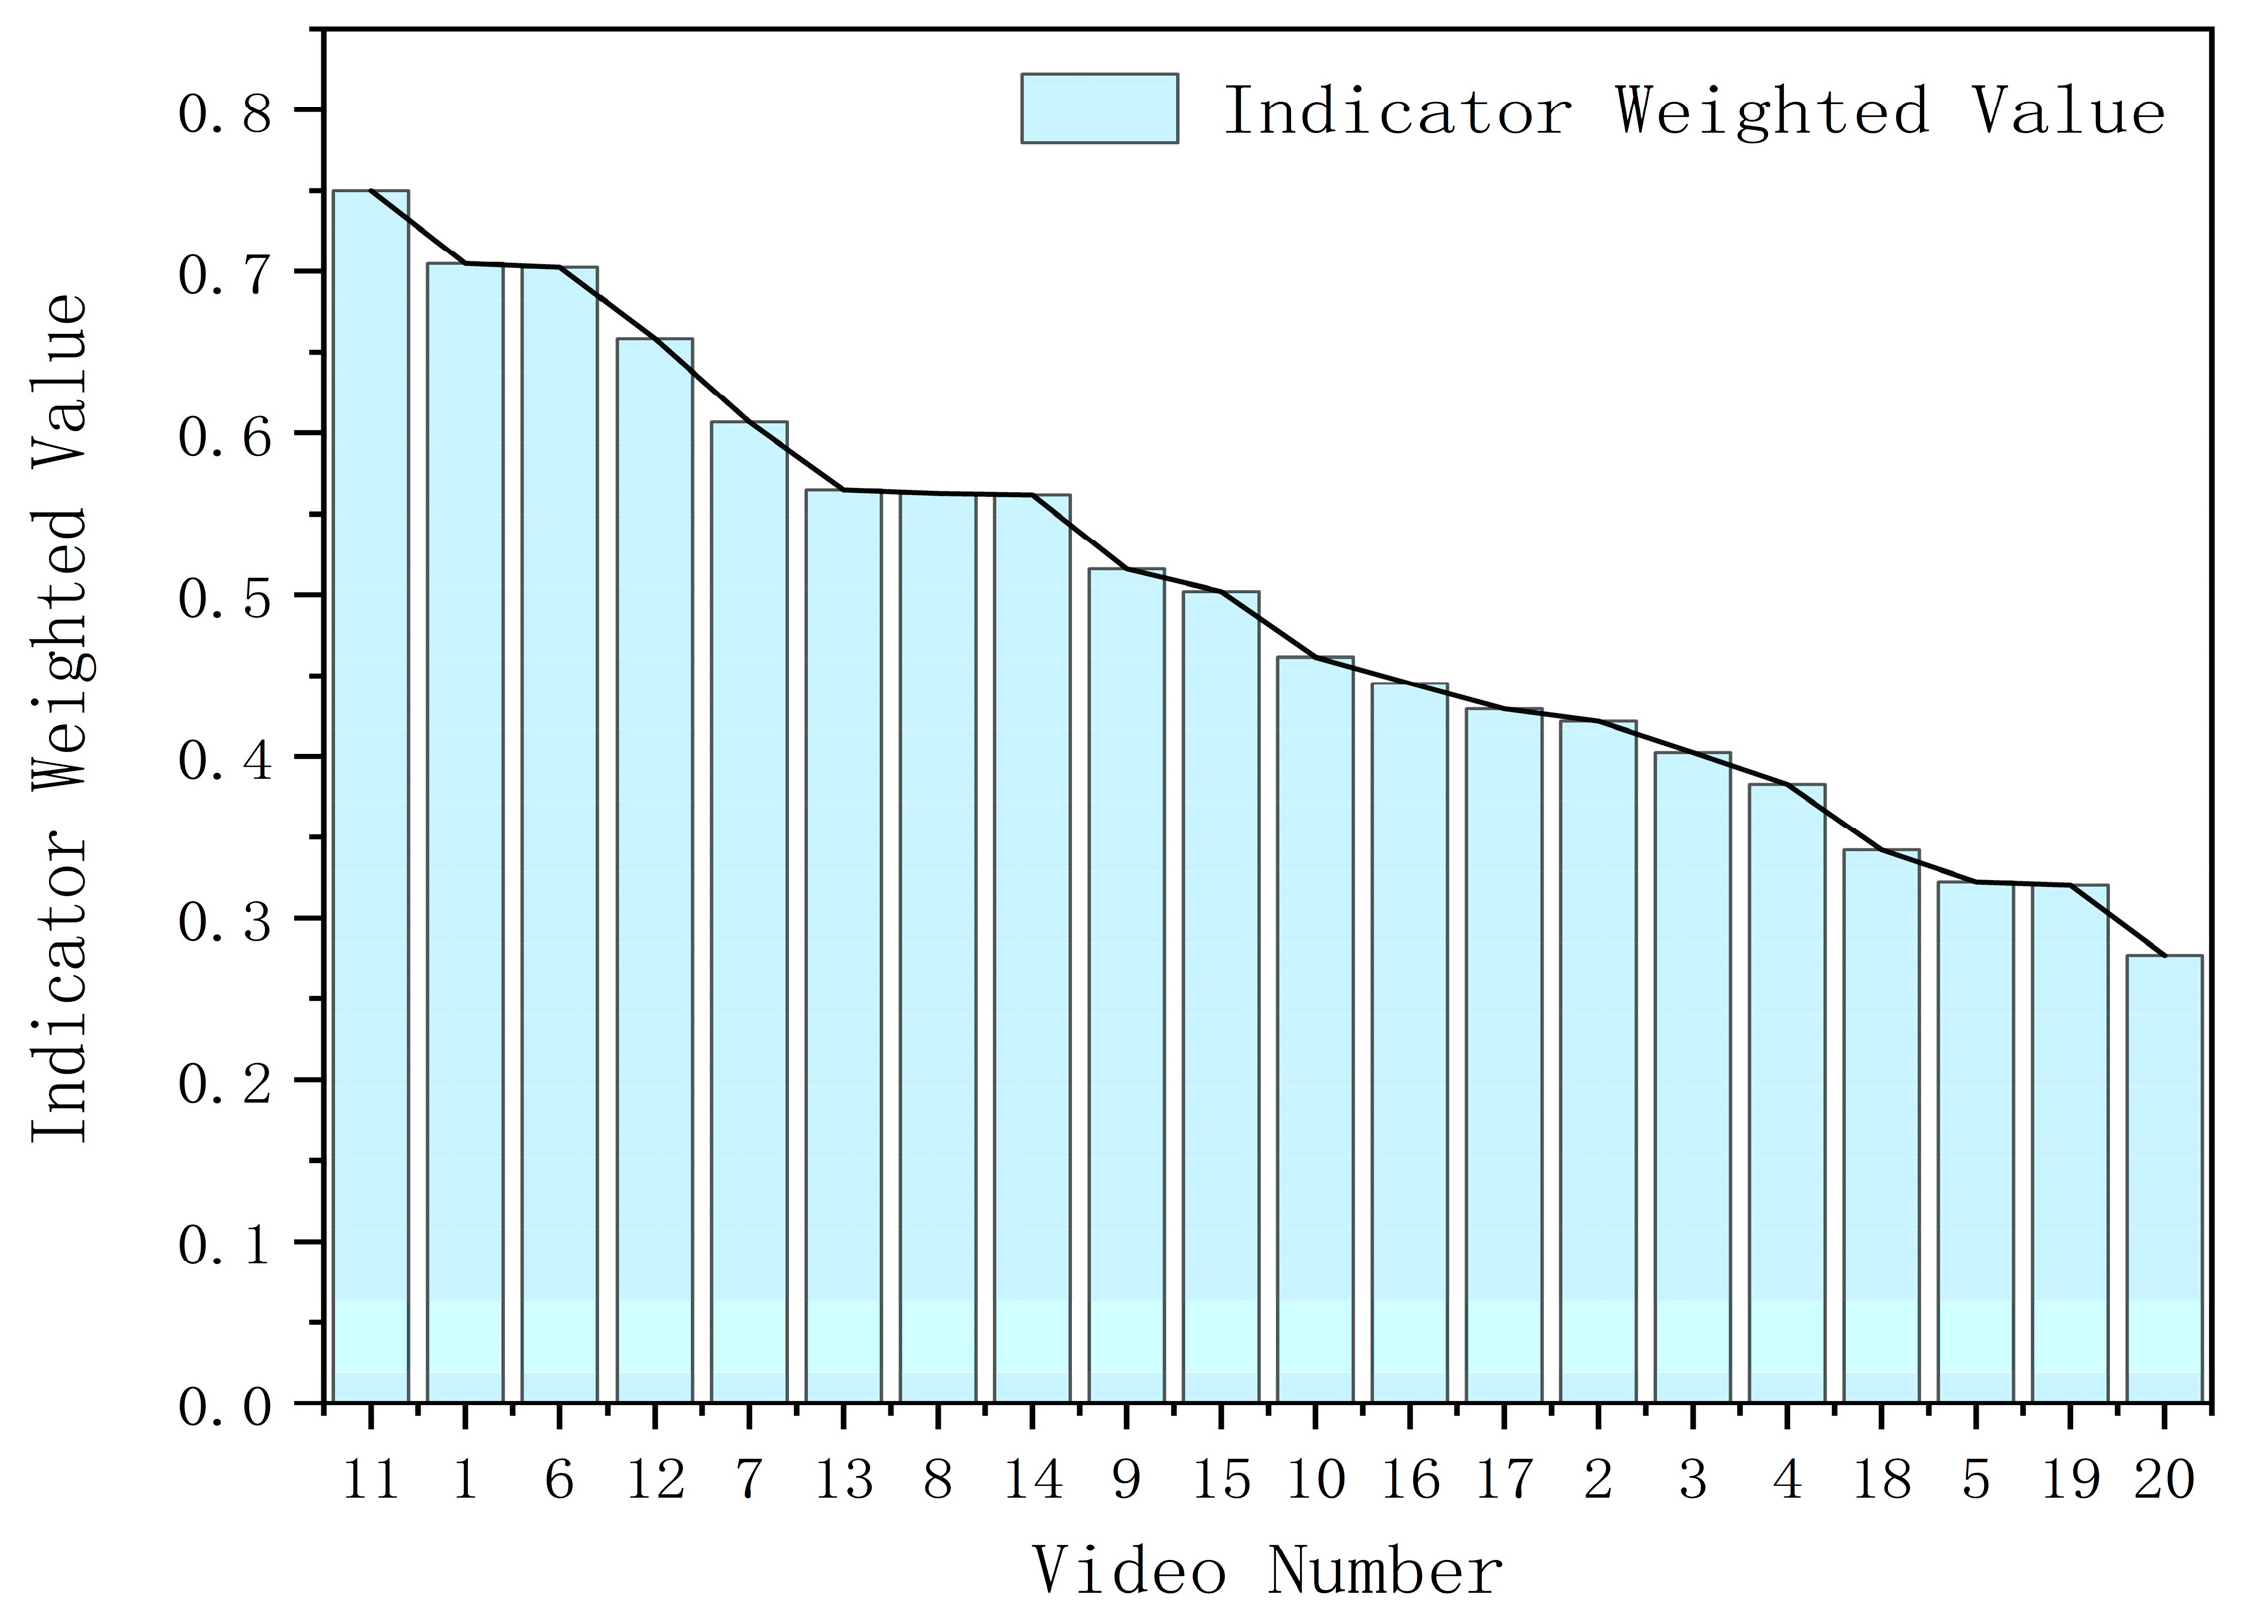
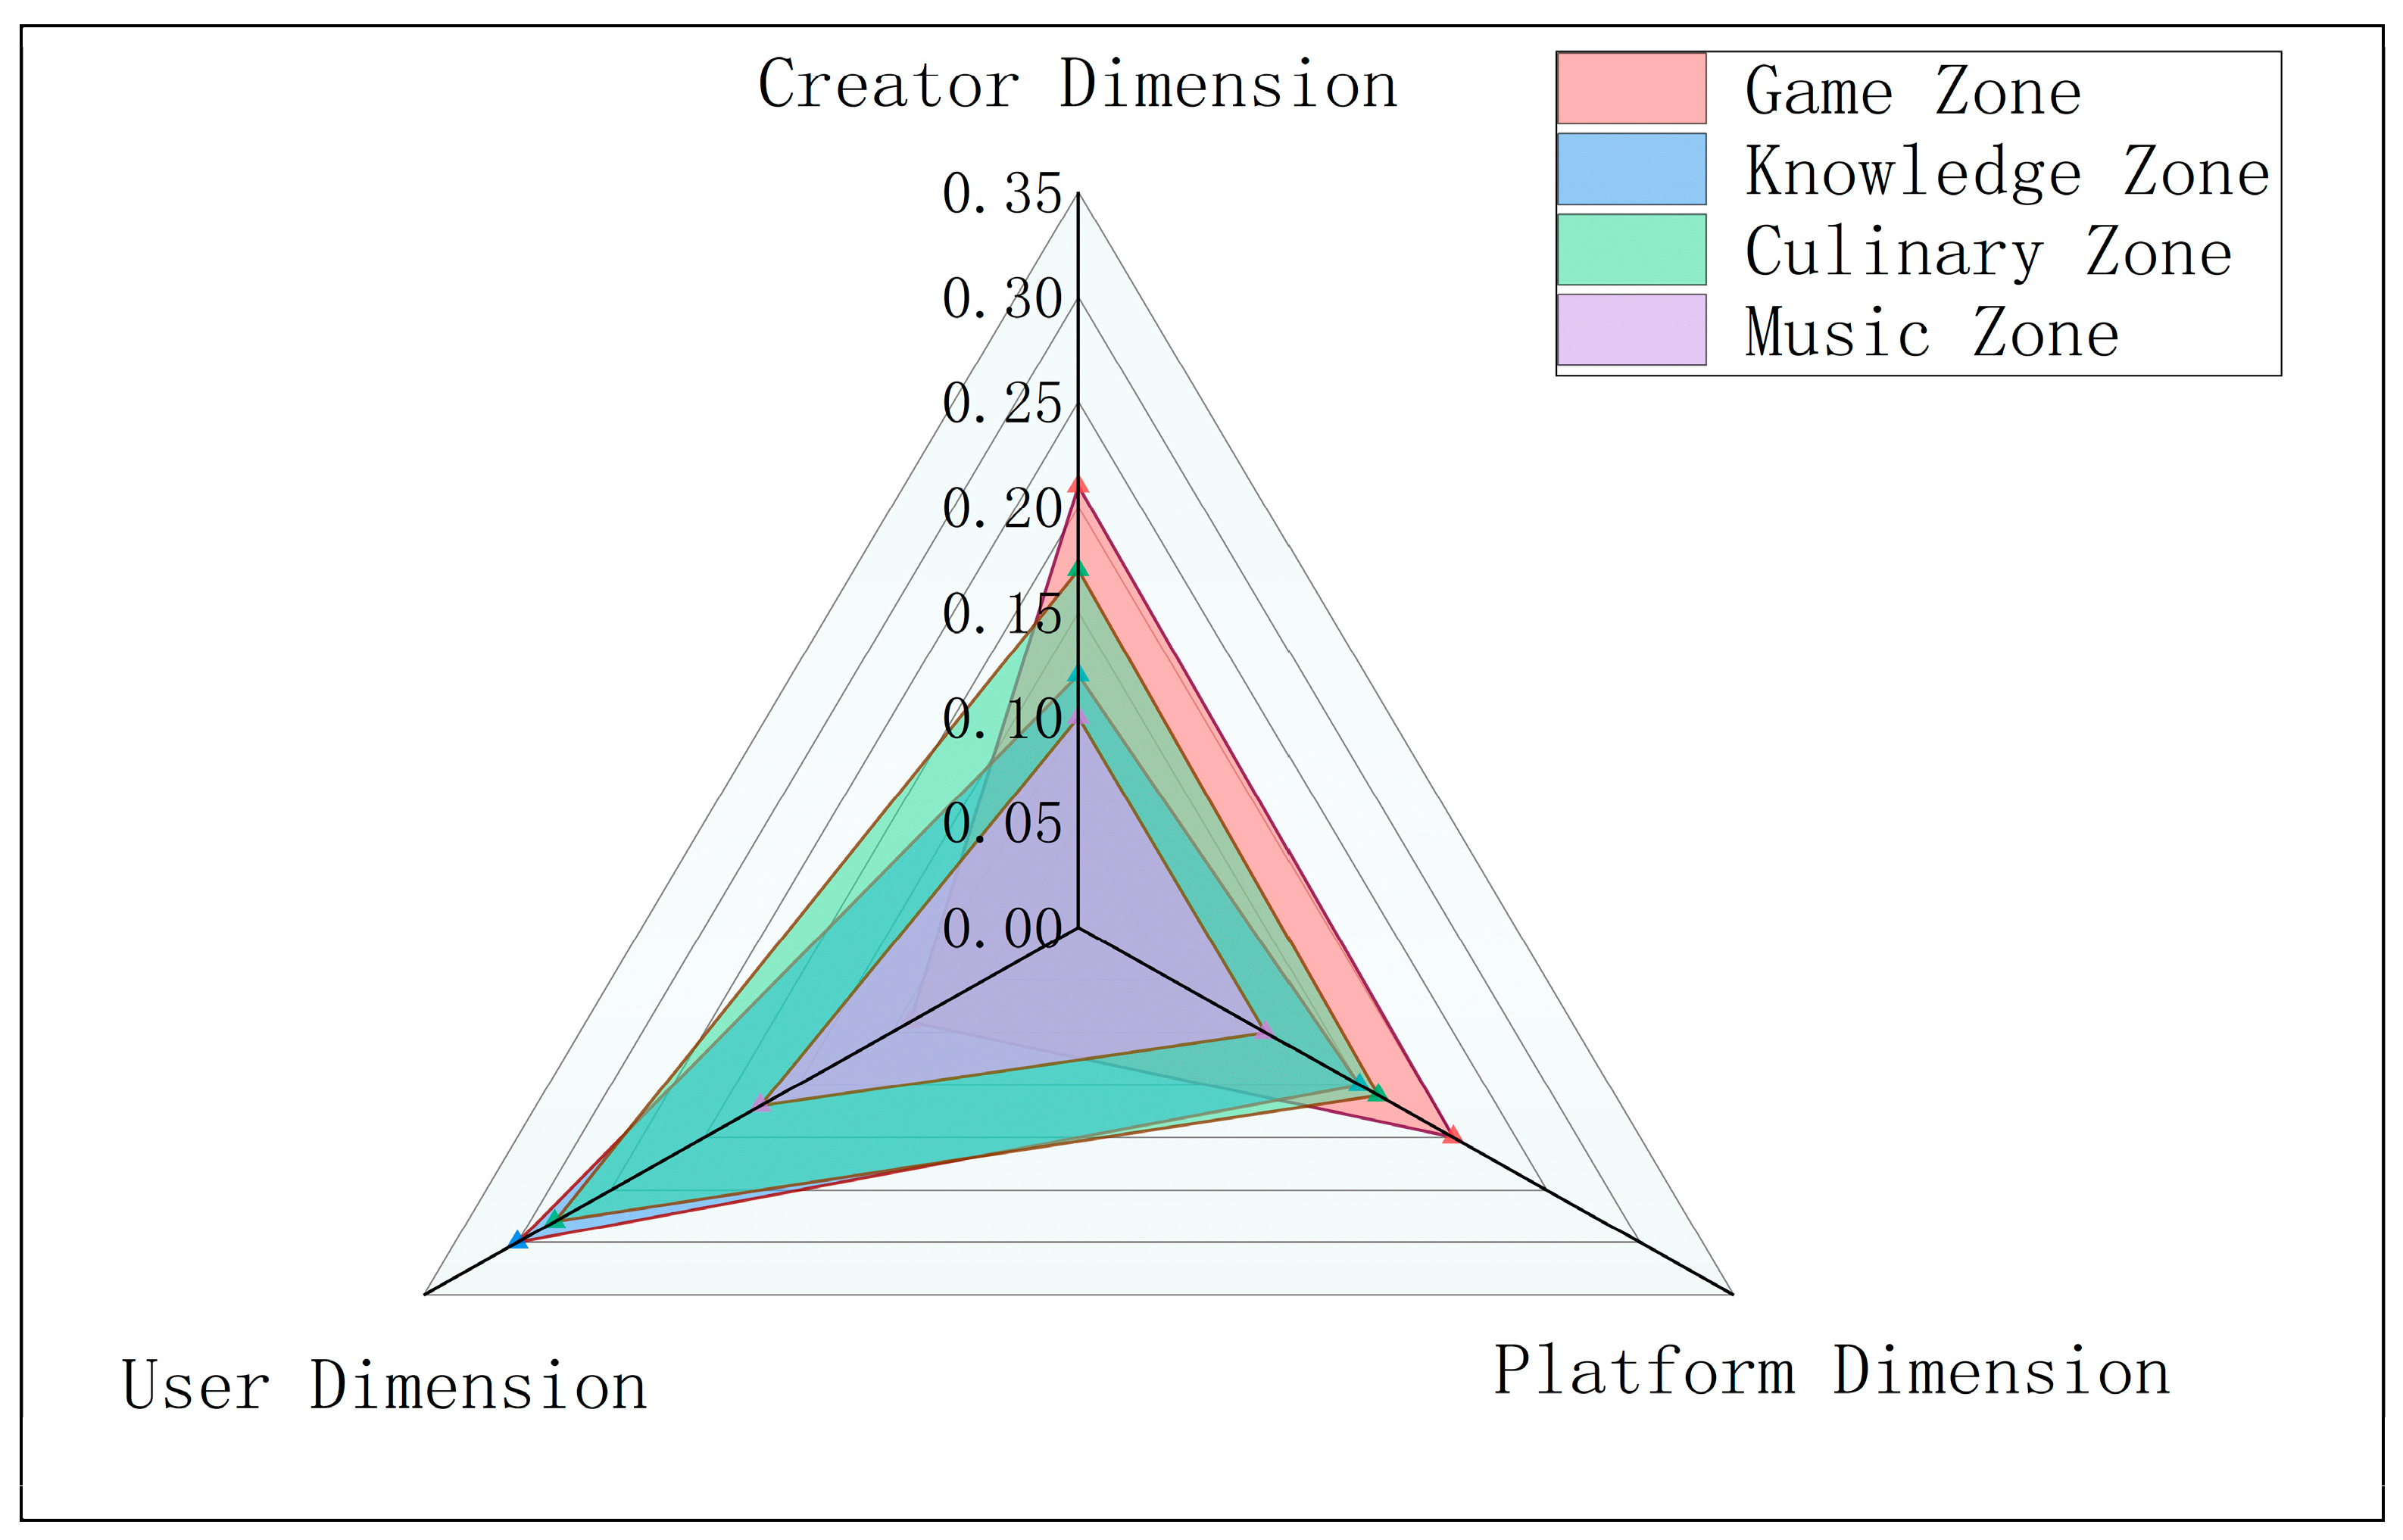
4.3.2. Analysis of Assessment Results
5. Discussion
6. Conclusions
Author Contributions
Funding
Institutional Review Board Statement
Informed Consent Statement
Data Availability Statement
Conflicts of Interest
References
- Liu, Y.; Chiu, D.K.W.; Ho, K.K.W. Short-form videos for public library marketing: Performance analytics of douyin in China. Appl. Sci. 2023, 13, 3386. [Google Scholar] [CrossRef]
- Li, L.; Dai, D.; Liu, H.; Yuan, Y.; Ding, L.; Xu, Y. Research on Short Video Hotspot Classification Based on LDA Feature Fusion and Improved BiLSTM. Appl. Sci. 2022, 12, 11902. [Google Scholar] [CrossRef]
- “2023 China Network Audiovisual Development Research Report” Released: Over 1 Billion Users in My Country Are Watching Short Videos. Available online: https://new.qq.com/rain/a/20230329A09P8200 (accessed on 2 March 2023).
- He, M.; Ma, C.; Wang, R. A Data-Driven Approach for University Public Opinion Analysis and Its Applications. Appl. Sci. 2022, 12, 9136. [Google Scholar] [CrossRef]
- Psallidas, T.; Koromilas, P.; Giannakopoulos, T.; Spyrou, E. Multimodal summarization of user-generated videos. Appl. Sci. 2021, 11, 5260. [Google Scholar] [CrossRef]
- Han, W. Research on Short Video Marketing Model in the New Media Era. In Proceedings of the 2022 International Conference on Comprehensive Art and Cultural Communication (CACC 2022), Online, 14 May 2022; Atlantis Press: Amsterdam, The Netherlands, 2022; pp. 195–198. [Google Scholar]
- Sun, W.; Min, X.; Lu, W.; Zhai, G. A deep learning based no-reference quality assessment model for UGC videos. In Proceedings of the 30th ACM International Conference on Multimedia, Lisboa, Portugal, 10–14 October 2022; pp. 856–865. [Google Scholar]
- Tu, Z.; Wang, Y.; Birkbeck, N.; Adsumilli, B.; Bovik, A.C. UGC-VQA: Benchmarking blind video quality assessment for user generated content. IEEE Trans. Image Process. 2021, 30, 4449–4464. [Google Scholar] [CrossRef]
- Nanne, A.J.; Antheunis, M.L.; Van Der Lee, C.G.; Postma, E.O.; Wubben, S.; Van Noort, G. The use of computer vision to analyze brand-related user generated image content. J. Interact. Mark. 2020, 50, 156–167. [Google Scholar] [CrossRef]
- Wang, Y.; Ke, J.; Talebi, H.; Yim, J.G.; Birkbeck, N.; Adsumilli, B.; Milanfar, P.; Yang, F. Rich features for perceptual quality assessment of UGC videos. In Proceedings of the IEEE/CVF Conference on Computer Vision and Pattern Recognition, Nashville, TN, USA, 20–25 June 2021; pp. 13435–13444. [Google Scholar]
- Su, S.; Yan, Q.; Zhu, Y.; Zhang, C.; Ge, X.; Sun, J.; Zhang, Y. Blindly Assess Image Quality in the Wild Guided by a Self-Adaptive Hyper Network. In Proceedings of the 2020 IEEE/CVF Conference on Computer Vision and Pattern Recognition (CVPR), Seattle, WA, USA, 13–19 June 2020; pp. 3664–3673. [Google Scholar]
- Meng, J.; Zhang, X.; Tan, X. Evaluation system of short video influence based on TOPSIS-Kmeans method. In Proceedings of the 2022 China Automation Congress (CAC), Xiamen, China, 25–27 November 2022; IEEE: Seattle, WA, USA, 2022; pp. 1989–1995. [Google Scholar]
- Chen, H.; Wang, M.; Zhang, Z. Research on rural landscape preference based on TikTok short video content and user comments. Int. J. Environ. Res. Public Health 2022, 19, 10115. [Google Scholar] [CrossRef]
- Yu, K.; Zhang, L.; Yang, S. Research on user satisfaction of mobile short video based on rough set. In Proceedings of the 2022 IEEE Asia-Pacific Conference on Image Processing, Electronics and Computers (IPEC), Dalian, China, 14–16 April 2022; IEEE: Seattle, WA, USA, 2022; pp. 211–215. [Google Scholar]
- Mohammad, J.; Quoquab, F.; Thurasamy, R.; Alolayyan, M.N. The effect of user-generated content quality on brand engagement: The mediating role of functional and emotional values. J. Electron. Commer. Res. 2020, 21, 39–55. [Google Scholar]
- Zhang, H.; Zhang, X.; Zhou, H.; Wang, X. Research on the evaluation of short video communication effect based on user preference and content characteristics. Libr. Inf. Serv. 2020, 64, 81. [Google Scholar]
- Cai, Q.; Tan, W. Box Office Forecast Model Based on Random Forest and BP Neural Network. In Proceedings of the 5th International Conference on Big Data Technologies, Qingdao, China, 23–25 September 2022; pp. 69–75. [Google Scholar]
- Manikandan, P.; Manimuthu, A.; Rajam, S. Prediction of YouTube View Count using Supervised and Ensemble Machine Learning Techniques. In Proceedings of the 2022 International Conference on Automation, Computing and Renewable Systems (ICACRS), Pudukkottai, India, 13–15 December 2022; IEEE: Seattle, WA, USA, 2022; pp. 1038–1042. [Google Scholar]
- Leszczuk, M.; Kobosko, M.; Nawała, J.; Korus, F.; Grega, M. “In the Wild” Video Content as a Special Case of User Generated Content and a System for Its Recognition. Sensors 2023, 23, 1769. [Google Scholar] [CrossRef]
- Rui, L.T.; Afif, Z.A.; Saedudin, R.D.R.; Mustapha, A.; Razali, N. A regression approach for prediction of Youtube views. Bull. Electr. Eng. Inform. 2019, 8, 1502–1506. [Google Scholar] [CrossRef]
- Gupta, V.; Diwan, A.; Chadha, C.; Khanna, A.; Gupta, D. Machine Learning enabled models for YouTube Ranking Mechanism and Views Prediction. arXiv 2022, arXiv:2211.11528. [Google Scholar]
- Mekouar, S.; Zrira, N.; Bouyakhf, E.H. Popularity prediction of videos in youtube as case study: A regression analysis study. In Proceedings of the 2nd International Conference on Big Data, Cloud and Applications, Tetouan, Morocco, 29–30 March 2017; pp. 1–6. [Google Scholar]
- Wu, X.; Tian, M.; Zhai, L. ICANet: A Method of Short Video Emotion Recognition Driven by Multimodal Data. arXiv 2022, arXiv:2208.11346. [Google Scholar]
- Ren, C.; Zhang, B. The factors of user emotion and behaviour solidification caused by information dissemination in network media. In Proceedings of the Second International Conference on Green Communication, Network, and Internet of Things (CNIoT 2022), Xiangtan, China, 8 March 2023; SPIE: Bellingham, WA, USA, 2023; Volume 12586, pp. 238–244. [Google Scholar]
- Yu, S.; He, S.; Cai, Z.; Lee, I.; Naseriparsa, M.; Xia, F. Exploring public sentiment during COVID-19: A Cross Country Analysis. IEEE Trans. Comput. Soc. Syst. 2022, 10, 1083–1094. [Google Scholar] [CrossRef]
- Wang, W.; Wei, T.; Yu, S.; Chen, J.; Yang, X. A Telecommuting Experience Service Design Decision Model Based on BP Neural Network. Psychol. Res. Behav. Manag. 2022, 15, 3147–3166. [Google Scholar] [CrossRef]
- Zhang, Z.; Luo, M.; Hu, Z.; Niu, H. Textual emotional tone and financial crisis identification in Chinese companies: A multi-source data analysis based on machine learning. Appl. Sci. 2022, 12, 6662. [Google Scholar] [CrossRef]
- Jia, F.; Chen, C.C. Emotional characteristics and time series analysis of Internet public opinion participants based on emotional feature words. Int. J. Adv. Robot. Syst. 2020, 17, 1729881420904213. [Google Scholar] [CrossRef]
- Li, H.; Chen, Q.; Zhong, Z.; Gong, R.; Han, G. E-word of mouth sentiment analysis for user behavior studies. Inf. Process. Manag. 2022, 59, 102784. [Google Scholar] [CrossRef]
- Jang, B.; Kim, M.; Harerimana, G.; Kang, S.U.; Kim, J.W. Bi-LSTM model to increase accuracy in text classification: Combining Word2vec CNN and attention mechanism. Appl. Sci. 2020, 10, 5841. [Google Scholar] [CrossRef]
- Khan, L.; Amjad, A.; Afaq, K.M.; Chang, H.-T. Deep sentiment analysis using CNN-LSTM architecture of English and Roman Urdu text shared in social media. Appl. Sci. 2022, 12, 2694. [Google Scholar] [CrossRef]
- Shaikh, S.; Daudpota, S.M.; Imran, A.S.; Kastrati, Z. Towards improved classification accuracy on highly imbalanced text dataset using deep neural language models. Appl. Sci. 2021, 11, 869. [Google Scholar] [CrossRef]
- Nazim, M.; Mohammad, C.W.; Sadiq, M. A comparison between fuzzy AHP and fuzzy TOPSIS methods to software requirements selection. Alex. Eng. J. 2022, 61, 10851–10870. [Google Scholar] [CrossRef]
- Gao, J.; Ren, H.; Cai, W. Inundation risk assessment based on G-DEMATEL-AHP and its application to Zhengzhou flooding disaster. Sustain. Cities Soc. 2022, 86, 104138. [Google Scholar]
- Wang, S.; Wei, G.; Lu, J.; Wu, J.; Wei, C.; Chen, X. GRP and CRITIC method for probabilistic uncertain linguistic MAGDM and its application to site selection of hospital constructions. Soft Comput. 2022, 26, 237–251. [Google Scholar] [CrossRef]
- Kumaran, S. Financial performance index of IPO firms using VIKOR-CRITIC techniques. Financ. Res. Lett. 2022, 47, 102542. [Google Scholar] [CrossRef]
- Bhadra, D.; Dhar, N.R.; Salam, M.A. Sensitivity analysis of the integrated AHP-TOPSIS and CRITIC-TOPSIS method for selection of the natural fiber. Mater. Today Proc. 2022, 56, 2618–2629. [Google Scholar] [CrossRef]
- Li, Y.; Shen, J.; Huang, M.; Peng, Z. Debris Flow Classification and Risk Assessment Based on Combination Weighting Method and Cluster Analysis: A Case Study of Debris Flow Clusters in Longmenshan Town, Pengzhou, China. Appl. Sci. 2023, 13, 7551. [Google Scholar] [CrossRef]
- Zhong, S.; Chen, Y.; Miao, Y. Using improved CRITIC method to evaluate thermal coal suppliers. Sci. Rep. 2023, 13, 195. [Google Scholar] [CrossRef] [PubMed]
- Bera, B.; Shit, P.K.; Sengupta, N.; Saha, S.; Bhattacharjee, S. Susceptibility of deforestation hotspots in Terai-Dooars belt of Himalayan Foothills: A comparative analysis of VIKOR and TOPSIS models. J. King Saud Univ.-Comput. Inf. Sci. 2022, 34, 8794–8806. [Google Scholar] [CrossRef]
- Zhong, X.; Cheng, Y.; Yang, J.; Tian, L. Evaluation and Optimization of In-Vehicle HUD Design by Applying an Entropy Weight-VIKOR Hybrid Method. Appl. Sci. 2023, 13, 3789. [Google Scholar] [CrossRef]
- Wang, J.; Ye, N.; Ge, L. Steady-state power quality synthetic evaluation based on the triangular fuzzy BW method and interval VIKOR method. Appl. Sci. 2020, 10, 2839. [Google Scholar] [CrossRef]
- Jin, B.; Liu, Z.; Qin, J. Two-stage real-time track correlation algorithm based on gray correlation. Acta Armamentarii 2020, 41, 1330. [Google Scholar]
- Cheng, Y.-T.; Liang, R.-Q.; Ho, M.-C.; Wu, C.-H. Sensory Evaluation of Low-Carbon City Tourism by Gray Relational Analysis. In Proceedings of the E3S Web of Conferences, Online, 13 January 2021; EDP Sciences: Les Ulis, France, 2021; Volume 228, p. 01003. [Google Scholar]
- Deng, C.; Yu, Q.; Luo, G.; Zhao, Z.; Li, Y. Big data-driven intelligent governance of college students’ physical health: System and strategy. Front. Public Health 2022, 10, 924025. [Google Scholar] [CrossRef]
- Qu, J. Research on Mobile learning in a teaching information service system based on a big data driven environment. Educ. Inf. Technol. 2021, 26, 6183–6201. [Google Scholar] [CrossRef]
- Xie, X.-Z.; Tsai, N.-C.; Xu, S.-Q.; Zhang, B.-Y. Does customer co-creation value lead to electronic word-of-mouth? An empirical study on the short-video platform industry. Soc. Sci. J. 2019, 56, 401–416. [Google Scholar] [CrossRef]
- Zhou, Q. Understanding User Behaviors of Creative Practice on Short Video Sharing Platforms—A Case Study of TikTok and Bilibili. Master’s Thesis, University of Cincinnati, Cincinnati, OH, USA, 2019. [Google Scholar]
- Kleinlein, R.; Luna-Jiménez, C.; Arias-Cuadrado, D.; Ferreiros, J.; Fernández-Martínez, F. Topic-oriented text features can match visual deep models of video memorability. Appl. Sci. 2021, 11, 7406. [Google Scholar] [CrossRef]
- Mustač, K.; Bačić, K.; Skorin-Kapov, L.; Sužnjević, M. Predicting player churn of a Free-to-Play mobile video game using supervised machine learning. Appl. Sci. 2022, 12, 2795. [Google Scholar] [CrossRef]
- Kaye, D.B.V.; Zeng, J.; Wikstrom, P. TikTok: Creativity and Culture in Short Video; John Wiley & Sons: Hoboken, NJ, USA, 2022. [Google Scholar]
- Bach, P.D. Bondy Valdovinos Kaye, Jing Zeng, and Patrik Wikström, TikTok: Creativity and Culture in Short Video. Int. J. Commun. 2023, 17, 3. [Google Scholar]
- Liu, X.; Liu, S.; Ma, Z. A Framework for Short Video Recognition Based on Motion Estimation and Feature Curves on SPD Manifolds. Appl. Sci. 2022, 12, 4669. [Google Scholar] [CrossRef]
- Zheng, C. Research on the flow experience and social influences of users of short online videos. A case study of DouYin. Sci. Rep. 2023, 13, 3312. [Google Scholar] [CrossRef]
- Deng, D.S.; Seo, S.; Li, Z.; Austin, E.W. What people TikTok (Douyin) about influencer-endorsed short videos on wine? An exploration of gender and generational differences. J. Hosp. Tour. Technol. 2022, 13, 683–698. [Google Scholar] [CrossRef]
- Cao, S.; Foth, M.; Powell, W.; McQueenie, J. What are the effects of short video storytelling in delivering Blockchain-credentialed Australian beef products to China? Foods 2021, 10, 2403. [Google Scholar] [CrossRef] [PubMed]
- de Araújo, T.P.; de Moraes, M.; Afonso, C.; Rodrigues, S. Food and nutrition literacy: An education booklet and video on ultra-processed food. Eur. J. Public Health 2021, 31 (Suppl. S3), ckab164.221. [Google Scholar]
- Li, J.; Li, C.; Liu, J.; Zhang, J.; Zhuo, L.; Wang, M. Personalized mobile video recommendation based on user preference modeling by deep features and social tags. Appl. Sci. 2019, 9, 3858. [Google Scholar] [CrossRef]
- Becerra Martinez, H.; Hines, A.; Farias, M.C.Q. Perceptual quality of audio-visual content with common video and audio degradations. Appl. Sci. 2021, 11, 5813. [Google Scholar] [CrossRef]
- Surís, D.; Vondrick, C.; Russell, B.; Salamon, J. It’s Time for Artistic Correspondence in Music and Video. In Proceedings of the IEEE/CVF Conference on Computer Vision and Pattern Recognition, New Orleans, LA, USA, 18–24 June 2022; pp. 10564–10574. [Google Scholar]
- Vernallis, C. The aesthetics of music video: An analysis of Madonna’s ‘Cherish’. Pop. Music 1998, 17, 153–185. [Google Scholar] [CrossRef]
- Wang, W.; Wu, J. Research Perspectives on TikTok & Its Legacy Apps| Short Video Platforms and Local Community Building in China. Int. J. Commun. 2021, 15, 23. [Google Scholar]
- Mystakidis, S.; Filippousis, G.; Tolis, D.; Tseregkouni, E. Playful metaphors for narrative-driven e-learning. Appl. Sci. 2021, 11, 11682. [Google Scholar] [CrossRef]


| Theme Clusters | Theme Clusters | Clustered Entities | Clustering Renaming | Accuracy | Recall Rate | F1 |
|---|---|---|---|---|---|---|
| Cluster 1: UGC short video revenue category | 15 | Work revenue, profit model, economic benefits, income, realization strategy, etc. | Creating financial returns | 0.6236 | 0.4831 | 0.5341 |
| Cluster 2: Number of fans category | 21 | Number of fans, growth, number of opinion leaders, popularity, user activity, etc. | Fan popularity | 0.6738 | 0.4496 | 0.5869 |
| Cluster 3: Platform interaction category | 37 | Social interaction, social networking, information interaction, user experience, user engagement, etc. | Frequency of interaction | 0.7124 | 0.5489 | 0.6134 |
| Cluster 4: Platform dissemination category | 24 | Web communication, social media marketing, media effect, brand communication, brand promotion, etc. | Information reprint volume | 0.6807 | 0.5274 | 0.5826 |
| Cluster 5: Cultural content category | 35 | Cultural communication, cultural responsibility, cultural values, cultural identity, cultural innovation, cultural creativity, etc. | Cultural carrying capacity | 0.6471 | 0.5109 | 0.5316 |
| Cluster 6: Knowledge category | 63 | Learning, knowledge points, cognition, knowledge transformation, knowledge, knowledge sharing, etc. | Knowledgeable | 0.7201 | 0.4562 | 0.5401 |
| Cluster 7: Skill category | 28 | Skill development, practicality, vocational competence, practical technology, skill demand, etc. | Skillfulness | 0.6329 | 0.5368 | 0.6339 |
| Cluster 8: Culture category | 42 | Cultural history, cultural heritage, cultural symbols, cultural awareness, cultural, cultural innovation, cultural expression, cultural construction, etc. | Cultural identity | 0.6893 | 0.4697 | 0.5243 |
| Cluster 9: Community category | 36 | Community management, community building, community culture, social network, community culture, etc. | Community identity | 0.6472 | 0.5197 | 0.5695 |
| Cluster 10: Audiovisual category | 61 | Audio-visual production, music composition, picture composition, editing techniques, video shooting, audio post-production, etc. | Audiovisuality | 0.7452 | 0.5518 | 0.5879 |
| Cluster 11: Fun category | 27 | Fun, entertaining, aesthetic interest, fun communication, fun experience, etc. | Fun | 0.7125 | 0.5156 | 0.6451 |
| Tier 1 Indicators | Secondary Indicators | Tertiary Indicators | Variables | Explanation of Indicators | Measurement Method |
|---|---|---|---|---|---|
| Creators Dimension | Domain visibility | Fan popularity | X1 | Reflects the increased visibility that the release of the video brings to the creator | Number of new followers of the creator after the content is published |
| Content revenue | Creating financial returns | X2 | Reflects the financial return that creators receive from content distribution platforms for newly created content | Total financial return to creators from content distribution platforms for newly created content | |
| Platform Dimension | Internal interaction power | Frequency of interaction | X3 | Reflecting users’ interactive behavior on original videos with the help of the platform, thus further releasing the vitality of the platform | Total number of interactive behaviors such as user retweeting and collecting UGC short videos |
| External Influence | Information reprint volume | X4 | Reflecting UGC videos are reported by third-party platforms with their own quality value, bringing influence to the platform | Total number of UGC short videos retweeted and reported by other platforms | |
| Ideology Leadership | Cultural carrying capacity | X5 | Reflecting UGC short videos to spread cultural content and help platform awareness leadership | Frequency of “culture”-related feature words in UGC short video content | |
| User Dimension | Perceived usefulness | Knowledgeable | X6 | Reflecting UGC short video content can meet users’ knowledge needs | Sentiment value of feature sentences related to “knowledge” in user comments |
| Skillfulness | X7 | Reflecting that UGC short videos can bring users practical skills to improve | Sentiment value of “skillfulness” in user comments | ||
| Perceptual identity | Cultural identity | X8 | Reflecting UGC short videos to improve users’ cultural literacy | Sentiment value of “culture”-related special testimonials in user comments | |
| Community identity | X9 | Reflecting the inner sense of belonging that UGC short videos bring to users in the platform community | Sentiment value of “community” related sentences in user comments | ||
| Perceptual entertainment | Audiovisuality | X10 | Reflecting that UGC short videos can meet users’ entertainment needs in terms of audio and visual | Sentiment value of the special evidence sentences related to “audiovisuality” in user comments | |
| Fun | X11 | Reflecting UGC short video content and its presentation has the quality of attracting viewers’ interest and human touch, which can meet users’ interesting needs | The sentiment value of the special testimonials related to “interesting” in user comments |
| Video Zone | Number | Video Name |
|---|---|---|
| Game Zone | 1 | [Genshin impact] 3.0 Sumeru treasure chest full collection (achievement number 572) |
| 2 | Werewolf Fool | |
| 3 | Bad guys 2 | |
| 4 | Sheep Village (1) | |
| 5 | Werewolf Silly 2 | |
| Knowledge Zone | 6 | What crime was involved in the outrageous Tangshan beating case? |
| 7 | [Liang Ji biological identification] network hot biological identification 38 | |
| 8 | How to skin care for men? I Two steps to solve 90% of the skin problems | |
| 9 | What colony wants a suzerain state to beg for independence? [Odd little country 32] | |
| 10 | [Half Buddha] To live is to simmer; to live is everything | |
| Culinary Zone | 11 | Spend 7 days making a piece of meat! Come in and feel what indulgence means! |
| 12 | Wanzhou Roasted Fish Expo Cook’s Visit ¥217 | |
| 13 | One of the top 10 buffets in the world! What is the experience of eating 7 days and 7 nights on a luxury cruise | |
| 14 | After delivering takeout to this soccer team, I broke down. | |
| 15 | This may be the world’s best food prison! UP for food went to prison | |
| Music Zone | 16 | “Please bury me in, in that geography”. |
| 17 | “Myopia, every day is a gamble” | |
| 18 | “It’s easy to hide from the open gun, but it’s hard to defend against secret love”. | |
| 19 | A good day ends with a brush in this video | |
| 20 | Reenactment of the classic handheld game “Temple Run” sound effects! [MayTreeMayTree] |
| Video Number | Knowledgeable | Skillfulness | Cultural Identity | Community Identity | Audiovisuality | Fun |
|---|---|---|---|---|---|---|
| 1 | 0.625 | 0.512 | 0.41 | 0.856 | 0.766 | 0.899 |
| 2 | 0.213 | 0.32 | 0.125 | 0.812 | 0.782 | 0.785 |
| 3 | 0.12 | 0.23 | 0.216 | 0.8 | 0.654 | 0.725 |
| 4 | 0.36 | 0.16 | 0.149 | 0.824 | 0.684 | 0.763 |
| 5 | 0.1 | 0.16 | 0.127 | 0.743 | 0.755 | 0.749 |
| 6 | 0.864 | 0.886 | 0.452 | 0.846 | 0.672 | 0.659 |
| 7 | 0.756 | 0.824 | 0.654 | 0.754 | 0.549 | 0.632 |
| 8 | 0.8 | 0.795 | 0.439 | 0.632 | 0.523 | 0.771 |
| 9 | 0.694 | 0.721 | 0.359 | 0.755 | 0.421 | 0.645 |
| 10 | 0.765 | 0.751 | 0.548 | 0.721 | 0.439 | 0.663 |
| 11 | 0.213 | 0.123 | 0.659 | 0.522 | 0.895 | 0.645 |
| 12 | 0.156 | 0.278 | 0.644 | 0.439 | 0.862 | 0.752 |
| 13 | 0.42 | 0.321 | 0.721 | 0.325 | 0.821 | 0.712 |
| 14 | 0.126 | 0.11 | 0.664 | 0.267 | 0.793 | 0.6 |
| 15 | 0.249 | 0.15 | 0.545 | 0.545 | 0.766 | 0.645 |
| 16 | 0.521 | 0.645 | 0.894 | 0.751 | 0.64 | 0.756 |
| 17 | 0.623 | 0.546 | 0.887 | 0.669 | 0.554 | 0.754 |
| 18 | 0.324 | 0.325 | 0.756 | 0.743 | 0.61 | 0.69 |
| 19 | 0.632 | 0.469 | 0.845 | 0.62 | 0.557 | 0.61 |
| 20 | 0.559 | 0.477 | 0.76 | 0.6 | 0.68 | 0.68 |
| Tertiary Indicators | CRITIC Objective Weights | AHP Subjective Weights | Portfolio Weights |
|---|---|---|---|
| Fan popularity | 0.0604 | 0.0870 | 0.0564 |
| Creating financial returns | 0.0603 | 0.0663 | 0.0429 |
| Frequency of interaction | 0.0847 | 0.0902 | 0.0820 |
| Information reprint volume | 0.0676 | 0.0657 | 0.0477 |
| Cultural carrying capacity | 0.1049 | 0.0730 | 0.0822 |
| Knowledgeable | 0.1020 | 0.1322 | 0.1447 |
| Skillfulness | 0.0995 | 0.1469 | 0.1568 |
| Cultural identity | 0.1368 | 0.1018 | 0.1495 |
| Community identity | 0.0750 | 0.0535 | 0.0431 |
| Audiovisuality | 0.1358 | 0.0764 | 0.1114 |
| Fun | 0.0724 | 0.1064 | 0.0827 |
Disclaimer/Publisher’s Note: The statements, opinions and data contained in all publications are solely those of the individual author(s) and contributor(s) and not of MDPI and/or the editor(s). MDPI and/or the editor(s) disclaim responsibility for any injury to people or property resulting from any ideas, methods, instructions or products referred to in the content. |
© 2023 by the authors. Licensee MDPI, Basel, Switzerland. This article is an open access article distributed under the terms and conditions of the Creative Commons Attribution (CC BY) license (https://creativecommons.org/licenses/by/4.0/).
Share and Cite
Fang, J.; Ni, Y.; Zhang, J. Value Assessment of UGC Short Videos through Element Mining and Data Analysis. Appl. Sci. 2023, 13, 9418. https://doi.org/10.3390/app13169418
Fang J, Ni Y, Zhang J. Value Assessment of UGC Short Videos through Element Mining and Data Analysis. Applied Sciences. 2023; 13(16):9418. https://doi.org/10.3390/app13169418
Chicago/Turabian StyleFang, Jinyu, Yuan Ni, and Jian Zhang. 2023. "Value Assessment of UGC Short Videos through Element Mining and Data Analysis" Applied Sciences 13, no. 16: 9418. https://doi.org/10.3390/app13169418