
Deep Learning-Based Classification of High-Resolution Satellite Images for Mangrove Mapping


Abstract
:1. Introduction
2. Materials and Methods
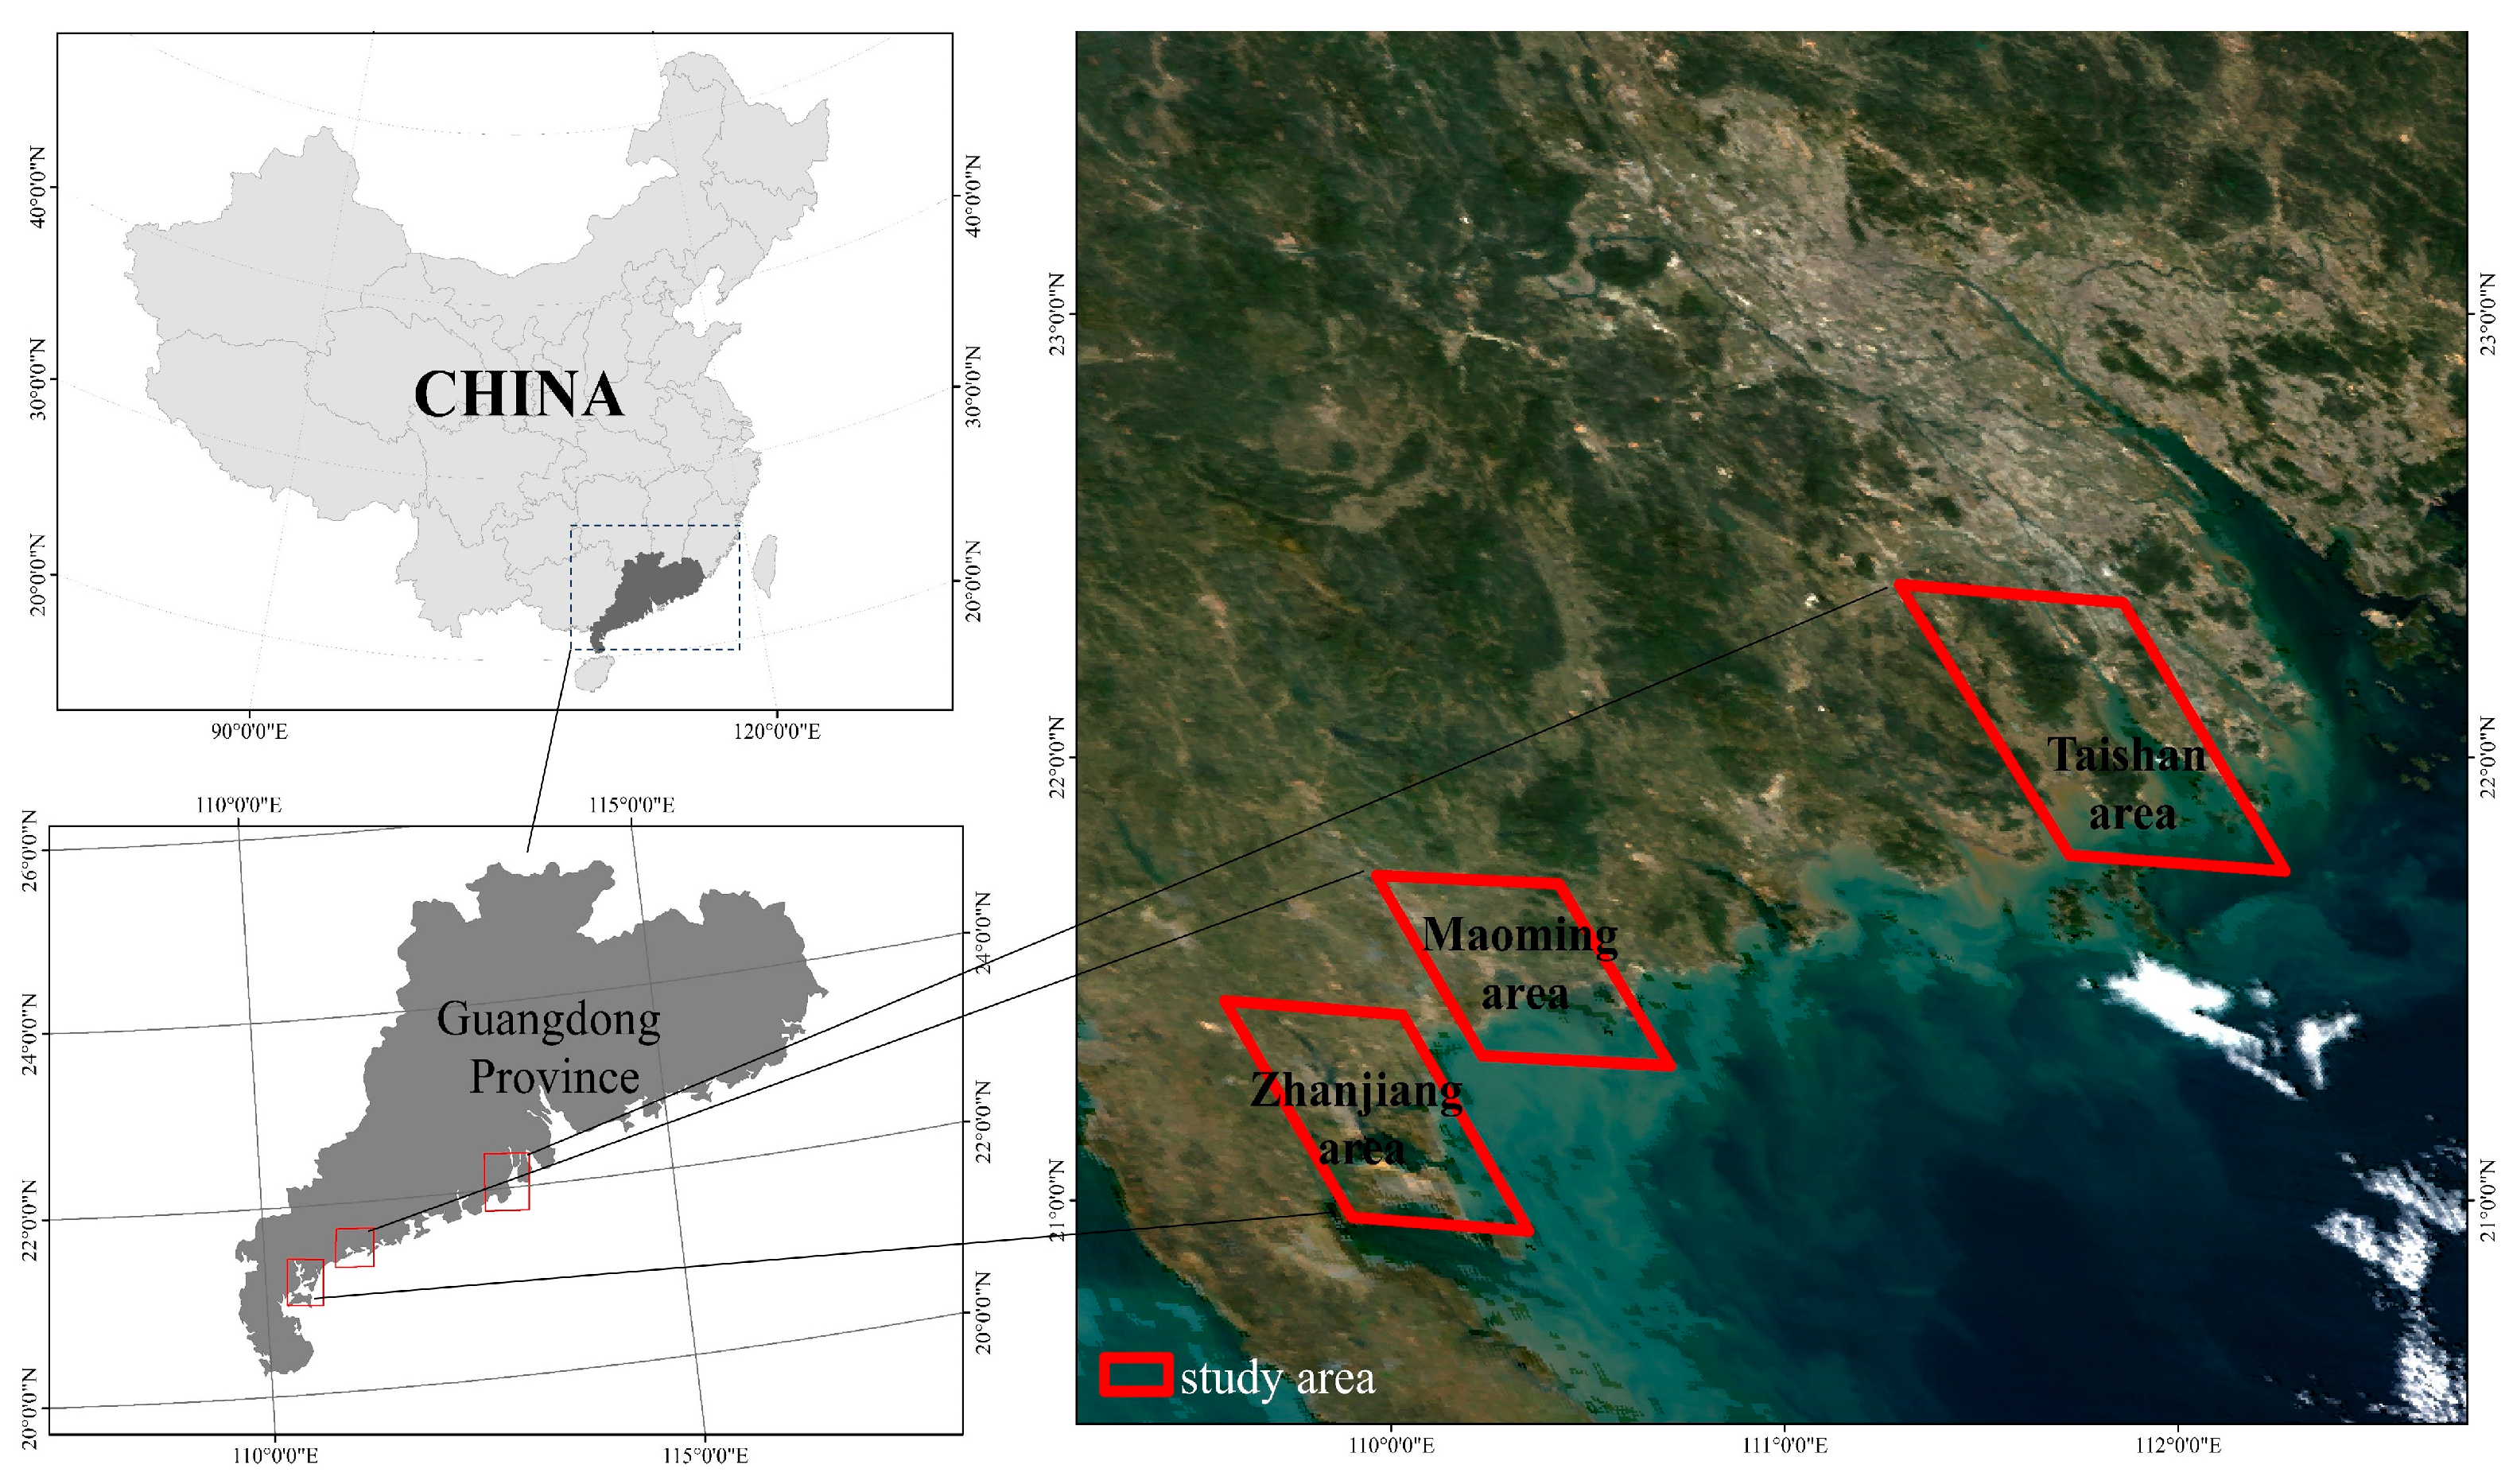
2.1. Study Area
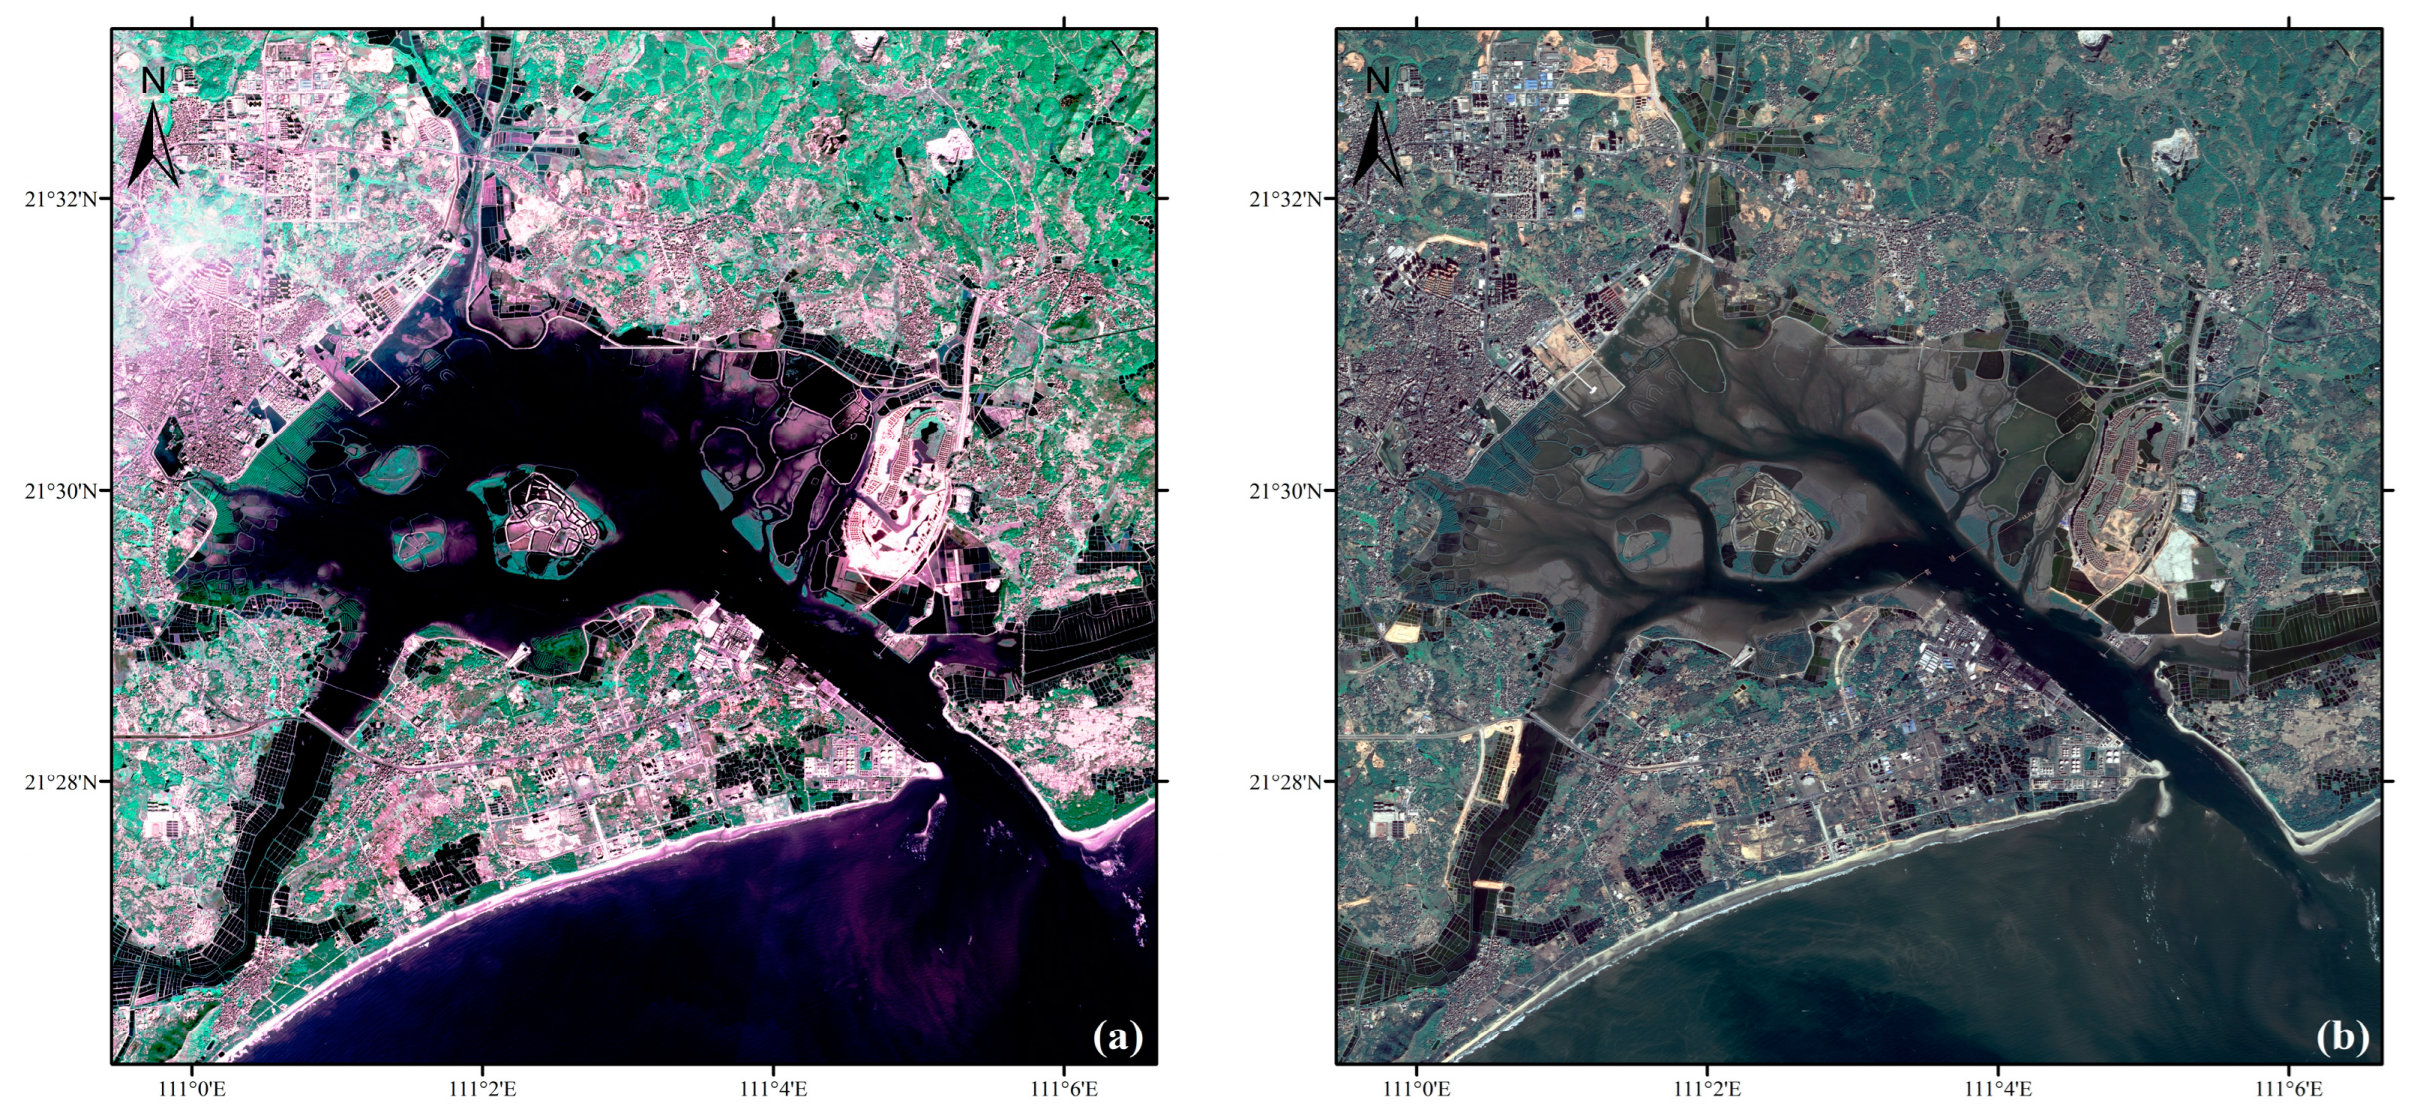
2.2. Satellite Data
2.3. Attention U2-Net Model for Mangrove Detection
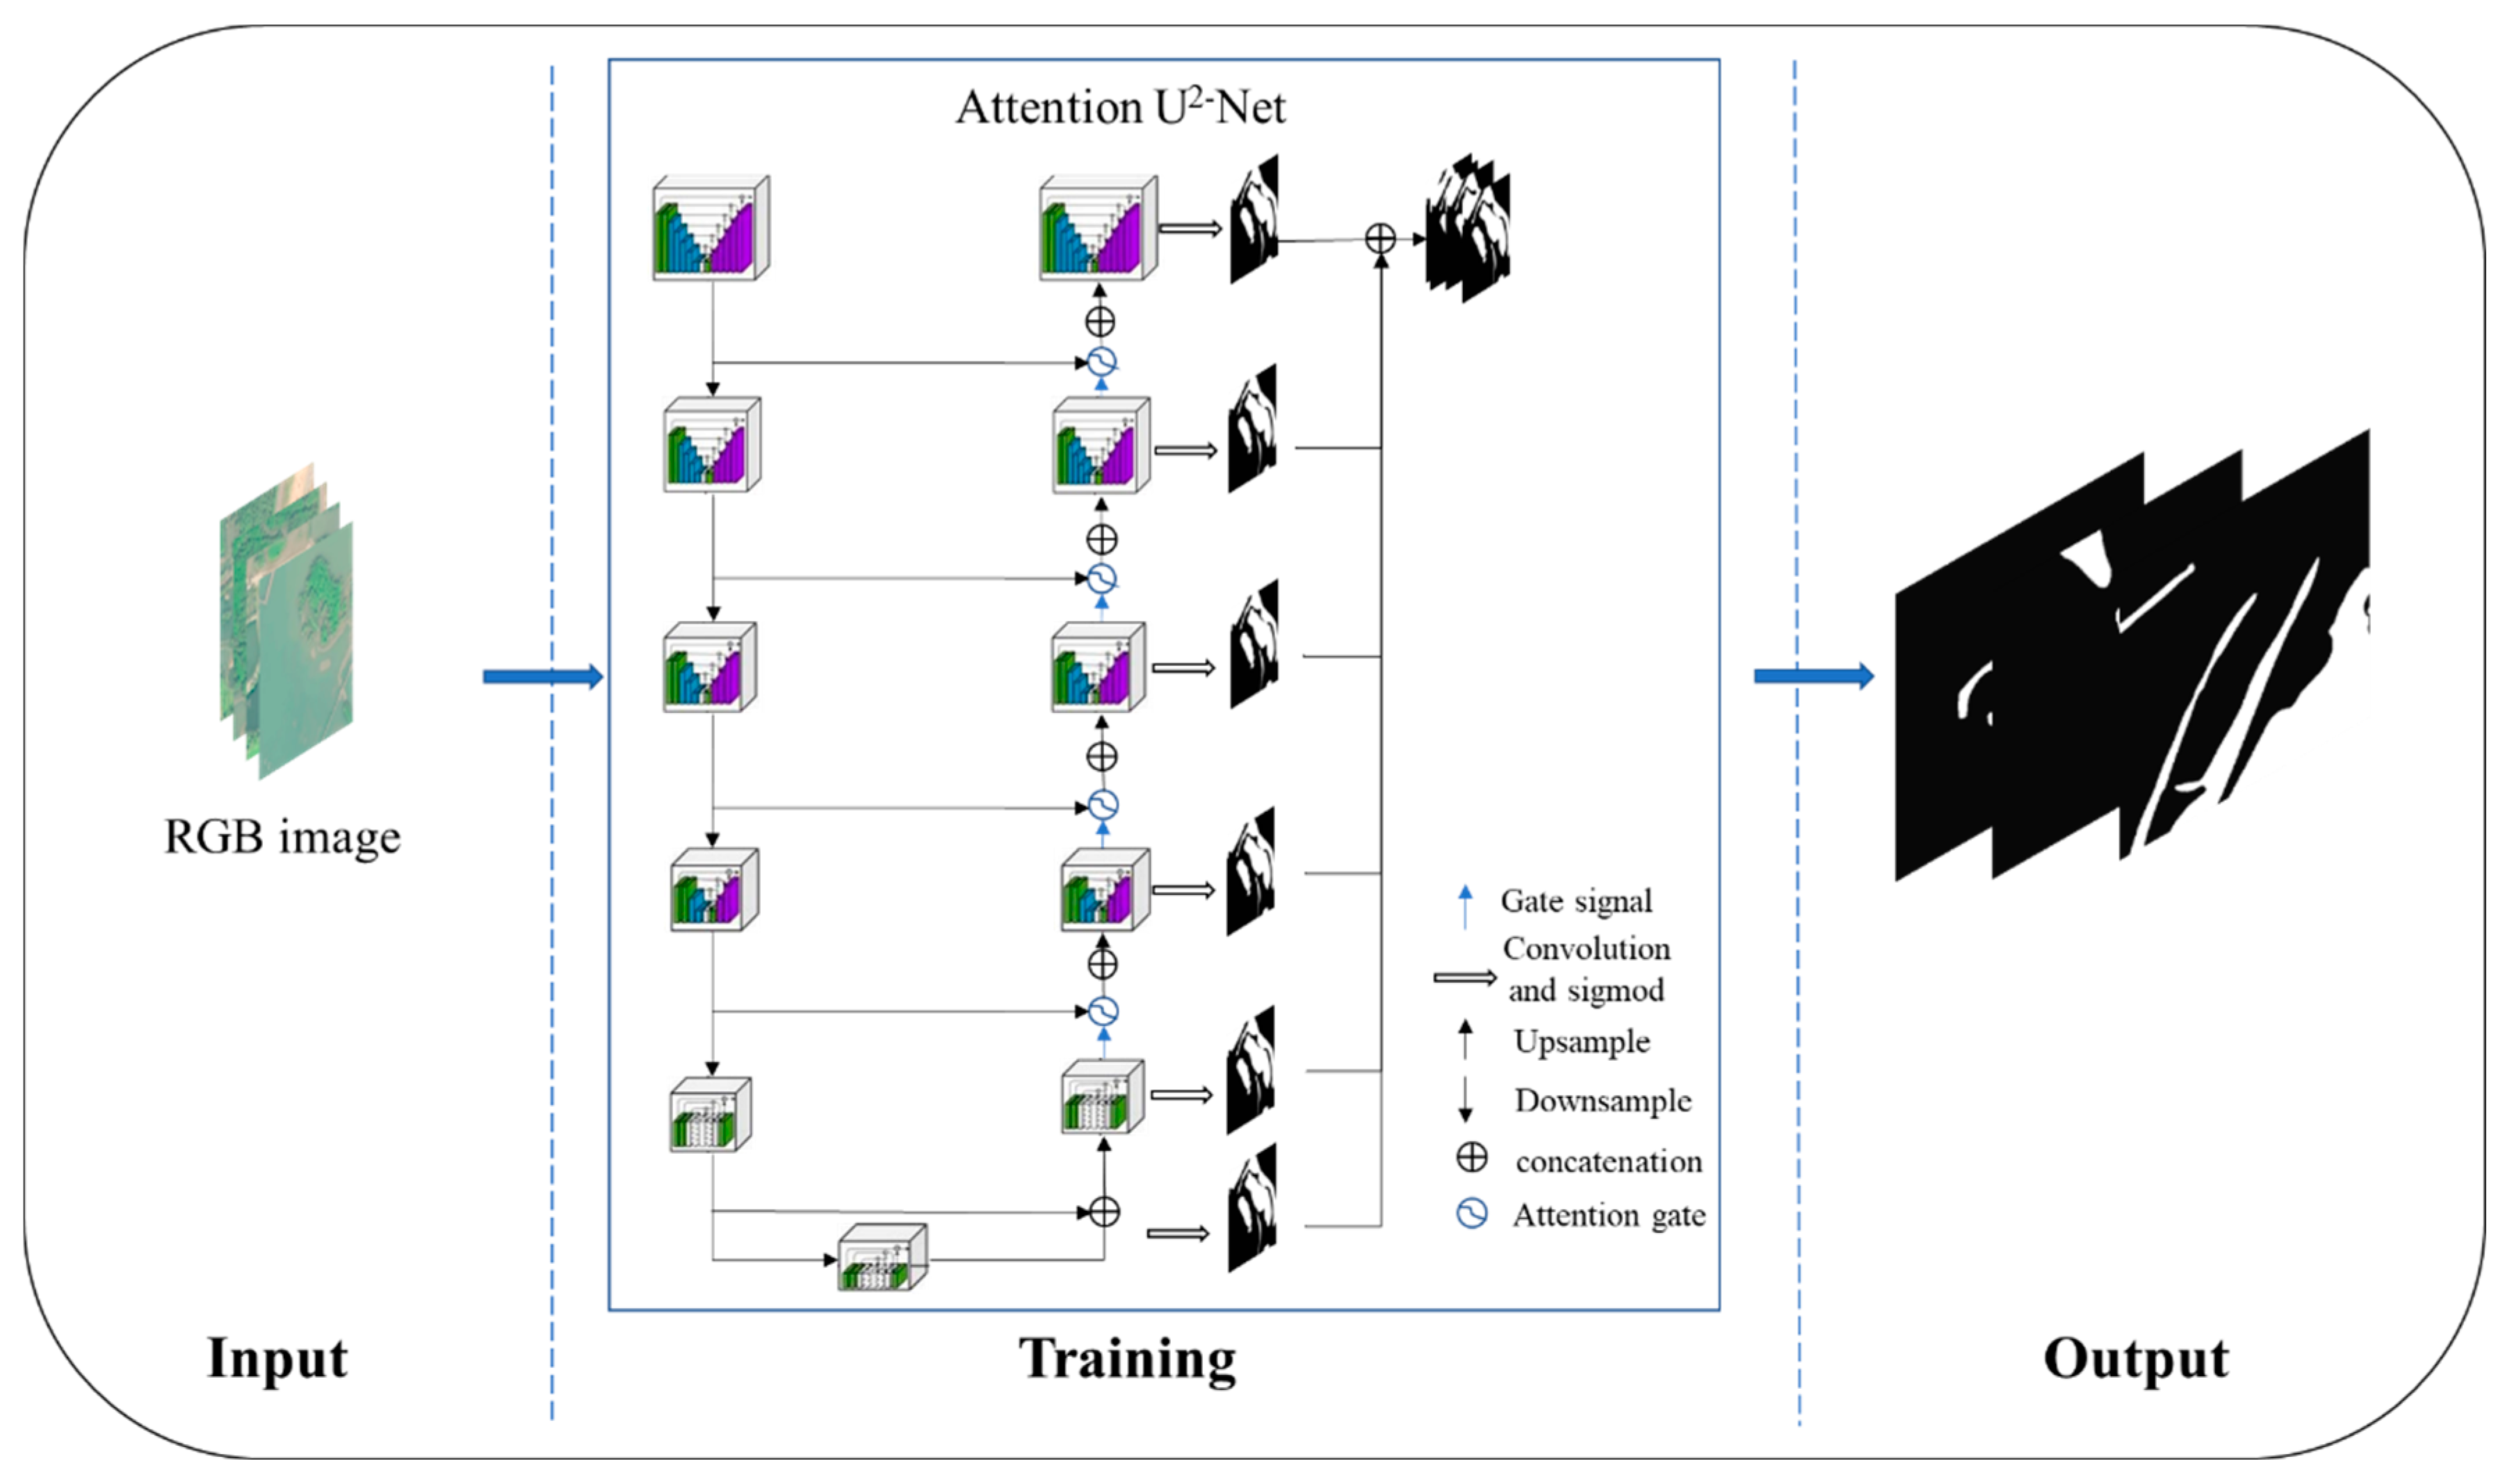
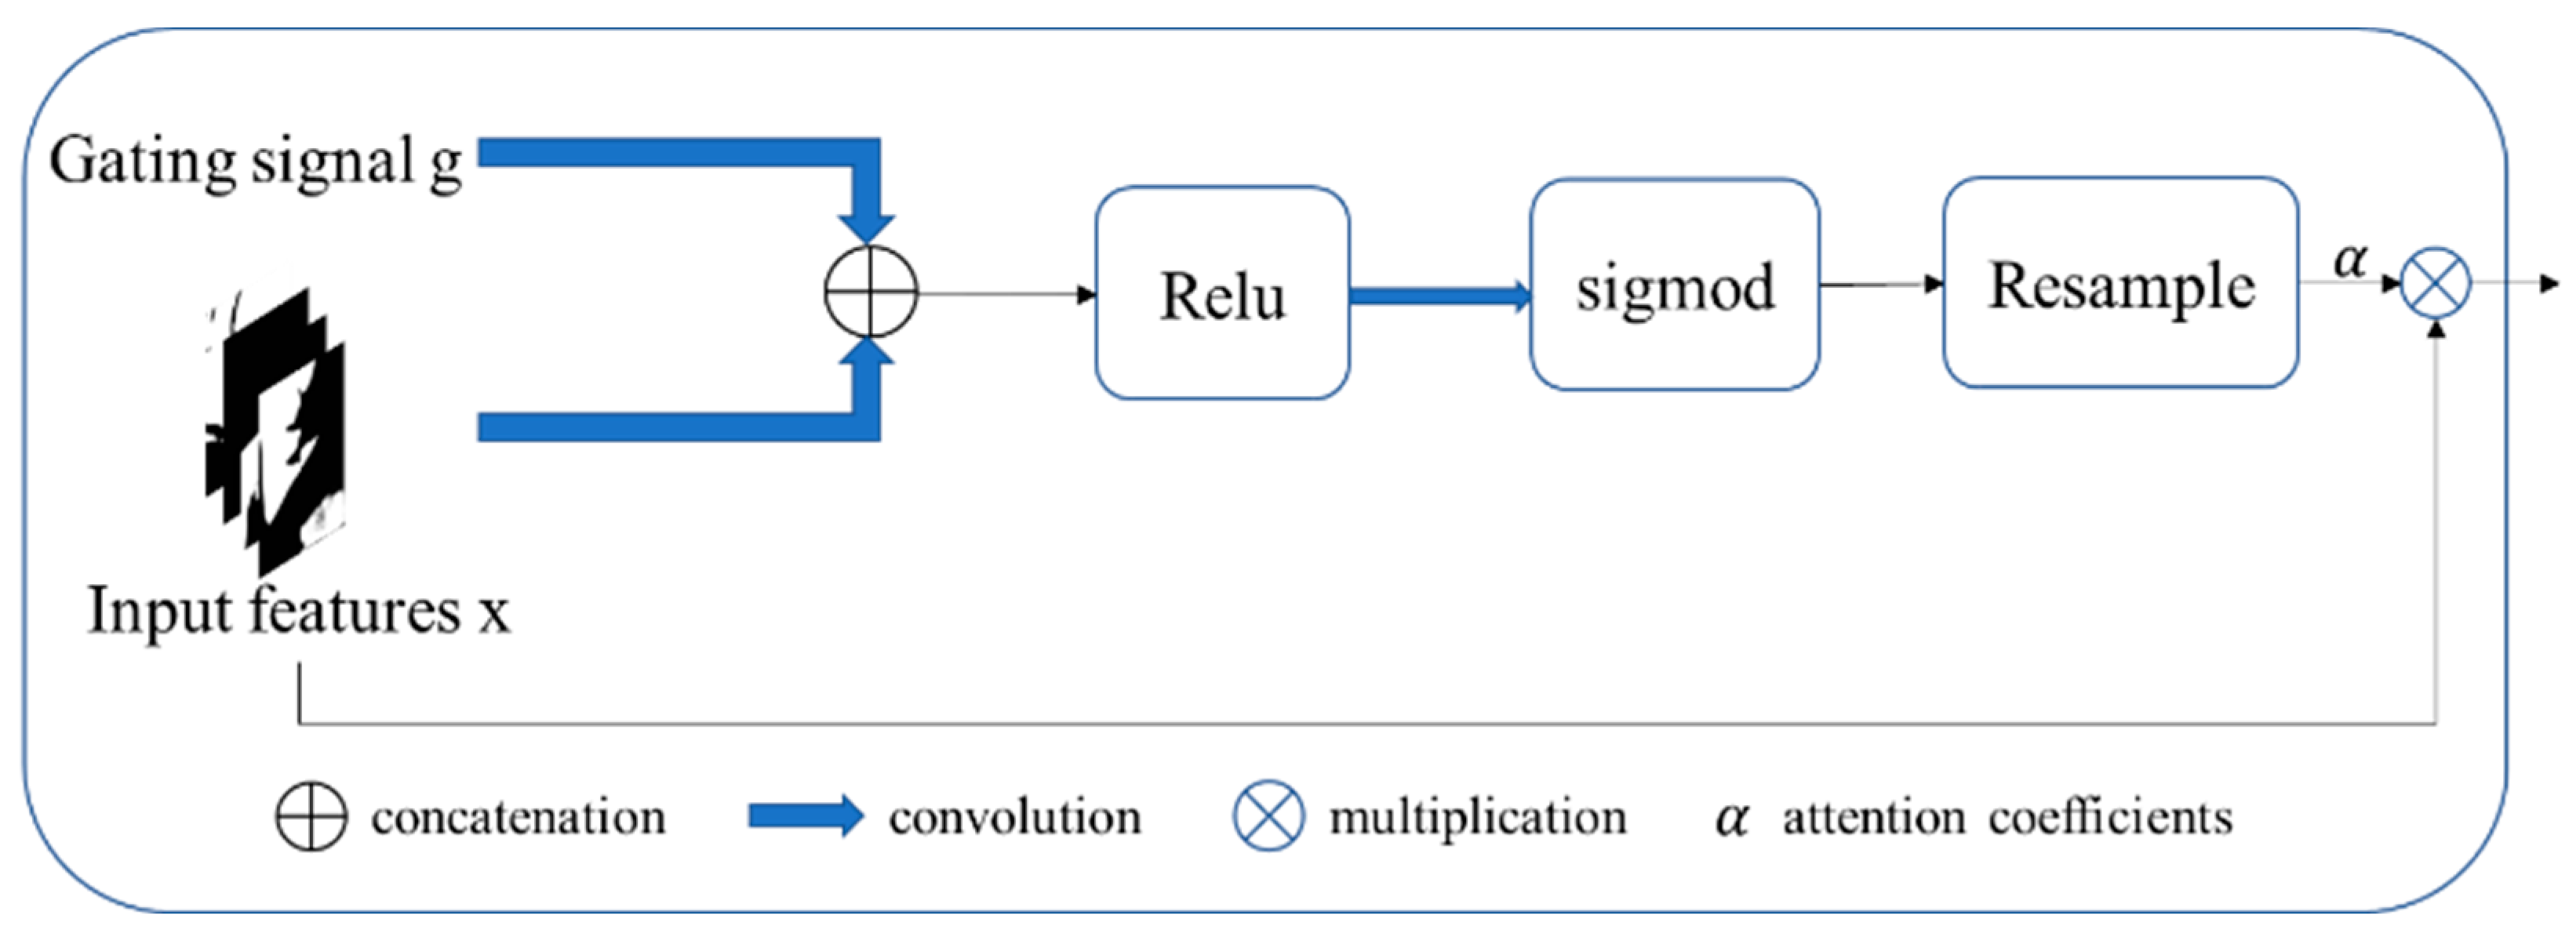
2.3.1. Structure of the Attention U2-Net
2.3.2. Model Performance Evaluation Method
2.3.3. Configuration of the Attention U2-Net
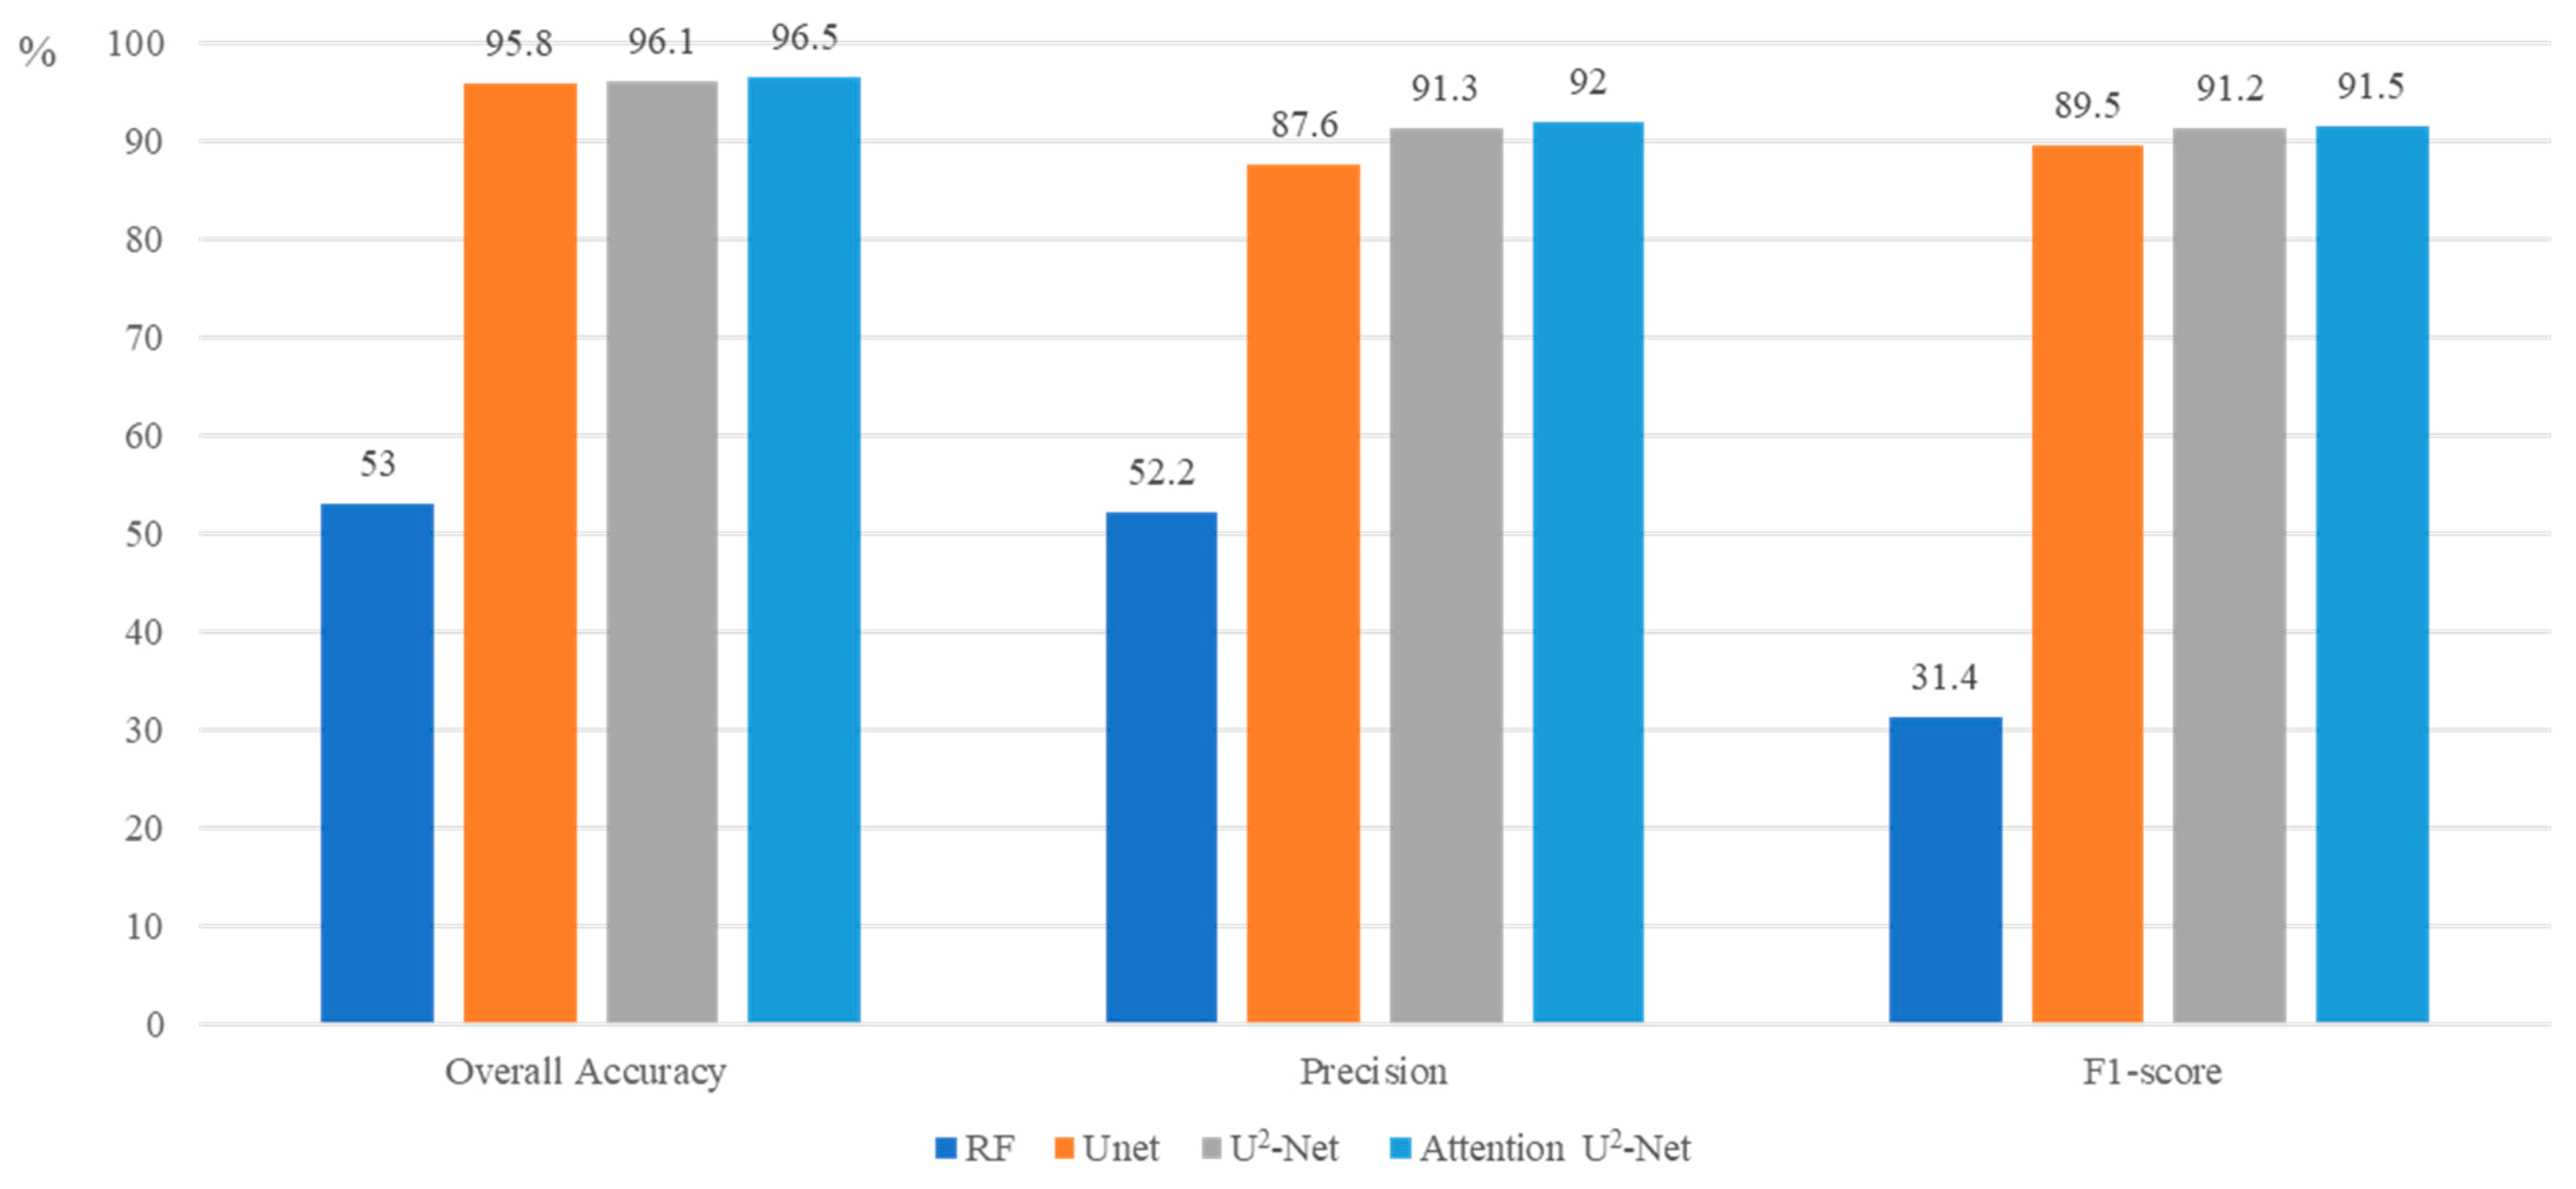
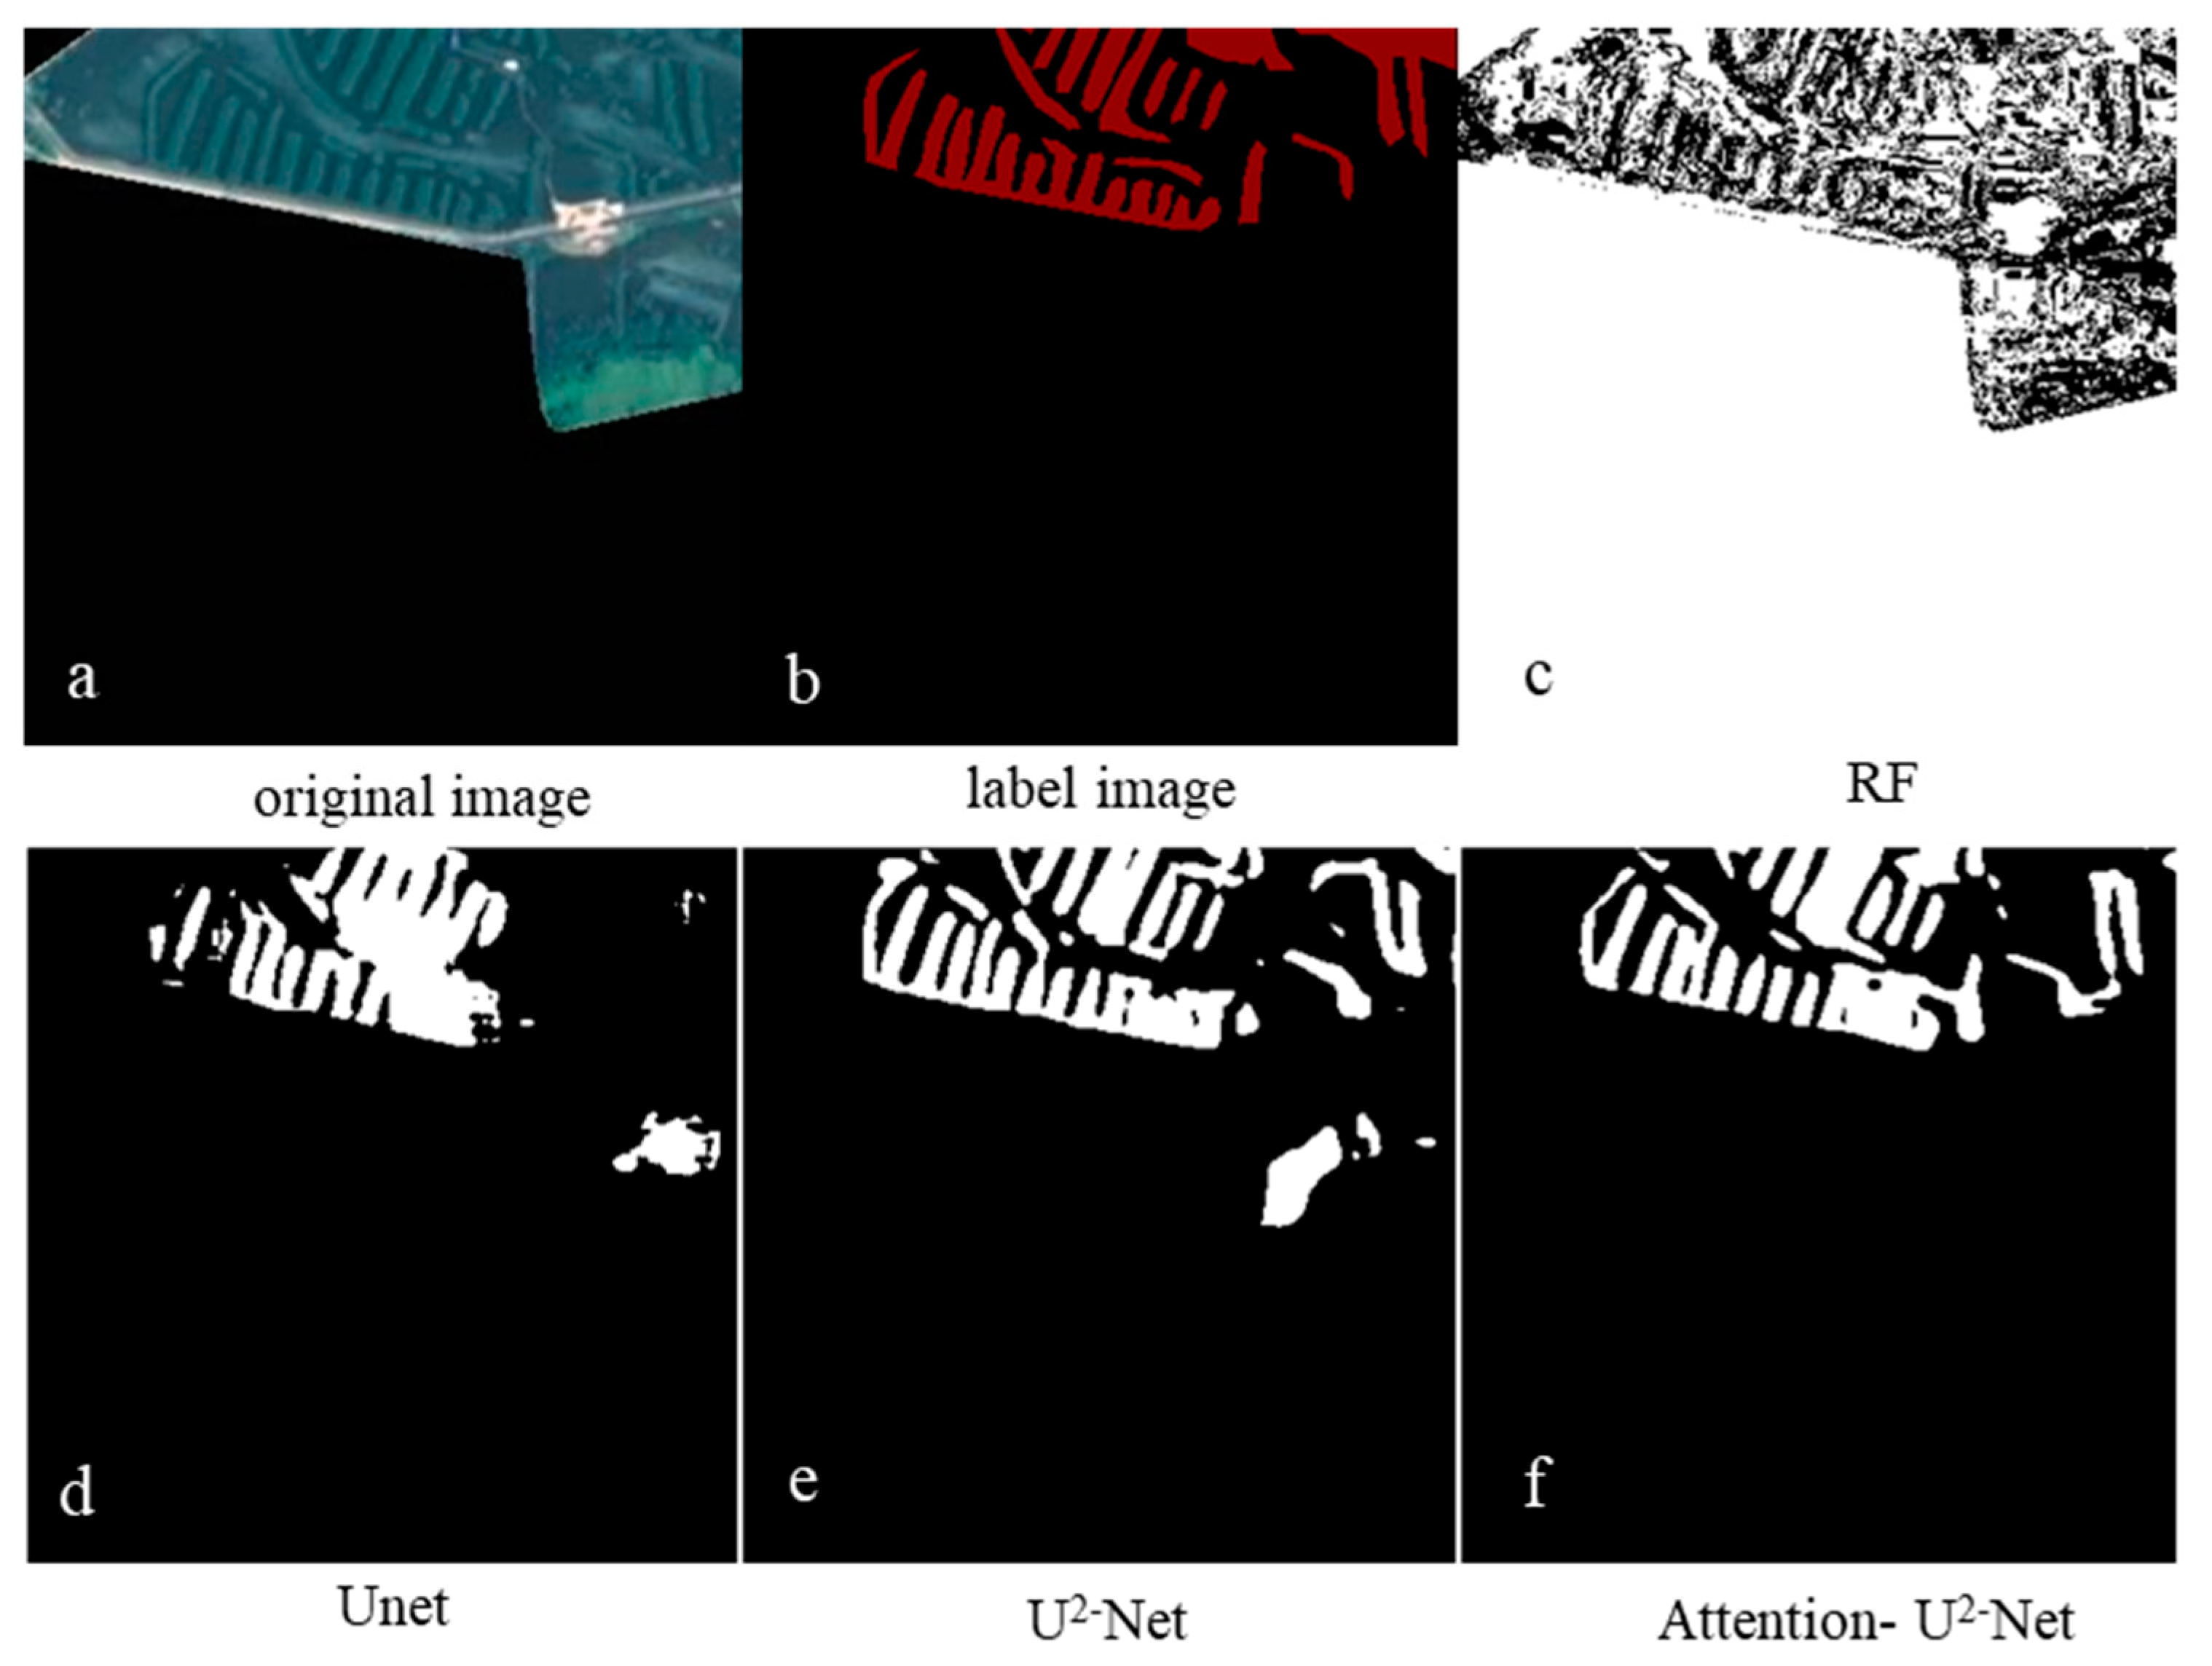
3. Results: Performance of the Attention U2-Net Model
4. Discussion
4.1. Advantages and Limitations of the Attention U2-Net Model
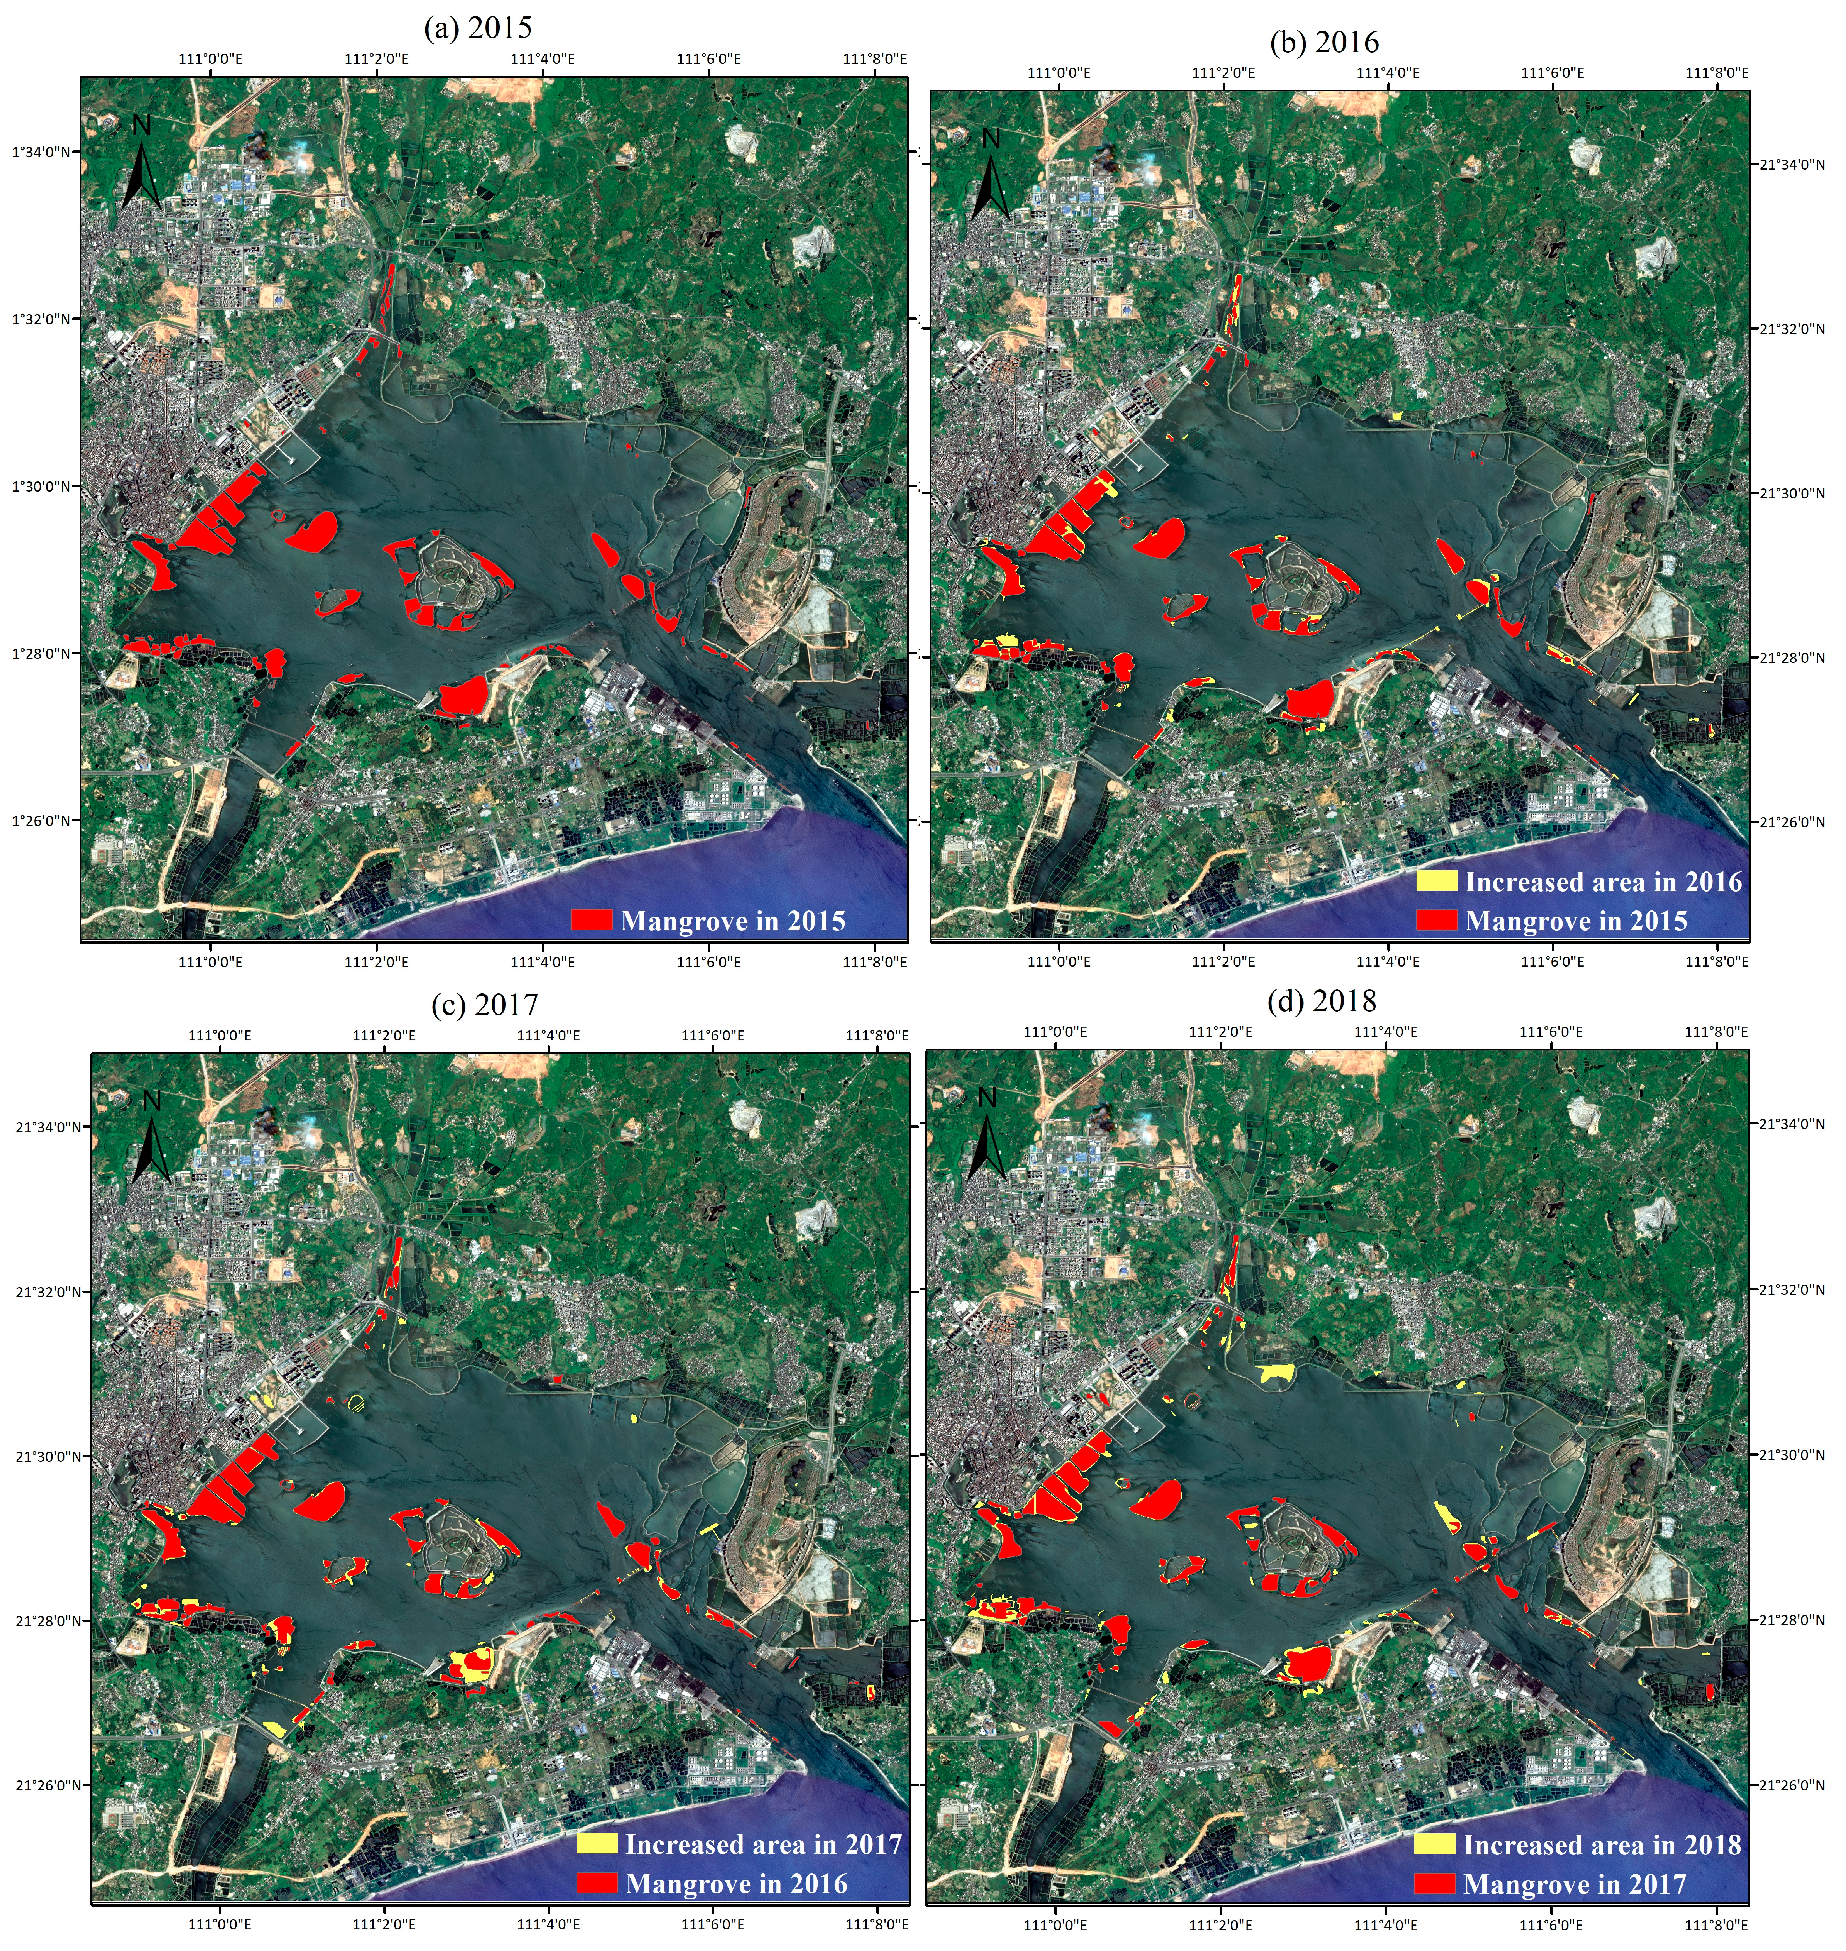
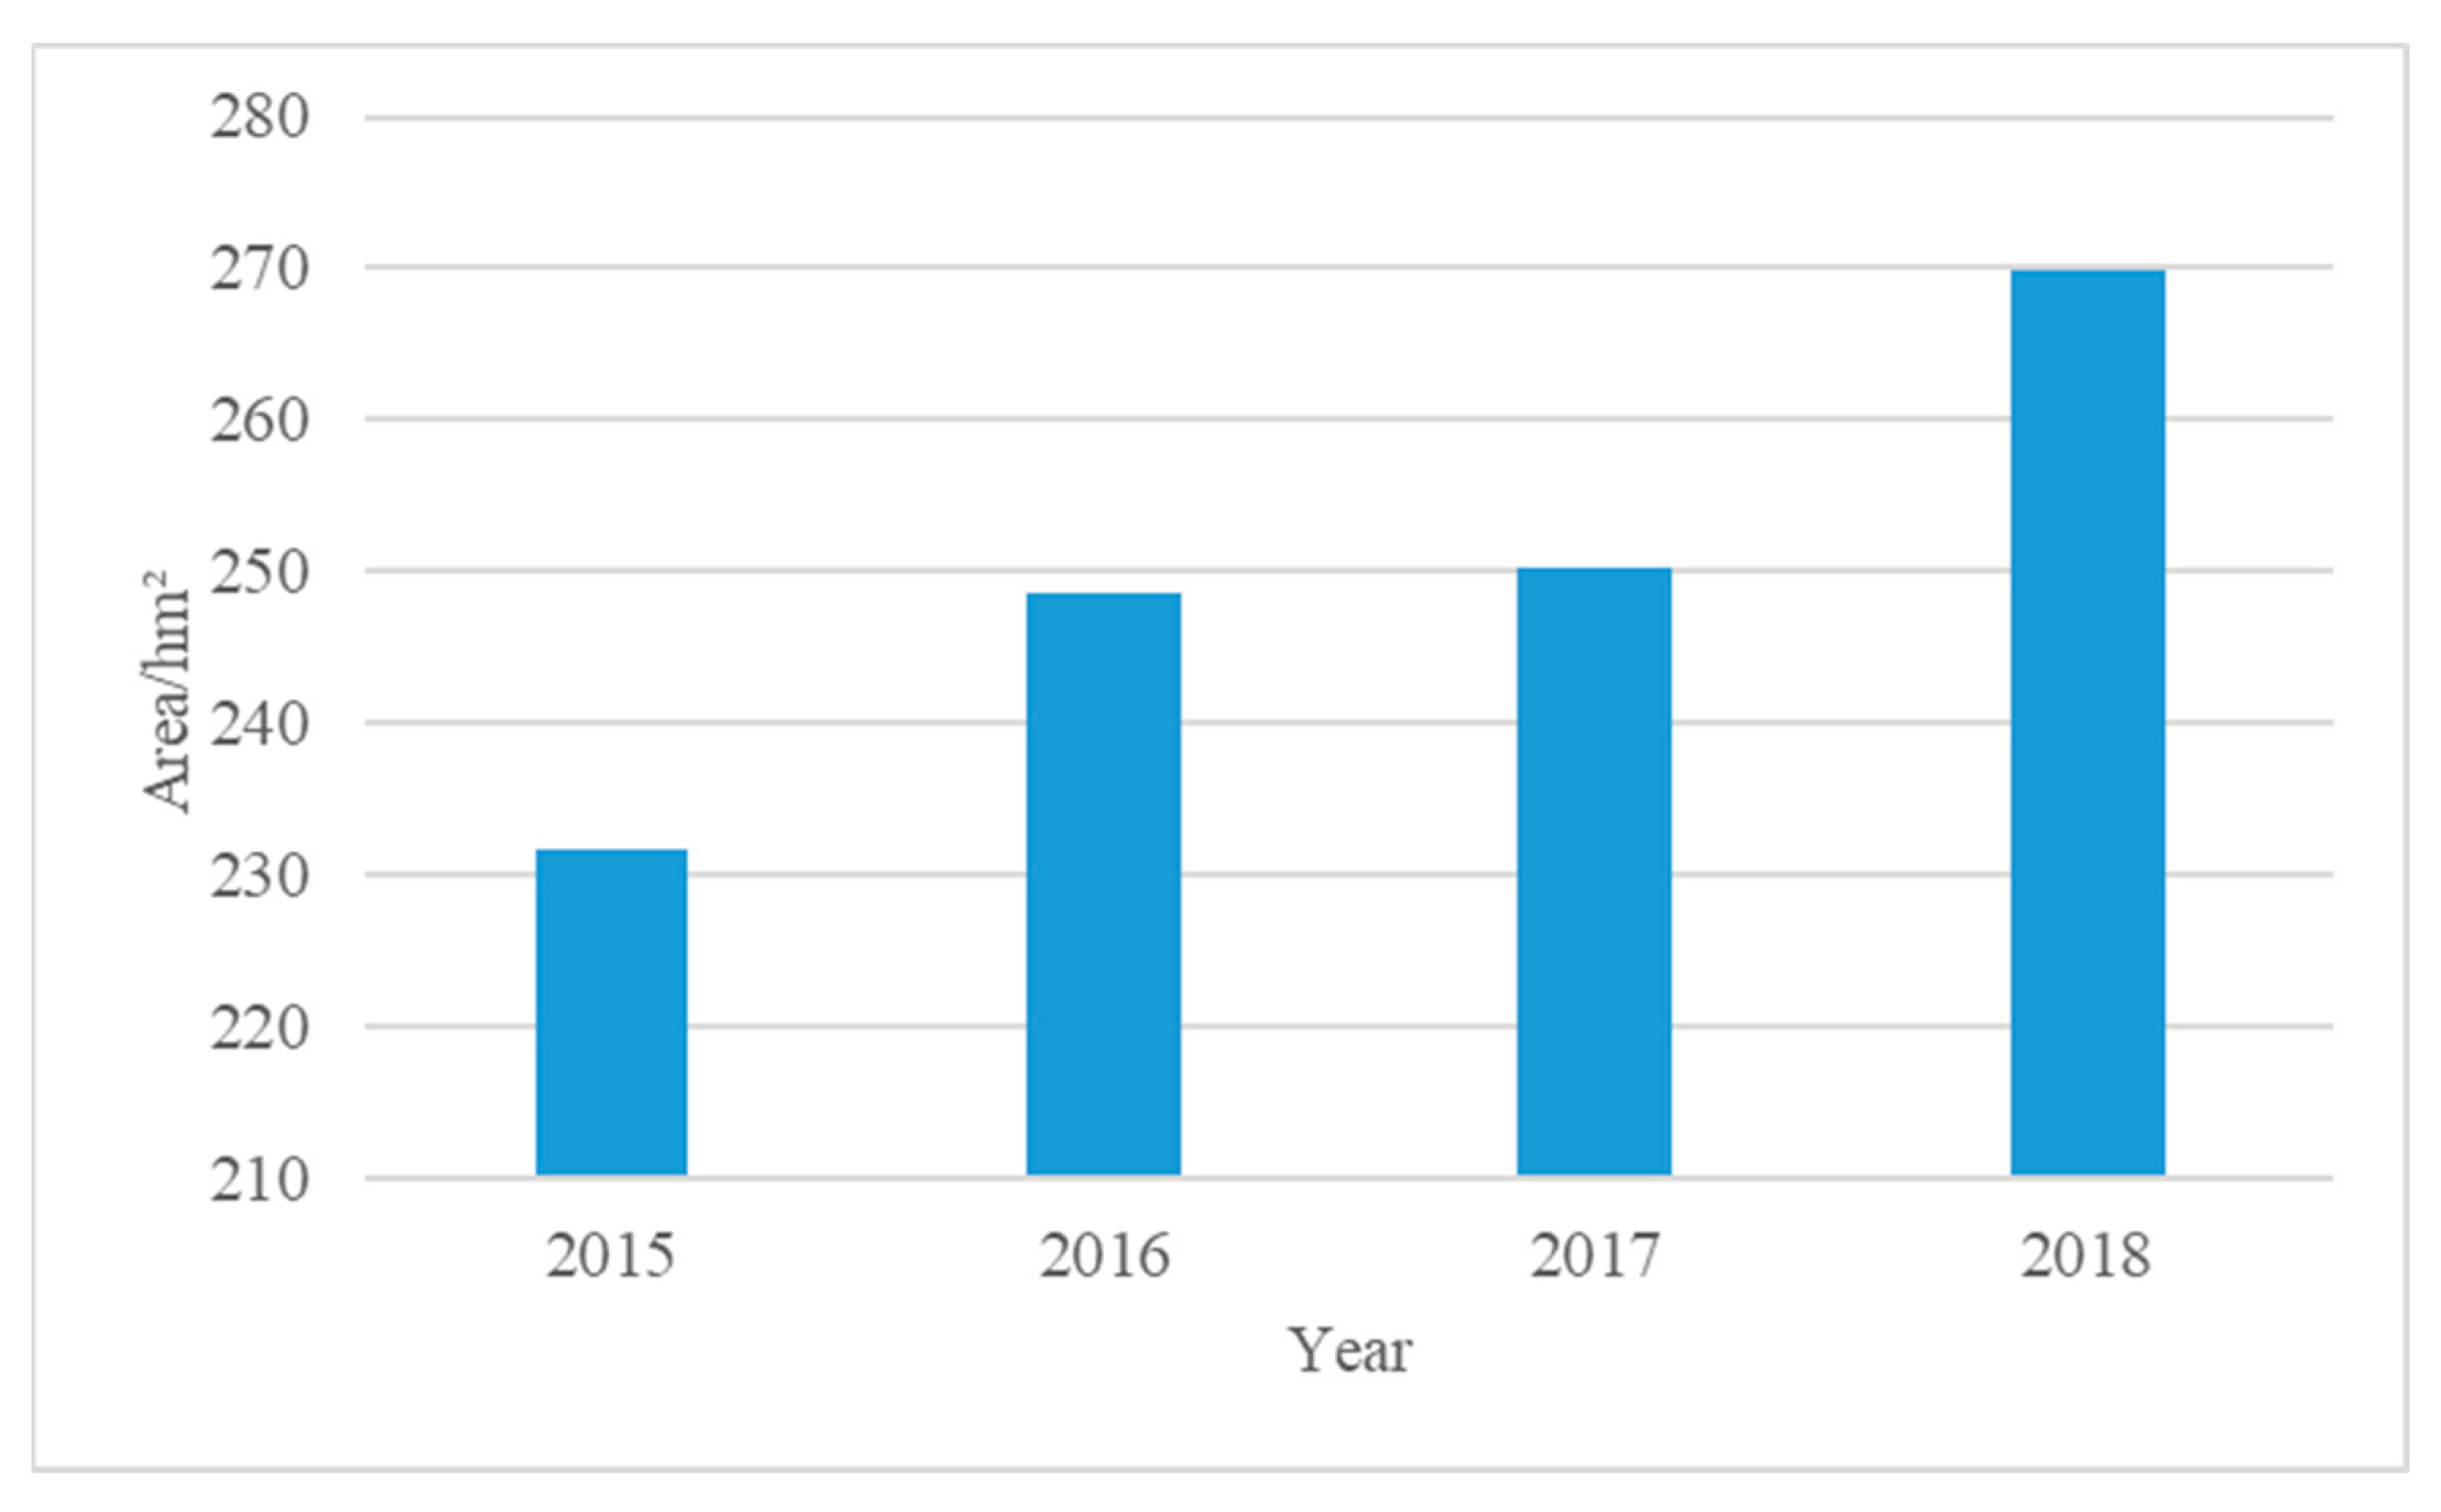
4.2. Spatiotemporal Evolution of Mangroves in Shuidong Bay—A Case Study
5. Conclusions
Author Contributions
Funding
Informed Consent Statement
Data Availability Statement
Acknowledgments
Conflicts of Interest
References
- Yang, G.; Huang, K.; Sun, W.; Meng, X.; Mao, D.; Ge, Y. Enhanced mangrove vegetation index based on hyperspectral images for mapping mangrove. ISPRS J. Photogramm. Remote Sens. 2022, 189, 236–254. [Google Scholar] [CrossRef]
- Jia, M.; Wang, Z.; Zhang, Y.; Mao, D.; Wang, C. Monitoring loss and recovery of mangrove forests during 42 years: The achievements of mangrove conservation in China. Int. J. Appl. Earth Obs. Geoinf. 2018, 73, 535–545. [Google Scholar] [CrossRef]
- Hu, T.; Zhang, Y.; Su, Y.; Zheng, Y.; Lin, G.; Guo, Q. Mapping the global mangrove forest aboveground biomass using multisource remote sensing data. Remote Sens. 2020, 12, 1690. [Google Scholar] [CrossRef]
- Aschbacher, J.; Ofren, R.; Delsol, J.P.; Suselo, T.B.; Vibulsresth, S.; Charrupat, T. An integrated comparative approach to mangrove vegetation mapping using advanced remote sensing and GIS technologies: Preliminary results. Hydrobiologia 1995, 295, 285–294. [Google Scholar] [CrossRef]
- Thakur, S.; Mondal, I.; Ghosh, P.; Das, P.; De, T. A review of the application of multispectral remote sensing in the study of mangrove ecosystems with special emphasis on image processing techniques. Spat. Inf. Res. 2020, 28, 39–51. [Google Scholar] [CrossRef]
- Kanniah, K.D.; Wai, N.S.; Shin, A.; Rasib, A.W. Per-pixel and sub-pixel classifications of high-resolution satellite data for mangrove species mapping. Appl. GIS 2007, 3, 1–22. [Google Scholar]
- Wang, D.; Wan, B.; Qiu, P.; Su, Y.; Guo, Q.; Wu, X. Artificial mangrove species mapping using pléiades-1: An evaluation of pixel-based and object-based classifications with selected machine learning algorithms. Remote Sens. 2018, 10, 294. [Google Scholar] [CrossRef] [Green Version]
- Pham, T.D.; Bui, D.T.; Yoshino, K.; Le, N.N. Optimized rule-based logistic model tree algorithm for mapping mangrove species using ALOS PALSAR imagery and GIS in the tropical region. Environ. Earth Sci. 2018, 77, 159. [Google Scholar] [CrossRef]
- Kamal, M.; Jamaluddin, I.; Parela, A.; Farda, N.M. Comparison of Google Earth Engine (GEE)-based machine learning classifiers for mangrove mapping. In Proceedings of the 40th Asian Conference Remote Sensing, ACRS, Daejeon, Republic of Korea, 14–18 October 2019; pp. 1–8. [Google Scholar]
- Nagarajan, P.; Rajendran, L.; Pillai, N.D.; Lakshmanan, G. Comparison of machine learning algorithms for mangrove species identification in Malad creek, Mumbai using WorldView-2 and Google Earth images. J. Coast. Conserv. 2022, 26, 44. [Google Scholar] [CrossRef]
- Zhang, S.; Xu, Q.; Wang, H.; Kang, Y.; Li, X. Automatic waterline extraction and topographic mapping of tidal flats from SAR images based on deep learning. Geophys. Res. Lett. 2022, 49, e2021GL096007. [Google Scholar] [CrossRef]
- Liu, B.; Li, X.; Zheng, G. Coastal inundation mapping from bitemporal and dual-polarization SAR imagery based on deep convolutional neural networks. J. Geophys. Res. Ocean. 2019, 124, 9101–9113. [Google Scholar] [CrossRef]
- Xie, H.; Xu, Q.; Cheng, Y.; Yin, X.; Jia, Y. Reconstruction of subsurface temperature field in the south China Sea from satellite observations based on an attention U-net model. IEEE Trans. Geosci. Remote Sens. 2022, 60, 4209319. [Google Scholar] [CrossRef]
- Iovan, C.; Kulbicki, M.; Mermet, E. Deep convolutional neural network for mangrove mapping. In Proceedings of the IGARSS 2020—2020 IEEE International Geoscience and Remote Sensing Symposium, Waikoloa, HI, USA, 26 September–2 October 2020; pp. 1969–1972. [Google Scholar]
- Huang, Y.Q.; Liu, Q.; Zhao, J.H.; Huang, W.S.; Sun, Z.X.; Qiao, X. Research on mangrove drone monitoring based on convolutional neural network. China Agric. Mach. Chem. News 2020, 41, 141–146, 189. [Google Scholar]
- Guo, Y.; Liao, J.; Shen, G. Mapping large-scale mangroves along the maritime silk road from 1990 to 2015 using a novel deep learning model and landsat data. Remote Sens. 2021, 13, 245. [Google Scholar] [CrossRef]
- Hu, L.; Xu, N.; Liang, J.; Li, Z.; Chen, L.; Zhao, F. Advancing the mapping of mangrove forests at national-scale using Sentinel-1 and Sentinel-2 time-series data with Google Earth Engine: A case study in China. Remote Sens. 2020, 12, 3120. [Google Scholar] [CrossRef]
- Zhang, Y.; Xiao, F.; Mei, H.; Li, Y.; Liu, C.; Qiu, X. Comprehensive analysis of climate-related comfort in southern China: Climatology, trend, and interannual variations. Urban Clim. 2022, 46, 101349. [Google Scholar] [CrossRef]
- PIE-Ortho Software. Available online: http://www.piesat.cn/website/cn/pages/product/software/pie-ortho.html (accessed on 14 March 2020).
- Cooley, T.; Anderson, G.P.; Felde, G.W.; Hoke, M.L.; Ratkowski, A.J.; Chetwynd, J.H.; Gardner, J.A.; Adler-Golden, S.M.; Matthew, M.W.; Berk, A. FLAASH, a MODTRAN4-based atmospheric correction algorithm, its application and validation. In Proceedings of the IEEE International Geoscience and Remote Sensing Symposium, Toronto, ON, Canada, 24–28 June 2002; pp. 1414–1418. [Google Scholar]
- Zhang, Y. System and Method for Image Fusion. U.S. Patent No. 7340099, 4 March 2008. [Google Scholar]
- Qin, X.; Zhang, Z.; Huang, C.; Dehghan, M.; Zaiane, O.R.; Jagersand, M. U2-Net: Going deeper with nested U-structure for salient object detection. Pattern Recognit. 2020, 106, 107404. [Google Scholar] [CrossRef]
- Oktay, O.; Schlemper, J.; Folgoc, L.L.; Lee, M.; Heinrich, M.; Misawa, K.; Mori, K.; McDonagh, S.; Hammerla, N.Y.; Kainz, B. Attention u-net: Learning where to look for the pancreas. arXiv 2018, arXiv:1804.03999. [Google Scholar]
- Smith, L.N. Cyclical learning rates for training neural networks. In Proceedings of the 2017 IEEE Winter Conference on Applications of Computer Vision (WACV), Santa Rosa, CA, USA, 24–31 March 2017; pp. 464–472. [Google Scholar]
- Wang, L.; Silván-Cárdenas, J.L.; Sousa, W.P. Neural network classification of mangrove species from multi-seasonal Ikonos imagery. Photogramm. Eng. Remote Sens. 2008, 74, 921–927. [Google Scholar] [CrossRef] [Green Version]
- Khan, A.R.; Khan, A.; Masud, S.; Rahman, R.M. Analyzing the Land Cover Change and Degradation in Sundarbans Mangrove Forest Using Machine Learning and Remote Sensing Technique. In Proceedings of the Advances in Computational Intelligence: 16th International Work-Conference on Artificial Neural Networks, IWANN 2021, Virtual Event, 16–18 June 2021; Proceedings, Part II 16, 2021. pp. 429–438. [Google Scholar]
- Hao, C.; Sang, H.Y.; Zhai, L.; Zhu, H. A mangrove extraction method combined with sem-dense connections by convolutional neural network. Sci. Surv. Mapp. 2022, 47, 146–152. [Google Scholar]
- De Souza Moreno, G.M.; de Carvalho Júnior, O.A.; de Carvalho, O.L.F.; Andrade, T.C. Deep semantic segmentation of mangroves in Brazil combining spatial, temporal, and polarization data from Sentinel-1 time series. Ocean Coast. Manag. 2023, 231, 106381. [Google Scholar] [CrossRef]


| Satellite-Sensor | Date (MM/DD/YY) | Area | Spatial Resolution | Image Size |
|---|---|---|---|---|
| GF1-PMS1 | 09/20/2018 | Maoming | Multi Spectral Scanner (MSS): 8 m Panchromatic (PAN): 2 m | 36 km × 36 km |
| 05/16/2019 | ||||
| 11/25/2019 | ||||
| 10/20/2015 | Taishan | |||
| 01/13/2018 | ||||
| GF1-PMS2 | 09/30/2014 | Zhanjiang | MSS: 8 m PAN: 2 m | 36 km × 36 km |
| 10/02/2014 | ||||
| 03/20/2018 | ||||
| 06/03/2014 | Maoming | |||
| 09/26/2014 | ||||
| 06/07/2015 | ||||
| 01/01/2017 | ||||
| 10/26/2020 | ||||
| 01/25/2017 | Taishan | |||
| GF2-PMS1 | 03/22/2018 | Maoming | MSS: 4 m PAN: 0.8 m | 28 km × 28 km |
| 01/02/2018 | Taishan | |||
| 12/02/2016 | ||||
| 12/08/2016 | ||||
| GF2-PMS2 | 01/22/2017 | Zhanjiang | MSS: 4 m PAN: 0.8 m | 28 km × 28 km |
| 03/15/2020 | ||||
| 11/08/2019 | Maoming | |||
| 11/30/2015 | Taishan | |||
| 07/21/2020 | ||||
| GF6-PMS | 02/21/2020 | Zhanjiang | MSS: 8 m PAN: 2 m | 96 km × 96 km |
| 12/01/2019 | Taishan | |||
| ZY3-TMS | 03/02/2017 | Zhanjiang | 2.5 m | 52 km × 52 km |
| 01/10/2015 | Maoming | |||
| 10/19/2017 | ||||
| 10/24/2017 | ||||
| 01/22/2017 | Taishan |
| Confusion Matrix | Prediction | ||
|---|---|---|---|
| Positive (Mangrove) | Negative (Background) | ||
| Actual | Positive (Mangrove) | TP | FN |
| Negative (Background) | FP | TN | |
| Literature | Study Area | Satellite/Spatial Resolution | Method | Precision |
|---|---|---|---|---|
| Iovan et al. [14] | South Pacific Ocean | WorldView 2/0.5 m and Sentinel-2/20 m | A small-patched convolutional neural network | Detection rates are 87.94% with a false positive rate of 1.00% |
| Wang et al. [25] | Caribbean coast of Panama | Ikonos/0.58 m | Back propagation neural network (BPNN) | 88.8% |
| Clustering-based neural network classifier (CBNN) | 81.6% | |||
| Maximum likelihood classification (MLC) | 86.6% | |||
| Khan et al. [26] | Sundarbans | Landsat 5 TM, Landsat 7 ETM, and Landsat 8 OLI/30 m | MLC | 62% in 2011 69% in 2021 |
| Hao et al. [27] | Zhanjiang | Sentinel-2/10 m | Sem-dense connections by convolutional neural network | 90.96% |
| de Souza Moreno et al. [28] | Cananéia-Iguape | Sentinel-1/5 m | U-Net with the Efficient-net-B7 backbone | 85.77% |
| Our model | Zhanjiang, Taishan, and Maoming | GF-1, GF-6, ZY-3/2 m; GF-2/0.8 m | Attention U2-Net | 92.0% |
Disclaimer/Publisher’s Note: The statements, opinions and data contained in all publications are solely those of the individual author(s) and contributor(s) and not of MDPI and/or the editor(s). MDPI and/or the editor(s) disclaim responsibility for any injury to people or property resulting from any ideas, methods, instructions or products referred to in the content. |
© 2023 by the authors. Licensee MDPI, Basel, Switzerland. This article is an open access article distributed under the terms and conditions of the Creative Commons Attribution (CC BY) license (https://creativecommons.org/licenses/by/4.0/).
Share and Cite
Wei, Y.; Cheng, Y.; Yin, X.; Xu, Q.; Ke, J.; Li, X. Deep Learning-Based Classification of High-Resolution Satellite Images for Mangrove Mapping. Appl. Sci. 2023, 13, 8526. https://doi.org/10.3390/app13148526
Wei Y, Cheng Y, Yin X, Xu Q, Ke J, Li X. Deep Learning-Based Classification of High-Resolution Satellite Images for Mangrove Mapping. Applied Sciences. 2023; 13(14):8526. https://doi.org/10.3390/app13148526
Chicago/Turabian StyleWei, Yidi, Yongcun Cheng, Xiaobin Yin, Qing Xu, Jiangchen Ke, and Xueding Li. 2023. "Deep Learning-Based Classification of High-Resolution Satellite Images for Mangrove Mapping" Applied Sciences 13, no. 14: 8526. https://doi.org/10.3390/app13148526